 Wei-Yao Chin
94% of researchers rate our articles as excellent or good
Learn more about the work of our research integrity team to safeguard the quality of each article we publish.
Find out more
ORIGINAL RESEARCH article
Front. Immunol. , 15 March 2021
Sec. Inflammation
Volume 12 - 2021 | https://doi.org/10.3389/fimmu.2021.630318
Macrophages comprise the front line of defense against various pathogens. Classically activated macrophages (M1), induced by IFN-γ and LPS, highly express inflammatory cytokines and contribute to inflammatory processes. By contrast, alternatively activated macrophages (M2) are induced by IL-4 and IL-13, produce IL-10, and display anti-inflammatory activity. Adenylate kinase 4 (Ak4), an enzyme that transfers phosphate group among ATP/GTP, AMP, and ADP, is a key modulator of ATP and maintains the homeostasis of cellular nucleotides which is essential for cell functions. However, its role in regulating the function of macrophages is not fully understood. Here we report that Ak4 expression is induced in M1 but not M2 macrophages. Suppressing the expression of Ak4 in M1 macrophages with shRNA or siRNA enhances ATP production and decreases ROS production, bactericidal ability and glycolysis in M1 cells. Moreover, Ak4 regulates the expression of inflammation genes, including Il1b, Il6, Tnfa, Nos2, Nox2, and Hif1a, in M1 macrophages. We further demonstrate that Ak4 inhibits the activation of AMPK and forms a positive feedback loop with Hif1α to promote the expression of inflammation-related genes in M1 cells. Furthermore, RNA-seq analysis demonstrates that Ak4 also regulates other biological processes in addition to the expression of inflammation-related genes in M1 cells. Interestingly, Ak4 does not regulate M1/M2 polarization. Taken together, our study uncovers a potential mechanism linking energy consumption and inflammation in macrophages.
Macrophages comprise the front line of defense against pathogens (1). Two major functional subsets of macrophages have been identified (2, 3). Classically activated macrophages (M1) are induced by lipopolysaccharide (LPS)/interferon gamma (IFN-γ). They express high levels of inflammatory cytokines, such as interleukin-1β (IL-1β) (4), IL-6 (5), IL-12 (6), and tumor necrosis factor α (TNFα) (7) as well as nitric oxide synthase (iNOS) (8) that is responsible for nitric oxide (NO) production (9) and eradication of pathogens. By contrast, alternatively activated macrophages (M2) are induced by IL-4/IL-13. They produce cytokine IL-10 (10), and are crucial for anti-inflammatory responses, tissue repair and maintenance (11). Thus, macrophages can play both protective and pathogenic roles in many human diseases (12, 13).
Nine adenylate kinases (Ak1-9) with different organ distribution, subcellular localization and substrate specificity have been identified. Ak4 is located in the matrix of mitochondria. It is expressed mainly in mouse brain, heart, liver, stomach, kidney and ovary (14, 15). Ak4, encoded by gene Ak4, is a member of the adenylate kinase family. It is responsible for maintaining cellular nucleotide homeostasis by catalyzing the transfer of one phosphate group from one ATP or GTP to one AMP, resulting into two ADP or one ADP and one GDP (16, 17). Ak4 acts as a key regulator of ATP from different nutrient sources (18). Moreover, Ak4 plays a role in regulating the signaling of AMP-activated protein kinase (AMPK), a metabolic sensor that is activated through phosphorylation at Thr172 of its α-subunit by LKB1, TAK1, and Calcium/calmodulin-dependent protein kinase kinase II (CAMKK2). Phosphorylated AMPK can enhance mitochondria biogenesis to provoke ATP generation (18, 19).
A previous study has shown that Ak4 is involved in hypoxia tolerance. Its expression is enhanced under hypoxic conditions which induce hypoxia inducing factor 1α (Hif1α) (20). Furthermore, Ak4 is involved in resistance to anti-tumor drugs via regulating mitochondrial activity (19), and is a marker for metastasis and poor clinical outcome in lung cancer (21, 22).
Hif1α, encoded by the Hif1a gene, is a member of the basic helix-loop-helix PAS superfamily (23, 24). Hif1α protein comprises four functional regions, basic helix-loop-helix domain, PAS domain, stability determining domain, and trans-activating domain (25). Hif1α plays a crucial role for cellular and developmental response to low oxygen concentration (hypoxia) (26, 27). Moreover, Hif1α is involved in tumor growth, survival and metastasis (28–30). Metabolic state of an M1-polarized macrophage favors glycolysis (31). As a metabolic regulator of glycolysis in macrophages, Hif1α induces M1 polarization and activation that promotes inflammatory gene expression, bacterial killing and cell migration (32, 33). Here, we demonstrate that Ak4 is highly expressed in M1 subset compared to M0 and M2 subsets. It not only maintains ATP homeostasis, ROS production and glycolysis but also has a broad impact on the transcriptome of M1 cells. More importantly, it promotes the expression of inflammation genes through a positive feedback loop formed with Hif1α and down-regulates AMPK phosphorylation. Moreover, we show that Ak4 does not regulate M1/M2 polarization. Our work reveals a novel association between metabolism and inflammation.
The 6–8-week-old female C57BL/6 mice were purchased from National Laboratory Animal Center. All animals were housed in Laboratory Animal Center of National Taiwan University College of Medicine under specific pathogen-free (SPF) condition. Water and food were provided sufficiently daily, and all mice were sacrificed by CO2. This study was carried out in strict accordance with the recommendations in the Guide for the Care and Use of Laboratory Animals of the National Institutes of Health (NIH). The protocol was approved by the Institutional Animal Care and Use Committee of National Taiwan University College of Medicine (Permit Number: 20190119).
Bone marrow cells were isolated from femur and tibia bones of mice with incomplete DMEM (Dulbecco's modification of Eagle's medium, Gibco, Darmstadt, Germany) by using 23G needles, and centrifuged at 4°C with 800 × g for 5 min. Red blood cells (RBC) were lysed by 900 μL RBC lysis buffer (10 mM Tris-HCl and 0.83% NH4Cl in ddH2O, pH 7.2) for 3 min on ice, and 100 μL 10X Dulbecco's phosphate-buffered saline (DPBS, Gibco) was added to cells. Cells were then centrifuged at 4°C with 800 × g for 5 min, and re-suspended with complete DMEM containing 10% fetal bovine serum (FBS, Corning, New York, United States), 1X penicillin/streptomycin (HyClone), 1X L-Glutamine (HyClone), 1X NEAA (non-essential amino acid, HyClone), 1X sodium pyruvate (HyClone), and 5 μM 2-Mercaptoethanol (2-ME, Thermo, Massachusetts, U.S.). 5 × 10⁶ cells or 2 × 10⁶ were seeded in 10-cm2 petri dishes (α-Plus) or 6-well plates, respectively, at 37°C in 5% CO2 incubator for 7 days. Cells were cultured in 20% L929 cell supernatant in complete DMEM. After culturing in 20% L929 cell supernatant for 7 days, bone marrow-derived macrophages (BMDMs) were collected by trypsinization and further seeded in 12-well and 24-well plates (Thermo) at a density of 1 × 10⁶/mL and 5 × 10⁵/mL per well for Western blot and real-time PCR (qPCR) analysis, respectively. For macrophages polarization, BMDMs were treated with LPS (1,000 ng/mL, O111:B4 E. coli) and IFN-γ (20 ng/mL, Peprotech, New Jersey, USA) or IL-4 (20 ng/mL, Peprotech) and IL-13 (20 ng/mL, Peprotech) for M1 and M2 polarization, respectively. To isolate peritoneal macrophages, C57BL/6 mice were injected with 1 mL of sterile 3.8% thioglycollate medium by intraperitoneal injection. On day 4, mice were euthanized and peritoneal cells were collected via peritoneal lavage with 5 ml sterile PBS. Cells were then spun down for 5 min at 800 × g, resuspended in complete RPMI and seeded 1 × 10⁶ cells/well in 12-well plate. After 24 h, the non-adherent cells were removed. Adherent cells were collected and stained with anti-CD11b and anti-F4/80 to confirm the macrophage population. M1/M2 polarization was defined by flow cytometry and qPCR. M1 dominant expression markers were CD86, Nos2 and Tnfa. M2 dominant expression markers were CD206, Arg1 and Egr2 (Supplementary Figure 1).
To stabilize Hif1α in M1 at normoxia condition (34), BMDMs were treated with 0.2 mM DMOG (Merck, Germany), a PHD inhibitor, and cell lysate was collected after DMOG treatment for 24 h. In some experiments, metformin and A-769662 (Merck), which enhance AMPK activation, were added to BMDMs to a final concentration of 10 and 20 μM, respectively, 30 min before LPS stimulation. On 24 h after treatment with metformin or A-769662, cell lysate was collected.
pcDNA3.1 which carried mouse Ak4 open reading frame (ORF) with flag tag (CloneID: OMu1602) was purchased from Genscript. Ak4 ORF with flag tag was amplified by PCR, and then purified by gel extraction kit (Geneaid, Taiwan, ROC). PCR product was constructed into pWPI lentiviral vector at SwaI site by Genbuilder cloning kit (Genscript, Piscataway Township, USA). The final construct was confirmed by DNA sequencing. The primer sequences are listed in Table 1.
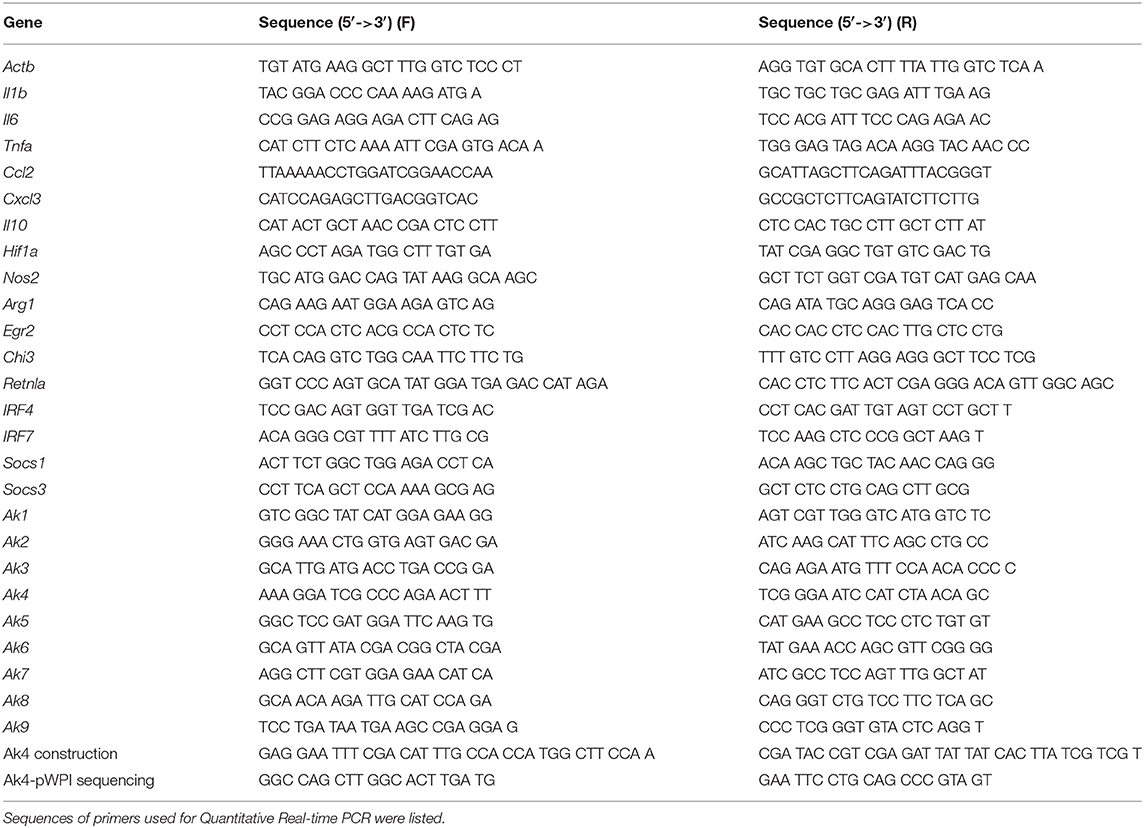
Table 1. The primer list.
Lentiviral constructs carry GFP and Ak4 (TRCN0000345103; 5′CTGTGATGTGGACCTAGTAA T3′) or Hif1α (TRCN0000232222; 5′TGGATAGCGATATGGTCAATG3′) shRNA were purchased from Academia Sinica, ROC. The plasmids amplifications were followed by Academia Sinica's protocol. Plasmids psPAX2, pMD2.G and target plasmid including pWPI lentiviral plasmid carry Ak4 were co-transfected into HEK293T cells with Lipofectamin 3000 (Invitrogen). The supernatant was condensed with 0.4 M NaCl and 8.5% PEG6000 at 4°C overnight (O/N). The viruses were spun down by 7,000 × g at 4°C for 20 min, re-suspended in dPBS containing 2%FBS and HBSS (Gibco), and stored in −80°C. Lentiviral transduction was conducted in serum free medium containing 20% L929 supernatant with 8 μg/ml polybrene at day 3 of BMDM culture (MOI = 30). The medium containing lentivirus and polybrene was replaced with complete medium containing 20% L929 supernatant at day 4. The infected BMDMs were polarized into M1 or M2 macrophages. GFP+ cells were sorted out for RNA-Sequencing, qPCR, ATP, and ADP/ATP assay after M1 polarization for 24 h.
BMDMs were collected after culture bone marrow cells in 20% L929 supernatant for 7 days. Cells were washed twice with PBS and rested in complete medium for 3 h. Ak4 siRNA or AMPKα1/2 siRNA in 50 nM was transfected into BMDMs with Lipofectamin 3000 (thermo) for 24 h before LPS/IFN-γ stimulation. To knockdown Ak4 in peritoneal macrophage, after removing the non-adherent cells, 50 nM Ak4 siRNA were transfected into peritoneal macrophages with Lipofectamin 3,000 for 24 h before LPS/IFN-γ stimulation.
For real-time analysis of oxygen consumption rate (OCR) and extracellular acidification rate (ECAR), 105 BMDMs were seeded in XF-96 cell culture plates, and stimulated with LPS/IFN-γ for 24 h. OCR and ECAR, which represent oxidative phosphorylation and glycolysis ability, respectively, were analyzed on XF-96 analyzer. For OCR analysis, 1 μM oligomycin, 2 μM fluoro-carbonyl cyanide phenylhydrazone (FCCP), and 100 nM rotenone plus 1 μM antimycin A (Rot/AA) were injected in sequence. For ECAR analysis, 60 mM glucose, 1 μM oligomycin, and 600 mM 2-deoxy-D-glucose (2-DG) were injected in sequence.
Total RNA was extracted from BMDMs using TRIzol reagent. RNA isolation kit, direct-zol RNA miniPrep (Zymo Research, Irvine, California, USA), was used according to the manufacturer's instruction. RNA was quantified with DS-II+ spectrophotometer (DeNoyix). The complementary DNA (cDNA) was generated using MMLV high performance reverse transcriptase (MMLV HP RT, Epicenter Biotechnologies, California, USA). Real-time PCR was performed on a PikoReal 96 Real-Time PCR System (Thermo Scientific) using SYBR green mixture (Bioline, London, UK). Relative expression of the target gene was normalized to Actb and calculated as 2–(Ct target–Ct β-actin). The Ct represents the threshold cycle for each target or reference gene determined by Thermo PikoReal Software 2.1. The relative target gene expression was calculated by using the 2−ΔΔCt method. Sequences of primers used for quantitative real-time PCR were listed (Table 1).
In brief, 5 × 10⁵ BMDMs were seeded on 24-well plate after 7-days culture. For measuring cytosol and mitochondria ROS, CellRox and MitoSox probes were used, respectively, as manufacturer's protocol (Thermo Scientific). In brief, BMDMs were treated with LPS (1,000 ng/mL) and IFN-γ (20 ng/mL) for M1 polarization. Twenty-four hours later, M1 cells were washed with PBS two times and stained with CellRox or MitoSox diluted in staining buffer at 37°C for 15 min before analyzed by flow cytometry. To sort GFP+ cells, propidium iodide (PI, Biolegend) staining was used to identify viable cells. Samples were analyzed on LSR Fortessa (BD Biosciences, Franklin Lakes, New Jersey, USA) or sorted on FACSAriaIII and data were analyzed using FlowJo software.
Cells were lysed with RIPA (25 mM Tris-HCl pH7.6, 150 mM NaCl, 1% NP-40, 1% sodium deoxycholate and 0.1% SDS) on ice for 30 min, and centrifuged at 4°C with 20,000 × g for 20 min for the supernatant. Total protein concentrations were measured with Protein Assay Dye (Thermo scientific). The samples were separated on 8 or 12% SDS-PAGE, and transferred to 0.22 μm PVDF membranes. The membranes were blocked with 5% skim milk, and probed with primary antibodies p-AMPK, AMPK (Cell signaling technology), iNOS, HIF1α, and Ak4 (GeneTex, Taiwan, ROC) at 4°C shaking O/N. The membranes were washed with TBST, and incubated in goat anti-rabbit secondary antibody with HRP conjugated (Abcam) for 1 h at room temperature. Membranes were soaked in enhanced chemiluminescent reagent (GE healthcare), exposed to film or iBright 1500 Western Blot Imaging Systems. The expression of protein was quantified by ImageJ or app in Thermo fisher website. α-Tubulin, β-Actin, or COX IV (Abcam) as an internal control was re-probed to PVDF membranes, after stripping.
Five hundred thousand BMDMs were seeded on 24-well plates the day prior to the experiment. E coli were added to BMDMs (MOI = 2 or 10) after the culture medium were changed to P/S-free DMEM. The plates were incubated at 37°C for 1 h. BMDMs were washed with PBS twice, changed to 100 μg/ml gentamicin-containing DMEM, and incubated at 37°C for 1 h. BMDMs were then lysed with 0.1% tritonX-100 and plated for phagocytosis assay. BMDMs were incubated at 37°C for another 4 h, then lysed with 0.1% tritonX-100 and plated for killing assay. Colony forming unit (CFU) was counted after 24 h incubation.
M1 cells were lysed with extraction buffer (1 M sucrose, 1 mM EGTA, 5 mM Tris-HCl pH 7.4). The process of Mitochondria extraction was performed following a published protocol (35). In brief, BMDMs (5 × 10⁷) were lysed with 3 ml extraction buffer (1 M sucrose, 1 mM EGTA, 5 mM Tris-HCl pH 7.4) on ice for 30 min. Cell lysate was centrifuged with 300 × g for 10 min. The supernatant was transferred into a new tube, and centrifuged with 7,000 × g for 10 min. The pellet was washed with 1 ml extraction buffer twice. Protein lysate (50 μg) was used for Western blot.
To measure IL-1β, IL-6, and TNF-α production, culture supernatants from BMDMs and peritoneal macrophages in 12-well plates were collected. Mouse IL-1β, IL-6, and TNF-α ELISA kit (Biolegend) was used following the manufacturer's instructions.
The amount of ATP and ADP/ATP were measured by ApoSENSOR Cell Viability Assay Kit and ApoSENSOR ADP/ATP Ratio Bioluminescent Assay Kit (BioVision, California, USA) following the manufacturer's instructions. In brief, to measure intracellular ATP, 5 × 10⁴ GFP+ M1 cells were lysed with 250 μl lysis buffer on ice for 5 min. ATP monitor enzyme and lysis buffer were pre-mixed and the background luminescence value was designated as A. Cell lysate (50 μl) was added to the pre-mixed well, then the luminescence reading was designated as B. ADP converting enzyme was added to the well, then the luminescence reading was designated as C. The value of intracellular ATP is (B-A). The value of intracellular ADP/ATP is (C-B)/(B-A). The tests were done in duplicates.
Total RNA was extracted from M1 cells and digested to 180 bp fragments after removing rRNAs with a Ribo-Zero Gold kit (Illumina, San Diego, USA). A sequencing library was created by reverse-transcription of RNA fragments to cDNA, and ligating specific adapters at both ends of these cDNA fragments. Next, the sequencing libraries were loaded to the surface of flow cells, and amplified into clonal clusters though bridge amplification. All of the clusters on the flow cell were sequenced by NextSeq 500 (Illumina). FastQC (v0.11.8) program (http://www.bioinformatics. babraham.ac.uk/projects/fastqc/) was used to examine the quality of sequencing reads, and HISAT2 (v2.1.0) was used to align sequencing reads to mouse genome references (GRCm38) (36). The output SAM files were normalized and quantified with R packages Rsubread (v 2.0.0) (37) and edgeR (v 3.28.0) (38) from Bioconductor. A robust normalization approach, the trimmed mean of M value (39), was applied and log2-transformation was used to obtain the final expression values. In the differential gene expression analyses, Student's t-test (P < 0.01) and 2-fold changes were used to identify differentially expressed (DE) genes between Ak4 shRNA knockdown samples and scramble samples. The functional and pathway analyses for DE genes were further analyzed by Ingenuity Pathway Analysis (QIAGEN Inc., https://www.qiagenbioinformatics.com/products/ingenuity-pathway-analysis). All of the data have been deposited in Gene Expression Omnibus (GEO, GSE143302).
Statistical analyses were performed with unpaired, two-tailed Student's t-test or one-way ANOVA for multiple comparisons. A value of P < 0.05 was considered statistically significant.
To examine the expression of Ak family members in functional subsets of macrophages, we differentiated total bone marrow cells into macrophages (bone marrow-derived macrophage, BMDM) in 20% L929 conditioned medium for 7 days in vitro. BMDMs were subsequently left unstimulated (M0) or activated with LPS+IFN-γ (M1) or IL-4+IL-13 (M2) for 24 h. The mRNA expression of Ak family members among M0, M1 and M2 were analyzed by qPCR. While the expressions of Ak5, Ak7, and Ak9 were too low to be detected, that of Ak6 was comparable among M0, M1, and M2. Interestingly, the levels of Ak1, Ak2, Ak3, and Ak8 were higher in M2 than M1 cells. Notably, Ak4 was expressed almost exclusively in M1 cells and it located in mitochondria (Figure 1A; Supplementary Figure 2). Consistently, we found that Ak4 protein level in M1 macrophages was about two to three folds of that of M0 and M2 macrophages (Figure 1B). Moreover, we found that Ak4 expression was mainly induced by LPS stimulation. LPS and IFN-γ co-treatment further enhanced Ak4 expression in BMDMs (Figure 1C). These results suggest that Ak4 plays an important role in M1 macrophages. Therefore, we focus our study on characterizing the role of Ak4 in M1 macrophages.
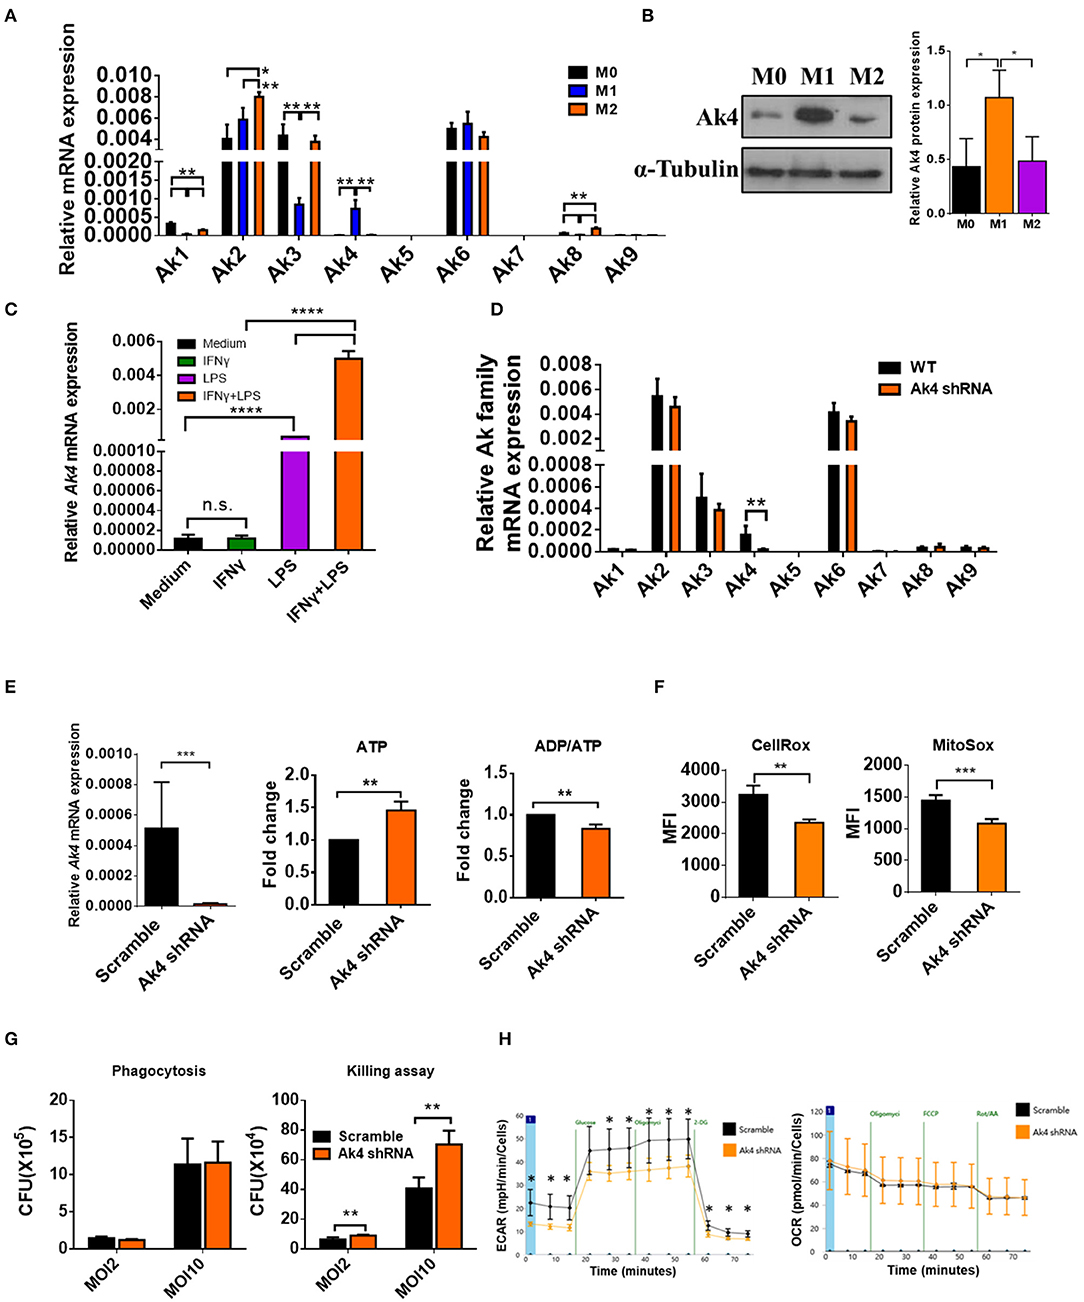
Figure 1. Ak4 is highly expressed in M1 macrophages and it maintains ATP homeostasis, ROS production, bactericidal ability, and glycolysis. BMDMs (M0) were treated with 1,000 ng/mL LPS and 20 ng/mL IFN-γ (for M1 polarization) or 20 ng/mL IL-4 and 20 ng/mL IL-13 (for M2 polarization) for 24 h. (A) Ak1-9 mRNA expressions were measured by qPCR (n = 3). The mRNA expressions were normalized against Actb. (B) Ak4 protein expressions were analyzed by Western blotting. Relative protein expressions were normalized against α-Tubulin (n = 3). (C) BMDMs were treated with IFN-γ, LPS, LPS+IFN-γ or medium only for 24 h. Ak4 mRNA expressions were measured by qPCR (n = 4). mRNA expressions were normalized against Actb. (D) Relative expressions of Ak1-9 mRNA in scramble shRNA- and Ak4 shRNA-treated M1 macrophages were analyzed by qPCR (n = 3). (E) Virus carrying scramble shRNA or Ak4 shRNA and GFP were transduced into BMDMs. After LPS/IFN-γ stimulation for 24 h, GFP+ M1 macrophages were sorted for expression of relative Ak4 mRNA, ATP level and ADP/ATP ratio. Relative Ak4 mRNA expressions were normalized against Actb, n = 3. ATP level and ADP/ATP ratio in scramble shRNA- and Ak4 shRNA-treated M1 cells were measured, n = 7. (F) CellRox and MitoSox were used to stain scramble shRNA- and Ak4 shRNA-treated M1 cells and cells were analyzed by flow cytometry (n = 3). (G) Scramble and Ak4 shRNA BMDMs were infected with E. coli with MOI 2 or 10. For phagocytosis and killing assay, cells were lysed with triton-X 100 and plated on LB agar plates. CFU was counted after culture for 24 h (n = 3). (H) ECAR and OCR were measured in Ak4 shRNA- and scramble shRNA-treated M1 cells by XF-96 analyzer (n = 3). *P < 0.05; **P < 0.01; ***P < 0.001; ****P < 0.0001 determined by one-way ANOVA (A–C) or unpaired, two-tailed Student's t-test (D–H) with mean ± SD.
To investigate the role of Ak4 in M1 macrophages, BMDMs were transduced with Ak4 shRNA or scramble lentivirus for 5 days followed by stimulation with LPS and IFN-γ for 24 h. Transduced cells were sorted for in vitro analysis. The transcript level of Ak4 was reduced by more than 80%, whereas the expression of other Aks was not affected by the Ak4 shRNA (Figure 1D). In addition, cellular ATP level was elevated and ADP/ATP ratio was reduced by Ak4 shRNA and Ak4 siRNA (Figure 1E; Supplementary Figure 3A). Moreover, cytosol and mitochondrial ROS production were decreased in Ak4 shRNA-treated M1 cells (Figure 1F). Phagocytosis and bacterial clearance are two major functions of macrophages. Killing of bacteria is mediated by ROS and NO (40, 41). We infected Ak4 shRNA- and scramble shRNA-treated BMDMs with E coli. While bacteria uptake was not altered by either scramble or Ak4 shRNA, bacteria clearance ability was reduced in Ak4 shRNA-treated BMDMs at both MOI 2 and 10 compared to scramble shRNA-treated BMDMs (Figure 1G). Interestingly, both glycolysis and glycolytic capacity decreased in Ak4 shRNA-treated M1 cells. By contrast, the oxygen consumption rate (OCR) was not affected by the Ak4 shRNA (Figure 1H). These data indicate that Ak4 plays a non-redundant role in maintaining the homeostasis of ATP and ROS, sustaining bactericidal ability, and promoting glycolysis in M1 macrophages.
IL-1β, IL-6, TNF-α, iNOS (encoded by Nos2), and Nox2 (encoded by Nox2) promote inflammatory responses to eradicate pathogens in M1 macrophage. Ak4 protein level was reduced in Ak4-silenced M1 cells (Figure 2A). Interestingly, the expressions of Il1b, Tnfa, and Il6 were also down-regulated in cells treated with Ak4 shRNA and siRNA (Supplementary Figures 3B,C,F,G). Silencing Ak4 by siRNA in LPS/IFN-γ-treated thioglycollate-elicited peritoneal macrophages also reduced Il1b, Tnfa, and Il6 transcripts (Supplementary Figure 3I). ELISA assay confirmed that silencing Ak4 reduced the protein levels of IL-1β, IL-6, and TNFα (Figure 2B; Supplementary Figure 3J). Moreover, Hif1a and Nos2 transcripts as well as iNOS, Nox2, and Hif1α proteins were reduced by Ak4 shRNA and Ak4 siRNA treatments (Supplementary Figures 3D,E,H; Figure 2C). The data suggest that Ak4 positively regulates the expression of pro-inflammatory cytokines, iNOS, Nox2, and Hif1α in M1 cells.
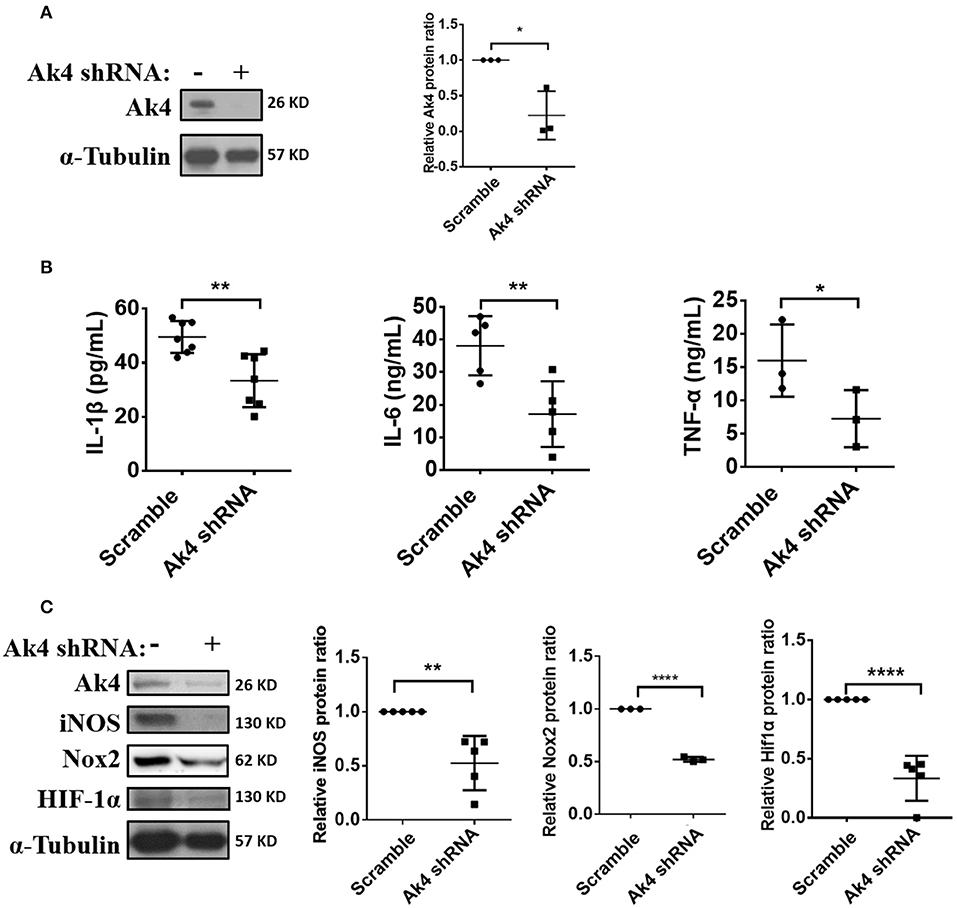
Figure 2. Expressions of inflammation-related protein in Ak4 shRNA-treated M1 macrophages. Pro-inflammatory cytokines IL-1β, IL-6, TNF-α, Nox2, and iNOS expression in Ak4 shRNA- and scramble shRNA-treated M1 macrophages were analyzed by ELISA or Western blotting. Relative protein expressions were normalized against α-Tubulin. (A) Relative protein expressions of Ak4 in Ak4 shRNA- and scramble shRNA-treated M1 macrophages (n = 3). (B) Expressions of IL-1β (n = 7), IL-6 (n = 5), and TNF-α (n = 3) in Ak4 shRNA- and scramble shRNA-treated M1 macrophages were measured by ELISA. (C) Expressions of iNOS (n = 5), Nox2 (n = 3), and Hif1α (n = 5) in Ak4 shRNA- and scramble shRNA-treated M1 macrophages were analyzed by Western blotting. *P < 0.05; **P < 0.01; ****P < 0.0001 determined by unpaired, two-tailed Student's t-test with mean ± SD.
Hif1α reportedly up-regulates IL-1β and iNOS (42). In agreement with this report, we found that suppressing the expression of Hif1α with shRNA resulted in downregulation of IL-1β, IL-6, TNF-α, and iNOS (Supplementary Figures 4A–C). Reversely, treating M1 cells with dimethyloxalylglycine (DMOG), which is known to stabilize Hif1α protein even in normoxia conditions, had an opposite effect (Supplementary Figures 4D–F). Surprisingly, the expressions of Ak4 was down-regulated in Hif1α shRNA-treated M1 macrophages and up-regulated in M1 macrophages treated with DMOG (Figures 3A,B). These observations are consistent with published data showing that the expression of Ak4 increased under hypoxia environment (19) and strongly suggest that Ak4 and Hif1α form a positive feedback loop in M1 cells.
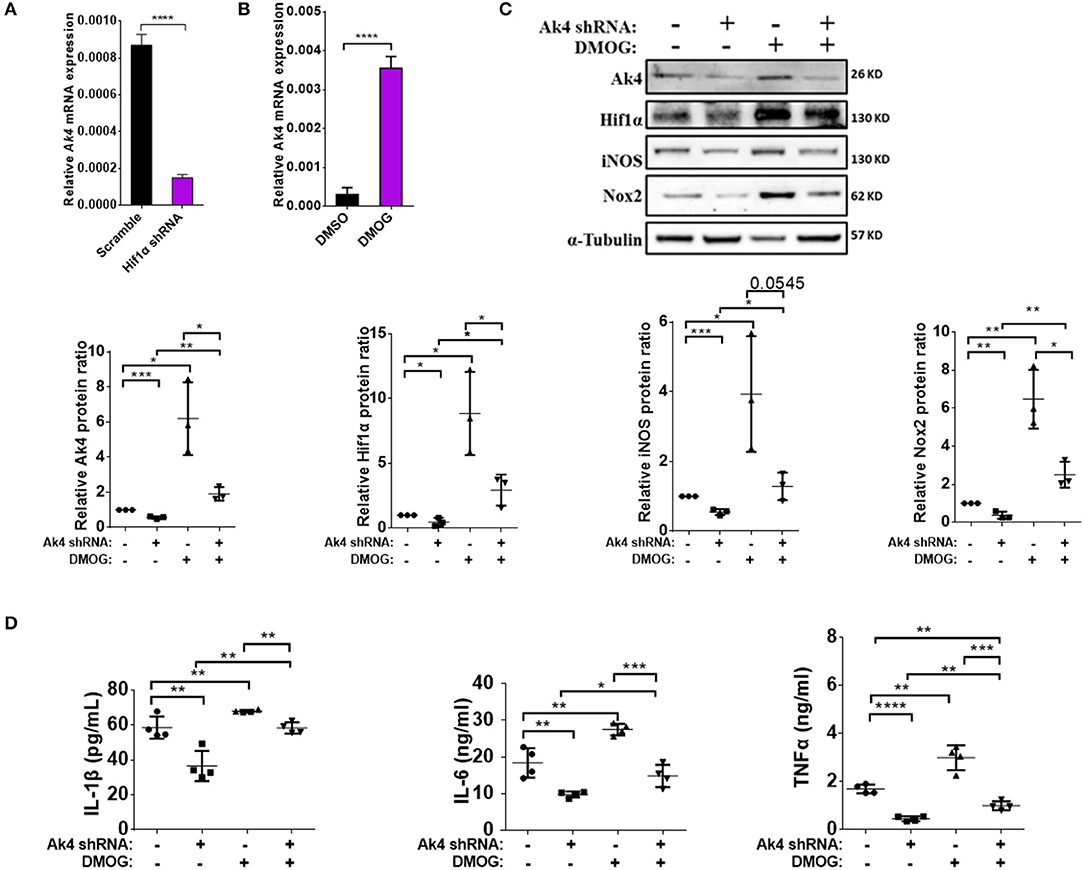
Figure 3. Pro-inflammatory cytokines IL-1β, IL-6, TNF-α, Nox2, and iNOS are downstream targets of Ak4-Hif1α feedback loop in M1 macrophages. Expressions of Ak4 mRNA in Hif1α shRNA- and scramble shRNA- or DMOG-treated M1 macrophages were analyzed by quantitative real-time PCR. Expression of Ak4, Hif1α, iNOS, and Nox2 protein and pro-inflammatory cytokines IL-1β, IL-6, and TNF-α in Ak4 shRNA- and scramble shRNA-treated M1 macrophages with or without 0.2 mM DMOG treatment were analyzed by Western blotting and ELISA, respectively. Relative mRNA expressions were normalized against Actb. Relative protein expressions were normalized against α-Tubulin. (A,B) Relative mRNA expression of Ak4 in (A) Hif1α shRNA- and scramble shRNA-treated M1 macrophages (n = 7) or (B) DMOG-treated M1 macrophages (n = 8). (C) Expressions of Ak4, Hif1α, iNOS, and Nox2 were analyzed by Western blotting (n = 3). (D) Productions of cytokines IL-1β, IL-6, and TNF-α were measured by ELISA (n = 4). *P < 0.05; **P < 0.01; ***P < 0.001; ****P < 0.0001 determined by unpaired, two-tailed Student's t-test (A,B) or one-way ANOVA (C,D) with mean ± SD.
To investigate the role of the Ak4-Hif1α feedback loop in regulating the expression of inflammation genes in M1 cells, we transduced BMDMs with Ak4 shRNA or scramble shRNA for 5 days, then treated the cells with DMOG for 4 h before stimulation with LPS and IFN-γ. We found that DMOG restored the expression of Ak4, Hif1α, iNOS, Nox2, IL-1β, IL-6, and TNF-α in Ak4 shRNA-treated M1 cells (Figures 3C,D). Reversely, the effect of DMOG on the expression of Hif1α was much blunted by Ak4 shRNA.
Previous study has shown that AMPK activation is enhanced in A549 cell line by Ak4 shRNA treatment (19). Consistently, we found the level of p-AMPK was increased in Ak4 shRNA-treated M1 cells (Figure 4A). Treatment with A-769662 and metformin, two AMPK agonists, further reduced the expression of iNOS, IL-1β, IL-6, and TNF-α in Ak4 shRNA-treated cells (Figures 4B,C; Supplementary Figures 5A,B). Reversely, AMPKα1/2 siRNA blunted the effect of Ak4 shRNA (Figures 4B,C). While Ak4 promotes inflammatory genes by inhibiting AMPK activation, our study shows that AMPK agonists increase the level of Ak4 and silencing AMPKα1/2 reduces Ak4 expression (Figure 4B; Supplementary Figure 5A).
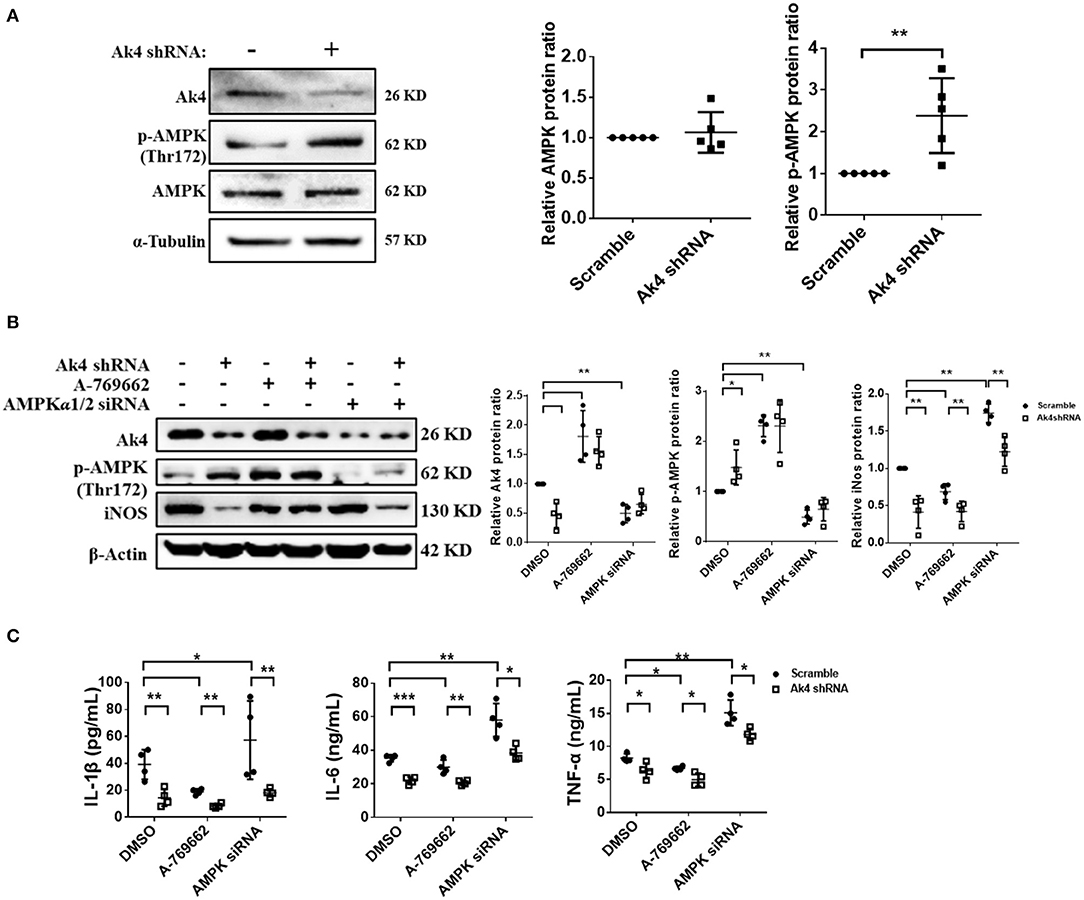
Figure 4. Ak4 inhibits the activation of AMPK to promote inflammation gene expressions in M1 macrophages. Expressions of Ak4, p-AMPK, AMPK in scramble shRNA- and Ak4 shRNA-treated M1 macrophages were analyzed by Western blotting. Relative protein expressions were normalized against β-actin or α-Tubulin. (A) Expressions of Ak4, AMPK, and p-AMPK were analyzed by Western blotting (n = 5). (B) Expressions of Ak4, p-AMPK, and iNOS in A-769662 and AMPKα1/2 siRNA-treated Ak4 shRNA-treated M1 cells were analyzed by Western blotting (n = 4). (C) Production of IL-1β, IL-6, and TNFα (n = 4) were analysis by ELISA. *p < 0.05; **p < 0.01; ***p < 0.001 determined by unpaired, two-tailed Student's t-test (A) or one-way ANOVA (B,C) with mean ± SD.
We subsequently examined the impact of Ak4 shRNA on the transcriptome of M1 macrophages. We stimulated the Ak4 shRNA- or scramble shRNA-transduced BMDMs with LPS and IFN-γ for 6 h. Total mRNAs were prepared from transduced cells and subjected to RNA-Seq. The Ak4 shRNA-transduced cells from thee independent experiments were transcriptomically segregated from scrambled shRNA-transduced cells in principal component analysis (PCA) (Figure 5A). Using a cut-off p-value of 0.01, fold-change (FC) > 2 or <1/2, we identified 145 genes, whose expression was enhanced, and 268 genes, whose expression was down-regulated by Ak4 shRNA treatment (Figures 5B–D). Interestingly, Il1b and Il6 were among the top 10 most down-regulated genes by Ak4 shRNA (Figure 2B; Supplementary Tables 1, 2). Analyses of the differentially regulated genes (DRGs) with Ingenuity Pathway Analysis (IPA) showed that the DRGs participated in Hif1α signaling, a finding consistent with the data shown in Figures 2, 3, adhesion and diapedesis, cytokine-mediated communication, and TLR signaling (Figure 5E; Table 2). However, Gene Set Enrichment Analysis (GSEA) analysis of the RNA-seq data failed to detect any significant change in the expression of genes regulating M1/M2 polarization (Supplementary Figures 6A,B). Subsequent qPCR analyses also demonstrated that Ak4 shRNA treatment of M1 cells had no consistent effect on the expression of M1 genes, such as Scos3 and Irf7, and M2 genes, such as Arg1, Egr2, Chil3, Rentla, Il10, Socs1, and Irf4 (Figure 6A). Moreover, Ak4 overexpression in M2 cells had no consistent effect on the expression of M1 genes, such as Nos2, Il6, Socs3, and Irf7, and M2 genes, such as Egr2, Chil3, Il10, Rentla, Arg1, and Irf4 (Figure 6B).
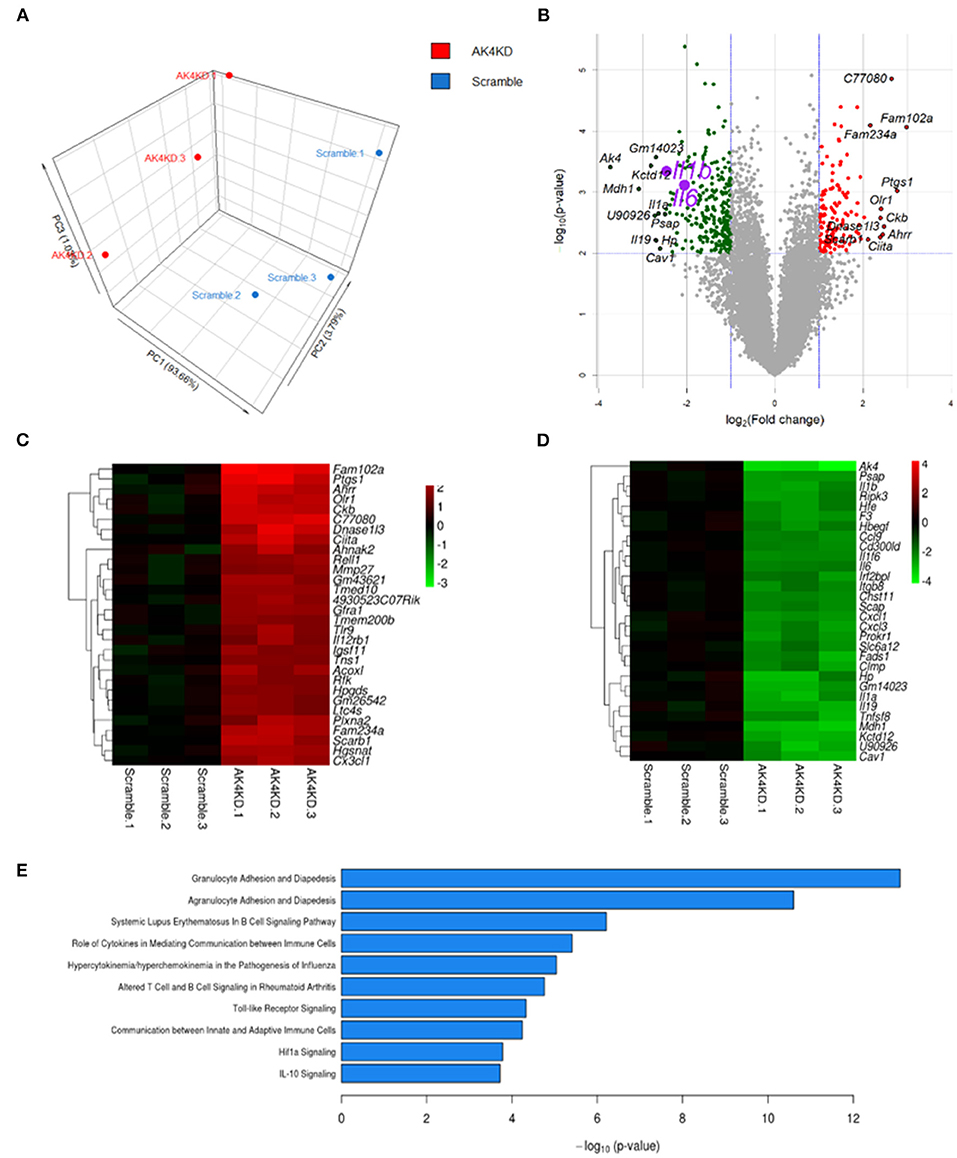
Figure 5. Ak4-regulated pathways in Ak4 shRNA-treated M1 cells were revealed by next generation sequencing. (A) Principal component analysis (PCA) of Ak4-regulated genes. PCA was plotted using expression of differentially expressed genes after Trimmed mean of M-values (TMM) normalization. Each dot represents one sample. Three independent experiments were performed for both Ak4 shRNA group (red) and scramble control (blue). (B) Volcano plots of differentially expressed genes in Ak4 shRNA-treated M1 macrophages. Criteria for selecting Ak4-regulated genes: fold change >2X or <1/2X and P < 0.001. Red points: up-regulated genes in Ak4 shRNA-treated M1 macrophages; green points: down-regulated genes in Ak4 shRNA-treated M1 macrophages. (C) Heat map and hierarchical cluster analysis of top 30 up-regulated genes in Ak4 shRNA-treated M1 macrophages. Red: up-regulated genes as compared to scramble shRNA control. (D) Heat map and hierarchical cluster analysis of top 30 down-regulated genes in Ak4 shRNA-treated M1 macrophages. Green: down-regulated genes as compared to scramble shRNA control. (E) Canonical pathways of Ak4-regulated genes using Ingenuity Pathway Analysis (IPA).
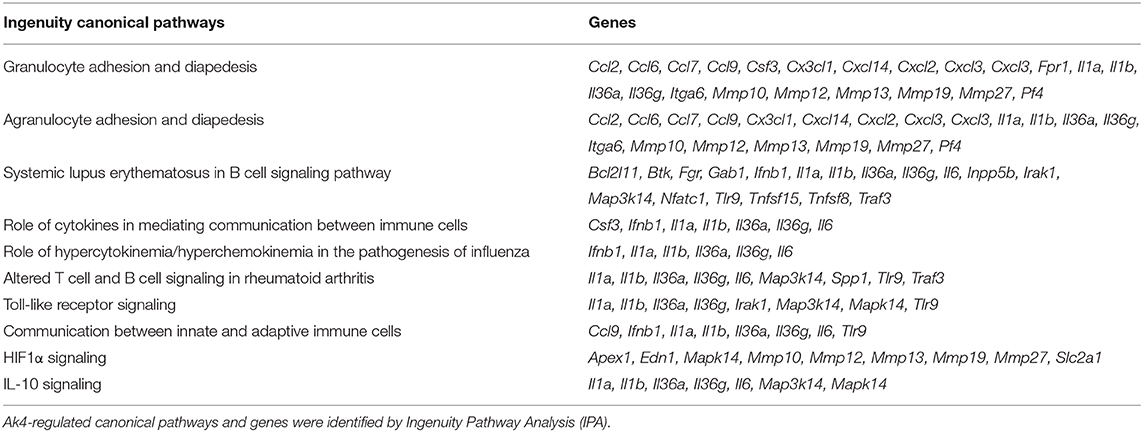
Table 2. Top 10 Ak4-regulated canonical pathways and genes involved were listed.
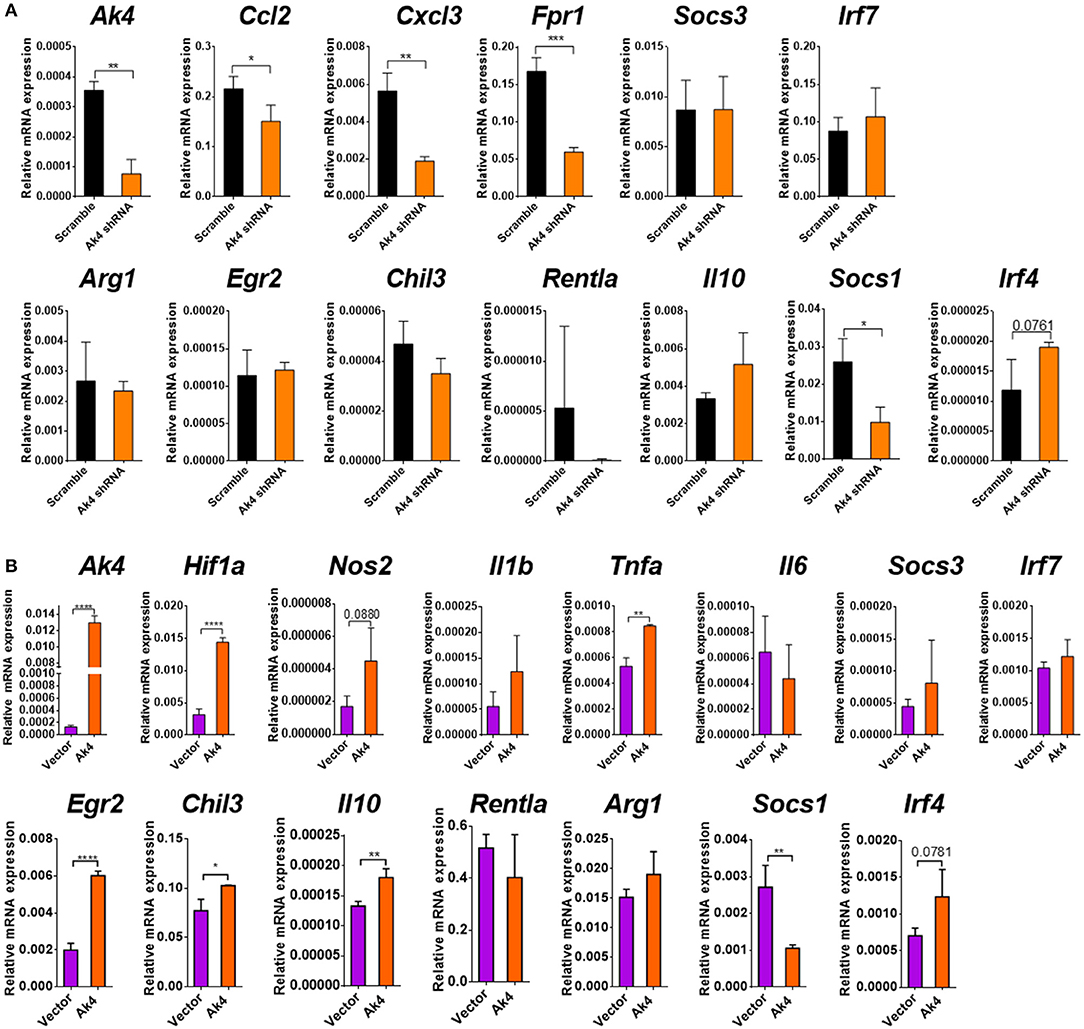
Figure 6. Ak4 does not regulate the polarization of M1/M2 cells. (A) Transcripts of Ak4, Ccl2, Cxcl3, Fpr1, Arg1, Egr2, Chil3, Retnla, Il10, Socs1, Socs3, Irf4, and Irf7 in scramble shRNA- and Ak4 shRNA-treated M1 cells were analyzed by qPCR (n = 3). Gene expressions were compared to scramble shRNA control and normalized against Actb. (B) Transcripts of Ak4, Hif1a, Nos2, Il1b, Il6, Tnfa, Il10, Egr2, Chil3, Retnla, Arg1, Socs3, Irf7, Socs1, and Irf4 in control (vector) and Ak4 overexpressing M2 cells were analyzed by qPCR (n = 3). Gene expressions were compared to control and normalized against Actb. *P < 0.05; **P < 0.01; ***P < 0.001; ****P < 0.0001 determined by unpaired, two-tailed Student's t-test with mean ± SD.
In conclusion, iNOS, Nox2, and pro-inflammatory cytokine, IL-1β, IL-6, and TNF-α expressions are regulated by Ak4-Hif1α and Ak4-AMPK bidirectional loops. Moreover, Ak4 mediates several pathways important for M1 function. However, Ak4 does not regulate M1/M2 polarization.
We demonstrated in this study that Ak4 positively regulates the expression of inflammation genes, such as IL-1β, IL-6, TNF-α, Nox2, and iNOS, in M1 cells through at least two mechanisms, one, by forming a positive feedback loop with Hif1α, and, second by inhibiting the activation of AMPK. A previous study showed in non-small cell lung cancer cells (NSCLC) that Ak4 stabilizes Hif1α protein through inhibition of prolyl hydroxylase (PHD) (22), our data suggest that Ak4 not only stabilizes Hif1α protein but also enhances its transcription (Figure 3C; Supplementary Figures 3D,H). Consistent with published data showing that Ak4 gene is a target of Hif1α (20, 43) and that Ak4 transcript is reduced in Hif1α-deficient hematopoietic cells (44), our study also suggests that Ak4 and Hif1α form a positive feedback loop in M1 cells (Figures 3A–C). However, how Ak4 regulates the transcription of Hif1α is still unclear. We propose the following scenario based on the results of our study revealed in Ak4 silenced M1 cells: First, Ak4 regulates ATP level and ADP/ATP ratio (Figure 1E), suggesting Hif1α transcription may be mediated by the concentration of ATP or ADP/ATP ratio. Second, Ak4 controls ROS production (Figure 1F), which can subsequently activate NF-κB, a key transcription factor of Hif1α (45–47). Thus, Hif1α transcription may be positively regulated by Ak4-ROS-NF-κB pathway. Third, Ak4 inhibits AMPK activation (Figure 4; Supplementary Figure 5). Activated AMPK inhibits NF-κB activity, leading to reduced Hif1α transcription (46–48). It is thus likely that Hif1α transcription may also be regulated through Ak4-AMPK-NF-κB axis. Our results also showed that Ak4 promotes the expression of inflammatory genes by inhibiting AMPK activation (Figure 4). AMPK agonists increase the level of Ak4 and silencing AMPKα1/2 reduces Ak4 expression (Figure 4B; Supplementary Figure 5A). Based on our results together with published data, we propose that Ak4 through promoting Hif1a transcription and inhibiting AMPK activation positively regulates inflammation gene expression.
Ak4 is located in mitochondria matrix that maintains ATP/ADP/AMP homeostasis (16, 17). However, whether Ak4 affects mitochondria function in macrophage is still unclear. Previous study showed that glycolysis is enhanced in Ak4-overexpressing CL1-0 cells (22). Oxygen consumption rate (OCR) is enhanced in Ak4-silenced Hela cells (19). The metabolic state of M1 macrophages preferentially uses glycolysis over oxidative phosphorylation (OXPHOS) for the source of energy (31). Our results showed that glycolysis, but not OXPHOS or OCR, is impaired in Ak4-silenced M1 cells (Figure 1H). It is reported that mitochondria mass and metabolites are both altered in Ak4 shRNA-silenced or Ak4-overexpressing Hela cells (19). In addition, our data show that Ak4 suppresses AMPK activation which is known to mediate mitochondria biogenesis, OXPHOS and ATP production (49). Based on these observations, it is our speculation that Ak4 contributes to the function of mitochondria in M1 macrophages.
Our study reveals a potential mechanism linking energy metabolism and inflammation in macrophages. The key question for this study is why Ak4 up-regulation is so critical for macrophage inflammation. Ak4 may be involved in the following possible ways. First, the catalytic function of Ak4 in the reversible reaction of ADP production through the consumption of ATP and AMP indeed affects mitochondrial cues necessary for macrophage inflammation. Second, Ak4-mediated consumption of AMP may suppress AMPK activity, thereby affecting transcriptional control of specific M1 gene signature and inflammatory cytokine production. Third, Ak4 may regulate possible mechanisms mentioned above, thereby altering Hif-1α signal in transcriptional programming specified for M1 function. Moreover, our RNA-seq analyses show that in addition to regulation of inflammation-related genes in M1 cells, Ak4 also regulates biological processes, such as migration, TLR signaling and communication between innate and adaptive cells. Our work raises the possibility that Ak4 can be a potential target in treating M1-mediated inflammation.
The datasets presented in this study can be found in online repositories. The names of the repository/repositories and accession number(s) can be found in the article/Supplementary Materials.
The animal study was reviewed and approved by Institutional Animal Care and Use Committee of National Taiwan University College of Medicine.
S-CM: conceptualization, supervision, and writing—review and editing. W-YC, C-YH, and S-CM: data curation and validation. C-YH, TWC, L-CL, and S-CM: formal analysis. W-YC and S-CM: funding acquisition, project administration, and writing—original draft. C-YH, Q-YY, L-CL, and S-CM: investigation. W-YC, C-YH, and TWC: methodology. All authors: contributed to the article and approved the submitted version.
This work was supported by research grants from core consortiums of National Taiwan University (106R892103, 107L890503, 108L890503, and 108L890505) and the Taiwan Ministry of Science and Technology (107-2320-B-002-007 and 108-2320-B-002-039).
The authors declare that the research was conducted in the absence of any commercial or financial relationships that could be construed as a potential conflict of interest.
We thank Drs. I-Cheng Ho and Betty A. Wu-Hsieh for their critical review of this manuscript. We thank Dr. Ai-Ling Hour for providing statistical analysis and Hsin-Ying Lee for her assistance in bioinformatics analysis. We are grateful for Dr. Jr-Shiuan Lin and Cheng-Che Li for providing technique assistance. We thank Cellbio (distributor of Agilent Seahorse in Taiwan), Jack Chou and Davy Pan for the technical support. We thank the service provided by the cell sorting core facility of the Third Core Laboratory, National Taiwan University College of Medicine.
The Supplementary Material for this article can be found online at: https://www.frontiersin.org/articles/10.3389/fimmu.2021.630318/full#supplementary-material
Supplementary Figure 1. The definition of M1/M2 marker. (A) Expressions of CD86 and CD206 were analyzed by flow cytometry (n = 3). (B) The mRNA expression of Nos2, Tnfa, Arg1, and Egr2 were analyzed by qPCR in M0, M1, and M2 (n = 3). Relative gene expressions were normalized against Actb. **P < 0.01; ***P < 0.001; ****P < 0.00001 determined by unpaired T-test, two tailed with mean ± SD.
Supplementary Figure 2. Ak4 protein is located in the mitochondria of M1 macrophages. LPS/IFN-γ stimulated BMDMs (5 × 10⁷) were lysed with extraction buffer. Expressions of Ak4, COX IV (mitochondria internal control), and β-Actin (cytosol internal control) proteins were analyzed by Western blotting.
Supplementary Figure 3. Expressions of inflammation-related mRNA in Ak4-silenced M1 macrophages. Transcripts of pro-inflammatory cytokine Il1b, Il6, Tnfa, Nos2, and Hif1a genes in Ak4-silenced and scramble control M1 macrophages were analyzed by real-time PCR analysis. Transcripts of Il1b, Il6, and Tnfa were analyzed for 2 h M1-polarized cells. Transcripts of Ak4, Nos2, and Hif1a were analyzed for 24 h M1-polarized cells. Relative gene expressions were normalized against Actb. (A) The amount of ATP and ADP/ATP from BMDMs treated with Ak4 siRNA were measured (n = 5). (B–E) Relative mRNA expression of (B) Ak4 (n = 3), (C) Il1b (n = 7), Il6 (n = 3), Tnfa (n = 5), (D) Hif1a (n = 5), and (E) Nos2 (n = 5) in Ak4 shRNA- and scramble shRNA-treated M1 macrophages. (F–H) Relative mRNA expression of (F) Ak4, (G) Il1b, Il6, Tnfa, (H) Hif1a, and Nos2 in Ak4 siRNA- and scramble siRNA-treated M1 cells (n = 3). (I,J) Relative mRNA expressions (I) and protein production (J) of Ak4, Il1b, Il6, and Tnfa in Ak4 siRNA- and scramble siRNA-treated peritoneal M1 macrophages (n = 5). *P < 0.05; **P < 0.01; ***P < 0.001; ****P < 0.0001 determined by unpaired T-test, two tailed with mean ± SD.
Supplementary Figure 4. Pro-inflammatory cytokines and iNOS were positively regulated by Hif1α. Expressions of pro-inflammatory cytokines IL-1β, IL-6, TNF-α, Hif1α, iNOS, and Ak4 protein in Hif1α-silenced and scramble control M1 macrophages or 0.5 mM DMOG-treated M1 macrophages were analyzed by ELISA or Western blotting analysis. Relative protein expressions were normalized against α-Tubulin. (A) Hif1α protein expressions were analyzed by Western blotting (n = 3). (B) Production of cytokines IL-1β (n = 3), IL-6 (n = 9), and TNF-α (n = 9) were measured by ELISA. (C) Relative protein expressions of iNOS and Ak4 in Hif1α KD and scramble M1 macrophages (n = 3). (D) overexpression of HIF1α protein in DMOG-treated M1 macrophages were analyzed by Western blotting (n = 8). (E) Production of cytokines IL-1β, IL-6, and TNF-α were measured by ELISA (n = 3). (F) Relative protein expressions of iNOS and Ak4 in DMOD-treated M1 macrophages (n = 8). *P < 0.05; **P < 0.01 determined by unpaired T-test, two tailed with mean ± SD.
Supplementary Figure 5. Ak4 inhibits the activation of AMPK to promote inflammation gene expressions in M1 macrophages. Expressions of Ak4, p-AMPK, AMPK in scramble shRNA- and Ak4 shRNA-treated M1 macrophages were analyzed by Western blotting. Relative protein expressions were normalized against β-actin. (A) Expressions of Ak4, p-AMPK, and iNOS in metformin-treated Ak4 shRNA M1 cells were analyzed by Western blotting (n = 4). (B) Production of IL-1β (n = 7), IL-6 (n = 7), and TNFα (n = 4) were analyzed by ELISA. *p < 0.05; **p < 0.01; ***p < 0.001 determined by one-way ANOVA with mean ± SD.
Supplementary Figure 6. Comparison of Ak4 siRNA-treated M1 gene profile to M1/M2 activated genes set by GSEA analysis. Ak4 siRNA- and scramble siRNA-treated M1 cells. (A,B) Gene set enrichment analysis (GSEA) pathway enrichment plots indicating the representative gene sets, classically activated up/down-regulated genes (A) and alternatively activated up/down-regulated genes (B), enriched in Ak4 shRNA-treated M1 cells versus scramble-treated M1 cells. GSE69607 gene set were used for GSEA analysis. Normalized enrichment score (NES) and P values are shown for each gene set. P values were calculated by Kolmogorov-Smirnov test.
Supplementary Table 1. Top 30 up-regulated genes in Ak4 shRNA-treated M1 cells were listed. Up-regulated genes in Ak4 shRNA-treated M1 cells were identified by IPA. The full names and functions of genes were searched on GeneCards (https://www.genecards.org/).
Supplementary Table 2. Top 30 down-regulated genes in Ak4 shRNA-treated M1 cells were listed. Down-regulated genes in Ak4 shRNA-treated M1 cells were identified by IPA. The full names and functions of genes were searched on GeneCards (https://www.genecards.org/).
2. Sica A, Mantovani A. Macrophage plasticity and polarization: in vivo veritas. J Clin Invest. (2012) 122:787–95. doi: 10.1172/JCI59643
3. Murray PJ, Allen JE, Biswas SK, Fisher EA, Gilroy DW, Goerdt S, et al. Macrophage activation and polarization: nomenclature and experimental guidelines. Immunity. (2014) 41:14–20. doi: 10.1016/j.immuni.2014.06.008
4. Yazdi AS, Ghoreschi K. The interleukin-1 family. Adv Exp Med Biol. (2016) 941:21–9. doi: 10.1007/978-94-024-0921-5_2
5. Tanaka T, Narazaki M, Masuda K, Kishimoto T. Regulation of IL-6 in immunity and diseases. Adv Exp Med Biol. (2016) 941:79–88. doi: 10.1007/978-94-024-0921-5_4
6. Zheng H, Ban Y, Wei F, Ma X. Regulation of interleukin-12 production in antigen-presenting cells. Adv Exp Med Biol. (2016) 941:117–38. doi: 10.1007/978-94-024-0921-5_6
7. Mannel DN, Echtenacher B. TNF in the inflammatory response. Chem Immunol. (2000) 74:141–61. doi: 10.1159/000058757
8. Xue Q, Yan Y, Zhang R, Xiong H. Regulation of iNOS on immune cells and its role in diseases. Int J Mol Sci. (2018) 19:3805. doi: 10.3390/ijms19123805
9. Bogdan C, Rollinghoff M, Diefenbach A. The role of nitric oxide in innate immunity. Immunol Rev. (2000) 173:17–26. doi: 10.1034/j.1600-065X.2000.917307.x
10. Rutz S, Ouyang W. Regulation of interleukin-10 expression. Adv Exp Med Biol. (2016) 941:89–116. doi: 10.1007/978-94-024-0921-5_5
11. Veremeyko T, Siddiqui S, Sotnikov I, Yung A, Ponomarev ED. IL-4/IL-13-dependent and independent expression of miR-124 and its contribution to M2 phenotype of monocytic cells in normal conditions and during allergic inflammation. PLoS ONE. (2013) 8:e81774. doi: 10.1371/journal.pone.0081774
12. Na YR, Je S, Seok SH. Metabolic features of macrophages in inflammatory diseases and cancer. Cancer Lett. (2018) 413:46–58. doi: 10.1016/j.canlet.2017.10.044
13. Shapouri-Moghaddam A, Mohammadian S, Vazini H, Taghadosi M, Esmaeili SA, Mardani F, et al. Macrophage plasticity, polarization, and function in health and disease. J Cell Physiol. (2018) 233:6425–40. doi: 10.1002/jcp.26429
14. Noma T. Dynamics of nucleotide metabolism as a supporter of life phenomena. J Med Invest. (2005) 52:127–36. doi: 10.2152/jmi.52.127
15. Miyoshi K, Akazawa Y, Horiguchi T, Noma T. Localization of adenylate kinase 4 in mouse tissues. Acta Histochem Cytochem. (2009) 42:55–64. doi: 10.1267/ahc.08012
16. Dzeja P, Terzic A. Adenylate kinase and AMP signaling networks: metabolic monitoring, signal communication and body energy sensing. Int J Mol Sci. (2009) 10:1729–72. doi: 10.3390/ijms10041729
17. Panayiotou C, Solaroli N, Karlsson A. The many isoforms of human adenylate kinases. Int J Biochem Cell Biol. (2014) 49:75–83. doi: 10.1016/j.biocel.2014.01.014
18. Lanning NJ, Looyenga BD, Kauffman AL, Niemi NM, Sudderth J, DeBerardinis RJ, et al. A mitochondrial RNAi screen defines cellular bioenergetic determinants and identifies an adenylate kinase as a key regulator of ATP levels. Cell Rep. (2014) 7:907–17. doi: 10.1016/j.celrep.2014.03.065
19. Fujisawa K, Terai S, Takami T, Yamamoto N, Yamasaki T, Matsumoto T, et al. Modulation of anti-cancer drug sensitivity through the regulation of mitochondrial activity by adenylate kinase 4. J Exp Clin Cancer Res. (2016) 35:48. doi: 10.1186/s13046-016-0322-2
20. Hu CJ, Iyer S, Sataur A, Covello KL, Chodosh LA, Simon MC. Differential regulation of the transcriptional activities of hypoxia-inducible factor 1 alpha (HIF-1alpha) and HIF-2alpha in stem cells. Mol Cell Biol. (2006) 26:3514–26. doi: 10.1128/MCB.26.9.3514-3526.2006
21. Jan YH, Tsai HY, Yang CJ, Huang MS, Yang YF, Lai TC, et al. Adenylate kinase-4 is a marker of poor clinical outcomes that promotes metastasis of lung cancer by downregulating the transcription factor ATF3. Cancer Res. (2012) 72:5119–29. doi: 10.1158/0008-5472.CAN-12-1842
22. Jan YH, Lai TC, Yang CJ, Lin YF, Huang MS, Hsiao M. Adenylate kinase 4 modulates oxidative stress and stabilizes HIF-1alpha to drive lung adenocarcinoma metastasis. J Hematol Oncol. (2019) 12:12. doi: 10.1186/s13045-019-0698-5
23. Semenza GL, Rue EA, Iyer NV, Pang MG, Kearns WG. Assignment of the hypoxia-inducible factor 1alpha gene to a region of conserved synteny on mouse chromosome 12 and human chromosome 14q. Genomics. (1996) 34:437–9. doi: 10.1006/geno.1996.0311
24. Hogenesch JB, Chan WK, Jackiw VH, Brown RC, Gu YZ, Pray-Grant M, et al. Characterization of a subset of the basic-helix-loop-helix-PAS superfamily that interacts with components of the dioxin signaling pathway. J Biol Chem. (1997) 272:8581–93. doi: 10.1074/jbc.272.13.8581
25. Hong SS, Lee H, Kim KW. HIF-1alpha: a valid therapeutic target for tumor therapy. Cancer Res Treat. (2004) 36:343–53. doi: 10.4143/crt.2004.36.6.343
26. Wang GL, Jiang BH, Rue EA, Semenza GL. Hypoxia-inducible factor 1 is a basic-helix-loop-helix-PAS heterodimer regulated by cellular O2 tension. Proc Natl Acad Sci USA. (1995) 92:5510–4. doi: 10.1073/pnas.92.12.5510
27. Iyer NV, Kotch LE, Agani F, Leung SW, Laughner E, Wenger RH, et al. Cellular and developmental control of O2 homeostasis by hypoxia-inducible factor 1 alpha. Genes Dev. (1998) 12:149–62. doi: 10.1101/gad.12.2.149
28. Masoud GN, Li W. HIF-1alpha pathway: role, regulation intervention for cancer therapy. Acta Pharm Sin B. (2015) 5:378–89. doi: 10.1016/j.apsb.2015.05.007
29. Schodel J, Grampp S, Maher ER, Moch H, Ratcliffe PJ, Russo P, et al. Hypoxia, hypoxia-inducible transcription factors, renal cancer. Eur Urol. (2016) 69:646–57. doi: 10.1016/j.eururo.2015.08.007
30. Rankin EB, Giaccia AJ. Hypoxic control of metastasis. Science. (2016) 352:175–80. doi: 10.1126/science.aaf4405
31. Jung J, Zeng H, Horng T. Metabolism as a guiding force for immunity. Nat Cell Biol. (2019) 21:85–93. doi: 10.1038/s41556-018-0217-x
32. Corcoran SE, O'Neill LAJ. HIF1α and metabolic reprogramming in inflammation. J Clin Invest. (2016) 126:3699–707. doi: 10.1172/JCI84431
33. Wang T, Liu H, Lian G, Zhang SY, Wang X, Jiang C. HIF1alpha-induced glycolysis metabolism is essential to the activation of inflammatory macrophages. Mediators Inflamm. (2017) 2017:9029327. doi: 10.1155/2017/9029327
34. Duscher D, Januszyk M, Maan ZN, Whittam AJ, Hu MS, Gurtner GC. Comparison of the hydroxylase inhibitor DMOG and the iron chelator deferoxamine in diabetic and aged wound healing. Plast Reconstr Surg. (2017) 139:695e−706e. doi: 10.1097/PRS.0000000000003072
35. Frezza C, Cipolat S, Scorrano L. Organelle isolation: functional mitochondria from mouse liver, muscle and cultured fibroblasts. Nat Protoc. (2007) 2:287–95. doi: 10.1038/nprot.2006.478
36. Kim D, Langmead B, Salzberg SL. HISAT: a fast spliced aligner with low memory requirements. Nat Methods. (2015) 12:357–60. doi: 10.1038/nmeth.3317
37. Liao Y, Smyth GK, Shi W. featureCounts: an efficient general purpose program for assigning sequence reads to genomic features. Bioinformatics. (2014) 30:923–30. doi: 10.1093/bioinformatics/btt656
38. Liao Y, Smyth GK, Shi W. The R package Rsubread is easier, faster, cheaper and better for alignment and quantification of RNA sequencing reads. Nucleic Acids Res. (2019) 47:e47. doi: 10.1093/nar/gkz114
39. Robinson MD, McCarthy DJ, Smyth GK. edgeR: a bioconductor package for differential expression analysis of digital gene expression data. Bioinformatics. (2010) 26:139–40. doi: 10.1093/bioinformatics/btp616
40. Jamaati H, Mortaz E, Pajouhi Z, Folkerts G, Movassaghi M, Moloudizargari M, et al. Nitric oxide in the pathogenesis and treatment of tuberculosis. Front Microbiol. (2017) 8:2008. doi: 10.3389/fmicb.2017.02008
41. Dupre-Crochet S, Erard M, Nubetae O. ROS production in phagocytes: why, when, and where? J Leukoc Biol. (2013) 94:657–70. doi: 10.1189/jlb.1012544
42. Majmundar AJ, Wong WJ, Simon MC. Hypoxia-inducible factors and the response to hypoxic stress. Mol Cell. (2010) 40:294–309. doi: 10.1016/j.molcel.2010.09.022
43. Greijer AE, van der Groep P, Kemming D, Shvarts A, Semenza GL, Meijer GA, et al. Up-regulation of gene expression by hypoxia is mediated predominantly by hypoxia-inducible factor 1 (HIF-1). J Pathol. (2005) 206:291–304. doi: 10.1002/path.1778
44. Hayashi Y, Zhang Y, Yokota A, Yan X, Liu J, Choi K, et al. Pathobiological pseudohypoxia as a putative mechanism underlying myelodysplastic syndromes. Cancer Discov. (2018) 8:1438–57. doi: 10.1158/2159-8290.CD-17-1203
45. Rius J, Guma M, Schachtrup C, Akassoglou K, Zinkernagel AS, Nizet V, et al. NF-kappaB links innate immunity to the hypoxic response through transcriptional regulation of HIF-1alpha. Nature. (2008) 453:807–11. doi: 10.1038/nature06905
46. Taylor CT, Cummins EP. The role of NF-kappaB in hypoxia-induced gene expression. Ann N Y Acad Sci. (2009) 1177:178–84. doi: 10.1111/j.1749-6632.2009.05024.x
47. Scholz CC, Taylor CT. Hydroxylase-dependent regulation of the NF-kappaB pathway. Biol Chem. (2013) 394:479–93. doi: 10.1515/hsz-2012-0338
48. Dengler F. Activation of AMPK under hypoxia: many roads leading to Rome. Int J Mol Sci. (2020) 21:2428. doi: 10.3390/ijms21072428
Keywords: AK4, classically activated macrophages (M1), HIF1α, AMPK, inflammation
Citation: Chin W-Y, He C-Y, Chow TW, Yu Q-Y, Lai L-C and Miaw S-C (2021) Adenylate Kinase 4 Promotes Inflammatory Gene Expression via Hif1α and AMPK in Macrophages. Front. Immunol. 12:630318. doi: 10.3389/fimmu.2021.630318
Received: 17 November 2020; Accepted: 17 February 2021;
Published: 15 March 2021.
Edited by:
Guo-Chang Fan, University of Cincinnati, United StatesReviewed by:
Yutian Li, University of Cincinnati, United StatesCopyright © 2021 Chin, He, Chow, Yu, Lai and Miaw. This is an open-access article distributed under the terms of the Creative Commons Attribution License (CC BY). The use, distribution or reproduction in other forums is permitted, provided the original author(s) and the copyright owner(s) are credited and that the original publication in this journal is cited, in accordance with accepted academic practice. No use, distribution or reproduction is permitted which does not comply with these terms.
*Correspondence: Shi-Chuen Miaw, smiaw@ntu.edu.tw
Disclaimer: All claims expressed in this article are solely those of the authors and do not necessarily represent those of their affiliated organizations, or those of the publisher, the editors and the reviewers. Any product that may be evaluated in this article or claim that may be made by its manufacturer is not guaranteed or endorsed by the publisher.
Research integrity at Frontiers
Learn more about the work of our research integrity team to safeguard the quality of each article we publish.