
95% of researchers rate our articles as excellent or good
Learn more about the work of our research integrity team to safeguard the quality of each article we publish.
Find out more
ORIGINAL RESEARCH article
Front. Immunol. , 19 February 2021
Sec. Molecular Innate Immunity
Volume 12 - 2021 | https://doi.org/10.3389/fimmu.2021.590532
This article is part of the Research Topic Immunosuppressive Amino Acid Catabolizing Enzymes in Health and Disease View all 7 articles
 Soumya R. Mohapatra1
 Ahmed Sadik1
 Suraj Sharma2
 Gernot Poschet3
 Hagen M. Gegner3
 Tobias V. Lanz4,5,6Philippe Lucarelli7
 Ursula Klingmüller7,8
 Michael Platten4,5
 Ines Heiland2
 Christiane A. Opitz1,9*
The liver is the central hub for processing and maintaining homeostatic levels of dietary nutrients especially essential amino acids such as tryptophan (Trp). Trp is required not only to sustain protein synthesis but also as a precursor for the production of NAD, neurotransmitters and immunosuppressive metabolites. In light of these roles of Trp and its metabolic products, maintaining homeostatic levels of Trp is essential for health and well-being. The liver regulates global Trp supply by the immunosuppressive enzyme tryptophan-2,3-dioxygenase (TDO2), which degrades Trp down the kynurenine pathway (KP). In the current study, we show that isolated primary hepatocytes when exposed to hypoxic environments, extensively rewire their Trp metabolism by reducing constitutive Tdo2 expression and differentially regulating other Trp pathway enzymes and transporters. Mathematical modelling of Trp metabolism in liver cells under hypoxia predicted decreased flux through the KP while metabolic flux through the tryptamine branch significantly increased. In line, the model also revealed an increased accumulation of tryptamines under hypoxia, at the expense of kynurenines. Metabolic measurements in hypoxic hepatocytes confirmed the predicted reduction in KP metabolites as well as accumulation of tryptamine. Tdo2 expression in cultured primary hepatocytes was reduced upon hypoxia inducible factor (HIF) stabilisation by dimethyloxalylglycine (DMOG), demonstrating that HIFs are involved in the hypoxic downregulation of hepatic Tdo2. DMOG abrogated hepatic luciferase signals in Tdo2 reporter mice, indicating that HIF stability also recapitulates hypoxic rewiring of Trp metabolism in vivo. Also in WT mice HIF stabilization drove homeostatic Trp metabolism away from the KP towards enhanced tryptamine production, leading to enhanced levels of tryptamine in liver, serum and brain. As tryptamines are the most potent hallucinogens known, the observed upregulation of tryptamine in response to hypoxic exposure of hepatocytes may be involved in the generation of hallucinations occurring at high altitude. KP metabolites are known to activate the aryl hydrocarbon receptor (AHR). The AHR-activating properties of tryptamines may explain why immunosuppressive AHR activity is maintained under hypoxia despite downregulation of the KP. In summary our results identify hypoxia as an important factor controlling Trp metabolism in the liver with possible implications for immunosuppressive AHR activation and mental disturbances.
The liver and its role in the human physiology has intrigued people for centuries (1). With advances in modern medicine and a better understanding of human physiology, the liver has been revealed as the central gatekeeper for all metabolic inputs, being responsible for systemic metabolic homeostasis (1, 2). This master regulator of metabolic inputs maintains steady state conditions during times of plenty by metabolizing and channeling excessive nutrients for storage, while during starved conditions the previously stored nutrients are released for use by peripheral tissues (2, 3). A class of nutrients that are acquired exclusively through dietary sources are essential amino acids, for example Trp. Dietary Trp upon absorption in the gut exists in the blood with a majority bound to albumin while a minor fraction (5–10%) exists as free Trp, with the existence of a rapid equilibrium between the two (4). The liver regulates systemic free Trp levels by degrading Trp into various metabolic products. Trp can be degraded along three known minor metabolic pathways namely serotonin, tryptamine and indolepyruvic acid pathways, however the liver degrades a majority of dietary Trp through the KP (5, 6). To accomplish this, hepatocytes endogenously express TDO2, which catalyses the first step of the KP (7, 8).
In metabolically active tissues such as liver, oxygen availability is an important factor not only for cell survival but also for maintaining metabolic function as well as energy metabolism of the cell (9). In the liver, cellular differentiation is also regulated by oxygen availability both during liver development as well as liver regeneration (10, 11). Cells exposed to hypoxic conditions generally modulate the expression of a wide range of genes through the upregulation of HIFs (12). Under normoxic conditions, HIF proteins are degraded by prolyl-hydroxylase (PHD) enzymes, however onset of hypoxia inhibits the action of these enzymes thus stabilizing the HIF transcription factors, the most prominent among which is HIF1α (13). Upon stabilization, HIF1α translocates into the nucleus and modulates (i.e. both up- or down-regulates) the expression of hypoxia target genes (9, 10). Stabilization of HIF1α has also been reported in various hepatic diseases such as hepatic ischemia reperfusion (IR) injury (14, 15), alcohol-mediated liver injury (16), liver fibrosis (17), viral hepatitis (18) as well as in hepatocellular carcinoma (19, 20).
We previously found that HIF1α downregulates the expression of the Trp-catabolizing enzyme tryptophan-2,3-dioxygenase (TDO2) in human glioblastoma cells (21). However, it is known that the regulation of TDO2 differs between glioblastoma cells and liver cells, indicating that TDO2 may be regulated in a tissue-specific manner (22). Given the prevalence and importance of hypoxia in hepatic development, as well as liver pathology, we therefore set out to decipher the effects of hypoxia on Trp catabolism in the liver. We report that hypoxia significantly alters the homeostatic Trp catabolism in the liver by favouring the production of tryptamine and its downstream metabolites, instead of the usual KP metabolites.
Isolation of primary hepatocytes from mice was approved under the reference number A24/10 and G14/17 by the governmental review committee on animal care of Baden-Württemberg, Germany. C57BL/6N mice were obtained from Charles River and housed at the DKFZ animal facility under a constant day light cycle. Animals were allowed ad libitum access to a standard mouse diet and water. Murine hepatocytes were harvested from male animals aged between 8 to 10 weeks according to a standardized protocol described earlier (23). Harvested hepatocytes were seeded at a density of 1x10⁶ cells/well, in 6 well collagen I-coated tissue culture plates (BD Biosciences), in 2 mL of adhesion medium and allowed to attach for 4 h at normoxic conditions i.e. 18.6% O2 concentration (24) in a SANYO MCO-18AIC incubator with 5% CO2 and at 37°C. The adhesion medium consisted of phenol red-free Williams E medium (Biochrom) containing 10% (v/v) fetal bovine serum (Life Technologies), 0.1 µM dexamethasone, 10 µg/mL insulin, 2 mM L-glutamine and 1% (v/v) 100X penicillin/streptomycin (Life Technologies).
Following the 4 h of incubation, wells were washed twice with PBS (Gibco) to remove unattached hepatocytes. This was followed by an overnight incubation of the cells in serum-free medium. The serum-free medium was composed of phenol red-free Williams E medium containing 0.1 µM dexamethasone, 2 mM L-glutamine, and 1% (v/v) 100X penicillin/streptomycin. Following the overnight incubation, the serum-free medium was removed, cells were again washed three times and 2 ml of serum and dexamethasone-free medium was added for initiation of the hypoxia or hypoxia mimetic treatments according to the respective experimental conditions described in subsequent sections.
Murine hepatocytes cultured in 6 well plates in serum and dexamethasone-free medium were subjected to either normoxic or hypoxic conditions for 1, 2 and 3 days. A Labotect incubator C42 was used to attain hypoxic conditions i.e. 1% O2 concentration with 5% CO2 and 37°C. Cells were always seeded in duplicate for each time point with the control plate being incubated in the normoxic incubator while the second was incubated in the hypoxia incubator. Cells were lysed for RNA extraction at the end of the respective time points.
The well known chemical mimetic of hypoxia i.e. dimethyloxalylglycine (DMOG) was used for HIF protein stabilization. 20M stocks of DMOG (Frontier Scientific Inc.) were prepared in ethanol (Sigma). Hepatocytes were treated such that they were exposed to 3 mM of DMOG in a well as final treatment condition.
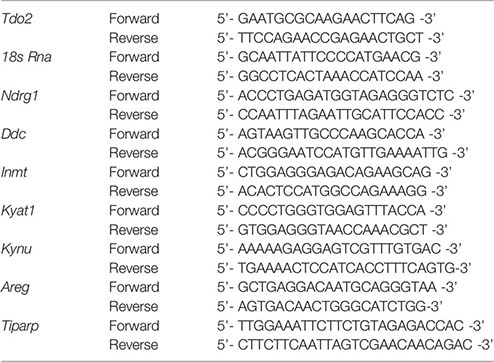
Total RNA was isolated from the harvested samples using a Qiagen RNAeasy Mini Kit (Qiagen). Subsequently, a High Capacity cDNA reverse transcriptase kit (Applied Biosystems) was used for cDNA production from 1 µg total RNA. (q)RT-PCR was performed using the SYBR Select Master Mix (Thermo Fisher Scientific) on a StepOnePlus real-time PCR system (Applied Biosystems). For all (q)RT-PCR measurements 18s Rna was used as a housekeeping gene for normalization during analysis. Unless stated otherwise, all the murine (q)RT-PCR primers for a target gene used in the present study were designed using Primer Blast (NCBI). The murine Ndrg1 primers used in the study were taken from a prior publication by Okuda and colleagues (25). The murine primer sequences used are listed below:
For metabolic analysis, 1 ml cell culture supernatant from each treatment was harvested and was snap frozen in liquid nitrogen. Subsequently, the cells were harvested by trypsinization in 1.5 ml PBS for intracellular metabolic measurements. Ten microliter of cell suspension were used for cell counting, while the rest were pelleted for snap freezing in liquid nitrogen. The separated 10 µl of cell suspension was mixed in a 1:1 ratio with Trypan Blue dye (Gibco) and subsequently the cell count was measured using an automated Cell Counter (Countess, Invitrogen). Intracellular metabolite extraction was performed with 0.1 ml 6% perchloric acid per million cells in an ultrasonic ice-bath for 10 min. Supernatants were mixed in a 1:1 ratio with 12% perchloric acid and incubated on ice for 10 min. Subsequently samples were centrifuged at maximum speed and 4°C to remove remaining cell debris. Separation was achieved on an Acquity H-class UPLC system (Waters) using an Acquity HSS T3 column (100 × 2.1 mm, 1.7 µm, Waters), which was maintained at 37°C. Clear separation of Trp and Trp downstream metabolites was achieved by increasing the concentration of solvent B (Acetonitrile) in solvent A (20 mM sodium acetate, 3 mM zinc acetate, pH 6). An Acquity FLR detector (Waters) was used for detecting Trp, 3-hydroxyanthranilic acid (3HAA), kynurenic acid (KynA) and tryptamine by fluorescence (excitation: 254 nm, emission: 401 nm). While for kynurenine (Kyn) and 3-hydroxy-kynurenine (3HKyn) an Acquity PDA detector (Waters) was used for measuring absorption at 365 nm. UPLC grade standards (Sigma) were used for quantification of all analytes. The Empower3 software suite (Waters) was used for data acquisition and processing.
Ten week old male WT C57BL/6 mice were obtained from Charles River and housed at the DKFZ under a constant day light cycle. Three mice each were injected i.p. either with saline control (0.9% NaCl) (Fresenius Kabi) or with 8 mg/mouse DMOG (Echelon Biosciences) dissolved in saline (0.9% NaCl) (Fresenius Kabi). Twenty-four hours post treatment, the animals were sacrificed for collection of blood serum and tissue samples from liver and brain for metabolic analysis of the Trp metabolic products kynurenine and tryptamine. The experiments were approved under the animal grant number G240/18 by the governmental review committee on animal care of Baden-Württemberg, Germany.
Frozen liver and brain tissue was processed following an adjusted extraction protocol targeting tryptophan and kynurenine metabolites (26, 27). Briefly, samples were crushed using a ball mill (MM400, Retsch) with liquid nitrogen cooled beakers and stainless-steel balls for 1 min (brain) and 1.50 min (liver) at its highest frequency (30 Hz). The samples were then weighed for later normalization and subsequently mixed with 100 µl acidified mobile phase (0.2% formic acid + 1% acetonitrile in H2O) and 400 µl ice cold methanol.
Similarly, 15 µl of plasma was mixed with 35 µl of acidified mobile phase and 200 µl of methanol. Afterwards, all samples were kept at −20°C for 30 min to precipitate all protein. Subsequently, the samples were centrifuged for 15 min at 4°C at 16.400 g and the resulting supernatant was transferred to a new 1.5 ml microcentrifuge tube (Eppendorf). Finally, the supernatant was dried using the Eppendorf Concentrator Plus set to no heat and resuspended in 40 µl acidified mobile phase.
For metabolite separation and detection, an Acquity I-class Plus UPLC system (Waters) coupled to an QTRAP 6500+ (SCIEX) mass spectrometer with electrospray ionization (ESI) source was used. In detail, metabolites were separated by reversed phase chromatography on an Acquity HSS T3 column (150 mm x 2.1 mm, 1.7 µm, Waters) kept at 20°C and a flow rate of 0.4 ml/min. An overview of multiple reaction monitoring (MRM) transitions that were used can be found in Table S1. Clear separation of tryptophan and tryptophan-derived compounds was achieved by increasing the concentration of solvent B (Acetonitrile + 0,1% formic acid) in solvent A (H2O + 0.1% formic acid) as follows: 1 min 5% B, 11 min 40% B, 13 min 95% B, 15 min 95% B, and return to 5% B in 5 min. Data acquisition and processing was performed with the Sciex OS software suite (SCIEX).
One hundred nanogram total RNA was used for generating labeled ss-cDNA using an Affymetrix WT PLUS Reagent Kit. The Affymetrix Mouse Gene 2.0 ST chip was used for hybridization of 5.5 µg fragmented and labeled ss-cDNA for 17 h at 45°C. In accordance to the GeneChip R Expression Wash, Stain and Scan Manual for Cartridge Arrays (P/N702731) an Affymetrix GeneChip R Scanner 3000 was used for scanning the hybridized chips. The Raw CEL files were imported from disk followed by RMA normalization and summarization using the oligo package and were annotated at the probeset level using NetAffx (28). Differential gene expression was conducted by fitting linear model and estimating a moderated t-statistic followed by eBayes adjustment as described in the limma package (29, 30). All analyses were run in R, version 3.4.4, (https://cran.r-project.org/) and Bioconductor version 3.6 (https://bioconductor.org/). All graphical representations were generated using ggplot2, ggpubr, and RcolorBrewer. All datasets generated during the current study, have been made publicly available in the Gene Expression Omnibus (GEO) repository under accession number GSE159320.
To simulate Trp metabolism in murine hepatocytes, we used the mathematical model of Trp metabolism previously published by Stavrum et al. (31). Expression data generated for murine hepatocytes exposed to normoxia or hypoxia for 48 h were integrated into the model as described in Schäuble et al. (32) and COPASI 4.28 (33) was used to calculate the steady state concentrations and fluxes. The concentration of extracellular Trp was set to 10 mM, corresponding to the upper bound of free Trp concentrations measured in blood (34).
The mouse line was developed and previously described by Lanz et al. (35). Homozygous reporter-TDO2 were injected with 50 mg/kg d-luciferin (StayBrite™, BioVision, Mountain View, CA, USA) 5 min before imaging. The reporter mice were anaesthetized using isoflurane and assayed for bioluminescence intensity using an in vivo Imaging System (IVIS, Caliper/PerkinElmer, Waltham, MA, USA) with a cooled charged-coupled device (CCD) camera. Following baseline imaging prior to treatment, three mice each were injected i.p. with 8 mg/mouse DMOG (Frontier Scientific Inc.) dissolved in saline (0.9% NaCl) (Fresenius Kabi), following which a second bioluminescence imaging was performed 24 h later. Bioluminescence images were acquired as photons/s/cm2/steradian over a period of 60 s using the Living Image software (version 2.50, Caliper/PerkinElmer). Signal quantification was done by measuring emitted photons from acquisition regions. Bioluminescence was plotted as fold change compared to pre-treatment baseline levels. The experiments were approved under the animal grant number G240/18 by the governmental review committee on animal care of Baden-Württemberg, Germany.
GraphPad Prism v8.02.1 (GraphPad Software Inc.) was used for statistical analysis. For single comparisons between two data sets, unpaired two-tailed Student’s t-tests were utilized. Rank sum analysis by Mann-Whitney U test was carried out wherever necessary. All data are plotted as mean (± SEM), unless stated otherwise. Differences with a p ≤ 0.05 were considered to be statistically significant (ns non significant; p > 0.05; * p ≤ 0.05; ** p ≤ 0.01; *** p ≤ 0.001; **** p ≤ 0.0001).
Microarray analysis of mRNA expression in cultured primary murine hepatocytes post exposure to 48 h of hypoxia (1% O2), revealed a strong reduction in the expression of Tdo2 mRNA (Figure 1A). Establishment of intra-cellular hypoxia was confirmed by increased expression of the surrogate hypoxia marker Ndrg1 and also upregulation of the Hallmark_Hypoxia pathway genes (Figure 1B). The results of the microarray were validated by (q)RT-PCR measurements (Figures 1C, D) not only at 48 h but also across all measured time points. The measurements revealed elevated Ndrg1 mRNA levels (Figure 1C) in hypoxic hepatocytes, while constitutive Tdo2 mRNA expression was reduced across all time points (Figure 1D). These observations are in line with our prior observations in glioblastoma cells, indicating that downregulation of TDO2 might be a global response to hypoxia.
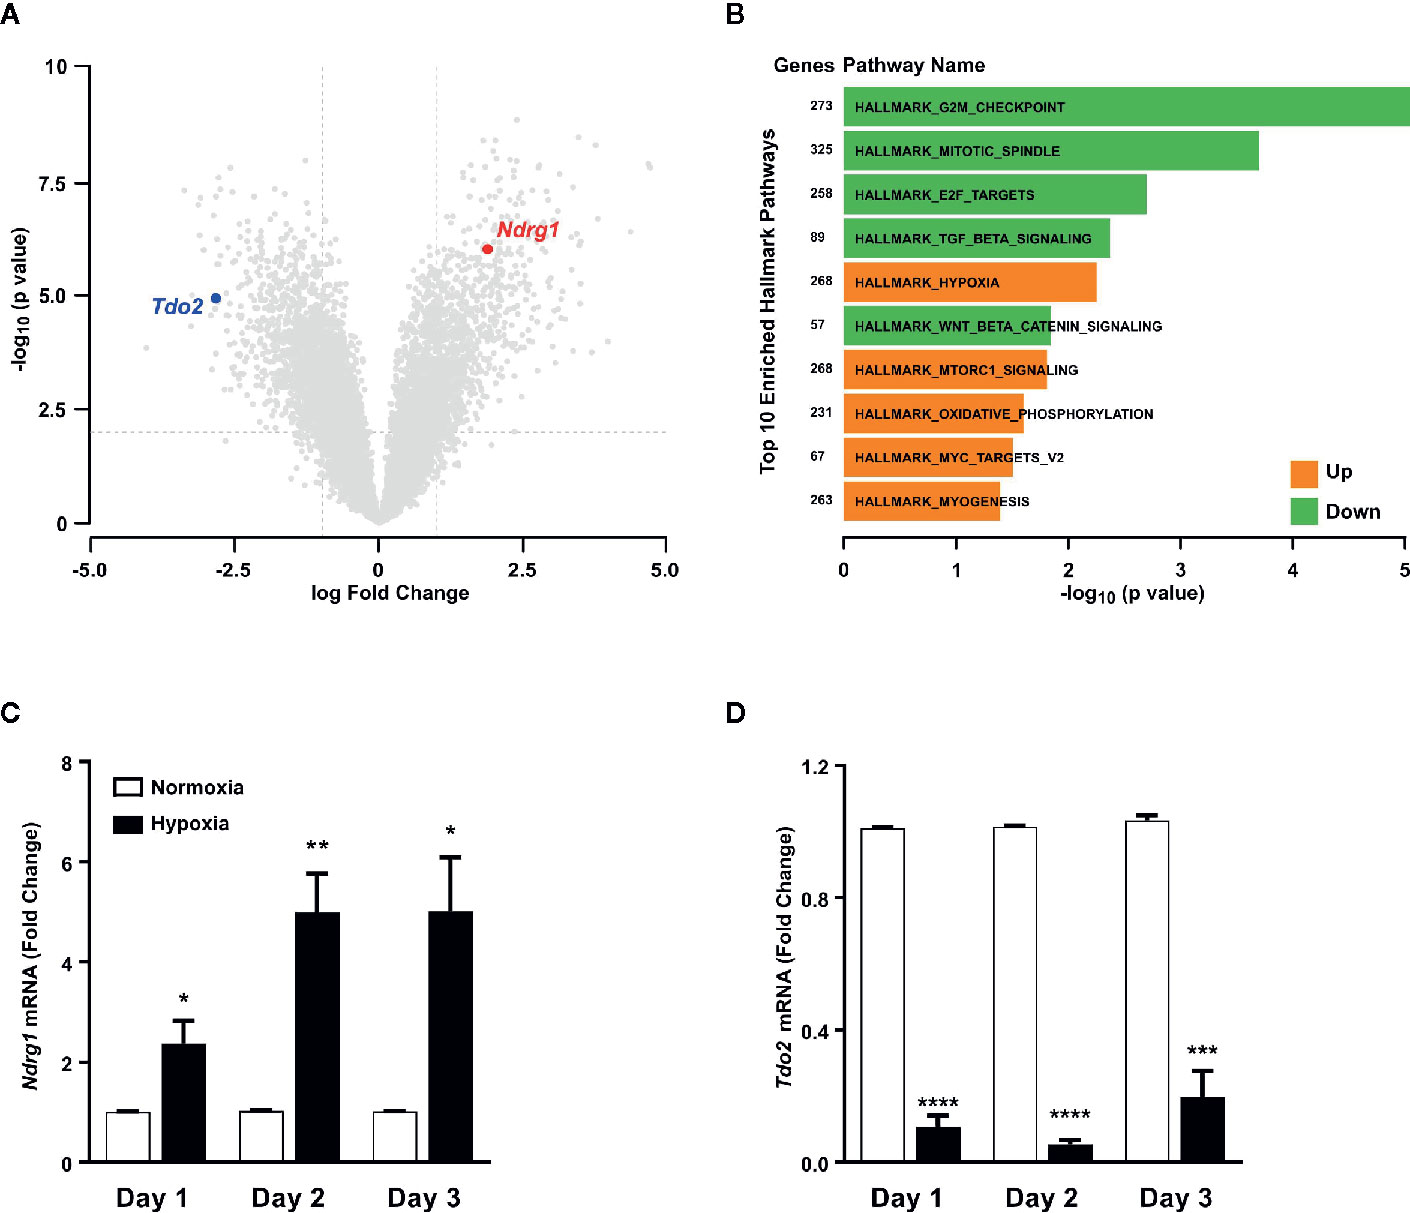
Figure 1 Tryptophan-2,3-dioxygenase (Tdo2) expression is reduced in primary murine hepatocytes exposed to hypoxia. (A) Volcano plot showing the differentially regulated genes in microarray data of primary murine hepatocytes after exposure to 48 h hypoxia (1% O2) compared to control hepatocytes exposed to 48 h normoxia (19% O2). (n=3) (B) Differentially regulated top 10 hallmark pathways enriched in the microarray data shown in (A). (C) mRNA expression of the surrogate hypoxia marker gene Ndrg1 measured by (q)RT-PCR in primary murine hepatocytes after 1, 2 or 3 days of exposure to either normoxia (white) or hypoxia (back). (n=3) (D) Expression of Tdo2 mRNA measured by (q)RT-PCR in primary murine hepatocytes as in (C). Data represented as mean ± S.E.M. Statistical significance was assumed at p < 0.05 (*p < 0.05, **p < 0.01, ***p < 0.001, ****p ≤ 0.0001).
In light of the hypoxia-mediated downregulation of Tdo2 expression, we next conducted an in silico analysis to study the global effects of hypoxia on Trp metabolism in hepatocytes. Microarray-based RNA expression data of Trp pathway enzymes and transporters, together with other predefined modelling parameters were fed into a previously described Trp metabolism model (31), which shows that under hypoxic conditions a significant decrease in the Trp-Kyn exchange by the well-studied large amino acid transporters LAT1 (SLC7A5) and LAT2 (SLC7A8) is observed (Figure 2A). Further, hypoxia also reduced hepatic Trp flux through TDO2 into the KP, which in turn decreased the metabolic flux through downstream KP enzymes such as kynureninase (KYNU), kynurenine aminotransferases (KATs), kynurenine 3-monooxygenase (KMO) (Figure 2B). Enzymatic flux was also reduced under hypoxia further downstream in the KP such as through the enzymes hydroxyanthranilic acid oxidase (HAAO) and quinolinic acid phosphoribosyltransferase (QPRT) i.e. the enzymes that feed into the de novo NAD synthesis pathway (Figure 2B). In contrast, flux through the serotonin synthesis pathway catalyzed by tryptophan hydroxylase 1 (TPH1) (Figure 2B) showed a tendency towards an increase. Interestingly, inspite of the reduced flux of Trp into the hepatocytes under hypoxia, there was an increased flux of Trp through dopa decarboxylase (DDC), which converts Trp to tryptamine and subsequently also through indolethylamine methyltransferase (INMT), which further methylates tryptamine to methyltryptamine and dimethyltryptamine (DMT) (Figure 2B). These results indicate that reduced oxygen availability reduces Trp metabolism down the KP, while promoting the production of tryptamine and its downstream metabolites.
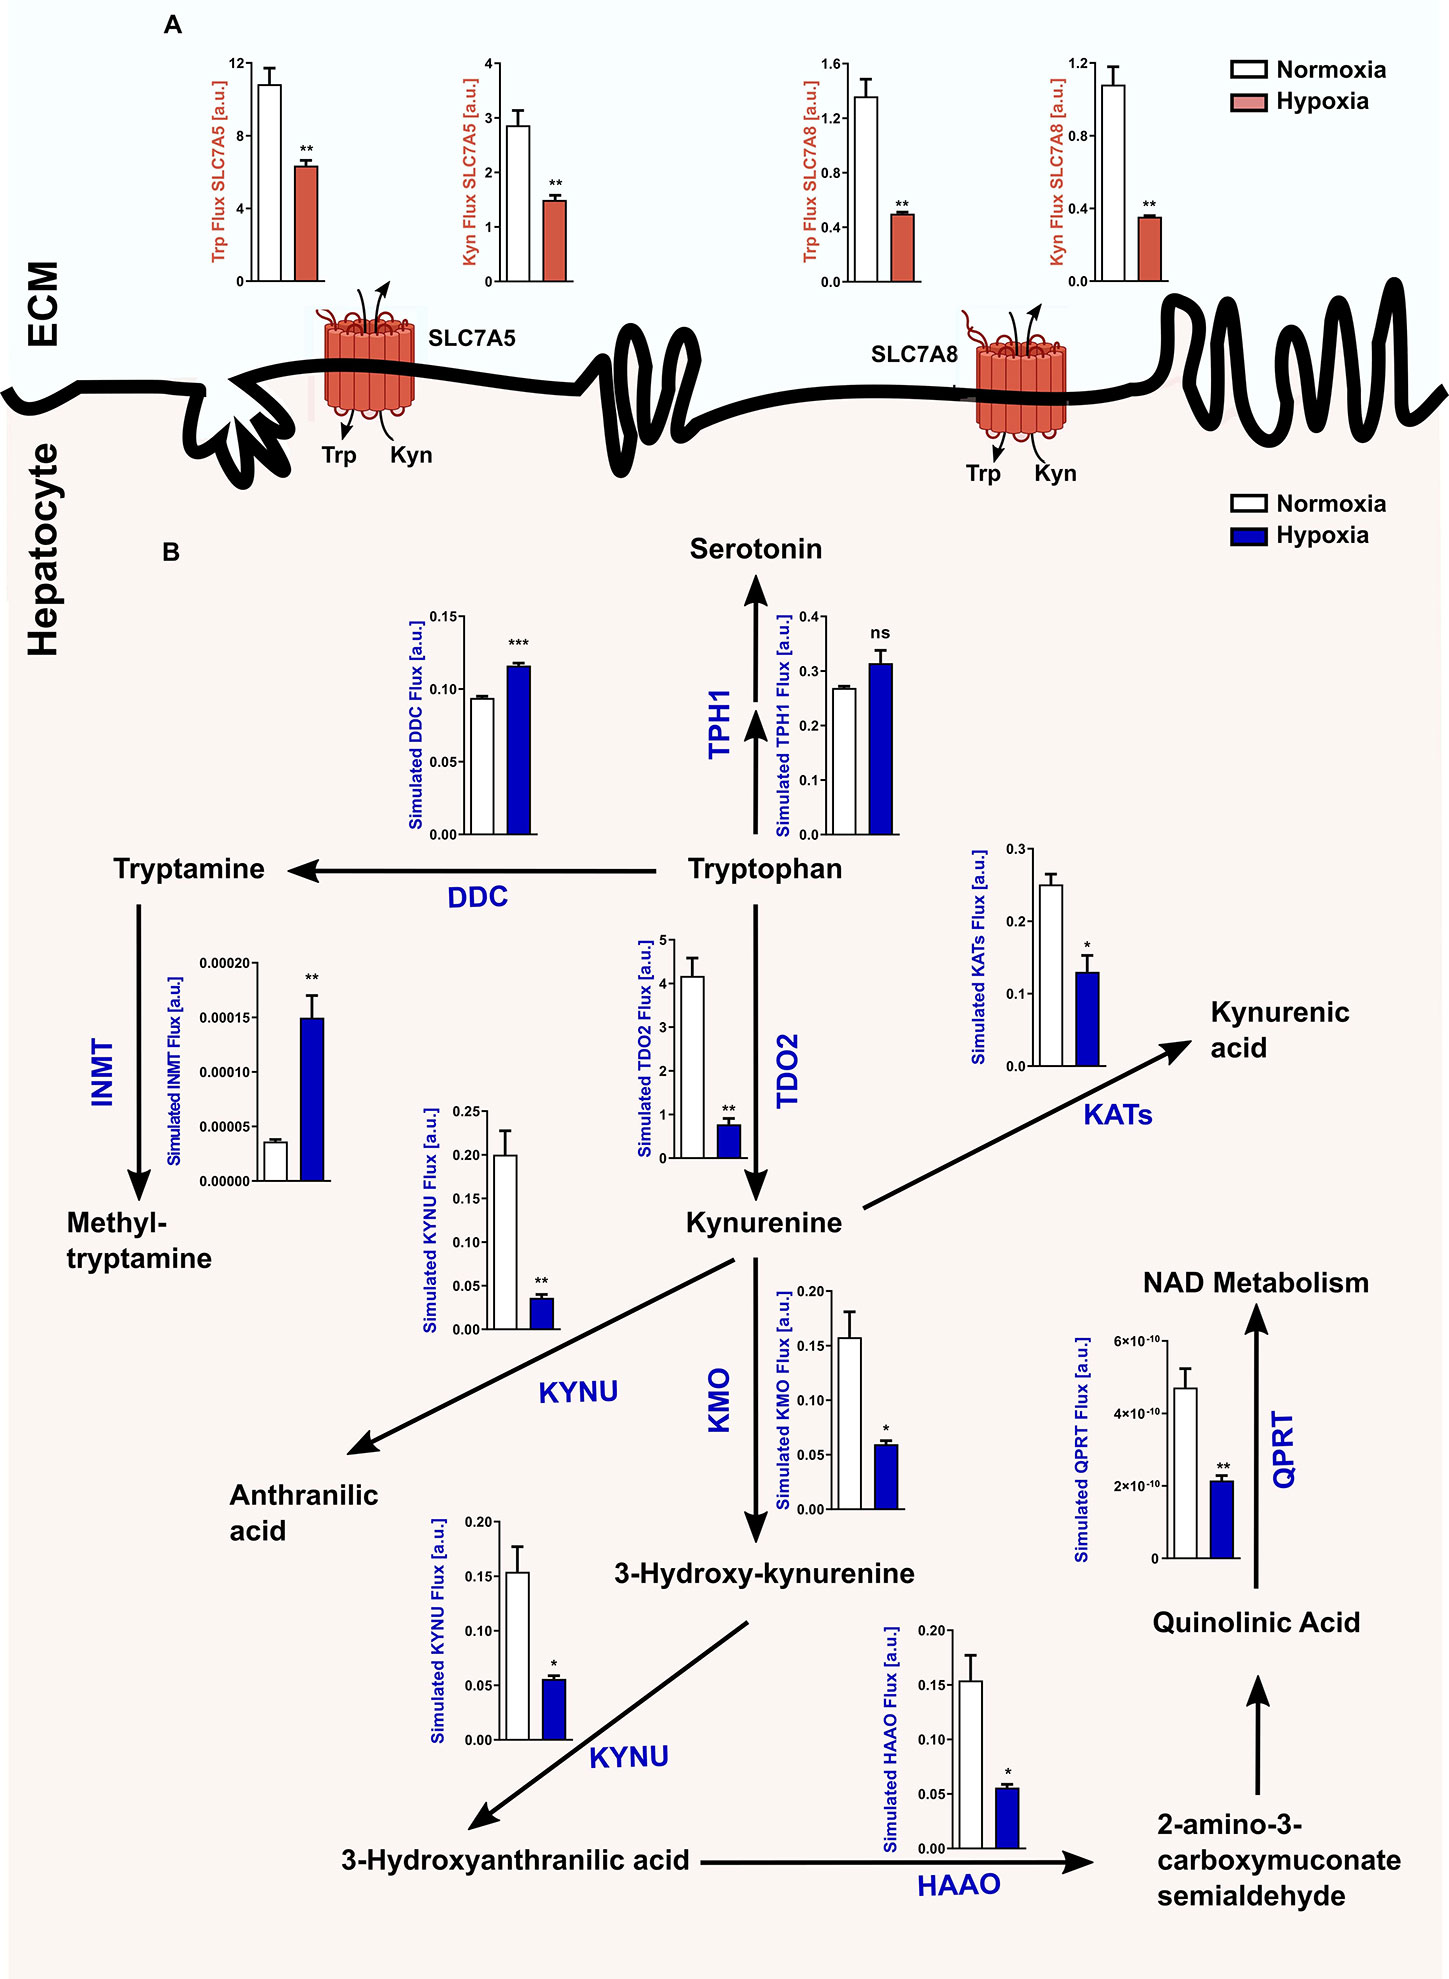
Figure 2 Reduced Tdo2 expression leads to reduced Trp flux through the kynurenine pathway (KP). (A) Predicted flux through the large amino acid transporters SLC7A5 and SLC7A8 in hepatocytes under hypoxia (maroon bars) as compared to control normoxic hepatocytes (white bars). The abbreviations used for the transporters are SLC7A5—large neutral amino acids transporter small subunit 1 (LAT1) and SLC7A8—large neutral amino acids transporter small subunit 2 (LAT2). ECM – extracellular matrix (n=3). (B) Graphical depiction of the changes in the flux through the different enzymes involved in the Trp metabolic pathway upon exposure to either normoxia (white bars) or hypoxia (blue bars). Microarray data generated from primary murine hepatocytes exposed to either 48 h hypoxia or normoxia as described in Figure 1A, was integrated into a mathematical model of Trp metabolism to calculate the fluxes through the different enzymes. (n=3) The abbreviations used for the enzyme names are DDC: dopa decarboxylase; TPH1: L-tryptophan hydroxylase 1; IL4I1: interleukin 4 induced 1; INMT: indolethylamine methyltransferase; KATs: kynurenine aminotransferases; KYNU: kynureninase; KMO: kynurenine 3-monooxygenase; HAAO: hydroxyanthranilic acid oxidase and QPRT: quinolinic acid phosphoribosyltransferase. Data represented as mean ± S.E.M. Statistical significance is assumed at p < 0.05 (*p < 0.05, **p < 0.01, ***p < 0.001). ns, not significant.
Gene expression analysis by microarray revealed that the expression of TDO2 and other KP enzymes was reduced under hypoxic exposure, while expression of non-KP enzymes such as INMT was increased upon reduced oxygen availability (Figure 3A), which was confirmed by qRT-PCR analysis (Figures 3B–G).
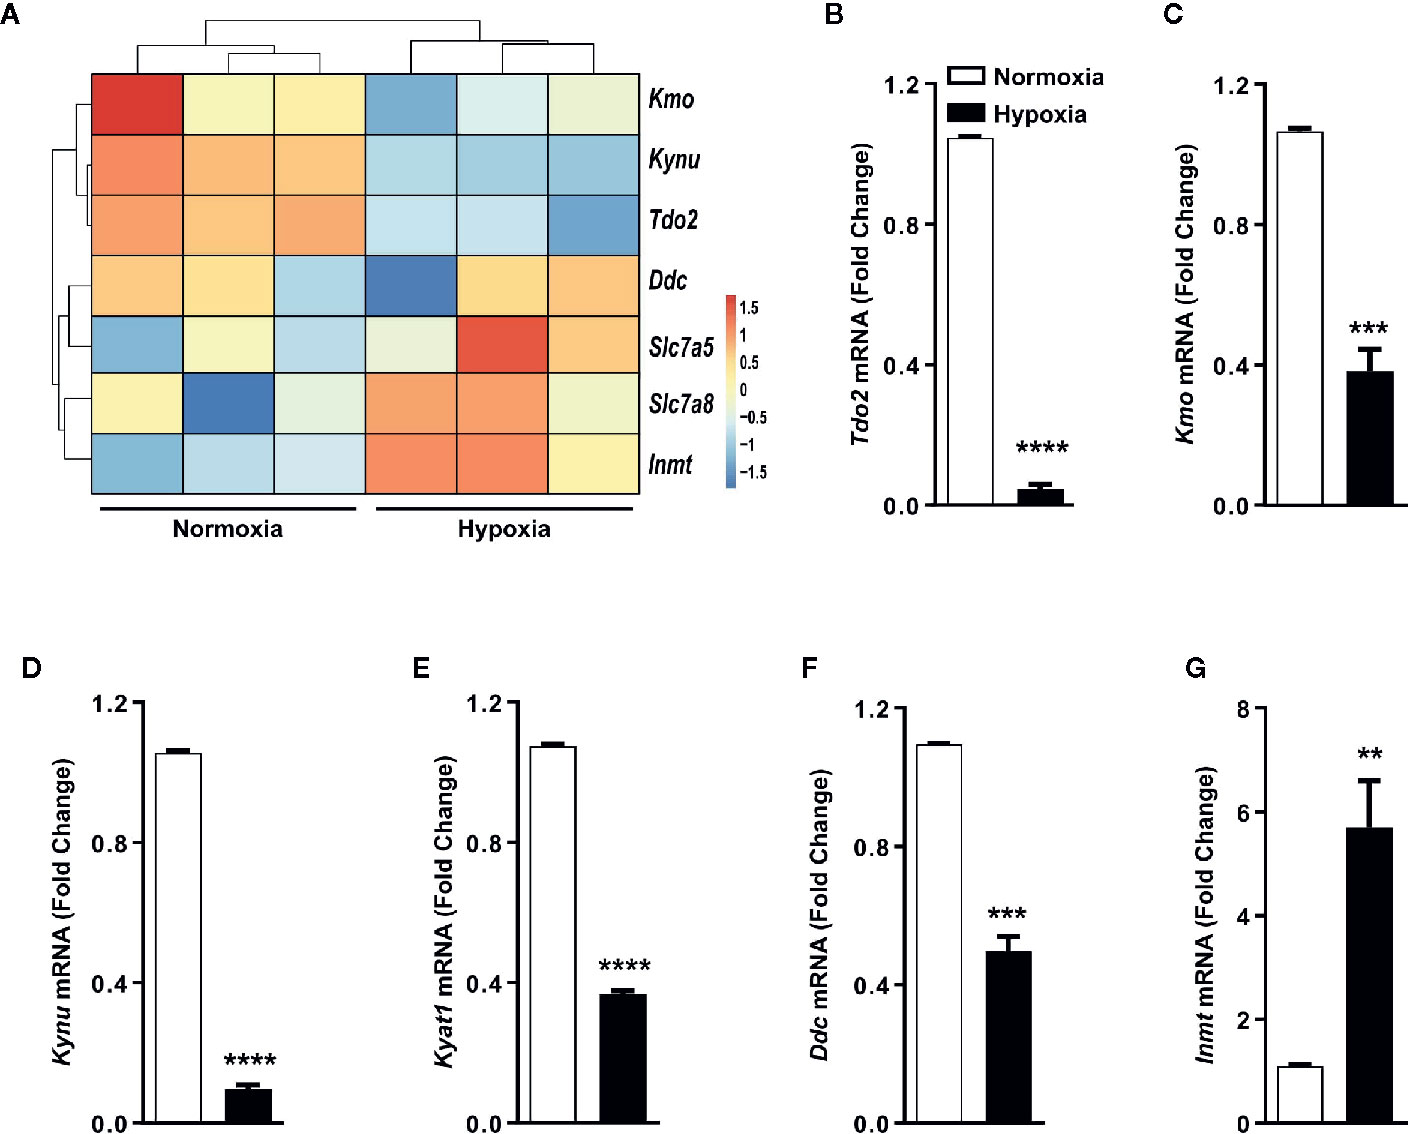
Figure 3 Trp transporters and other Trp pathway enzymes are differentially regulated by hypoxia. (A) Heatmap depicting microarray data as in Figure 1A used for generating the Trp metablic model, showing the differential regulation of mRNA expression of Trp pathway enzymes and Trp transporters under hypoxia. (n=3) (B–G) Expression of Trp pathway enzymes mRNA measured by (q)RT-PCR validating the microarray data for expression of (B) Tdo2, (C) Kmo, (D) Kynu, (E) Kyat1, (F) Ddc, (G) Inmt. (n=3) Data represented as mean ± S.E.M. Statistical significance is assumed at p < 0.05 (**p < 0.01, ***p < 0.001, ****p ≤ 0.0001).
Next using the aforementioned Trp model, we carried out in silico predictions which depicted reduced KP metabolite concentrations downstream of TDO2 (blue plots, Figures 4A–E). The increased flux through DDC as observed earlier in Figure 2B, was also reflected in the simulated tryptamine concentration (blue plot, Figure 4F). These modelling results are indicative of the possibility of an extensive reprogramming of Trp metabolism in hepatocytes upon exposure to hypoxia. To verify these in silico predictions, we next performed metabolic analysis of the hepatocytes cultured under hypoxic conditions for 48 h, which revealed a diminished intracellular Trp pool under hypoxia (black plot, Figure 4A), which is in line with the predicted reduction in Trp uptake by LAT1 and LAT2 (Figure 2A). The intracellular concentrations of Kyn (black plot, Figure 4B), 3HAA (black plot, Figure 4C) and KynA (black plot, Figure 4D) were also significantly reduced in hepatocytes exposed to oxygen restricted conditions.
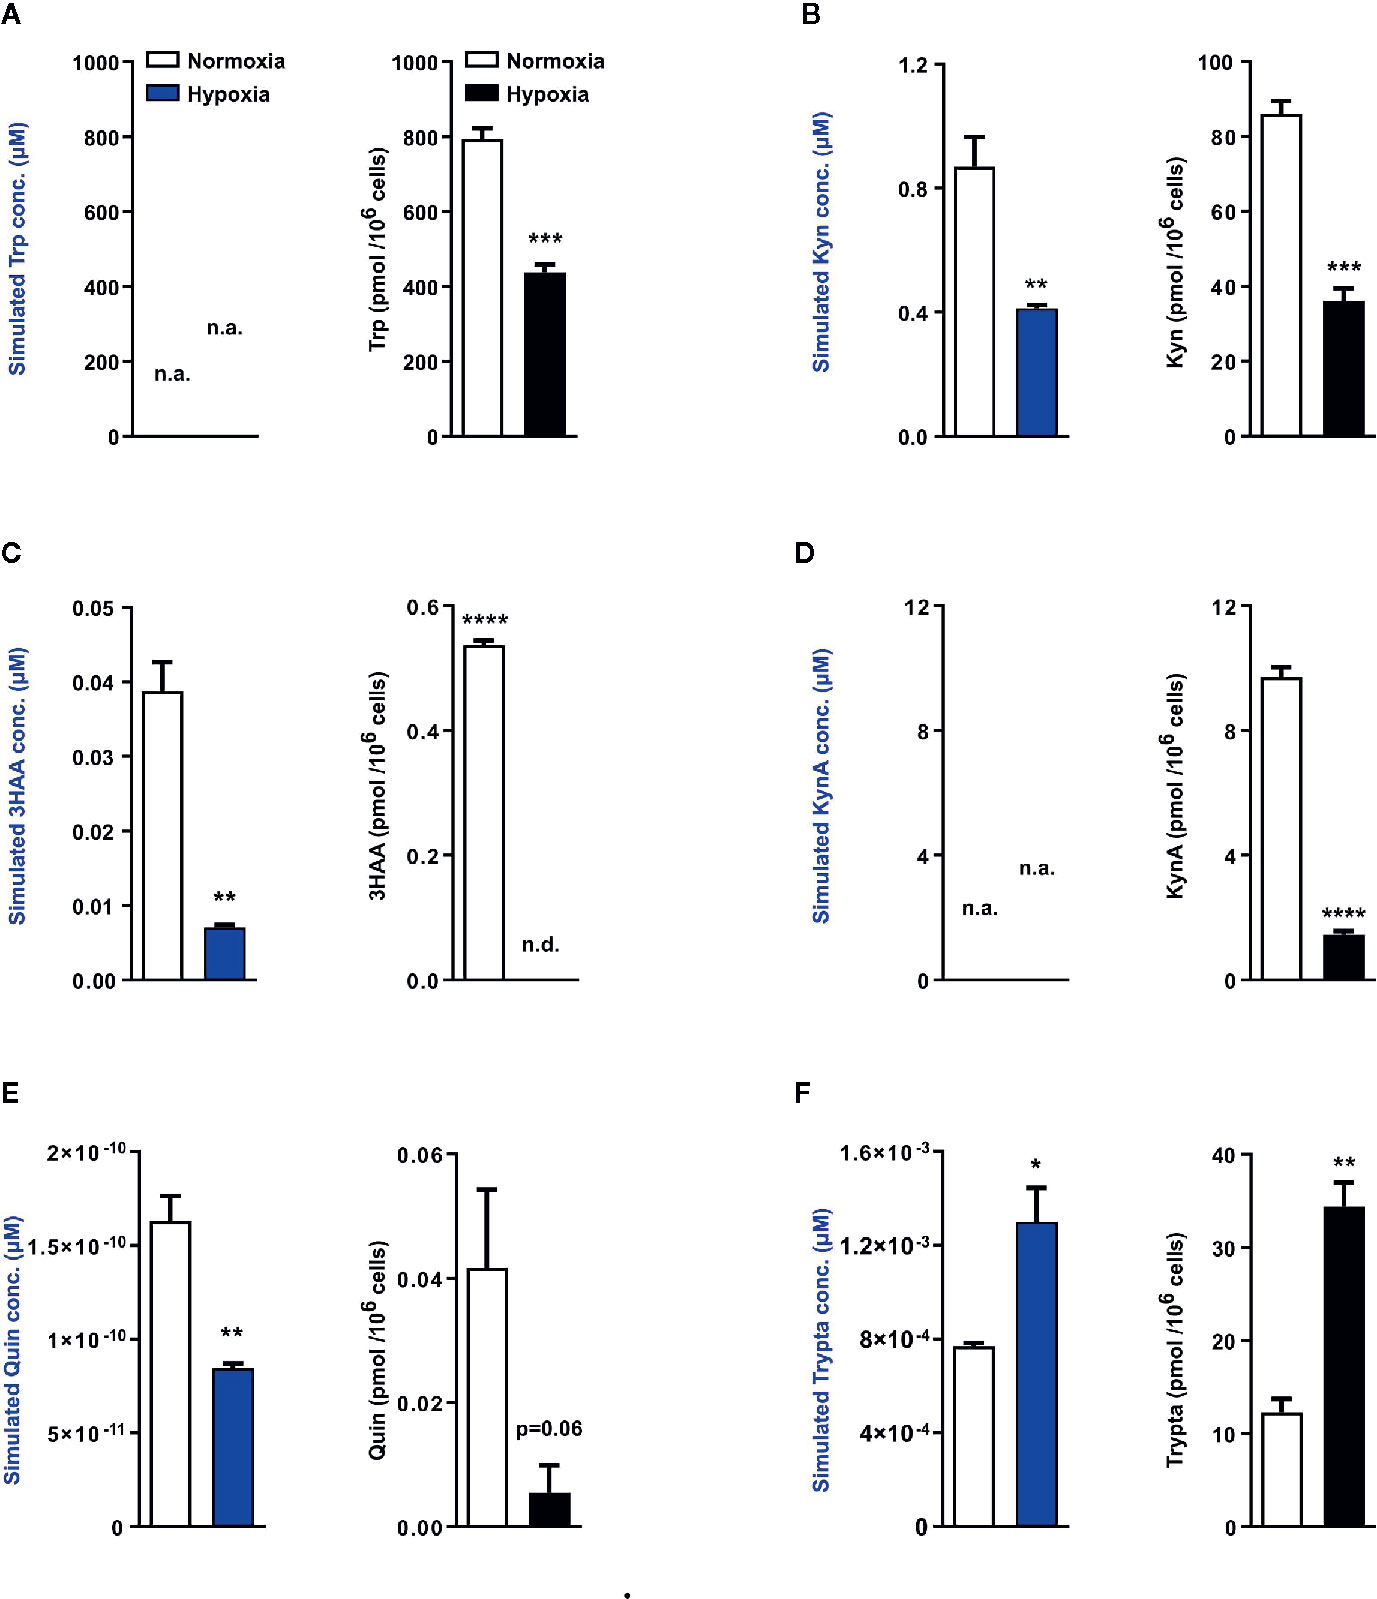
Figure 4 Mathematical modelling and uHPLC measurements predicts a complete rewiring of hepatic Trp catabolism under hypoxia. Using the microarray data as described in Figure 2, the model predicts the intracellular metabolite concentrations in primary murine hepatocytes exposed to normoxia (white bars) or hypoxia (blue bars) for 48 h (n=3). uHPLC measurements of intracellular metabolite concentrations of hepatocytes cultured for 48 h either under normoxia (white bars) or hypoxia (black bars) (n=3). These plots reveal intracellular predictions for changes in concentration and actual measured intracellular concentrations of various Trp metabolic products (A) tryptophan (Trp), (B) kynurenine (Kyn), (C) 3-hydroxyanthranilic acid (3HAA), (D) kynurenic acid (KynA), (E) quinolinic acid (Quin) and (F) tryptamine (Trypta). The external Trp concentration is kept constant and is fed as an input into the model thus predictions for Trp changes are not available, while the model lacks sufficient enzymatic parameters for KynA change predictions therefore the respective plots indicate n.a., not available. Data represented as mean ± S.E.M. Statistical significance is assumed at p < 0.05 (*p < 0.05, **p < 0.01, ***p < 0.001, ****p ≤ 0.0001). n.d. - not detected/below detection limit.
The quinolinic acid levels measured in hypoxic hepatocytes were also decreased (black plot, Figure 4E), validating the predicted reduction in quinolinic acid (blue plot, Figure 4E). This hypoxia induced decrease in quinolinic acid, a precursor required for de novo NAD synthesis, resulted in reduced abudance of NAD, NADH, NADPH as well as other energy currencies in the hepatocytes (Figure S1A–S1E). Of note, in line with the prediction of increased tryptamine levels under hypoxia (blue plot, Figure 4F), a significantly increased concentration of tryptamine was measured inside hypoxic hepatocytes (black plot, Figure 4F). Taken together, these metabolic measurements validate the results of the Trp metabolic model and demonstrate that in hepatocytes hypoxic exposure restricts the KP, while simultaneously channeling Trp towards tryptamine production.
A majority of the cellular effects of hypoxia are known to be mediated by stabilization of the HIF master regulators. Therefore, we next explored if HIFs also regulate the metabolic fate of Trp in hepatocytes. To this end, we employed the well-known chemical hypoxia mimetic dimethyloxalylglycine (DMOG), which acts by inhibiting the prolyl-hydroxylase enzymes and thus stabilizes the HIF proteins even under sufficient oxygen availability. Upon exposure to DMOG, cultured primary mouse hepatocytes significantly upregulated the HIF-controlled hypoxia response gene Ndrg1 (Figure 5A), while simultaneously downregulating the expression of Tdo2 (Figure 5B).
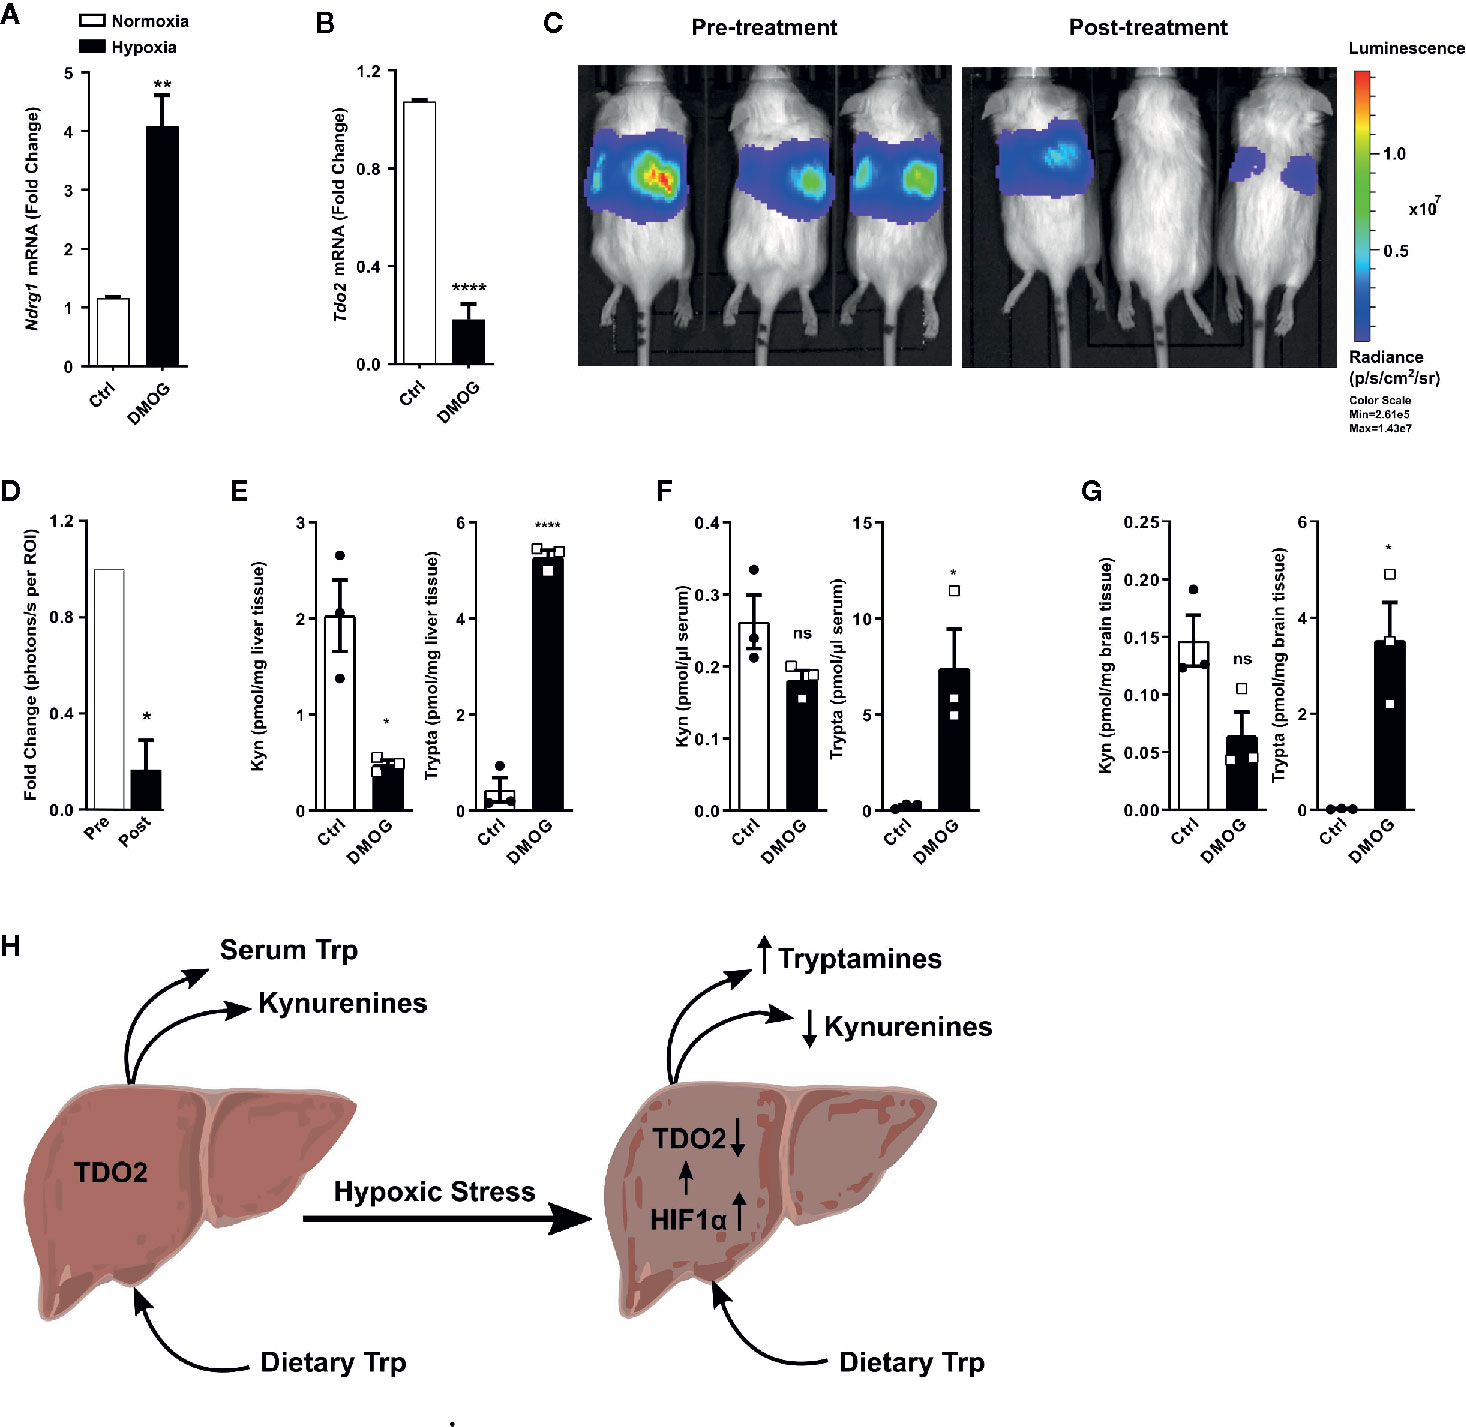
Figure 5 HIF stabilization suppresses hepatic Tdo2 expression, resulting in elevated tryptamine levels in the liver, serum and brain. (A) mRNA expression analysis of Ndrg1 by (q)RT-PCR in primary murine hepatocytes upon HIF stabilization by exposure to 3 mM DMOG for 24 h. (n=4) (B) Expression of Tdo2 mRNA in primary murine hepatocytes after treatment with 3 mM of the HIF-stabilizing agent, DMOG for 24 h. (n=4) (C) IVIS image of 6 weeks old Tdo2 reporter mice at baseline pre DMOG treatment (left) and 24 h post DMOG treatment (right). (D) Quantification of the bioluminescence signal measured by IVIS (n=3). (E–G) LC-MS/MS based measurements of kynurenine and tryptamine levels in (E) liver tissue, (F) serum and (G) brain tissue of WT C57BL/6 mice treated with saline control (white bars) or 8 mg/mouse DMOG (black bars) for 24 h (n=3). (H) Graphical summary depicting increased tryptamine and decreased kynurenine production in liver under hypoxic stress, due to reduced TDO2 expression. Data are expressed as mean ± S.E.M. Statistical significance is assumed at p < 0.05 (*p < 0.05, **p < 0.01, ****p ≤ 0.0001). ns, not significant.
To explore whether the downregulation of Tdo2 upon HIF stabilisation also occurs in vivo, we utilised Tdo2 reporter mice (35). In these mice, the Tdo2 gene sequence has been switched with a luciferase gene, which is still under the regulatory control of the Tdo2 promoter, thus enabling the study of Tdo2 gene expression in vivo. For the current study, these mice were subjected to an initial baseline bioluminescence measurement (Figure 5C, left) immediately before treatment with DMOG. Twenty-four hours post DMOG treatment, a second bioluminescence measurement was performed. The bioluminescence signal intensity was strongly reduced after DMOG treatment (Figure 5C, right) as compared to the baseline measurement. Quantification of the bioluminescence revealed a significant reduction in signal intensity in response to DMOG (Figure 5D), which signifies less expression of Tdo2.
We next investigated the HIF-induced changes in Trp homeostasis in vivo. Metabolic measurements revealed that after 24 h of DMOG treatment the Kyn levels in the livers of the mice were significantly reduced, while a trend towards reduced Kyn levels was observed in the serum and the brain tissue of the mice (Figures 5E–G). Of note, significantly elevated levels of tryptamine were measured in the liver, serum and brain of DMOG treated mice (Figures 5E–G). Taken together these results show that HIF stabilization in vivo results in an increased production of tryptamines, while simultaneously reducing KP metabolites (Figure 5H).
Many reports associate the AHR with Trp metabolite dependent cellular effects (36). We therefore hypothesized that the reduced production of Kyn and downstream metabolites under hypoxia could potentially reduce AHR activity in the hepatocytes. To check the status of AHR activation in the hypoxic hepatocytes, we explored the expression data generated by the microarray in Figure 1A. The top table (Table S2) revealed the upregulation of many well-known AHR target genes (listed in Table 1). Furthermore, bioinformatics analysis of the data also revealed genes in the Reactome_Xenobiotics pathway to be one of the top 10 upregulated curated pathways in hypoxic hepatocytes (Figure S2A).
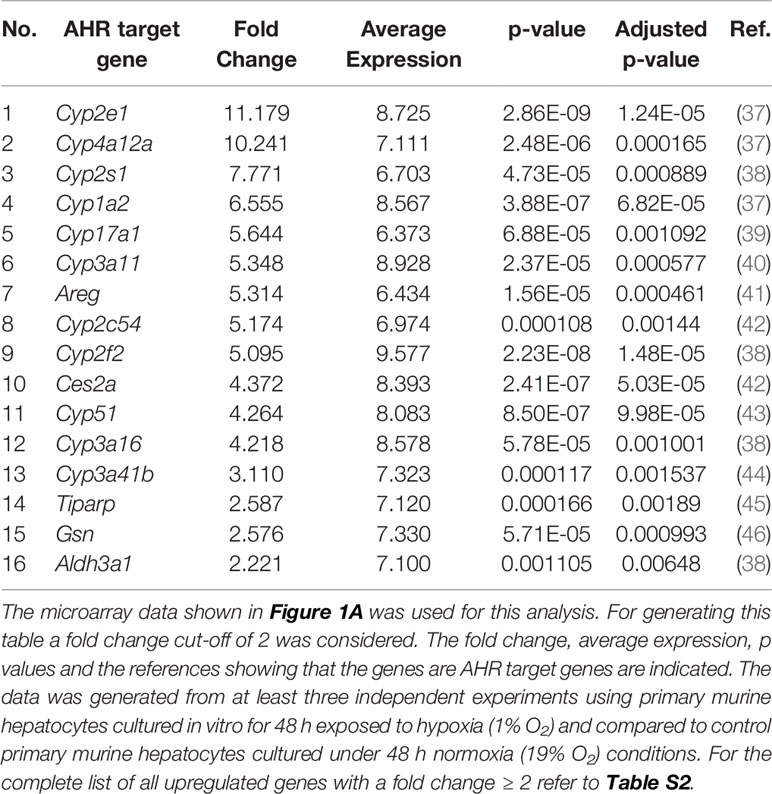
Table 1 Top known AHR target genes, whose expression was upregulated under hypoxia.
Previous studies reported tryptamine-mediated AHR activation (47). We therefore hypothesized that the observed AHR activity under hypoxia could be attributed to the increased tryptamine levels. To test this hypothesis, we treated murine hepatocytes with tryptamine. Tryptamine treatment induced the mRNA expression levels of the two well-known AHR target genes Areg and Tiparp (Figures S2B, S2C), suggesting that tryptamine increases AHR activity upon accumulation. Taken together, these observations are indicative of maintainance of AHR-mediated transcriptional activity in hypoxic hepatocytes even upon reduced KP metabolite production.
In the human body, the liver is at the very core of a range of systemically important processes such as digestion, nutrient absorption, detoxification, immunity, as well as the regulation of systemic nutrient availability and metabolism (1, 3, 48). Trp catabolism represents one such systemically important process, in which the liver plays a central role (4). Many ailments of the liver as well as circulatory and pulmonary systems can adversely impact hepatic blood flow and oxygen availability, thus resulting in portal hypoxemia and subsequent hepatic hypoxia (49, 50). Occurrence of hepatic hypoxia can impair hepatic functionality and thus adversely affect systemic metabolic homeostasis. Recent reports have highlighted hypoxia-mediated changes in the expression of hepatic glucose and lipid metabolic pathway genes resulting in altered liver metabolism (3, 51, 52).
In light of the aforementioned reports and given the importance of the liver in systemic Trp metabolism, we explored the effects of hypoxia on hepatic Trp homeostasis. Our results indicated that under hypoxia, murine hepatocytes downregulated the expression of Tdo2 (Figure 1). Microarray analysis and qRT-PCR analyses also revealed differential expression of different Trp pathway transporters and enzymes under exposure to oxygen limiting conditions (Figure 3). The discovery of this regulatory effect aroused our curiosity regarding the effect of hypoxia on the production of different Trp metabolites both dependent as well as independent of TDO2. Modelling of Trp metabolism as well as metabolic measurements showed that hypoxia significantly reduced the flow of Trp into the KP, thus resulting in the reduced production of KP metabolites such as Kyn, KynA, 3HAA and QA (Figures 2 and 4), many of whom play a role in systemically important processes such as immune modulation, neuro-transmission and are also precursor feeder molecules into other metabolic pathways such as the de-novo NAD synthesis pathway. Furthermore, our experiments also revealed the simultaneous channeling of Trp metabolism towards non-KP pathways under hypoxia. In line, increased Trp flux through the non-KP enzyme DDC (Figure 2B) led to increased production of the Trp metabolite tryptamine (Figure 4F) in liver hepatocytes. Previous reports of elevated tryptamine levels in patients with hypoxic liver cirrhosis (53) and in rat models of chronic ischemic tissue hypoxia (54) are consistent with our findings. Taken together, the previous reports and our current findings, establish the presence of extensively remodelled Trp metabolic pathways in the liver under pathological as well as induced hypoxic conditions, which favours increased production of tryptamine.
Tryptamine is a trace amine and it lends its name to a broad class of serotonergic hallucinogens or psychedelic compounds, long known to induce episodes of psychosis, hallucinations or altered states of consciousness (55, 56). Tryptamine and its downstream hallucinogenic metabolites including DMT are found endogenously in mammalian brain although in trace amounts (57, 58). A two step methylation of tryptamine, catalysed by indolethylamine methyltransferase (INMT), first gives rise to methyl-tryptamine and subsequently DMT (59). Our in silico data showed a significantly increased flux through INMT under hypoxic conditions (Figure 2B), which could potentially lead to increased methyl-tryptamine and DMT levels. Numerous reports indicate the occurrence of altered states of consciousness among non-acclimatized high altitude climbers and hikers (47, 60–63). Apart from the reduced oxygen availability to the brain, our current results (Figures 4F and 5E–G) suggest that such experiences could be caused by increased levels of endogenous psychedelic compounds such as tryptamine and DMT. Furthermore, abnormal behavioural patterns are also common in hepatic encephalopathy, where prior studies have reported enhanced levels of endogenous tryptamines (53, 64–67), which could now be attributed to the widespread prevalence of hypoxia in the diseased liver. In addition, increased levels of DMT can potentially constitute a feedback protection mechanism against hypoxic injury via the Sigma-1 receptor, through decreased expression of the master hypoxic transcription regulator HIF protein (58).
The liver plays an important role in systemic immune tolerance, as its specially configured microenvironment hosts a repertoire of antigen presenting cells (APCs), which promotes tolerance against a range of harmless antigens often found in the diet (68, 69). These resident APCs enforce immunosuppression by production of anti-inflammatory cytokines and expression of programmed cell death ligand 1 (PD-L1) (70). Furthermore, hepatic resident APCs such as Kupffer cells are also known to employ the immunosuppressive effects of Trp catabolism in response to an inflammatory stimulus (71). The immunosuppressive effects of Trp catabolism can be mediated by a two-pronged strategy, first by depletion of Trp, as Trp is essential for the proliferation and activity of liver-infiltrating T cells (72, 73) and secondly by the AHR-mediated immunosuppressive action of the KP metabolites, as has frequently been described in extra-hepatic systems such as the placenta (74) and different types of cancers (36, 75, 76).
Mindful of the role of AHR in immune tolerance, the observed hypoxic suppression of KP metabolite production could potentially affect hepatic AHR activation and thus hamper the immunological balance of the hepatic microenvironment. However, to our surprise, we found several well-known AHR target genes as well as the Reactome_Xenobiotics pathway upregulated in hypoxic hepatocytes (Tables 1, S2 and Figure S2A). Our experimental results revealed that accumulation of tryptamine can potentially maintain AHR activity (Figures S2B, S2C). Apart from the previously discussed psychedelic effects of tryptamine, both endogenous tryptamine as well as tryptamine of gut microbial origin have been reported to posses immune-modulatory effects mediated via AHR activation (47, 60–63). Together, previous reports as well as data from the current study clearly indicate towards the effective maintainance of essential immunosuppresive AHR activation in hepatic cells exposed to hypoxia, which could be attributed to increased production and accumulation of other non-KP Trp metabolites such as tryptamine.
In summary, our results demonstrate the conservation of HIF-mediated suppression of Trp catabolism along the KP both in malignant as well as primary cells constitutively expressing TDO2, which illustrates the significance of this mechanism not only in pathology but also in normal physiology. In the liver cells, this suppression leads to the complete re-wiring of the Trp metabolic pathways favouring the tryptamine branch. However, the increase in tryptamine generated through DDC, the only Trp-metabolizing enzyme which does not require oxygen, appears to be specific for hepatocytes as an increase in tryptamine was not observed in hypoxic glioblastoma cells (21). This channeling of Trp into tryptamine and its downstream metabolites methyl-tryptamine and DMT could explain the “out of the body” experiences reported under oxygen-limited conditions. Furthermore, the hypoxic upregulation of the tryptamine branch of Trp metabolism, could potentially be the reason for the maintainance of immunosuppresive AHR activation despite the suppression of the KP branch of Trp catabolism.
The datasets generated during this study are available publicly in the Gene Expression Omnibus 429 (GEO) repository under accession number GSE159320.
The animal study was reviewed and approved by Regierungspräsidium, Karlsruhe, Germany.
SM and CO designed the study. SM, GP, and CO developed methodology. PL and UK isolated primary murine hepatocytes. TL and MP developed and provided Tdo2 reporter mice. SM, HG, and GP acquired data. SM, AS, SS, GP, HG, IH, and CO analyzed and interpreted data. SM and CO wrote the manuscript. All authors contributed to the article and approved the submitted version.
This work was supported by grants from the BMBF e:Med initiative (GlioPATH, 01ZX1402), the European Union’s Horizon 2020 research and innovation programme under Grant 754688 (MESI-STRAT), DFG grant 406052676, PL-315/5-1 and the Liver Systems Medicine network (LiSyM, 031L0042).
The authors declare that the research was conducted in the absence of any commercial or financial relationships that could be construed as a potential conflict of interest.
We thank the Microarray Unit of the DKFZ Genomics and Proteomics Core Facility for excellent services. We thank Dr. Artyom Vlasov, Ina Schmitt, Sandra Bonefas, and Lena Postawa for isolation of primary hepatocytes.
The Supplementary Material for this article can be found online at: https://www.frontiersin.org/articles/10.3389/fimmu.2021.590532/full#supplementary-material
Supplementary Figure 1 | Hypoxia downregulates cellular energetics in cultured murine hepatocytes. LC-MS/MS measurements of intracellular energy currencies in hepatocytes cultured for 48 h either under normoxia (white bars) or hypoxia (black bars) (n=4). These plots reveal intracellular concentrations of (A) nicotinamide adenine dinucleotide (NAD), (B) reduced NAD (NADH), (C) reduced nicotinamide adenine dinucleotide phosphate (NADPH), (D) adenosine diphosphate (ADP) and (E) adenosine triphosphate (ATP) Data represented as mean ± S.E.M. Statistical significance is assumed at p < 0.05 (*p < 0.05, **p < 0.01, ***p <0.001, ****p ≤ 0.0001). n.d. - not detected/below detection limit.
Supplementary Figure 2 | (A) Top 20 differentially enriched curated pathways, with top 10 up-regulated (orange) and top 10 down-regulated (green) pathways in the microarray data shown in Figure 1A. The data was generated from at least three independent experiments using primary murine hepatocytes after exposure to 48 h hypoxia (1% O2) compared to control hepatocytes exposed to 48 h normoxia (19% O2). (B) Analysis of AHR activation upon treatment of murine hepatocytes with tryptamine by (q)RT-PCR based mRNA expression analysis of the AHR target gene Areg (n=3) (C). AHR activity test as described in B by (q)RT-PCR based mRNA expression analysis of the AHR target gene Tiparp (n=3) Data are expressed as mean ± S.E.M. Statistical significance is assumed at p < 0.05 (*p < 0.05, **p < 0.01, ****p ≤ 0.0001).
Supplementary Table 2 | Complete list of all upregulated genes in hypoxic primary murine hepatocytes with a fold change ≥ 2.
1. Knell AJ. Liver function and failure: the evolution of liver physiology. J R Coll Phys Lond (1980) 14:205–8.
2. Kietzmann T. Liver zonation in health and disease: Hypoxia and hypoxia-inducible transcription factors as concert masters. Int J Mol Sci (2019) 20:2347. doi: 10.3390/ijms20092347
3. Suzuki T, Shinjo S, Arai T, Kanai M, Goda N. Hypoxia and fatty liver. World J Gastroenterol (2014) 20:15087–97. doi: 10.3748/wjg.v20.i41.15087
4. Badawy AAB. Kynurenine pathway of tryptophan metabolism: Regulatory and functional aspects. Int J Tryptophan Res (2017) 10:1–20. doi: 10.1177/1178646917691938
5. Bender DA. Biochemistry of Tryptophan and Disease. Mol Asp Med (1982) 6:101–97. doi: 10.1016/0098-2997(83)90005-5
6. Platten M, Nollen E, Fallarino F, Rohrig U, Opitz CA. Tryptophan metabolism as a common therapeutic target in cancer, neurodegeneration and beyond. Nat Rev Drug Discovery (2019) 18:379–401. doi: 10.1038/s41573-019-0016-5
7. Cheong JE, Sun L. Targeting the IDO1 / TDO2 – KYN – AhR Pathway for Cancer Immunotherapy – Challenges and Opportunities. Trends Pharmacol Sci (2017) 39:307–25. doi: 10.1016/j.tips.2017.11.007
8. Opitz CA, Wick W, Steinman L, Platten M. Tryptophan degradation in autoimmune diseases. Cell Mol Life Sci (2007) 64:2542–63. doi: 10.1007/s00018-007-7140-9
9. Anavi S, Madar Z, Tirosh O. Non-alcoholic fatty liver disease, to struggle with the strangle: Oxygen availability in fatty livers. Redox Biol (2017) 13:386–92. doi: 10.1016/j.redox.2017.06.008
10. Ayabe H, Anada T, Kamoya T, Sato T, Kimura M, Yoshizawa E, et al. Optimal Hypoxia Regulates Human iPSC-Derived Liver Bud Differentiation through Intercellular TGFB Signaling. Stem Cell Rep (2018) 11:306–16. doi: 10.1016/j.stemcr.2018.06.015
11. Schadde E, Tsatsaris C, Swiderska-Syn M, Breitenstein S, Urner M, Schimmer R, et al. Hypoxia of the growing liver accelerates regeneration. Surgery (2017) 161:666–79. doi: 10.1016/j.surg.2016.05.018
12. Semenza GL. HIF-1 mediates metabolic responses to intratumoral hypoxia and oncogenic mutations. J Clin Invest (2013) 123:3664. doi: 10.1172/JCI67230.3664
13. Chua YL, Dufour E, Dassa EP, Rustin P, Jacobs HT, Taylor CT, et al. Stabilization of hypoxia-inducible factor-1α protein in hypoxia occurs independently of mitochondrial reactive oxygen species production. J Biol Chem (2010) 285:31277–84. doi: 10.1074/jbc.M110.158485
14. Tamagawa K, Horiuchi T, Uchinami M, Doi K, Yoshida M, Nakamura T, et al. Hepatic Ischemia-Reperfusion Increases Vascular Endothelial Growth Factor and Cancer Growth in Rats. J Surg Res (2008) 148:158–63. doi: 10.1016/j.jss.2007.12.787
15. Cursio R, Miele C, Filippa N, Van Obberghen E, Gugenheim J. Liver HIF-1 Alpha Induction Precedes Apoptosis Following Normothermic Ischemia-Reperfusion in Rats. Transplant Proc (2008) 40:2042–5. doi: 10.1016/j.transproceed.2008.05.037
16. Nath B, Levin I, Csak T, Petrasek J, Mueller C, Kodys K, et al. Hepatocyte-specific hypoxia-inducible factor-1α is a determinant of lipid accumulation and liver injury in alcohol-induced steatosis in mice. Hepatology (2011) 53:1526–37. doi: 10.1002/hep.24256
17. Moon JOK, Welch TP, Gonzalez FJ, Copple BL. Reduced liver fibrosis in hypoxia-inducible factor-1α-deficient mice. Am J Physiol - Gastrointest Liver Physiol (2009) 296:582–92. doi: 10.1152/ajpgi.90368.2008
18. Nasimuzzaman M, Waris G, Mikolon D, Stupack DG, Siddiqui A. Hepatitis C Virus Stabilizes Hypoxia-Inducible Factor 1 and Stimulates the Synthesis of Vascular Endothelial Growth Factor. J Virol (2007) 81:10249–57. doi: 10.1128/jvi.00763-07
19. Nakamura K, Zen Y, Sato Y, Kozaka K, Matsui O, Harada K, et al. Vascular endothelial growth factor, its receptor Flk-1, and hypoxia inducible factor-1α are involved in malignant transformation in dysplastic nodules of the liver. Hum Pathol (2007) 38:1532–46. doi: 10.1016/j.humpath.2007.03.002
20. Tanaka H, Yamamoto M, Hashimoto N, Miyakoshi M, Tamakawa S, Yoshie M, et al. Hypoxia-independent overexpression of hypoxia-inducible factor 1α as an early change in mouse hepatocarcinogenesis. Cancer Res (2006) 66:11263–70. doi: 10.1158/0008-5472.CAN-06-1699
21. Mohapatra SR, Sadik A, Tykocinski LO, Dietze J, Poschet G, Heiland I, et al. Hypoxia Inducible Factor 1α Inhibits the Expression of Immunosuppressive Tryptophan-2,3-Dioxygenase in Glioblastoma. Front Immunol (2019) 10:2762. doi: 10.3389/fimmu.2019.02762
22. Ott M, Litzenburger UM, Rauschenbach KJ, Bunse L, Ochs K, Sahm F, et al. Suppression of TDO-mediated tryptophan catabolism in glioblastoma cells by a steroid-responsive FKBP52-dependent pathway. Glia (2015) 63:78–90. doi: 10.1002/glia.22734
23. Sobotta S, Raue A, Huang X, Vanlier J, Jünger A, Bohl S, et al. Model based targeting of IL-6-induced inflammatory responses in cultured primary hepatocytes to improve application of the JAK inhibitor ruxolitinib. Front Physiol (2017) 8:775. doi: 10.3389/fphys.2017.00775
24. Wenger R, Kurtcuoglu V, Scholz C, Marti H, Hoogewijs D. Frequently asked questions in hypoxia research. Hypoxia (2015) 3:35–43. doi: 10.2147/hp.s92198
25. Okuda T, Higashi Y, Kokame K, Tanaka C, Kondoh H, Miyata T. Ndrg1-Deficient Mice Exhibit a Progressive Demyelinating Disorder of Peripheral Nerves. Mol Cell Biol (2004) 24:3949–56. doi: 10.1128/mcb.24.9.3949-3956.2004
26. Fuertig R, Ceci A, Camus SM, Bezard E, Luippold AH, Hengerer B. LC-MS/MS-based quantification of kynurenine metabolites, tryptophan, monoamines and neopterin in plasma, cerebrospinal fluid and brain. Bioanalysis (2016) 8:1903–17. doi: 10.4155/bio-2016-0111
27. Sadok I, Rachwał K, Staniszewska M. Application of the optimized and validated LC–MS method for simultaneous quantification of tryptophan metabolites in culture medium from cancer cells. J Pharm BioMed Anal (2019) 176:112805. doi: 10.1016/j.jpba.2019.112805
28. Carvalho BS, Irizarry RA. A framework for oligonucleotide microarray preprocessing. Bioinformatics (2010) 26:2363–7. doi: 10.1093/bioinformatics/btq431
29. You N, Wang X. An empirical Bayes method for robust variance estimation in detecting DEGs using microarray data. J Bioinform Comput Biol (2017) 15:1–14. doi: 10.1142/S0219720017500202
30. Ritchie ME, Phipson B, Wu D, Hu Y, Law CW, Shi W, et al. Limma powers differential expression analyses for RNA-sequencing and microarray studies. Nucleic Acids Res (2015) 43:e47. doi: 10.1093/nar/gkv007
31. Stavrum AK, Heiland I, Schuster S, Puntervoll P, Ziegler M. Model of tryptophan metabolism, readily scalable using tissue-specific gene expression data. J Biol Chem (2013) 288:34555–66. doi: 10.1074/jbc.M113.474908
32. Schäuble S, Stavrum AK, Bockwoldt M, Puntervoll P, Heiland I. SBMLmod: A Python-based web application and web service for efficient data integration and model simulation. BMC Bioinf (2017) 18:1–8. doi: 10.1186/s12859-017-1722-9
33. Hoops S, Gauges R, Lee C, Pahle J, Simus N, Singhal M, et al. COPASI - A COmplex PAthway SImulator. Bioinformatics (2006) 22:3067–74. doi: 10.1093/bioinformatics/btl485
34. Pardridge WM. The Role of Blood-Brain Barrier Transport of Tryptophan Metabolism *. J Neural Transm (1979) 54:43–54. doi: 10.1007/978-3-7091-2243-3_4
35. Lanz TV, Williams SK, Stojic A, Iwantscheff S, Sonner JK, Grabitz C, et al. Tryptophan-2,3-Dioxygenase (TDO) deficiency is associated with subclinical neuroprotection in a mouse model of multiple sclerosis. Sci Rep (2017) 7:41271. doi: 10.1038/srep41271
36. Opitz CA, Somarribas Patterson LF, Mohapatra SR, Dewi DL, Sadik A, Platten M, et al. The therapeutic potential of targeting tryptophan catabolism in cancer. Br J Cancer (2020) 122:30–44. doi: 10.1038/s41416-019-0664-6
37. Reyes-hernandez O, Guzman-leon S, Gonzalez FJ, Celular DB, México DF. 2,3,7,8-Tetrachlorodibenzo-p-dioxin enhances CCl4 -induced hepatotoxicity in an aryl hydrocarbon receptor-dependent manner. Xenobiotica (2013) 43:161–8. doi: 10.3109/00498254.2012.707790.2
38. Sartor MA, Schekenburger M, Marlowe JL, Reichard JF, Wang Y, Fan Y, et al. Genomewide Analysis of Aryl Hydrocarbon Receptor Binding Targets Reveals an Extensive Array of Gene Clusters that Control Morphogenetic and Developmental Programs. Environ Health Perspect (2009) 117:1139–46. doi: 10.1289/ehp.0800485
39. Jablonska O, Shi Z, Valdez KE, Ting AY, Petroff BK. Temporal and anatomical sensitivities to the aryl p -dioxin leading to premature acyclicity with age in rats. Int J Androl (2010) 33:405–12. doi: 10.1111/j.1365-2605.2009.01031.x
40. Fisher CD, Jackson ÆJP, Lickteig AJ, Augustine ÆLM, Cherrington NJ. Drug metabolizing enzyme induction pathways in experimental non-alcoholic steatohepatitis. Arch Toxicol (2008) 82:959–64. doi: 10.1007/s00204-008-0312-z
41. Kubli SP, Bassi C, Roux C, Wakeham A, Göbl C, Zhou W. AhR controls redox homeostasis and shapes the tumor microenvironment in BRCA1-associated breast cancer. PNAS (2019) 116:3604–13. doi: 10.1073/pnas.1815126116
42. Lohr C. Effects of Polychlorinated Dibenzo- p -Dioxins, Polychlorinated Dibenzofurans, and Polychlorinated Biphenyls in Human Liver Cell Models (in vitro) and in Mice (in vivo), Technische Universität Kaiserslautern. (2013). https://kluedo.ub.uni-kl.de/frontdoor/deliver/index/docId/3665/file/Doctoral+thesis_Lohr.neu.pdf.
43. Tanos R, Patel RD, Murray IA, Smith PB, Patterson AD, Perdew GH. Aryl Hydrocarbon Receptor Regulates the Cholesterol Biosynthetic Pathway in a Dioxin Response Element-Independent Manner. HEPATOLOGY (2012) 55:1994–2004. doi: 10.1002/hep.25571
44. Li X, Ma J, Jing C, Wang J. Expression alterations of cytochromes P4501A1, 2E1, and 3A, and their receptors AhR and PXR caused by 1-octyl-3-methylimidazolium chloride in mouse mammary carcinoma cells. Chemosphere (2013) 93:2488–92. doi: 10.1016/j.chemosphere.2013.08.092
45. Grimaldi G, Rajendra S, Matthews J. The aryl hydrocarbon receptor regulates the expression of TIPARP and its cis long non-coding RNA, TIPARP-AS1. Biochem Biophys Res Commun (2018) 495:2356–62. doi: 10.1016/j.bbrc.2017.12.113
46. Flaveny CA, Murray IA, Perdew GH. Differential Gene Regulation by the Human and Mouse Aryl Hydrocarbon Receptor. Toxicol Sci (2010) 114:217–25. doi: 10.1093/toxsci/kfp308
47. Bergander LV, Cai W, Klocke B, Seifert M, Pongratz I. Tryptamine serves as a proligand of the AhR transcriptional pathway whose activation is dependent of monoamine oxidases. Mol Endocrinol (2012) 26:1542–51. doi: 10.1210/me.2011-1351
48. Nath B, Szabo G. Hypoxia and HIFs: Diverse Roles in Liver Diseases. Hepatology (2012) 55:622–33. doi: 10.1016/j.pain.2013.06.005.Re-Thinking
49. Surani SR, Mendez Y, Anjum H, Varon J. Pulmonary complications of hepatic diseases. World J Gastroenterol (2016) 22:6008–15. doi: 10.3748/wjg.v22.i26.6008
50. Asrani SK, Asrani NS, Freese DK, Phillips SD, Warnes CA, Heimbach J, et al. Congenital heart disease and the liver. Hepatology (2012) 56:1160–9. doi: 10.1002/hep.25692
51. Hara Y, Watanabe N. Changes in expression of genes related to glucose metabolism in liver and skeletal muscle of rats exposed to acute hypoxia. Heliyon (2020) 6:e04334. doi: 10.1016/j.heliyon.2020.e04334
52. Owczarek A, Gieczewska K, Jarzyna R, Jagielski AK, Kiersztan A, Gruza A, et al. Hypoxia increases the rate of renal gluconeogenesis via hypoxia-inducible factor-1-dependent activation of phosphoenolpyruvate carboxykinase expression. Biochimie (2020) 171–172:31–7. doi: 10.1016/j.biochi.2020.02.002
53. Young SN, Lal S. CNS tryptamine metabolism in hepatic coma. J Neural Transm (1980) 47:153–61. doi: 10.1007/BF01250597
54. He R, Li L, Wang J, Shi H, Liu Z. Integration of Quantitative Proteomics and Metabolomics Reveal Mechanism of Tissue Hypoxia in a Chronic Ischemic-Hypoxic Rat Model. In: AABB Annual Meeting (2019). Available at: https://aabb.confex.com/aabb/2019/meetingapp.cgi/Paper/6603.
55. Greene SL. Chapter 15. Tryptamines. Cambridge, Massachusetts, Academic Press, Elsevier Inc. (2013) 363–81. doi: 10.1016/B978-0-12-415816-0.00015-8
56. Margarida A, Félix A, Maria C, Bastos DL. The hallucinogenic world of tryptamines: an updated review. Arch Toxicol (2015) 89:1151–73. doi: 10.1007/s00204-015-1513-x
57. Barker SA. N-Dimethyltryptamine (DMT), an Endogenous Hallucinogen: Past, Present, and Future Research to Determine Its Role and Function. Front Neurosci (2018) 12:536. doi: 10.3389/fnins.2018.00536
58. Szabo A, Kovacs A, Riba J, Djurovic S, Rahnavolgyi E, Frecska E. The Endogenous Hallucinogen and Trace Amine N, N-Dimethyltryptamine (DMT) Displays Potent Protective Effects against Hypoxia via Sigma-1 Receptor Activation in Human Primary iPSC-Derived Cortical Neurons and Microglia-Like Immune. Front Neurosci (2016) 10:423. doi: 10.3389/fnins.2016.00423
59. Dean JG. Indolethylamine- N -methyltransferase Polymorphisms: Genetic and Biochemical Approaches for Study of Endogenous N, N, - dimethyltryptamine. Front Neurosci (2018) 12:232. doi: 10.3389/fnins.2018.00232
60. Jin UH, Lee SO, Sridharan G, Lee K, Davidson LA, Jayaraman A, et al. Microbiome-derived tryptophan metabolites and their aryl hydrocarbon receptor-dependent agonist and antagonist activities. Mol Pharmacol (2014) 85:777–88. doi: 10.1124/mol.113.091165
61. Gao J, Xu K, Liu H, Liu G, Bai M, Peng C, et al. Impact of the gut microbiota on intestinal immunity mediated by tryptophan metabolism. Front Cell Infect Microbiol (2018) 8:13. doi: 10.3389/fcimb.2018.00013
62. Cheng Y, Jin UH, Allred CD, Jayaraman A, Chapkin RS, Safe S. Special section on drug metabolism and the microbiome: Aryl hydrocarbon receptor activity of tryptophan metabolites in young adult mouse colonocytes. Drug Metab Dispos (2015) 43:1536–43. doi: 10.1124/dmd.115.063677
63. Roager HM, Licht TR. Microbial tryptophan catabolites in health and disease. Nat Commun (2018) 9:1–10. doi: 10.1038/s41467-018-05470-4
64. Mousseau DD, Butterworth RF. Trace amines in hepatic encephalopathy. Prog Brain Res (1995) 106:277–84. doi: 10.1016/S0079-6123(08)61224-8
65. Mousseau DD, Layrargues GP, Butterworth RF. Region-Selective Decreases in Densities of [3H]Tryptamine Binding Sites in Autopsied Brain Tissue from Cirrhotic Patients with Hepatic Encephalopathy. J Neurochem (1994) 62:621–5. doi: 10.1046/j.1471-4159.1994.62020621.x
66. Mousseau DD, Baker GB, Butterworth RF. Increased density of catalytic sites and expression of brain monoamine oxidase A in humans with hepatic encephalopathy. J Neurochem (1997) 68:1200–8. doi: 10.1046/j.1471-4159.1997.68031200.x
67. Kodama C, Mizoguchi Y, Kawada N, Sakagami Y, Seki S, Kobayashi K, et al. Serotonin and tryptamine metabolism in the acute hepatic failure model: changes in tryptophan and its metabolites in the liver, brain and kidney. Osaka City Med J (1989) 35:1–11.
68. Doherty DG. Immunity, tolerance and autoimmunity in the liver: A comprehensive review. J Autoimmun (2016) 66:60–75. doi: 10.1016/j.jaut.2015.08.020
69. Doherty DG. Antigen-specific immune tolerance in the liver. Nat BioMed Eng (2019) 3:763–5. doi: 10.1038/s41551-019-0445-9
70. Tiegs G, Lohse AW. Immune tolerance: What is unique about the liver. J Autoimmun (2010) 34:1–6. doi: 10.1016/j.jaut.2009.08.008
71. Heymann F, Tacke F. Immunology in the liver-from homeostasis to disease. Nat Rev Gastroenterol Hepatol (2016) 13:88–110. doi: 10.1038/nrgastro.2015.200
72. Knolle PA, Böttcher J, Huang LR. The role of hepatic immune regulation in systemic immunity to viral infection. Med Microbiol Immunol (2015) 204:21–7. doi: 10.1007/s00430-014-0371-0
73. Protzer U, Maini MK, Knolle PA. Living in the liver: Hepatic infections. Nat Rev Immunol (2012) 12:201–13. doi: 10.1038/nri3169
74. Munn DH. Prevention of Allogeneic Fetal Rejection by Tryptophan Catabolism. Sci (80- ) (1998) 281:1191–3. doi: 10.1126/science.281.5380.1191
75. Pilotte L, Larrieu P, Stroobant V, De Plaen E, Uyttenhove C, Wouters J, et al. Reversal of tumoral immune resistance by inhibition of tryptophab 2,3-dioxygenase. PNAS (2012) 109:2497–502. doi: 10.1073/pnas.1113873109
Keywords: liver, hypoxia, tryptophan, TDO2, regulation, AHR activity, hallucination, tryptamine
Citation: Mohapatra SR, Sadik A, Sharma S, Poschet G, Gegner HM, Lanz TV, Lucarelli P, Klingmüller U, Platten M, Heiland I and Opitz CA (2021) Hypoxia Routes Tryptophan Homeostasis Towards Increased Tryptamine Production. Front. Immunol. 12:590532. doi: 10.3389/fimmu.2021.590532
Received: 01 August 2020; Accepted: 04 January 2021;
Published: 19 February 2021.
Edited by:
Flavia Castellano, Institut National de la Santé et de la Recherche Médicale (INSERM), FranceReviewed by:
Anna Ohradanova-Repic, Medical University of Vienna, AustriaCopyright © 2021 Mohapatra, Sadik, Sharma, Poschet, Gegner, Lanz, Lucarelli, Klingmüller, Platten, Heiland and Opitz. This is an open-access article distributed under the terms of the Creative Commons Attribution License (CC BY). The use, distribution or reproduction in other forums is permitted, provided the original author(s) and the copyright owner(s) are credited and that the original publication in this journal is cited, in accordance with accepted academic practice. No use, distribution or reproduction is permitted which does not comply with these terms.
*Correspondence: Christiane A. Opitz, Yy5vcGl0ekBka2Z6LmRl
Disclaimer: All claims expressed in this article are solely those of the authors and do not necessarily represent those of their affiliated organizations, or those of the publisher, the editors and the reviewers. Any product that may be evaluated in this article or claim that may be made by its manufacturer is not guaranteed or endorsed by the publisher.
Research integrity at Frontiers
Learn more about the work of our research integrity team to safeguard the quality of each article we publish.