 Selma Maluf1,2,3
 João Victor Salgado4
 Dalila Nunes Cysne3
 Daniel Monte Freire Camelo3
 Johnny Ramos Nascimento1,3
 Bianca Vitória T. Maluf3
 Luís Douglas Miranda Silva1Marta Regina de Castro Belfort1
 Lucilene Amorim Silva3,5Rosane Nassar Meireles Guerra3,5Natalino Salgado Filho6
 Flávia Raquel F. Nascimento3,5*
- 1Health Science Graduate Program, Federal University of Maranhão, São Luís, Brazil
- 2Gastroenterology Service of the University Hospital, Federal University of Maranhão, São Luís, Brazil
- 3Immunophysiology Laboratory, Department of Pathology, Federal University of Maranhão, São Luís, Brazil
- 4Department of Physiological Sciences, Federal University of Maranhão, São Luís, Brazil
- 5Department of Pathology, Federal University of Maranhão, São Luís, Brazil
- 6Department of Medicine I, Federal University of Maranhão, São Luís, Brazil
Background: Recent studies have found an association between Helicobacter pylori infection and prediabetes. Whether H. pylori per se or host factors are involved in the disturbance of glycated hemoglobin needs further investigation. The aim of this study was to determine the association of glycated hemoglobin levels with endoscopic diagnosis and the inflammatory response in H. pylori infection.
Methods: A cross-sectional study was carried out in 88 dyspeptic non-diabetic adults who underwent esophagogastroduodenoscopy. The diagnosis of H. pylori infection was performed through urease test and histopathological exam. Cases were initially distributed into two groups: control (without H. pylori infection, n = 22) and HP (patients with H. pylori infection, n = 66). HbA1c was measured to determine prediabetes status according to the American Diabetes Association criteria, and then the groups were subdivided into non-prediabetic (n = 14), prediabetic (n = 8), non-prediabetic HP (n = 26) and prediabetic HP (n = 40) groups. Gastric mucosa was histologically evaluated to determine H. pylori density and inflammatory activity according to Sydney System. To investigate the balance of anti-inflammatory and pro-inflammatory cytokines we measured interleukin 10 (anti-inflammatory) and Tumor Necrosis Factor-a (pro-inflammatory) in the plasma or in the gastric mucosa.
Results: Patients with H. pylori infection had higher mean HbA1c levels than those without H. pylori infection. However, increased HbA1c levels were not associated with H. pylori-related factors but with the bacterial density, the intensity of inflammation and the activity of the chronic gastritis. In addition, H. pylori infection per se did not alter IL-10 and TNF-α neither in the plasma nor in the gastric mucosa, but the bacterial density was negatively correlated with systemic and local IL-10 expression. Although no correlation was found between systemic cytokines and HbA1c levels, local anti-inflammatory cytokine was correlated with HbA1c levels.
Conclusion: Long-term H. pylori infection is associated with prediabetes. This association is not related to the presence of H. pylori per se but depends on the extent of bacterial colonization and the degree of both local inflammation and activity of the chronic gastritis.
Introduction
Helicobacter pylori infects nearly half of the global population, with a higher prevalence in developing countries (1). The infection is acquired mainly during childhood and may persist in the gastric environment throughout the life of the host, despite the immune and humoral response (2). In Brazil, the prevalence of H. pylori infection in adults is between 65 and 82% (3). H. pylori infection, a major cause of chronic gastritis, is associated with duodenal and gastric ulcers, lymphoma, and cancer. Furthermore, H. pylori has also been linked to extragastric diseases such as type 2 diabetes mellitus (T2DM) (4, 5).
The role of H. pylori infection in glucose metabolism and T2DM development has not been fully established. Although it has been reported that patients with chronic H. pylori infection have an increased risk of developing T2DM (6), some studies have not found a correlation between this infection and glycemic levels in diabetic patients (7).
The impact of H. pylori infection on other organs could be mediated by increased levels of inflammatory markers such as IL-6 and tumor necrosis factor-α (TNF-α), all of which are also involved in the development of insulin resistance and T2DM (5). These cytokines could induce the phosphorylation of serine residues in the insulin receptor substrate, preventing their interaction with insulin receptors, leading to systemic disruption of insulin sensitivity and impaired glucose homeostasis (8, 9).
Few studies have investigated the association between prediabetes and H. pylori infection. Yang et al. (10) found that gastric H. pylori infection is associated with the risk of diabetes mellitus but not prediabetes. Recent studies have shown a positive association between H. pylori infection and prediabetes (11, 12).
The diagnosis of prediabetes is very critical to the preclinical diagnosis of T2DM and further prevention of vascular complications. Glycated hemoglobin (HbA1c), which is used to diagnose prediabetes, is an indicator of long-term glycemic control. Increased HbA1c levels are correlated with an increased risk of T2DM (13). Whether H. pylori-related factors or host factors are associated with the disturbance of glycated hemoglobin levels needs investigation.
Therefore, the aim of this study was to determine the association of glycated hemoglobin levels (HbA1c) with endoscopic diagnosis and local and systemic anti- and pro-inflammatory cytokines release in H. pylori infection.
Materials and Methods
Sample Population
A cross-sectional study was carried out in 88 patients with dyspepsia who underwent esophagogastroduodenoscopy at the Endoscopy Unit of the University Hospital, Federal University of Maranhão (UFMA), during a period of 4 months. The patients eligible for the study were selected through systematic random sampling according to the demands of the Endoscopy Service. Patients of both genders who were ≥18 years of age and who did not have a history of diabetes were included. The following patients were not included in the study: pregnant women, patients with chronic consumptive disease (cancer and AIDS), gastric surgery patients, chronic renal failure patients on hemodialysis, patients with recent blood transfusion, patients previously treated for H. pylori eradication, and patients who had been medicated with H2 receptor antagonists or proton pump inhibitors within 2 weeks or antibiotics within 4 weeks prior to testing.
The patients included completed a sociodemographic survey to collect information on educational level, lifestyle, medical history, and medication use and for dyspepsia evaluation. The body mass index (BMI) was also calculated, and the patients were classified as eutrophic (BMI values <25 kg/m2) and overweight/obese (BMI values ≥25 kg/m). Any participant who self-declared as a regular smoker, regardless of the quantity of cigarettes smoked, was considered a smoker. The National Committee for Research Ethics (CONEP) approved this study according to CAAEE 07989412.0.0000.5086. Those patients who accepted the invitation to participate in the study signed an informed consent form.
Diagnosis of H. pylori Infection
Helicobacter pylori infection was determined using the rapid urease test (RUT) and a histopathological exam. Gastric mucosa samples were collected during endoscopic biopsies. For the RUT, two specimens of gastric mucosa (antrum and body) were collected using autoclavable biopsy forceps and placed in a sterile tube containing urea and a pH indicator (phenol red) (Uretest Promedical, Brazil). The sample was kept at room temperature and after 2 h was read. A color change from dark yellow to red indicated positivity for H. pylori infection. For the histopathological exam, four tissue fragments (two fragments each from the body and antrum) were collected using sterile biopsy forceps. The samples were placed in a single vial containing 10% formaldehyde, which was properly labeled and submitted to the Department of Pathology of the HUUFMA. Giemsa staining techniques were used to facilitate bacterial visualization. Identification of H. pylori in any test was considered a positive result in accordance with the IVth Brazilian Consensus Conference on H. pylori infection (14).
Endoscopic Diagnosis
A member of the research team performed all endoscopies. An Olympus Exera II system (Olympus Corporation, Tokyo, Japan) was used for digestive endoscopy. Before the esophagogastroduodenoscopy exams, dimethicone drops and lidocaine spray (10% Xylestesin; Cristália, Brazil) were applied to the oropharynx. Sedation was performed using intravenous midazolam (Dormonid Roche, Brazil). During endoscopy, the esophagus, stomach, and duodenum were evaluated, and the endoscopic findings were reported. Diagnoses of chronic gastritis and duodenitis were made based on the Sydney System (15). A peptic ulcer lesion was described as an area of mucosal continuity with a perceived depth of more than 0.5 cm.
Morphological Analysis of the Gastric Mucosa
The gastric mucosa obtained from the endoscopic biopsy were routinely prepared with paraffin, and sections were cut (5-μm thick) perpendicular to the surface and were stained with hematoxylin and eosin. Two experienced pathologists without knowledge of other data performed the microscopic examinations. Histological analysis evaluated morphological variables according to Updated Sydney System (16): inflammation, activity and density of H. pylori. A three-grade system of mild, moderate and severe was applicated to morphological variables according the standard grading scale of the System and each successive grade represents an increment in severity of approximately one-third. Inflammation refers to the presence of mononuclear inflammatory infiltrate in lamina própria and categorizes the gastritis as chronic. We adopt HP 0/1 for mild degree of inflammation; HP 2/3 for moderate and severe degree of inflammation. Activity in the context of chronic gastritis refers to the presence of polymorphonuclear leukocytes alongside the mononuclear inflammatory infiltrate. Activity can be particularly related to the presence of H. pylori (17). The neutrophil activity was graded as mild when less than one-third of the epithelial grooves and the surface were infiltrated by neutrophils; it was considered to be of moderate intensity when neutrophil infiltration occurred in one to two-thirds of the surface and severe when more than two-thirds of the surface of the epithelium showed neutrophil infiltration. We use HP 0/1 to grade neutrophil activity as mild; HP 2/3, for moderate and severe degree of activity. The density of Helicobacter-like organisms present is grading in mild colonization when individual organisms, or small groups, covering less than one-third of the mucosal surface (1+/3+). Severe colonization is the presence of large groups of organisms on the surface and upper pits of more than two-thirds of the mucosal surface examined (3+/3+). Moderate colonization is between these two (2+/3+). We classify in HP dens1, the mild colonization; HP dens2, the moderate colonization and HP dens3, severe colonization.
Evaluation of Cytokines in Plasma by CBA
For the evaluation of cytokines, one sample of blood (5 mL) was collected from each patient and sent to the Immunophysiology Laboratory, UFMA. The concentrations of the cytokines IL-2, IL-4, IL-6, IL-10, IL-17, IFN-γ, and TNF-α were determined using a cytometric bead array (CBA) human Th1/Th2/Th17 cytokine kit (Becton Dickinson Biosciences, San Jose, CA, United States). For this study only the data of IL-10 and TNF-a were used. The plasma samples were analyzed in a FACSCalibur flow cytometer (Becton Dickinson Biosciences, San Jose, CA, United States) previously calibrated with “setup beads” incubated with fluorescein isothiocyanate (FITC) or phycoerythrin (PE) according to the manufacturer’s recommendation. A standard curve was generated for each cytokine. The results were analyzed in FCAP Array Software (Becton Dickinson Biosciences, San Jose, CA, United States), and the values were expressed as pg/mL for each cytokine. The limit of detection for each cytokine is defined as the corresponding concentration at two standard deviations above the median fluorescence of 30 replicates of negative control (0 pg/mL).
Evaluation of Cytokines in Gastric Mucosa by Immunochemistry
Tissue microarray blocks (TMAs) were assembled and the 3 μm thick histological sections were placed on silanized slides (StarFrost® Advanced Adhesive, Knittel, Germany) and taken to an oven at 65°C for 1 h. The gastric tissue was deparaffinized with xylol and dehydrated in alcohol. Endogenous peroxidase enzyme blockade was performed with H2O2 (hydrogen peroxide) solution (Merck KgaA, Darmstadt, Germany) at 3%. Antigenic recovery was performed by heating the tissue for 40 min at a temperature between 97 and 100°C. Then, the antibody diluted in PBS-Tween 20/BSA 1% was applied over gastric tissue and incubated for 40 min. Rabbit polyclonal anti-IL-10 antibody (Biorbyt, Cambridge, United Kingdom) and anti-TNF-α antibody (Scytek, Utah, United States) were used. The slides were washed with PBS-Tween 20 pH 7.4 solution and incubated with the chromogen 3.3′-Diaminobenzidine (DAB, Sigma, St Louis, MO, United States, D5637-1G) diluted in DAB Substrate, for 5 min, at room temperature. Counterstaining was done with Hematoxylin. The cuts were dehydrated in alcohol and xylol solutions and subsequently assembled. The positive control for TNF-α was performed with lymph node sections. The positive control for IL-10 was performed with kidney sections. The expression of IL-10 and TNF-α was evaluated in epithelial cells and the lamina propria of the gastric mucosa by using an ECLIPSE E800 electronic microscope (Nikon Instruments Europe, Amsterdam, Netherlands) with a 20× objective on the EGFP filter (Emission Green Fluorescent Protein). The counting of the marked cells in five fields of the histological section was performed. The fields were determined as “upper left field,” “upper right field,” “lower left field,” “lower right field,” and “center.” After counting, the sum of the five fields was made to obtain an estimate of the cells marked for IL-10 or TNF-α, per patient slide.
Statistical Analysis
The absolute and relative frequencies are used to describe the qualitative variables. The mean and standard deviation or median and interquartile range are used to the describe quantitative variables according to the Shapiro–Wilk normality test.
To evaluate the association between the quantitative variables and the presence of H. pylori infection, the Mann–Whitney test or Student’s t-test for independent samples was used. The Kruskal–Wallis test followed by Dunnett’s test or ANOVA followed by Bonferroni’s test were used to verify the differences in the quantitative variables between the study groups.
Qualitative variables were assessed by Fisher’s exact and Chi-square tests for the presence of H. pylori and for the analysis of differences between the study groups. For the correlation analyses, the Spearman test was used. Differences were considered significant when the p-value ≤ 0.05. The data were tabulated and analyzed using the data and statistical analysis software STATA® version 14.0 and GraphPad Prism 6.0 software.
Results
Evaluation of Sociodemographic Parameters
There were no significant differences regarding age, sex, BMI, gastric symptoms, smoking habits, or alcohol consumption. The majority of the study population consisted of women with an average age of approximately 40 years with BMI less than 25 (Table 1).
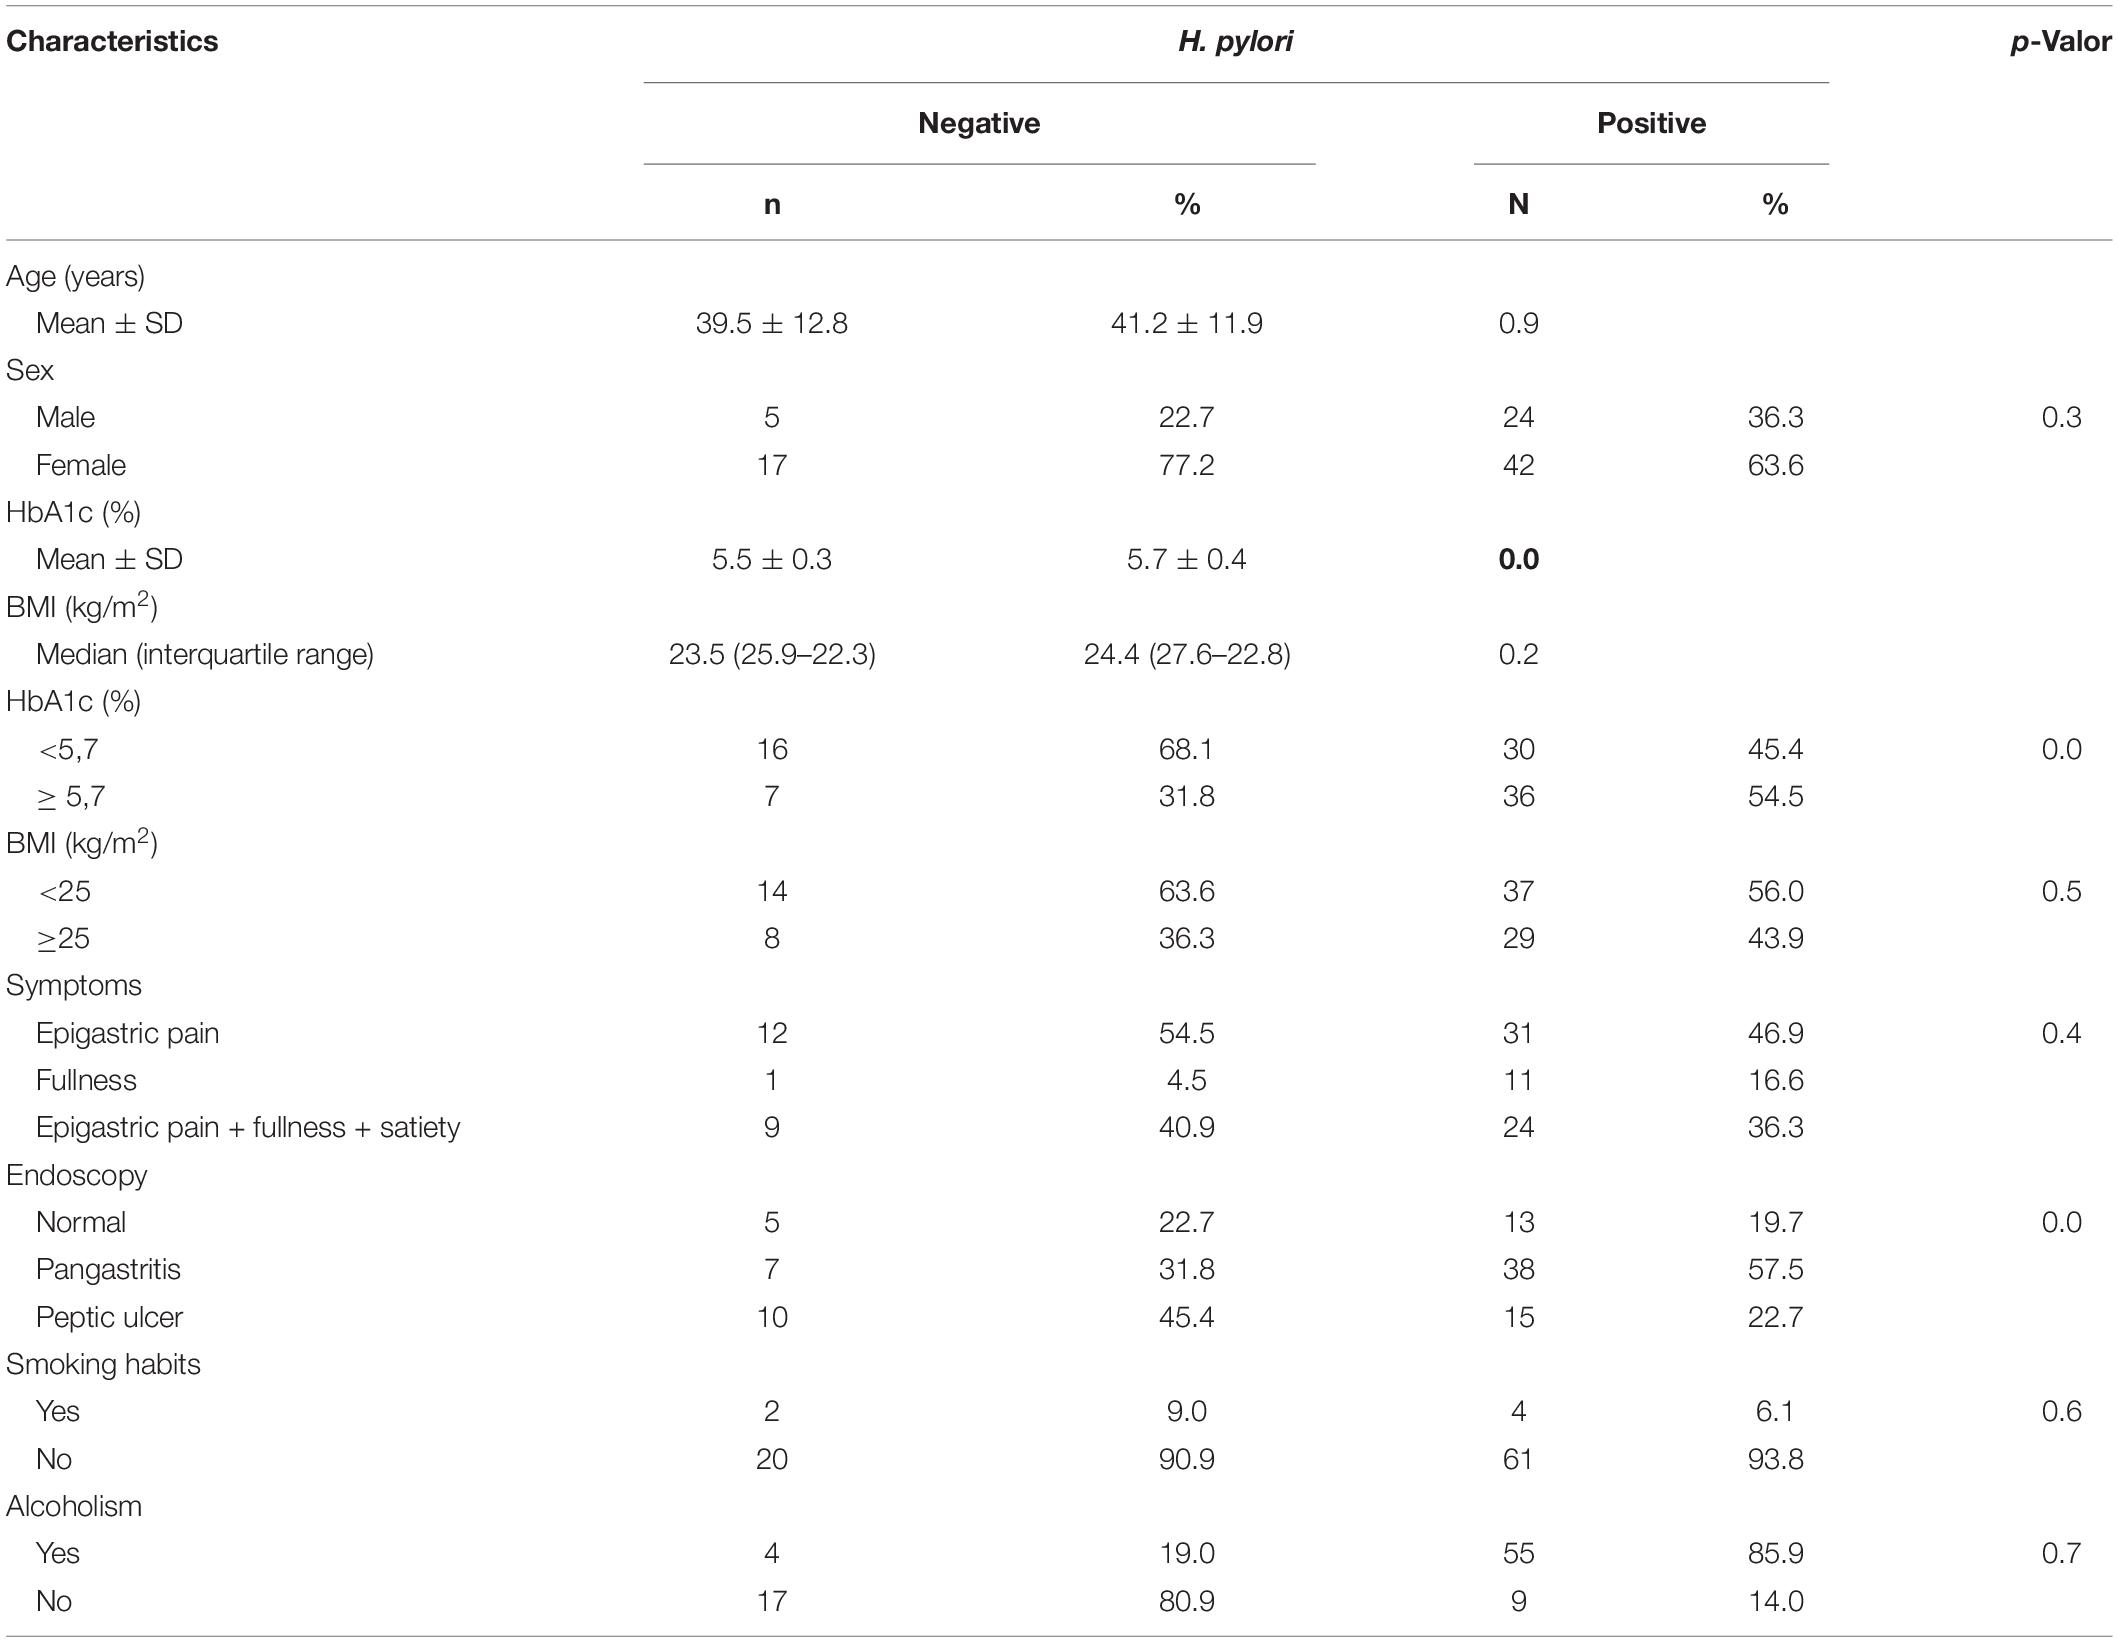
Table 1. General characteristics of patients according to the presence of infection.
Prevalence of H. pylori Infection, Symptoms, and Endoscopic Findings
Approximately 75% of patients were infected with H. pylori. Most of them were women aged 18–54 years. Half of the patients complained of epigastric pain. Enanthematous pangastritis was the most frequent endoscopic finding in patients infected with H. pylori (Table 1).
Helicobacter pylori Infection Was Associated to Increased HbA1c Levels
Patients with H. pylori infection had higher mean HbA1c levels than patients without H. pylori infection (Figure 1).
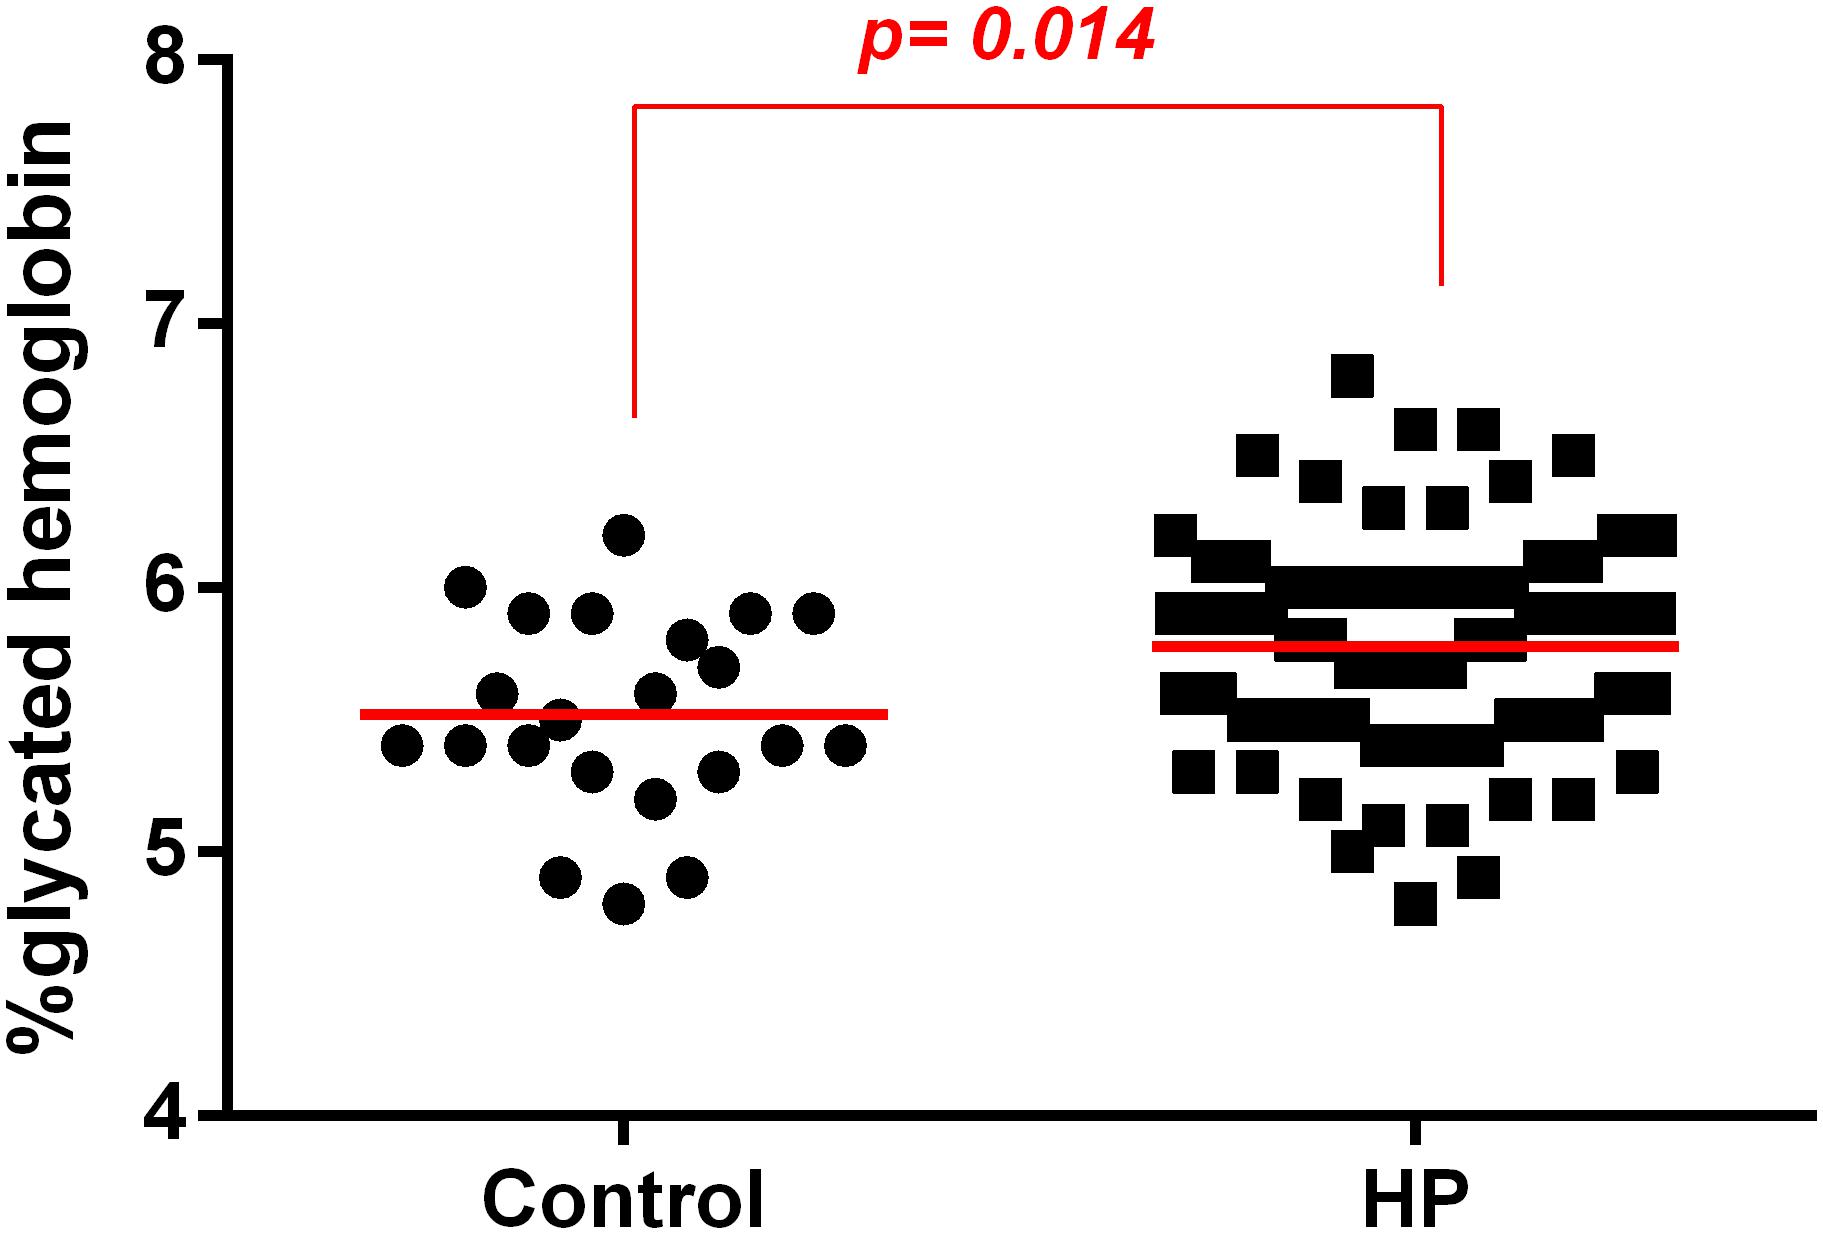
Figure 1. Association between H. pylori infection (HP) and glycated hemoglobin (HbA1c) levels in patients without infection (control) or with H. pylori infection (HP). HbA1c levels were evaluated in the plasma of patients infected with H. pylori (HP, n = 66) or non-infected (Control, n = 22) using a method certified by the National Glycohemoglobin Standardization Program (NGSP). The line represents mean of the group. p-value was determined by unpaired two-tailed t-test. Level of significance, p < 0.05.
There Was an Association Between Increased H. pylori Density and the Increase in HbA1c Levels
The mean HbA1c levels were higher in the H. pylori-infected group with a higher bacterial density 3+/3+ (HPdens3) than in the control group. There was no significant difference between controls and low-density infected patients (HPdens1) as well as between controls and infected patients with moderate bacterial density (HPdens2). There were also no significant differences between the infected groups HPdens1 and HPdens2, HPdens2 and HPdens3, and HPdens1 and HPdens3 (Figure 2A). However, bacterial density was positively correlated with HbA1c levels (Figure 2B).
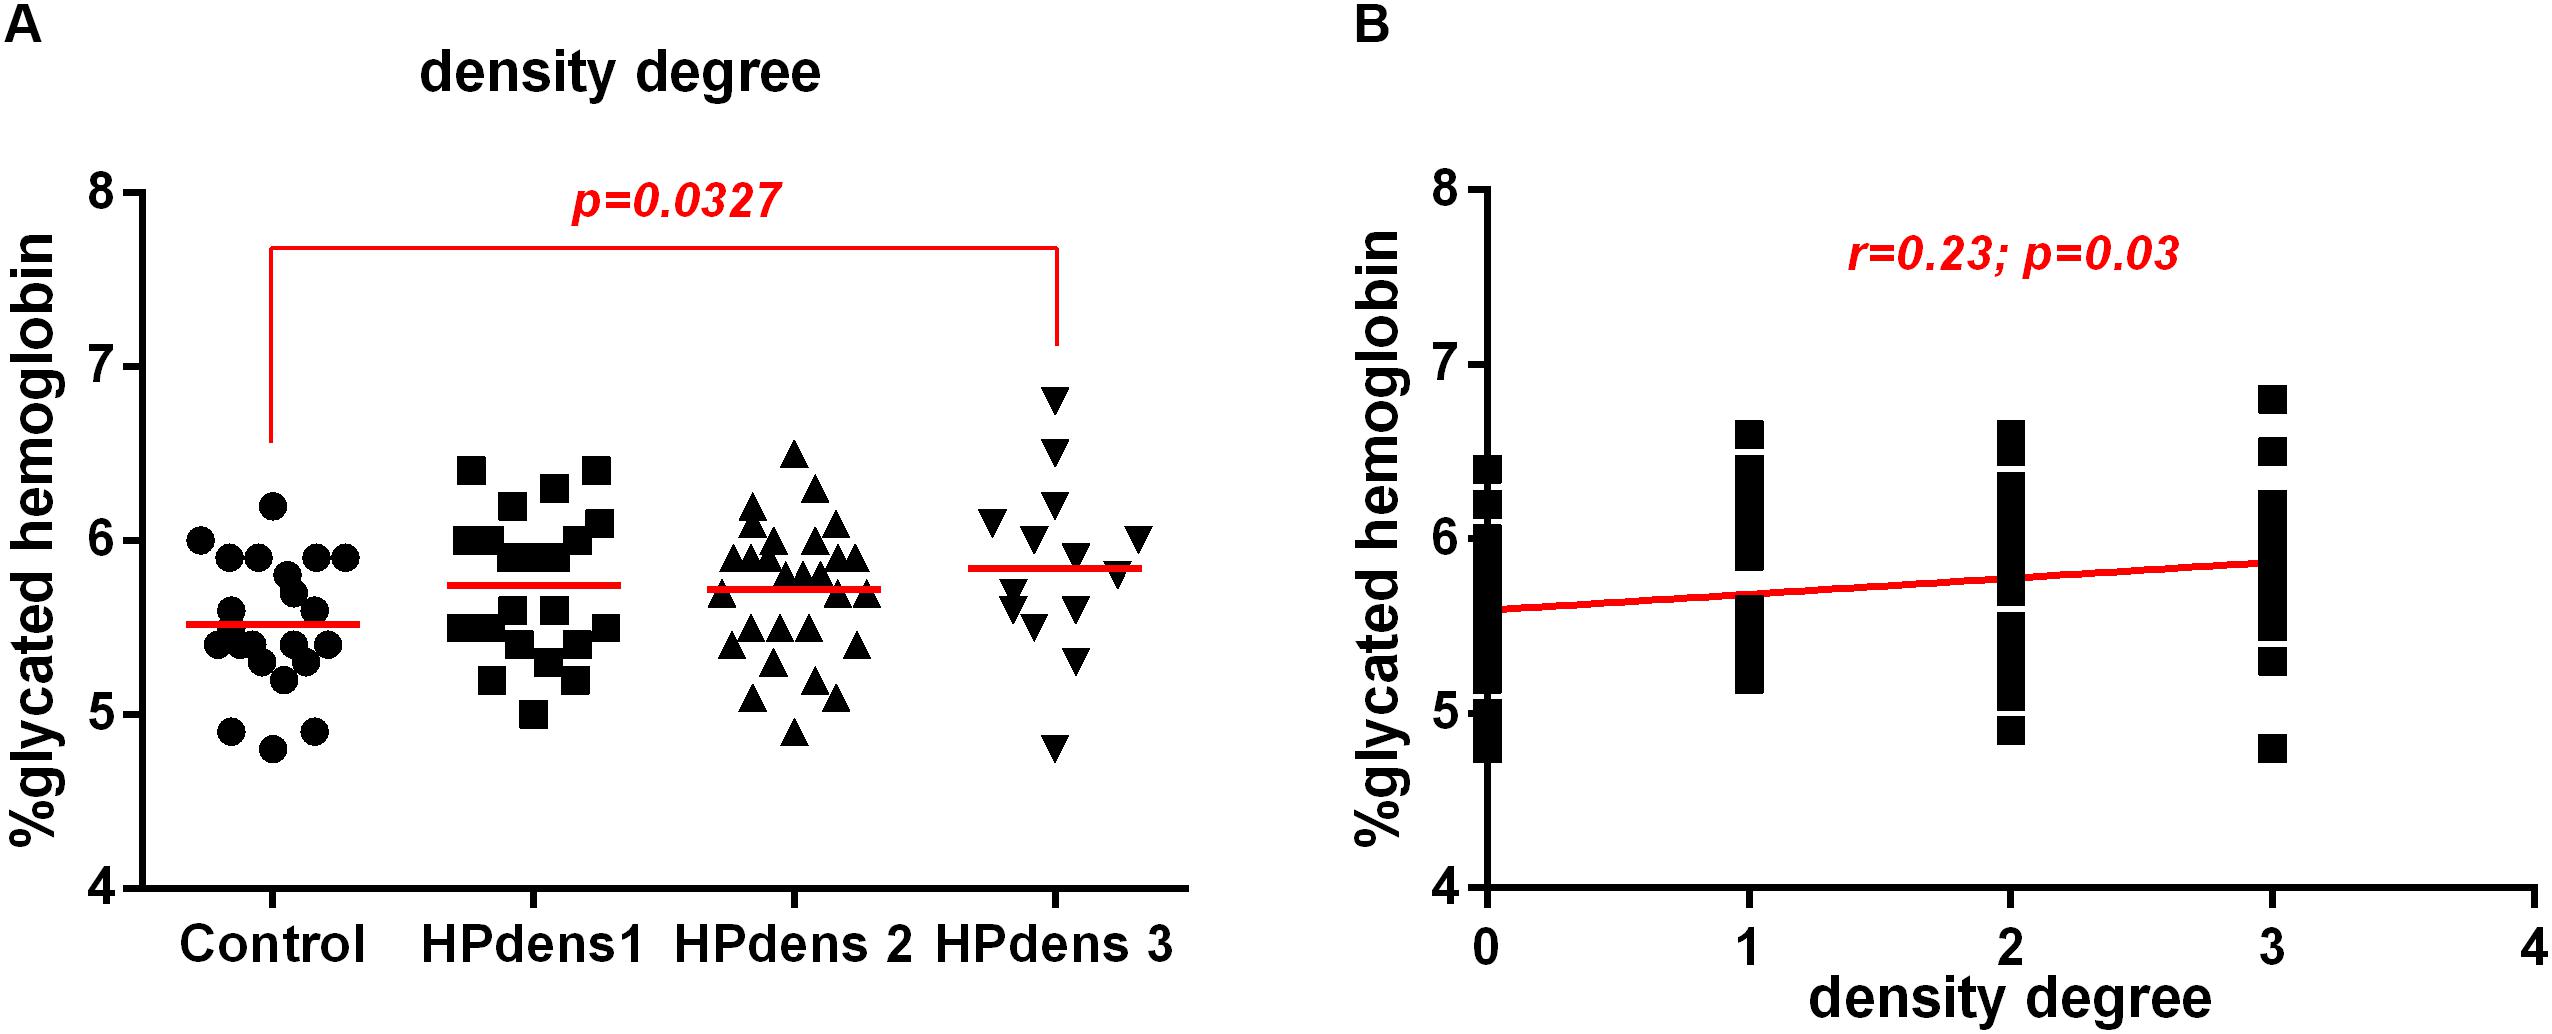
Figure 2. Association between H. pylori infection (HP) and glycated hemoglobin (HbA1c) levels in patients without infection (Control) or with H. pylori infection (HP) according to degree bacterial density of the gastric mucosa. Bacterial density of the gastric mucosa were evaluated according Sydney System histological classification of patients infected with H. pylori (HP, n = 66) or non-infected (Control, n = 22). (A) Degree of bacterial density of the non-infected (Control, n = 22), H. pylori positive with density 1 (HP dens1, n = 23), H. pylori positive with density 2 (HP dens2, n = 29), H. pylori positive with density 3 (HP dens3, n = 14). The line represents mean of the group. p-value was determined by unpaired two-tailed t-test. (B) Correlation between HbA1c levels and bacterial density. Correlations were determined by Spearman’s correlation test. Level of significance, p < 0.05.
Endoscopic Diagnosis Was Not Associated With High Levels of HbA1c, but Rather the H. pylori Related-Factors
Among patients with endoscopic diagnoses of pangastritis and among patients with peptic ulcers, HbA1c levels were higher in patients with H. pylori infection than in those without infection (Figures 3A,B). When we compared patients presenting peptic ulcer, but without H. pylori infection with patients presenting gastritis, but with H. pylori infection we observed that HbA1c levels were higher in patients with H. pylori infection and gastritis diagnosis (Supplementary Figure S1). These data suggest that the endoscopic diagnosis does not appear to be associated with HbA1c levels, but rather the H. pylori related-factors.
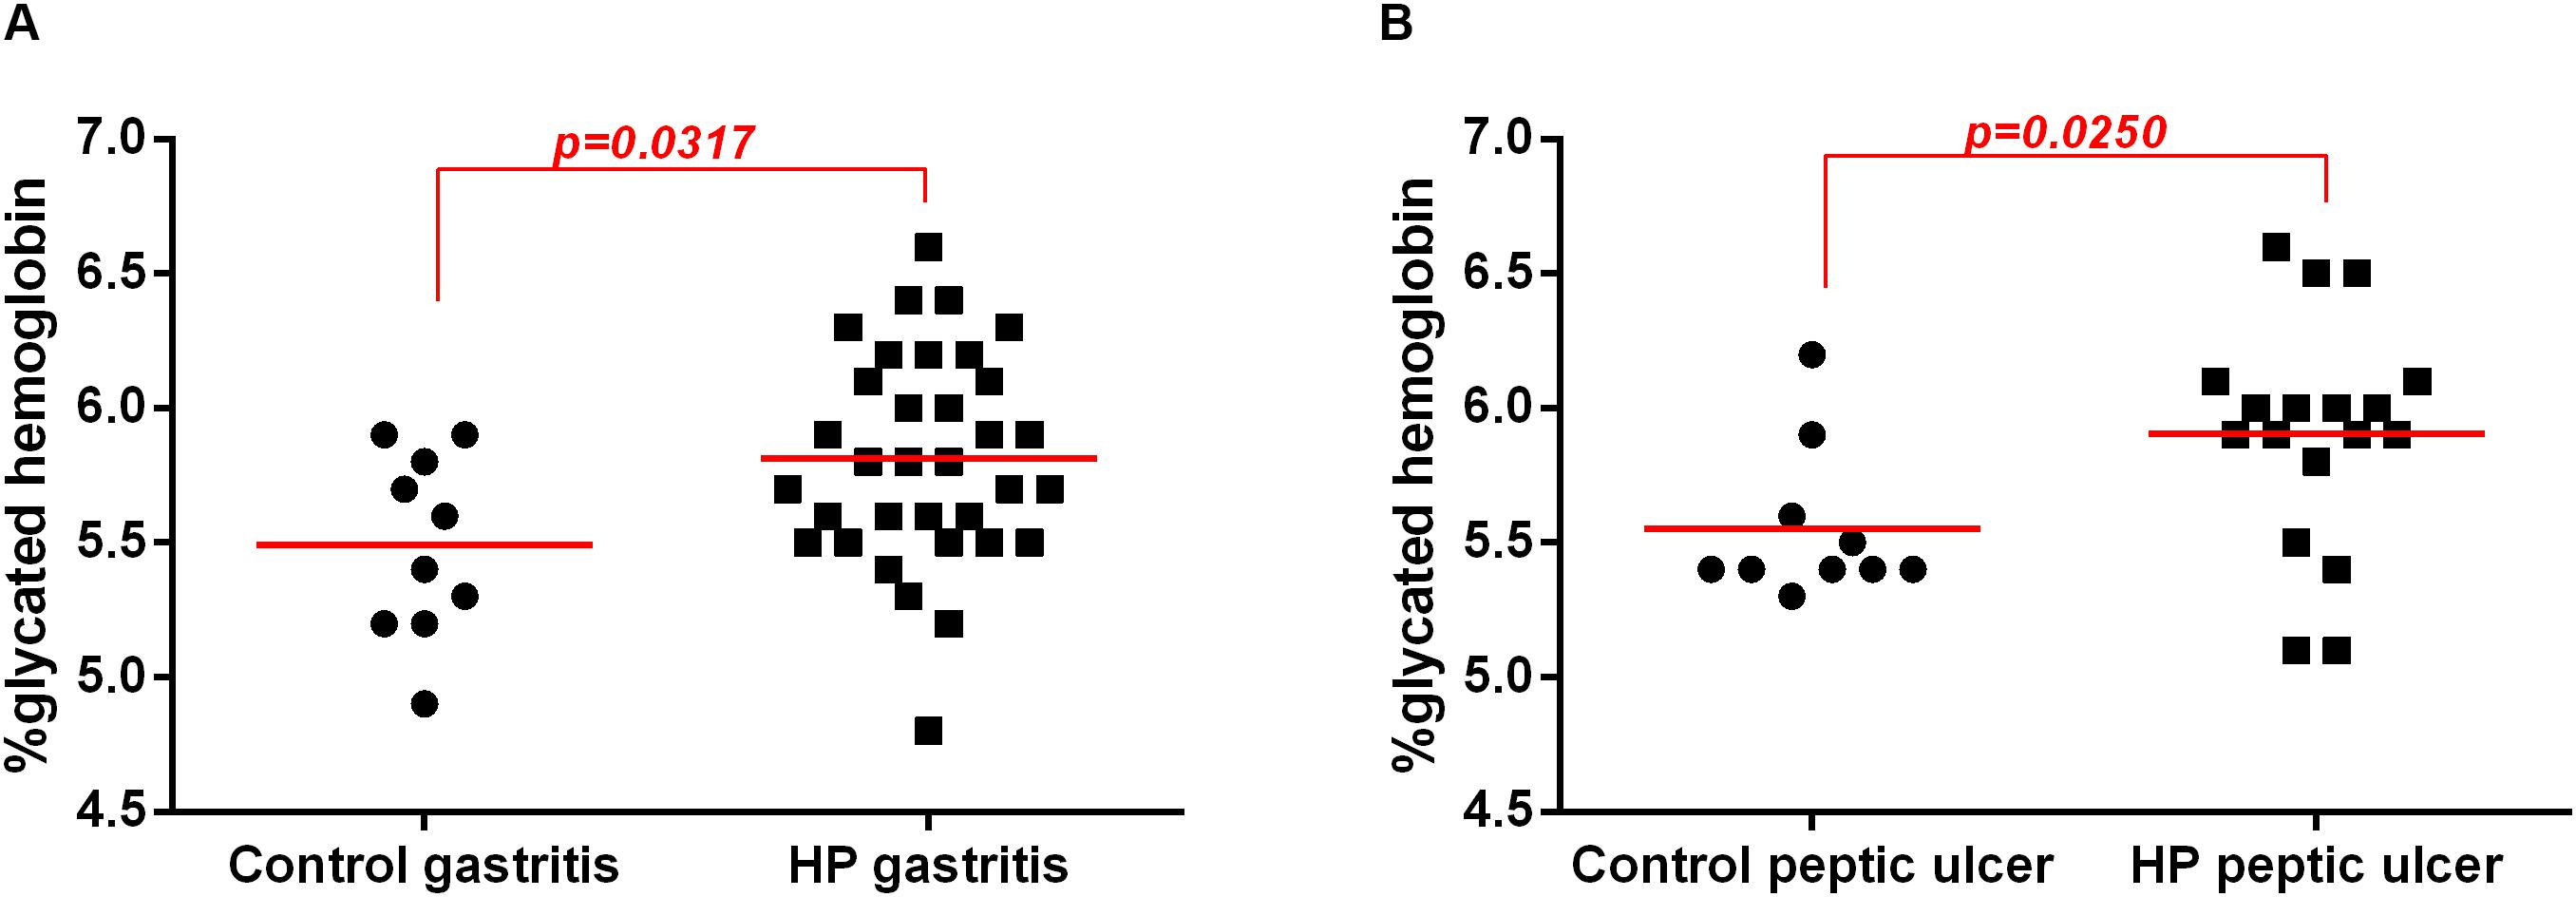
Figure 3. Association between H. pylori infection (HP) with glycated hemoglobin (HbA1c) levels in patients without infection (Control) or with H. pylori infection (HP) according endoscopic diagnosis. Endoscopic diagnosis were evaluated according endoscopic classification of the Sydney System of patients infected with H. pylori (HP, n = 52) or non-infected (Control, n = 20. (A) Enanthematous pangastritis endoscopic diagnosis of H. pylori-infected (HP gastritis, n = 34) or non-infected (Control gastritis, n = 10). (B) Peptic ulcer endoscopic diagnosis of H. pylori-infected (HP peptic ulcer, n = 18) or non-infected (Control peptic ulcer, n = 10). The line represents median of the group. p-value was determined by non-parametric Mann–Whitney test. Level of significance, p < 0.05.
There Was an Association Between Increased HbA1c Levels With Severe Degree of Inflammation and Activity of Chronic Gastritis
There was an increase in HbA1c levels in patients infected with H. pylori with moderate and severe chronic inflammation of the gastric mucosa compared to those in the control group (no infection with normal mucosa or mild inflammation). However, there was no change in the HbA1c levels between the control group and the HP group with mild inflammation (Figure 4A).
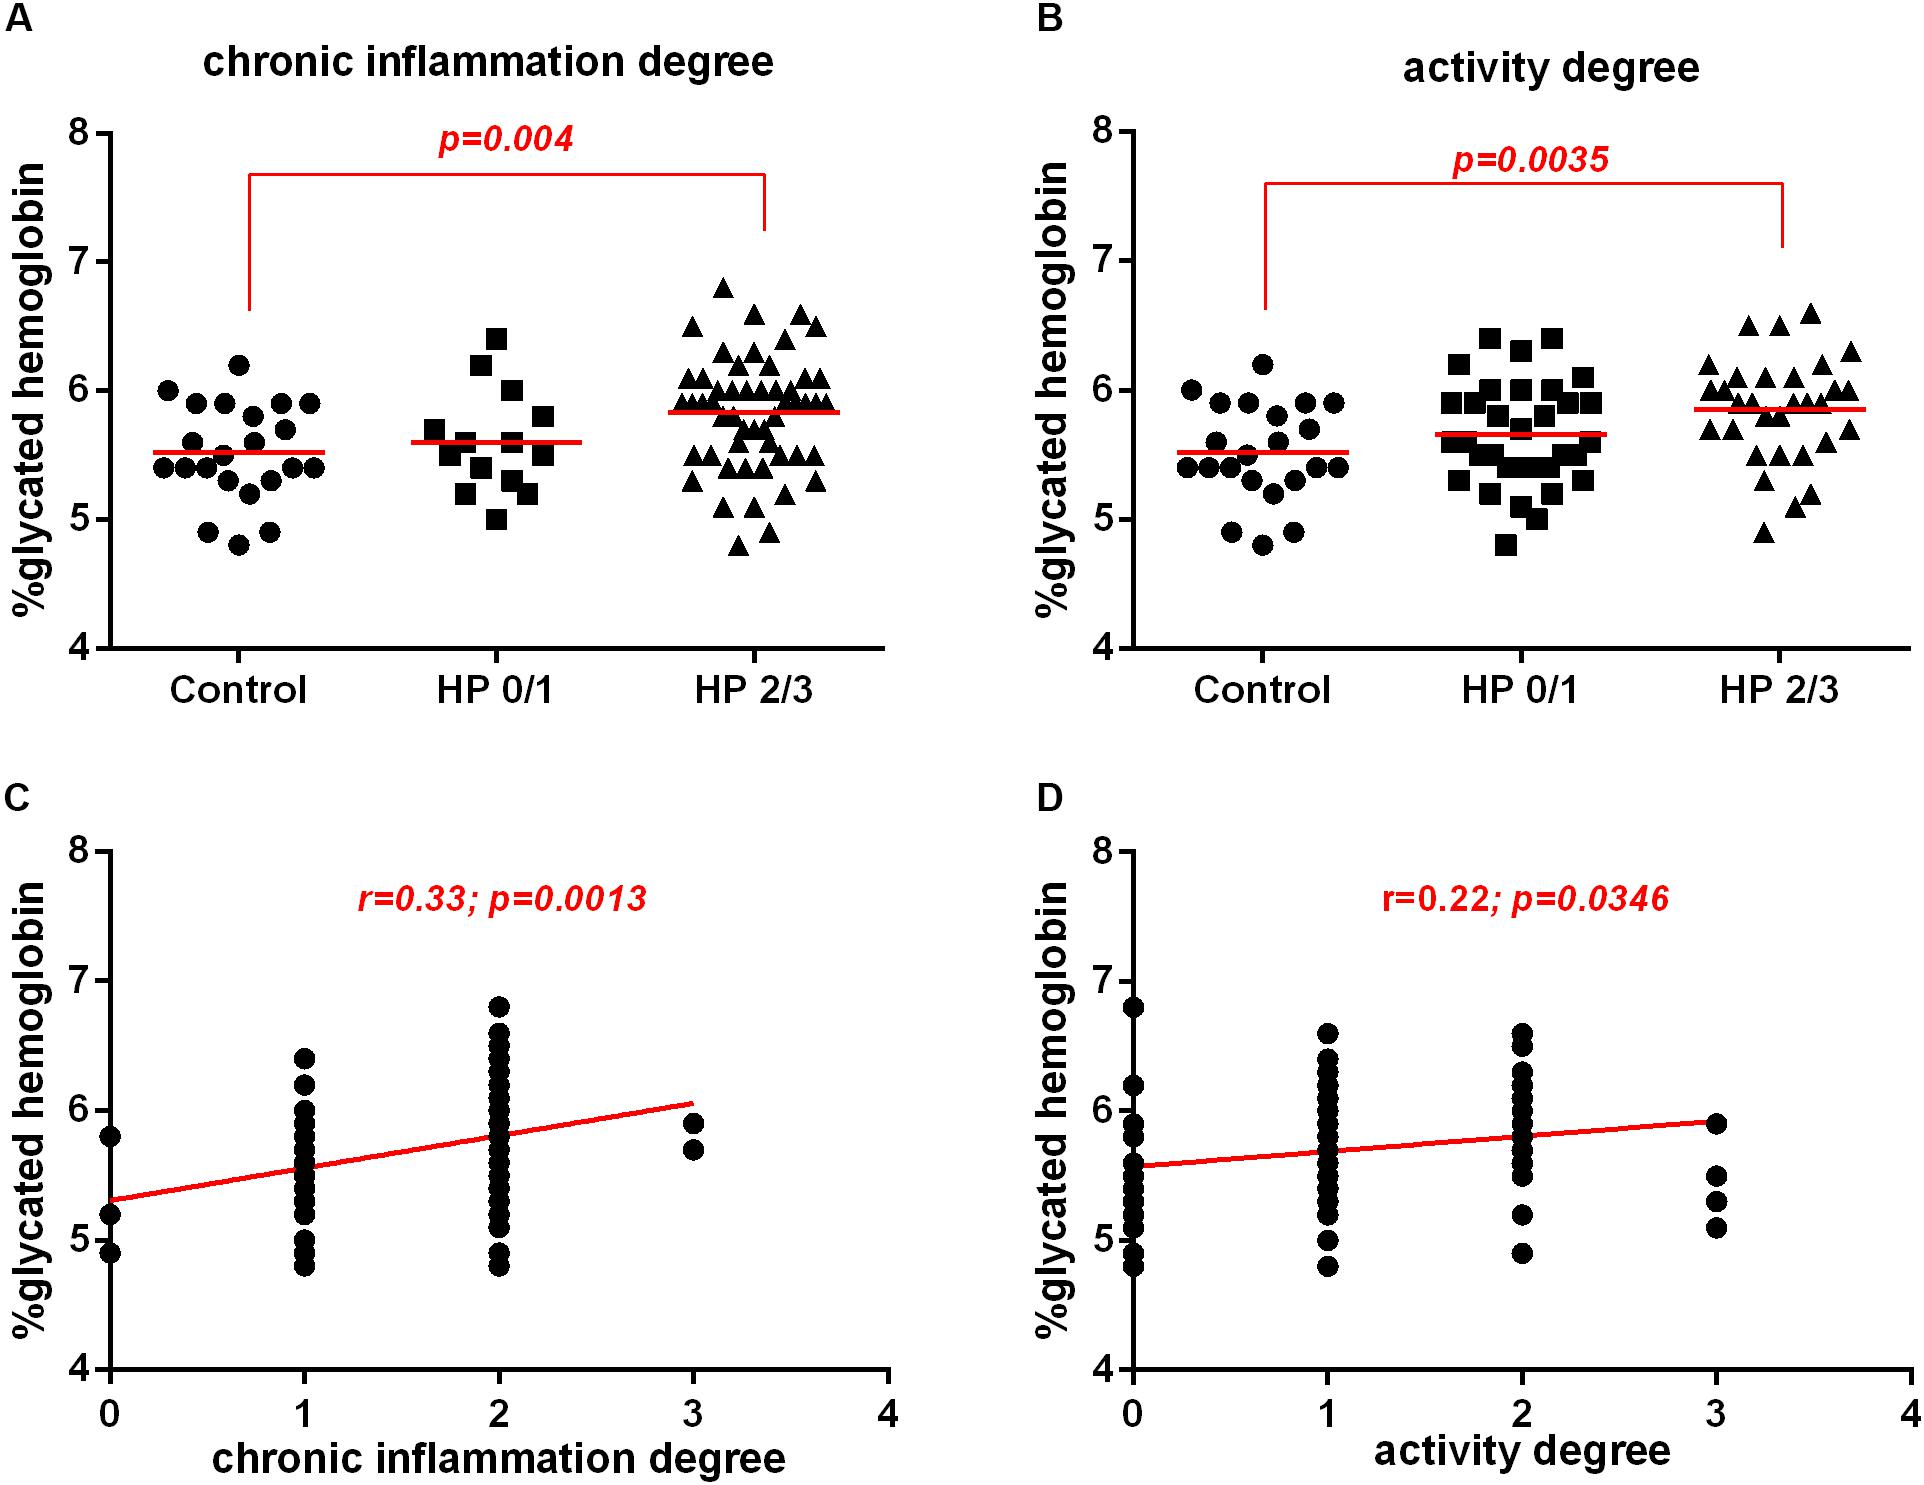
Figure 4. Association between H. pylori infection (HP) with glycated hemoglobin (HbA1c) levels in patients without infection (Control) or with H. pylori infection (HP) according morphological analysis of the gastric mucosa. Histological analysis was evaluated by Sydney System histological classification of patients infected with H. pylori (HP, n = 66) or non-infected (Control, n = 22). (A) Degree of chronic inflammation of non-infected with normal mucosa, or mild chronic inflammation (Control, n = 22), H. pylori-infected with mild chronic inflammation (HP0/1, n = 14), H. pylori infection patients with moderate and severe gastric mucosa chronic inflammation (HP2/3, n = 52). (B) Degree of neutrophil activity of non-infected with no activity or mild activity (Control, n = 22) or H. pylori infected with mild activity (HP0/1, n = 35), H. pylori infected with moderate and severe gastric mucosa activity (HP2/3, n = 31). The line represents the mean of the group. p-value was determined by unpaired two-tailed t-test (C) Correlation between HbA1c levels with chronic inflammation of the gastric mucosa. (D) Correlation between HbA1c levels with of neutrophil activity of the gastric mucosa. Correlations were determined by Spearman’s correlation test. Level of significance, p < 0.05.
Similarly, HbA1c levels were increased in H. pylori-infected patients with moderate to high gastric mucosa activity compared to those in the control group. There was no change in HbA1c levels between the control group and the HP group with mild activity (Figure 4B). Furthermore, chronic inflammation and neutrophil activity were positively correlated with the HbA1c levels (Figures 4C,D). These data suggest that the intensity of the neutrophil activity and the inflammation of the chronic gastritis may be predisposing factors for prediabetes.
The Presence of H. pylori Infection Did Not Alter Systemic Levels of IL-10, TNF-α or Alter the Expression of the Cytokines TNF-α and IL-10 in Gastric Mucosa
Considering that the inflammation of the chronic gastritis may be predisposing factors for prediabetes, we evaluated two antagonistic cytokines, IL-10 (anti-inflammatory) and TNF-a (pro-inflammatory) in the plasma and in the gastric mucosal and tested if they could be associated with the presence of the bacterium by itself. However, there was no difference in IL-10 or TNF-α levels in the plasma of H. pylori-infected patients compared to those in non-infected patients (Figures 5A,B). Similarly, there was no difference in the IL-10 or TNF-α expression in the gastric mucosa of H. pylori-infected patients compared to those non-infected patients (Figures 5C,D).
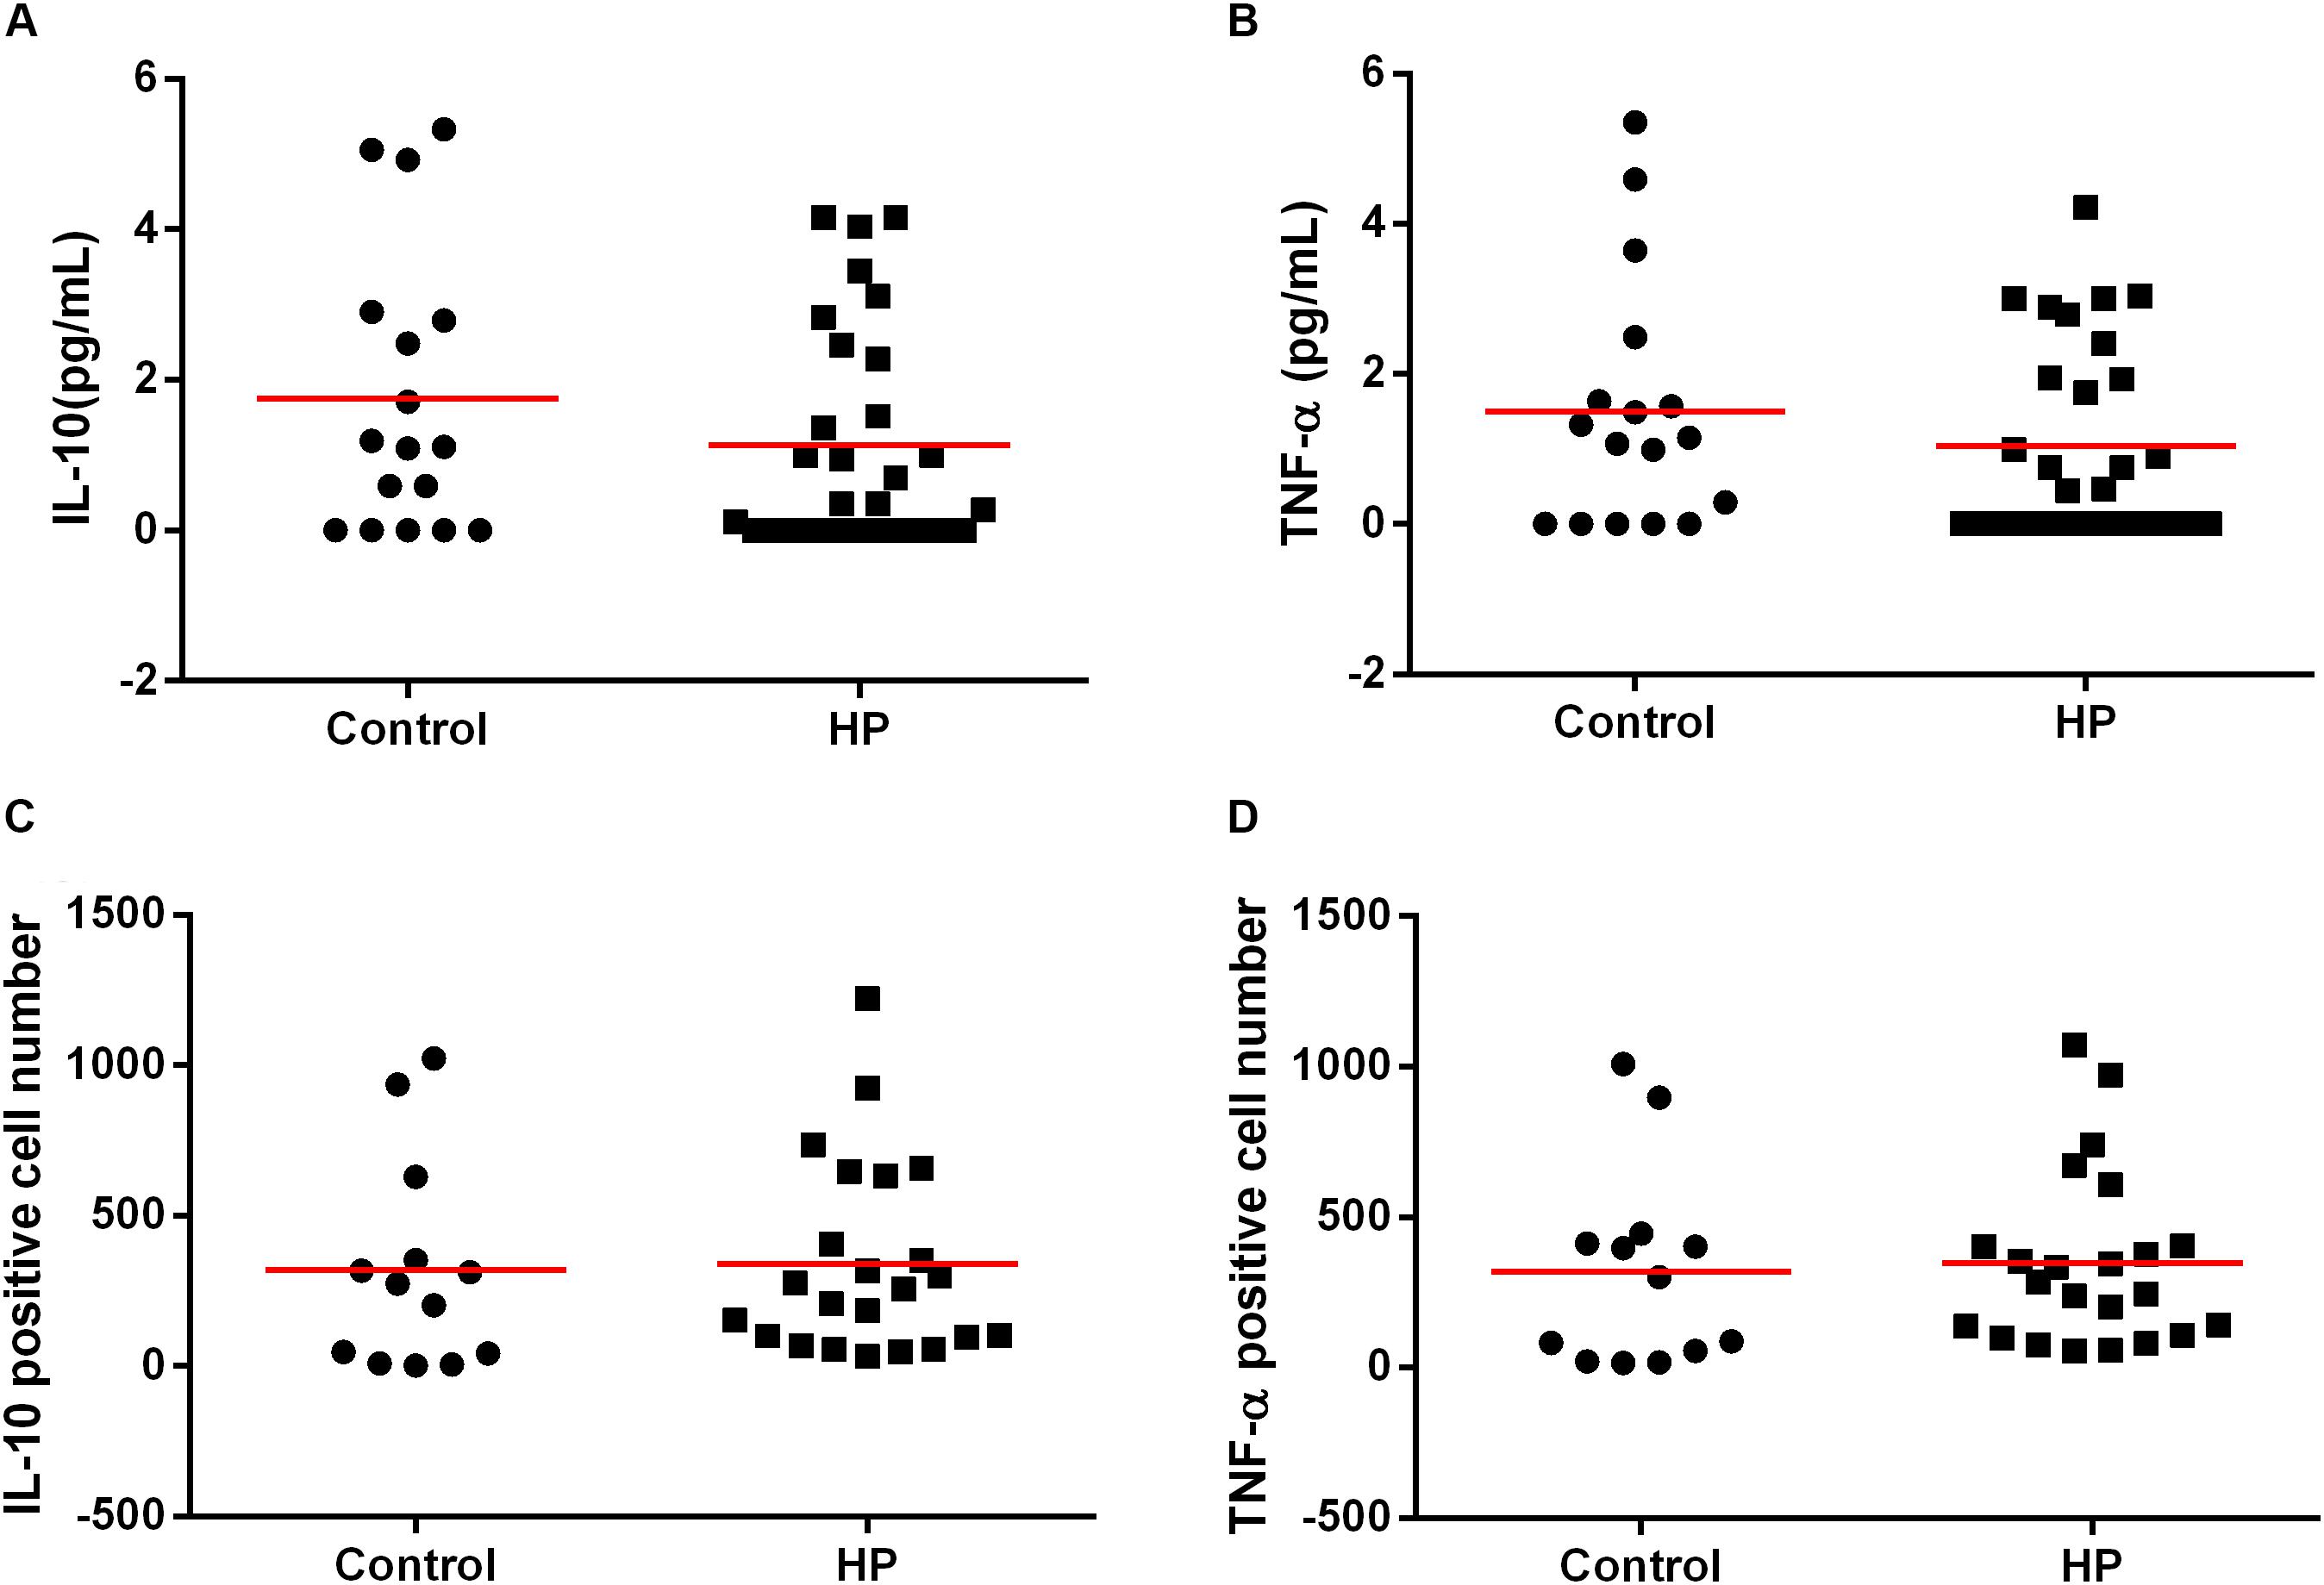
Figure 5. Association between H. pylori infection (HP) with IL-10 and TNF-α cytokines in plasma and in gastric mucosa of patients without H. pylori infection (Control) and with H. pylori infection (HP). Cytokines concentration in plasma were measure by CBA of patients infected with H. pylori (HP, n = 30) or non-infected (Control, n = 17). Concentration of IL-10 (A) and TNF-α (B) in plasma of patients control and HP. The line represents mean of the group. p-value was determined by unpaired two-tailed t-test. Expression of cytokines in the gastric mucosa was evaluated by immunohistochemistry of the infected patients (HP, n = 24) or non-infected group (Control, n = 13). Expression of IL-10 (C) and TNF-α (D) in gastric mucosa of patients control and HP. The line represents median of the group. p-value was determined by non-parametric Mann–Whitney U test. Level of significance, p < 0.05.
Bacterial Density and the Activity of the Chronic Gastritis Were Associated With IL-10 Levels in Plasma
Since we observed that the bacterial density as well as the intensity of gastric mucosa activity and the chronic inflammatory process could be predisposing factors for prediabetes in H. pylori-infected patients, we investigated whether the cytokines were associated with inflammation of the gastric mucosa and the bacterial load. Our results showed a decrease in the expression of IL-10 in plasma and in the gastric mucosa in H. pylori-infected patients with increased bacterial density and a higher degree of neutrophil activity.
In the plasma, IL-10 levels decreased in the group HPdens3 when compared with control, but there was no significant difference between HPdens1 and the control or HPdens2 and the control. Additionally, no difference was found in plasmatic IL-10 levels when comparing the infected groups HPdens1 with HPdens2, HPdens2 with HPdens3 and HPdens3 with HPdens1 (Figure 6A). Furthermore, IL-10 levels in plasma was correlated negatively with the bacterial density (Supplementary Figure S2).
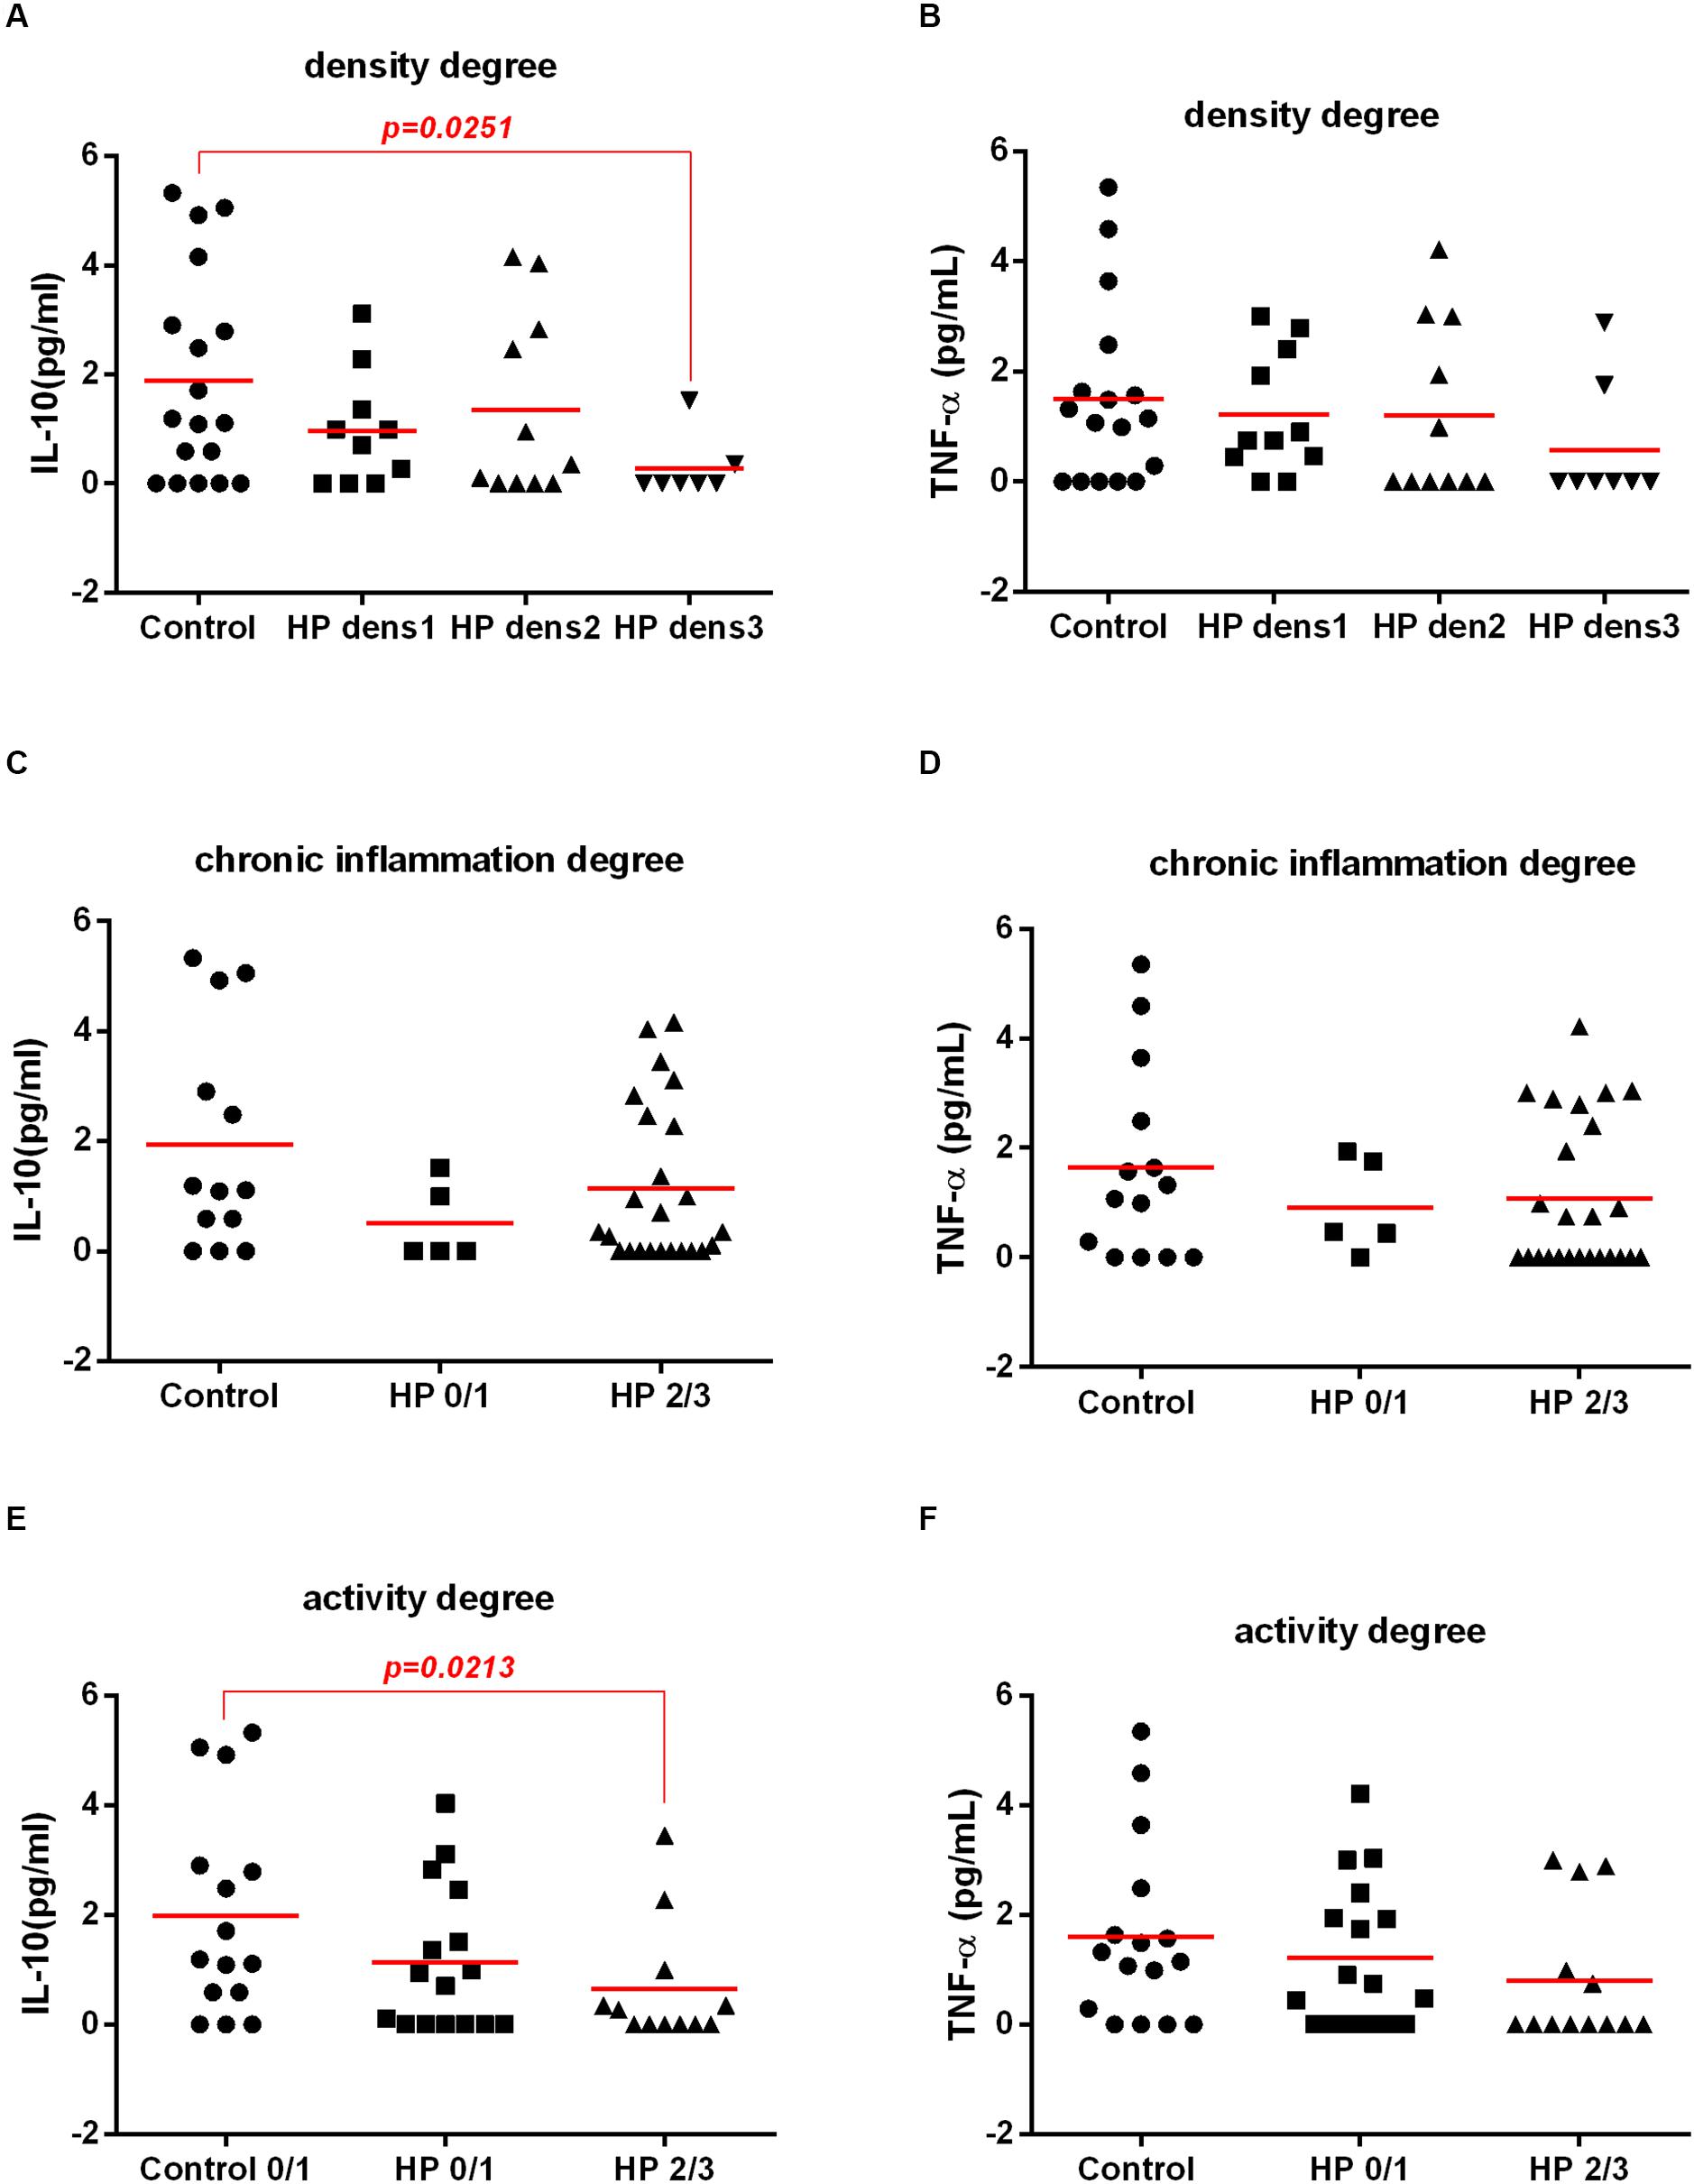
Figure 6. Association between H. pylori infection (HP) with IL-10 and TNF-α cytokines in plasma of patients without H. pylori infection (Control) and with H. pylori infection (HP) according morphological analysis of gastric mucosa. Cytokines concentration in plasma were measure by CBA and histological analysis of the gastric mucosa was evaluated by Sydney System histological classification of patients infected with H. pylori (HP, n = 30) or non-infected (Control, n = 18). Concentration in plasma of IL-10 (A) and TNF-α (B) according degree of bacterial density of non-infected (Control, n = 18), infected-H. pylori with grade 1 density (HP dens1, n = 10), infected-H. pylori with grade 2 density (HP dens2, n = 11), infected-H. pylori with grade 3 density (HP dens3, n = 7). Concentration in plasma of IL-10 (C) and TNF-α (D) according degree of chronic inflammation of non-infected with normal mucosa, or mild chronic inflammation (Control, n = 14), H. pylori-infected with mild chronic inflammation (HP0/1, n = 5), H. pylori infection patients with moderate and severe gastric mucosa chronic inflammation (HP2/3, n = 25). Concentration in plasma of IL-10 (E) and TNF-α (F) according neutrophil activity degree of non-infected with no activity or mild activity (Control, n = 12) or H. pylori infected with mild activity (HP0/1, n = 16), H. pylori infected with moderate and severe gastric mucosa activity (HP2/3, n = 12). The line represents median of the group. p-value was determined by non-parametric Mann–Whitney U test. Level of significance, p < 0.05.
There was no significant association between plasmatic IL-10 levels and the degree of chronic inflammation (Figure 6C). However when the plasmatic expression of the cytokine IL-10 and the activity of the chronic gastritis were analyzed, a significant decrease in IL-10 was observed in the infected groups with moderate and intense gastric mucosa activity (HP2/3) compared with that in the non-infected group with mild activity (Control). However, there was no significant difference between the HP1-infected group and the control group. In addition, there was no significant difference in plasmatic IL-10 levels between the HP1 and HP 2/3 groups (Figure 6E). There was no significant association between the TNF-α levels in plasma with the results of the morphological analysis (Figures 6B,D,F) or the bacterial density (Supplementary Figure S2).
Bacterial Density and the Activity and Chronic Inflammation of the Gastric Mucosa Were Associated With IL-10 Levels in Gastric Mucosa by Immunohistochemistry
IL-10 expression was lower in HPdens2/3 than in the control, but there was no significant difference between HPdens1 with control; in addition, there was no difference between HPdens1 with HPdens2/3 (Figure 7A). According to the degree of chronic inflammation, there was decreased IL-10 expression in H. pylori-infected with moderate/intense chronic inflammation (HP 2/3) compared with that in the control. However, there was no significant difference between H. pylori-infected with low chronic inflammation (HP 0/1) and the control. In addition, there was no significant difference between infected groups HP 0/1 and HP2/3 (Figure 7C). According to activity of the chronic gastritis, there was decreased IL-10 expression in H. pylori-infected with moderate/intense activity (HP2/3) compared with that in the control (non-infected, with no activity or low activity). However, there was no significant difference between H. pylori-infected with low activity (HP 0/1) and the control. In addition, there was no significant difference between infected groups HP 0/1 and HP2/3 (Figure 7E). There was no significant difference in TNF-α level in the gastric mucosa of H. pylori-infected patients according to morphological analysis (Figures 7B,D,F).

Figure 7. Association between H. pylori infection (HP) with IL-10 and TNF-α cytokines expression in gastric mucosa of patients without H. pylori infection (Control) and with H. pylori infection (HP) according morphological analysis of gastric mucosa. Expression of IL-10 and TNF-α in gastric mucosa were evaluated by immunochemistry and histological analysis of the gastric mucosa was evaluated by Sydney System histological classification of patients infected with H. pylori (HP, n = 20) or non-infected (Control, n = 10). Expression in gastric mucosa of IL-10 (A) and TNF-α (B) according degree of bacterial density of the non-infected (Control, n = 10), infected-H. pylori with grade 1 density (HP1, n = 6), infected-H. pylori with grade 2 and grade 3 density (HP2/3, n = 14). Expression in gastric mucosa of IL-10 (C) and TNF-α (D) according degree of chronic inflammation of non-infected with normal mucosa, or mild chronic inflammation (Control, n = 10), H. pylori-infected with mild chronic inflammation (HP0/1, n = 8), H. pylori infection patients with moderate and severe gastric mucosa chronic inflammation (HP2/3, n = 12). Expression in gastric mucosa of IL-10 (E) and TNF-α (F) according degree of gastric mucosa activity of non-infected with no activity or mild activity (Control, n = 10) or H. pylori infected with mild activity (HP0/1, n = 8), H. pylori-infected with moderate and severe gastric mucosa activity (HP 2/3, n = 12). The line represents median of the group. p-value was determined by non-parametric Mann–Whitney U tests. Level of significance, p < 0.05.
The Expression of IL-10 and TNF-α in the Gastric Mucosa Were Positively Correlated With HbA1c Levels
There was no correlation between the plasma levels of IL-10, TNF-α with the HbA1c levels (Figures 8A,B). However, the expression of IL-10 and TNF-α in the gastric mucosa was positively correlated with the HbA1c levels (Figures 8C,D), suggesting that inflammatory and anti-inflammatory markers released in the gastric mucosa during infection by H. pylori may be involved in the disturbance of glucose metabolism.

Figure 8. Correlation between HbA1c levels with IL-10 and TNF-α cytokines, in plasma and in gastric mucosa. Cytokines concentration in plasma were measure by CBA. Correlation between HbA1c with IL-10 (A) and TNF-α (B) plasma concentration of 47 patients. Expression of cytokines in the gastric mucosa was assessed by immunohistochemistry. Correlation between HbA1c with expression of IL-10 (C) and TNF-α (D) in gastric mucosa of 37 patients. Correlations were determined by Spearman’s correlation tests Level of significance, p < 0.05.
There Was No Correlation Between the Levels of Plasma Cytokines and Gastric Mucosa Cytokines
There was no correlation between the plasma levels of IL-10 with expression of IL-10 in the gastric mucosa (Figure 9A). Similarly, there was no correlation between the plasma levels of TNF-α with the expression of TNF-α in the gastric mucosa (Figure 9B).
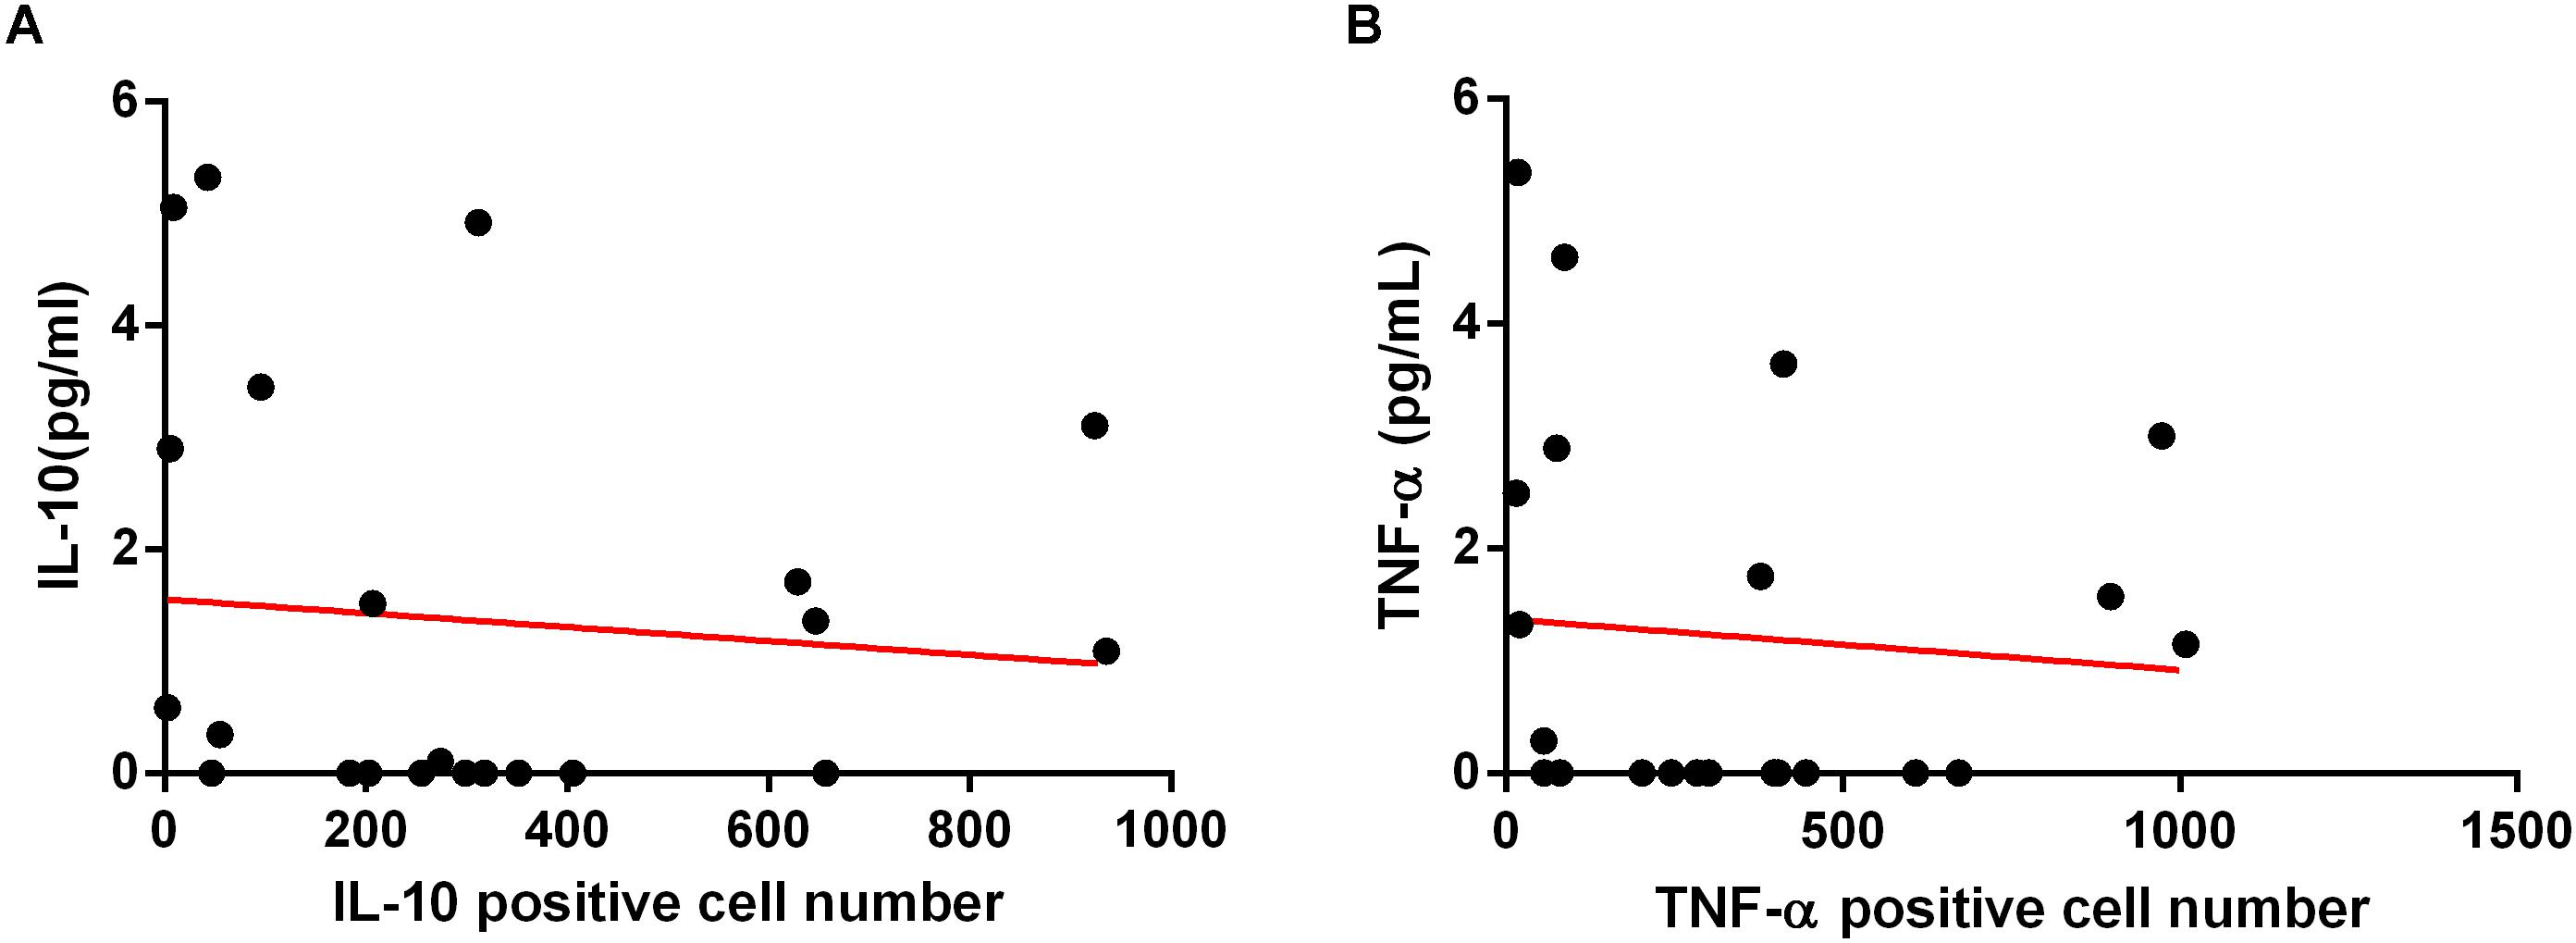
Figure 9. Correlation between cytokines IL-10 with TNF-α, in plasma and in gastric mucosa. Cytokines concentration in plasma were measure by CBA and expression of cytokines in the gastric mucosa was evaluated by immunohistochemistry. (A) Correlation between IL-10 plasma concentration with IL-10 expression in gastric mucosa of 24 patients. (B) Correlation between TNF-α concentration in plasma with TNF-α expression in gastric mucosa. Correlations were determined by Spearman’s correlation tests. Level of significance, p < 0.05.
Discussion
The present study showed that patients infected with H. pylori had higher mean HbA1c levels than non-infected patients, suggesting a positive association between H. pylori infection and prediabetes. However, this association is not related to the presence of H. pylori by itself but depends on the density of bacterial colonization and the degree of both inflammation and the activity of the chronic gastritis.
The association of H. pylori with prediabetes and diabetes is still controversial. According to a systematic review and meta-analysis, H. pylori infection was associated with higher HbA1c levels in patients with type I diabetes but not with T2DM (18). In contrast, in other studies of patients with T2DM, a positive association between H. pylori infection and suboptimal glycemic control was shown (19, 20). A positive association was previously noted between H. pylori infection and prediabetes (11, 12). Draz et al. (11) assessed the association between HP and prediabetes in adults using the oral glucose tolerance test (OGTT) for prediabetes diagnosis and histopathological examination for H. pylori diagnosis. In the present study, we used HbA1c to infer prediabetes status. The use of HbA1c has several advantages over the use of fasting plasma glucose and OGTT, which include increased convenience (fasting is not required), greater preanalytical stability and reduced day-to-day variation due to stress and illness (13). We employed the RUT and histopathological examination for H. pylori diagnosis. The RUT is a highly accurate invasive test for the diagnosis of H. pylori infection (21). By collecting body and antrum tissue fragments, as we did in this study, we reduced the probability of false negative results (22). Histological examination is considered the gold standard method for detecting H. pylori infection and allows morphological analysis of the gastric mucosa (23).
Several hypotheses exist regarding the role of gastric H. pylori infection in glucose regulation and type 2 diabetes development. H. pylori titers were shown to be independent predictors of hyperglycemia and abnormal pancreatic β-cell function, despite their relatively low adiposity (24). In addition, H. pylori infection induced insulin resistance in hepatocytes by activating the c-Jun/miR-203/SOCS3 signaling pathway (25). Furthermore, H. pylori infection may induce local and systemic increases in proinflammatory cytokines by inducing structural changes in insulin receptors and the inhibition of insulin action (9).
This study was designed to investigate whether H. pylori per se or host-related factors are involved in the disturbance of glycated hemoglobin. We observed that H. pylori-infected patients had higher mean HbA1c levels than those not infected with H. pylori. It was interesting to note that when the groups were stratified into HP-infected and non-infected groups and into prediabetic and non-prediabetic groups, it was observed that even in the patients considered non-prediabetic but who were infected with HP, HbA1c levels were higher than those in patients considered non-prediabetic but who were not infected with HP (Supplementary Figure S3), suggesting that HP is an important agent related to the increase in HbA1c.
Then, we compared the endoscopic diagnosis results with the HbA1c levels and observed that among patients diagnosed with pangastritis, HbA1c levels were significantly higher in those with H. pylori infection than in those without infection. Similarly, among patients with peptic ulcers, HbA1c levels were significantly higher in those with H. pylori infection than in those without infection. Moreover, when we compared a group of patients with endoscopic diagnosis of pangastritis associated with H. pylori infection with another group of patients with endoscopic diagnosis of peptic ulcer who were not infected, the HbA1c levels were significantly higher in the group with H. pylori infection than in the group without infection. These data have allowed us to initially assume that H. pylori-related factors could induce disturbances in HbA1c levels.
Interestingly, when we histologically evaluated the gastric mucosa, a significant increase in HbA1c levels was noted in the group of infected patients with moderate and intense activity and chronic inflammation of the gastric mucosa when compared to that in the controls. However, there was no change in HbA1c levels between the control group and the infected group with mild inflammation and low neutrophil activity. These data suggest that the degree of chronic inflammation and the degree of the activity of the gastric mucosa can influence HbA1c levels. Furthermore, we observed increased HbA1c levels in H. pylori-infected patients with increased bacterial density. Studies show that increased bacterial density is associated with a more intense active chronic inflammatory process (26). Thus, we support the hypothesis that the severity of the inflammatory process in the gastric mucosa is a risk factor for prediabetes.
The cross-sectional design of this study is a limitation because only allows us to establish associations, not being able to define a cause-effect relationship. However, epidemiological studies showed that H. pylori infection is acquired in childhood (27). In developing countries the rate of acquisition of the pathogen can reach up to 50% of children at the age of five (28), similar to the prevalence rate in adults (1). Natural clearance of H. pylori infection is difficult to determine and infection can perpetuate throughout the life of the host (2). Therefore, it is possible to believe that H. pylori infection occurred long time before T2DM. Jeon et al. (29) using a prospective cohort demonstrated that individuals seropositive for H. pylori whose diabetic status was not known at the initiation of the study were two times more likely to develop diabetes than those who were seronegative, even after adjusting for age, sex, education, and covariates such as smoking, BMI, blood pressure, and lipids. Chen and Blaser (30) showed that H. pylori seropositivity, and H. pylori cagA positivity in particular, was associated with higher mean HbA1c levels, an association that persisted after excluding individuals with a history of diabetes mellitus and controlling for potential confounders. Study performed by Hsieh et al. (31) observed that long-term H. pylori infection was significantly associated with high levels of HbA1c, decreased insulin secretion, and a higher prevalence of T2DM in Taiwanese patients.
The pathogenesis of T2DM has been associated with a subclinical chronic inflammation and activation of the immune system. H. pylori infection will invariably induce chronic low-grade inflammation with positive regulation of pro-inflammatory cytokines and mediators, such as C-reactive protein, tumor necrosis factor and interleukine-6, which may affect peripheral insulin action and secretion of pancreatic β cells (32, 33).
Type 2 diabetes mellitus is characterized by a metabolic disorder between increased circulating levels of pro-inflammatory cytokines like interleukin- IL-1, IL-6, tumor necrosis factor-(TNF-)α, transforming growth factor-β (TGF-β) and decreased anti-inflammatory cytokines like IL-4, IL-10, IL-13 (34), which are involved with peripheral insulin resistance (8) and beta cell apoptosis in T2DM (34).
In this study, there was no significant differences in the plasma levels between anti-inflammatory (IL-10), and pro-inflammatory cytokine (TNF-α) between groups with and without H. pylori infection. There was also no association between plasma levels of interleukins IL-10 and TNF-α with HbA1c levels. Similar results described by Yang et al. (35) showed that chronic H. pylori infection affects glucose metabolism, but plasma levels of systemic mediators were not involved in these effects. We showed that H. pylori infection might disrupt glucose metabolism, but circulating levels of anti- and pro-inflammatory cytokines do not appear to depend on bacterium’s factors, but on the inflammatory response of the host mucosa.
Our results demonstrated that the bacterial density was negatively correlated with IL-10 cytokine plasma levels. The data shown that although the infection is considered local, it results in systemic impairment of the inflammatory response and depends on the density of H. pylori colonization. Moreover, a decrease in IL-10 expression in the gastric mucosa was observed by immunohistochemistry in H. pylori-infected patients with an increased density of H. pylori colonization and an increased degree of both neutrophil activity and chronic inflammation of the gastric mucosa. Vinagre et al. (36) detected low levels of IL-10 in the gastric mucosa of H. pylori-infected patients with an increased degree of inflammation and increased neutrophil activity of the chronic gastritis. Could the decrease in IL-10 expression during H. pylori infection, as observed in this study, lead to an increase in bacterial colonization and the bacterial density would to increased glycated hemoglobin levels? Or, conversely, could the increase in bacterial density induce decreased expression of IL-10? Could plasmatic IL-10 levels be used as a marker to detect the possible risk of prediabetes in an H. pylori-infected patient? In this study, although a correlation between the levels of cytokines in plasma with cytokines in the gastric mucosa was not demonstrated, the expression of the IL-10 cytokine showed a corresponding systemic and local pattern in H. pylori infection. This suggests that plasma levels of IL-10 reflect the load of bacterial colonization and the intensity of inflammatory process in the gastric mucosa, which reinforces the possibility of serum IL-10 being used as a risk marker for prediabetes in H. pylori-infected patients. Studies indicated the association between the low levels of IL-10 with the high HbA1c levels. For this reason, it is possible to consider the blood levels of IL-10 as one of the predictors of glycemia (37, 38).
In this study, we found no correlation between plasma levels of IL-10 or TNF-α with HbA1c levels. On the other hand, in the gastric mucosa, we observed a positive correlation between IL-10 and TNF-α expression with HbA1c. Wang et al. (39) observed that plasma levels of IL-10 were positively associated with prediabetes or T2DM, in disagreement with other studies that showed that IL-10 improve impaired insulin signaling (40) and prevent pancreatic beta cell destruction (41). However, we observed in our study that H. pylori-infected patients with a higher degree of mucosal inflammation and higher bacterial density had increased levels of HbA1c and reduced levels of IL-10 in the plasma and gastric mucosa. Thus, the increase in HbA1c levels would be dependent on inflammatory response degree of the host mucosa, which is dependent of bacterial density. Most studies found that subjects with insulin resistance or T2DM had increased levels of TNF-α (42). It has been reported that chronic exposure of insulin-producing pancreatic cells (β cells) to the pro-inflammatory cytokine TNF-α can inhibit insulin secretion and induce apoptosis of pancreatic β cells (42). The progression from normal glucose tolerance to prediabetes and T2DM is characterized by continuous defects in β cell function (43). In this study, patients infected with H. pylori showed a positive correlation between TNF-α expression in the gastric mucosa and HbA1c levels, which suggests that the pro-inflammatory cytokines induced by H. pylori infection play an important role in the disorder of glucose metabolism.
Another question to keep in mind is whether eradicating H. pylori infection could reduce HbA1c levels in H. pylori-infected patients without prediabetes. Data are conflicting regarding the impact of H. pylori eradication on glucose metabolism. H. pylori eradication improved the mean HbA1c values in non-diabetic patients (44) and in patients with T2DM (45).
We consider H. pylori infection to be a risk factor for prediabetes, and we believe this is an additional reason to eradicate H. pylori infection in adulthood. Special attention should be given to those patients with higher bacterial loads and higher degrees of inflammation and neutrophil activity of the chronic gastritis. In these patients, the evaluation of HbA1c levels would be of interest.
More studies are necessary to elucidate whether H. pylori per se or host-related factors are involved in disturbances of glycated hemoglobin. Detailed analysis of the levels of pro- and anti-inflammatory cytokines in the gastric mucosa and glycated hemoglobin levels in patients infected with H. pylori appears to be of relevance for further study.
Data Availability Statement
The raw data supporting the conclusions of this article will be made available by the authors, without undue reservation.
Ethics Statement
The National Committee for Research Ethics (CONEP) approved this study according to CAAEE 07989412.0.0000.5086. The patients/participants provided their written informed consent to participate in this study.
Author Contributions
SM, NS, and FN conceived and designed the experiments. SM, DNC, DMC, JN, BM, LDS, and MB performed the experiments. SM, JS, DMC, LAS, JN, RG, and FN analyzed the data. NS, RG, and FN contributed reagents, materials, analysis tools. SM, JN, LAS, RG, NS, and FN wrote the manuscript. All authors contributed to the article and approved the submitted version.
Conflict of Interest
The authors declare that the research was conducted in the absence of any commercial or financial relationships that could be construed as a potential conflict of interest.
Acknowledgments
We thank the Brazilian funding agencies FAPEMA (Fundação de Amparo à Pesquisa e ao Desenvolvimento Científico e Tecnológico do Maranhão), CNPq (Conselho Nacional de Desenvolvimento em Pesquisa), and CAPES (Coordenação de Aperfeiçoamento de Pessoal de Nível Superior) for financial support and author fellowships. We thank to IECT Biotechnology (FAPEMA). We are also grateful to Dr. Gyl Eanes for technical assistance.
Supplementary Material
The Supplementary Material for this article can be found online at: https://www.frontiersin.org/articles/10.3389/fimmu.2020.02121/full#supplementary-material
FIGURE S1 | Association between H. pylori infection (HP) with glycated hemoglobin (HbA1c) levels in patients without (Control) or with H. pylori infection (HP) according endoscopic diagnosis. Endoscopic diagnosis were evaluated according endoscopic classification of the Sydney System of patients infected with H. pylori and with pangastritis (HP gastritis, n = 34) or non-infected with peptic ulcer (Control peptic ulcer, n = 10).
FIGURE S2 | Correlation between cytokines IL-10 and TNF-α, in plasma and in gastric mucosa with degree bacterial density of the gastric mucosa. Cytokines concentration in plasma were measure by CBA, expression of cytokines in the gastric mucosa were evaluated by immunohistochemistry and degree bacterial density was evaluated by Sydney System histological classification. Correlation between bacterial density of the gastric mucosa with IL-10 (A) and TNF-α (B) plasma concentration of 47 patients. Correlation between bacterial density of the gastric mucosa with expression of IL-10 (C) and TNF-α (D) in gastric mucosa of 37 patients. Correlations were determined by Spearman’s correlation tests. Level of significance, p < 0.05.
FIGURE S3 | Association between H. pylori infection (HP) with glycated hemoglobin (HbA1c) levels in patients non-prediabetic (Non-prediabetic HP) and prediabetic (Prediabetic HP) with H. pylori infection, patients non-prediabetic (Non-prediabetic control) and prediabetic (Prediabetic control) without H. pylori infection. HbA1c levels were evaluated in the plasma of patients Non-prediabetic HP (n = 22), Prediabetic HP (n = 40), Non-prediabetic control (n = 13) and Prediabetic control (n = 9) using a method certified by the National Glycohemoglobin Standardization Program (NGSP). p-value was determined by unpaired two-tailed t-test. *p < 0.05 compared Non-prediabetic HP and Non-prediabetic control group. **p < 0.0001 compared Non-prediabetic control and Prediabetic control groups. #p < 0.0001 compared Non-prediabetic HP and Prediabetic HP groups. Level of significance, p < 0.05.
References
1. Zamani M, Ebrahimtabar F, Zamani V, Miller WH, Alizadeh-Navaei R, Shokri-Shirvani J, et al. Systematic review with meta-analysis: the worldwide prevalence of Helicobacter pylori infection. Aliment Pharmacol Ther. (2018) 47:868–76. doi: 10.1111/apt.14561
2. Abadi ATB. Strategies used by Helicobacter pylori to establish persistent infection. World J Gastroenterol. (2017) 23:2870–82. doi: 10.3748/wjg.v23.i16.2870
3. Zaterka S, Eisig JN, Chinzon D, Rothstein W. Factors related to Helicobacter pylori prevalence in an adult population in Brazil. Helicobacter. (2007) 12:82–8. doi: 10.1111/j.1523-5378.2007.00474.x
4. Franceschi F, Zuccalà G, Roccarina D, Gasbarrini A. Clinical effects of Helicobacter pylori outside the stomach. Nat Rev Gastroenterol Hepatol. (2014) 11:234–42. doi: 10.1038/nrgastro.2013.243
5. He C, Yang Z, Lu NH. Helicobacter pylori infection and diabetes: is it a myth or fact. World J Gastroenterol. (2014) 20:4607–17. doi: 10.3748/wjg.v20.i16.4607
6. Han X, Li Y, Wang J, Liu B, Hu H, Li X, et al. Helicobacter pylori infection is associated with type 2 diabetes among a middle- and old-age Chinese population. Diabetes Metab Res Rev. (2016) 32:95–101. doi: 10.1002/dmrr.2677
7. Horikawa C, Kodama S, Fujihara K, Yachi Y, Tanaka S, Suzuki A, et al. Association of Helicobacter pylori infection with glycemic control in patients with diabetes: a meta-analysis. J Diabetes Res. (2014) 2014:250620. doi: 10.1155/2014/250620
8. Arora P, Garcia-Bailo B, Dastani Z, Brenner D, Villegas A, Malik S, et al. Genetic polymorphisms of innate immunity-related inflammatory pathways and their association with factors related to type 2 diabetes. BMC Med Genet. (2011) 12:95. doi: 10.1186/1471-2350-12-95
9. Wellen KE, Hotamisligil GS. Inflammation, stress, and diabetes. J Clin Invest. (2005) 115:1111–9. doi: 10.1172/JCI25102
10. Yang GH, Wu JS, Yang YC, Huang YH, Lu FH, Chang CJ. Gastric Helicobacter pylori infection associated with risk of diabetes mellitus, but not prediabetes. J Gastroenterol Hepatol. (2014) 29:1794–9. doi: 10.1111/jgh.12617
11. Draz U, Rathore R, Butt NF, Randhawa FA, Malik U, Waseem T. Presence of pre-diabetes in Helicobacter pylori positive versus Helicobacter pylori negative patients having dyspepsia. J Pak Med Assoc. (2018) 68:939–41.
12. Htun NSN, Odermatt P, Müller I, Yap P, Steinmann P, Schindler C, et al. Association between gastrointestinal tract infections and glycated hemoglobin in school children of poor neighborhoods in Port Elizabeth, South Africa. PLoS Negl Trop Dis. (2018) 12:e0006332. doi: 10.1371/journal.pntd.0006332
13. American Diabetes Association2. Classification and diagnosis of diabetes: standards of medical care in diabetes–2019. Diabetes Care. (2019) 42(Suppl. 1):S13–28.
14. Coelho LGV, Marinho JR, Genta R, Ribeiro LT, Passos MDCF, Zaterka S, et al. IVth Brazilian consensus conference on Helicobacter pylori infection. Arq Gastroenterol. (2018) 55:97. doi: 10.1590/s0004-2803.201800000-20
15. Tytgat GN. The Sydney system: endoscopic division. Endoscopic appearances in gastritis/Duodenitis. J Gastroenterol Hepatol. (1991) 6:223–34. doi: 10.1111/j.1440-1746.1991.tb01469.x
16. Stolte M, Meining A. The updated sydney system: classification and grading of gastritis as the basis of diagnosis and treatment. Can J Gastroenterol. (2001) 15:591–8. doi: 10.1155/2001/367832
17. Rauws EA, Langenberg W, Houthoff HJ, Zanen HC, Tytgat GN. Campylobacter pyloridis-associated chronic active antral gastritis. Gastroenterology. (1988) 94:33–40. doi: 10.1016/0016-5085(88)90606-3
18. Dai YN, Yu WL, Zhu HT, Ding JX, Yu CH, Li YM. Is Helicobacter pylori infection associated with glycemic control in diabetics? World J Gastroenterol. (2015) 21:5407–16. doi: 10.3748/wjg.v21.i17.5407
19. Ibrahim A, Zaher T, Ghonemy TA, El-Azim SA, El-Azim MA, Ramadan A. Impact of cytotoxin-associated gene A of Helicobacter pylori strains on microalbuminuria in type 2 diabetes. Saudi J Kidney Dis Transpl. (2010) 21:694–700. doi: 10.4314/ajnt.v3i2.58892
20. Wang SZ, Shi YN, Zhao J, Wang ZD. The effect of Helicobacter pylori on blood glucose fluctuations in patients with type 2 diabetes. Zhonghua Yi Xue Za Zhi. (2009) 89:958–61. doi: 10.3760/cma.j.issn.0376-2491.2009.14.007
21. Wang YK, Kuo FC, Wu DC. Diagnosis of Helicobacter pylori infection: current options and developments. World J Gastroentrol. (2015) 21:11221–35. doi: 10.3748/wjg.v21.i40.11221
22. Parihar V, Holleran G, McNamara D. A combined antral and corpus rapid urease testingprotocol can increase diagnostic accuracy despite a low prevalence of Helicobacter pylori infection in patients undergoing routine gastroscopy. UEG J. (2015) 3:432–6. doi: 10.1177/2050640615573374
23. Moon SW, Kim TH, Lee OJ. United rapid urease test is superior than separate test indetecting Helicobacter pylori at the gastric antrum and body specimens. Clin Endosc. (2012) 45:392–6. doi: 10.5946/ce.2012.45.4.392
24. So WY, Tong PC, Ko GT, Ma RC, Ozaki R, Kong AP, et al. Low plasma adiponectin level, white blood cell count and Helicobacter pylori titre independently predict abnormal pancreatic β-cell function. Diabetes Res Clin Pract. (2009) 86:89–95. doi: 10.1016/j.diabres.2009.08.010
25. Zhou X, Liu W, Gu M, Zhou H, Zhang G. Helicobacter pylori infection causes hepatic insulin resistance by the c-Jun/miR-203/SOCS3 signaling pathway. J Gastroenterol. (2015) 50:1027–40. doi: 10.1007/s00535-015-1051-6
26. Ladeira MSP, Salvadori DMF, Rodrigues MAM. Biopathology of Helicobacter pylori. J Bras Patol Med Lab. (2003) 39:335–42. doi: 10.1590/S1676-24442003000400011
27. Yokota S, Konno M, Fujiwara S, Toita N, Takahashi M, Yamamoto S, et al. Intrafamilial, preferentially mother-to-child and intraspousal, H. pylori infection in Japan determined by mutilocus sequence typing and random amplified polymorphic DNA fingerprinting. Helicobacter. (2015) 20:334–42. doi: 10.1111/hel.12217
28. Parente JM, da Silva BB, Palha-Dias MP, Zaterka S, Nishimura NF, Zeitune JM. Helicobacter pylori infection in children of low and high socioeconomic status in northeast brazil. Am J Trop Med Hyg. (2006) 75:509–12. doi: 10.4269/ajtmh.2006.75.509
29. Jeon CY, Haan MN, Cheng C, Clayton ER, Mayeda ER, Miller JW, et al. Helicobacter pylori infection is associated with an increased rate of diabetes. Diabetes Care. (2012) 35:520–5. doi: 10.2337/dc11-1043
30. Chen Y, Blaser MJ. Association between gastric Helicobacter pylori colonization and glycated hemoglobin levels. J Infect Dis. (2012) 205:1195–202. doi: 10.1093/infdis/jis106
31. Hsieh MC, Wang SS, Hsieh YT, Kuo FC, Soon MS, Wu DC. Helicobacter pylori infection associated with high HbA1c and type 2 diabetes. Eur J Clin Invest. (2013) 43:949–56.
32. Hamed SA, Amine NF, Galal GM, Helal SR, Tag El-Din LM, Shawky OA, et al. Vascular risks and complications in diabetes mellitus: the role of helicobacter pylori infection. J Stroke Cerebrovasc Dis. (2008) 17:86–94. doi: 10.1016/j.jstrokecerebrovasdis.2007.10.006
33. Abolfaz S, Nodoushan H, Nabavi A. The interaction of Helicobacter pylori infection and type 2 diabetes mellitus. Adv Biomed Res. (2019) 8:15. doi: 10.4103/abr.abr_37_18
34. Saxena M, Srivastava N, Banerjee M. Association of IL-6, TNF-α and IL-10 gene polymorphisms with type 2 diabetes mellitus. Mol Biol Rep. (2013) 40:6271–9. doi: 10.29333/ejgm/82250
35. Yang Z, Li W, He C, Xie C, Zhu Y, Lu NH. Potential effect of chronic Helicobacter pylori infection on glucose metabolism of Mongolian gerbils. World J Gastroenterol. (2015) 21:12593–604. doi: 10.3748/wjg.v21.i44.12593
36. Vinagre RMDF, Vinagre IDF, Vilar-e-Silva A, Fecury AA, Martins LC. Helicobacter pylori infection and immune profile of patients with different gastroduodenal diseases. Arq Gastroenterol. (2018) 55:122–7. doi: 10.1590/S0004-2803.201800000-21
37. Acharya AB, Thakur S, Muddapur MV. Evaluation of serum interleukin-10 levels as a predictor of glycemic alteration in chronic periodontitis and type 2 diabetes mellitus. J Indian Soc Periodontol. (2015) 19:388–92. doi: 10.4103/0972-124X.150876
38. Acharya AB, Thakur S, Muddapur MV. Effect of scaling and root planning on serum interleukin-10 levels and glycemic control in chronic periodontitis and type 2 diabetes mellitus. J Indian Soc Periodontol. (2015) 19:188–93. doi: 10.4103/0972-124x.148644
39. Wang Z, Shen X-H, Feng W-M, Ye G-f, Qiu W, Li B. Analysis of inflammatory mediators in prediabetes and newly diagnosed type 2 diabetes patients. J Diabetes Res. (2016) 2016:7965317. doi: 10.1155/2016/7965317
40. Aroor AR, McKarns S, Demarco VG, Jia G, Sowers JR. Maladaptive immune and inflammatory pathways lead to cardiovascular insulin resistance. Metabolism. (2013) 62:1543–52. doi: 10.1016/j.metabol.2013.07.001
41. Saxena M, Agrawal CC, Bid HK, Banerjee M. An interleukin-10 gene promoter polymorphism. (−592A/C) associated with type 2 diabetes: a North Indian study. Biochem Genet. (2012) 50:549–59. doi: 10.1007/s10528-012-9499-z
42. Wang C, Guan Y, Yang J. Cytokines in the progression of pancreatic β-cell dysfunction. Int J Endocrinol. (2010) 2010:10. doi: 10.1155/2010/515136.515136
43. Weyer C, Hanson RL, Tataranni PA, Bogardus C, Pratley RE. A high fasting plasma insulin concentration predicts type 2 diabetes independent of insulin resistance: evidence for a pathogenic role of relative hyperinsulinemia. Diabetes. (2000) 49:2094–101. doi: 10.2337/diabetes.49.12.2094
44. Roca-Rodríguez MM, Coín-Aragüez L, Cornejo-Pareja I, Alcaide J, Clu-Fernández C, Muñoz-Garach A, et al. Carbohydrate metabolism improvement after Helicobacter pylori eradication. Diabetes Metab. (2016) 42:130–4. doi: 10.1016/j.diabet.2015.11
Keywords: Helicobacter pylori, glycated hemoglobin, prediabetes, chronic gastritis, cytokines, inflammation
Citation: Maluf S, Salgado JV, Cysne DN, Camelo DMF, Nascimento JR, Maluf BVT, Silva LDM, Belfort MRC, Silva LA, Guerra RNM, Salgado Filho N and Nascimento FRF (2020) Increased Glycated Hemoglobin Levels in Patients With Helicobacter pylori Infection Are Associated With the Grading of Chronic Gastritis. Front. Immunol. 11:2121. doi: 10.3389/fimmu.2020.02121
Received: 14 April 2020; Accepted: 05 August 2020;
Published: 10 September 2020.
Edited by:
Marina De Bernard, University of Padua, ItalyReviewed by:
Holly Algood, Vanderbilt University, United StatesMario M. D’Elios, University of Florence, Italy
Copyright © 2020 Maluf, Salgado, Cysne, Camelo, Nascimento, Maluf, Silva, Belfort, Silva, Guerra, Salgado Filho and Nascimento. This is an open-access article distributed under the terms of the Creative Commons Attribution License (CC BY). The use, distribution or reproduction in other forums is permitted, provided the original author(s) and the copyright owner(s) are credited and that the original publication in this journal is cited, in accordance with accepted academic practice. No use, distribution or reproduction is permitted which does not comply with these terms.
*Correspondence: Flávia Raquel F. Nascimento, bmFzY2ltZW50b2ZyZkB5YWhvby5jb20uYnI=