 Xiaolan Ye1†Zhe Wang2,3,4†Qiang Ye1Jing Zhang2,3Ping Huang1Jingying Song5
 Yiwen Li6Hongjuan Zhang6Feifeng Song1
 Zixue Xuan1*Kejian Wang7*
- 1Department of Pharmacy, People's Hospital of Hangzhou Medical College, Zhejiang Provincial People's Hospital, Hangzhou, China
- 2National Engineering Research Center for Protein Drugs, Beijing, China
- 3GS Medical (Beijing) Technology Development LLC, Beijing, China
- 4JITRI Applied Adaptome Immunology Institute, Nanjing, China
- 5Department of Nephrology, Changed Central Hospital, Chengde, China
- 6Department of Nephrology, People's Hospital of Hangzhou Medical College, Zhejiang Provincial People's Hospital, Hangzhou, China
- 7Lin He's Academician Workstation of New Medicine and Clinical Translation at The Third Affiliated Hospital, Guangzhou Medical University, Guangzhou, China
T cell receptor (TCR)-mediated immune functions are closely related to autoimmune diseases, such as systemic lupus erythematosus (SLE). However, technical challenges used to limit the accurate profiling of TCR diversity in SLE and the characteristics of SLE patients remain largely unknown. In this study, we collected peripheral blood samples from 10 SLE patients with lupus nephritis (LN) who were confirmed by renal biopsy, as well as 10 healthy controls. The TCR repertoire of each sample was assessed by high-throughput sequencing to examine the distinction between SLE subjects and healthy controls. Our results showed statistically significant differences in TCR diversity and usage of TRBV/TRBJ genes between the two groups. A set of signature V–J combinations enabled efficient identification of SLE cases, yielding an area under the curve (AUC) of 0.89 (95% CI: 0.74–1.00). Taken together, our results revealed the potential correlation between the TCR repertoire and SLE status, which may facilitate the development of novel immune biomarkers.
Introduction
Systemic lupus erythematosus (SLE) is a prototypic autoimmune disorder. As one of the most common and severe complications in SLE, lupus nephritis (LN) is a major cause of SLE-related morbidity and mortality (1, 2). LN requires confirmation by renal biopsy, which is an invasive procedure (3, 4). Without early diagnosis and treatment, LN can usually progress to end-stage renal disease (ESRD) (5). Since it is impractical to perform renal biopsy repeatedly, a non-invasive method for diagnosis and prognosis surveillance of LN is urgently needed (6).
It has been reported that highly diversified T cell receptors (TCRs) are crucial for adaptive immunity in health and disease (7, 8). TCRs are generated by genomic rearrangement of the variable (V), diversity (D), and joining (J) regions, along with palindromic and random nucleotide additions (9). Recently, a series of studies have demonstrated substantial changes in the TCR repertoire of SLE patients (10–13). For instance, Liu et al. (11) found significant differences in V, J, and V–J pairs in SLE patients. And 198 SLE-associated TCR clones were identified for correlation with clinical features (11). However, the changes of TCR repertoire in SLE patients with LN have yet to be described.
In this study, we performed high-throughput sequencing to characterize the TCR repertoire in peripheral blood samples from SLE patients with LN and healthy controls. The results may help understand the property and alteration of T cell immunity in the occurrence and development of SLE.
Materials and Methods
Study Participants
A total of 10 SLE patients with LN and 10 healthy controls were recruited from the Zhejiang Provincial People's Hospital, Hangzhou, China. The pathological status of LN patients was confirmed by renal biopsy. The controls were confirmed with no autoimmune disorders or kidney complications. Written informed consents were obtained from all participants. This study was approved by the Ethics Committee of Zhejiang Provincial People's Hospital.
The baseline characteristics of SLE and control groups were presented in Table 1. Following professional guidelines, the diagnosis of LN was confirmed with histopathological examination of renal biopsy. The SLE cases belong to Class-II, Class-IV, and Class-V, respectively. Although the range of age was larger in the SLE group than in the control group (20–68 vs. 35–52), the average age was not significantly different between the two groups (45.9 vs. 45.8). In the current study, we used European League Against Rheumatism (EULAR)/American College of Rheumatology (ACR) classification criteria for SLE, which is a combination of multiple disciplines and international recognition, thus displayed great sensitivity and specificity. The subjects included in our study have multi-organ injury, including hematologic, mucocutaneous, serosal, and renal. In addition, renal biopsy score of class II or V LN is 8 and class II or IV is 10. Therefore, the SLE disease activity index score was 17.40 ± 4.74.
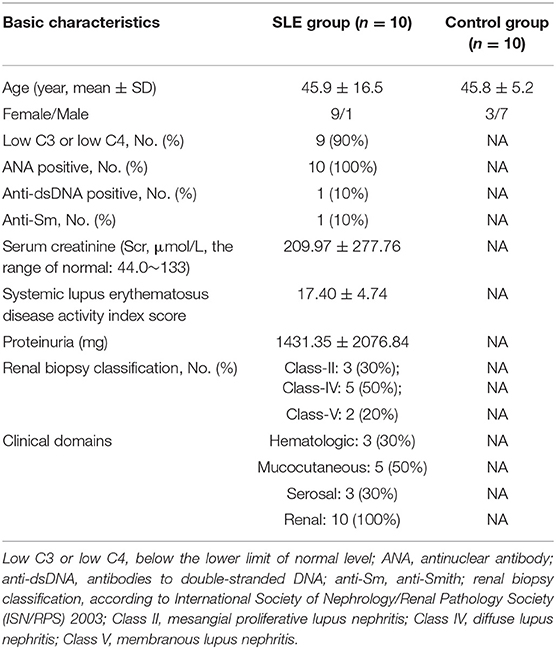
Table 1. Basic characteristics of study subjects.
Whole Blood Sample Processing
Peripheral blood mononuclear cells (PBMCs) were extracted from whole blood with Ficoll® to get the highest concentration of lymphocytes. Each type of lymphocyte cell was isolated with monoclonal antibodies specific for the particular lymphocyte cell subset. All cell samples were resuspended in RNAprotect® and stored at 4°C until ready to extract RNA. For low cell counts (<5 * 105), total RNA was extracted from the Qiagen® RNeasy® Micro kit (catalog #74004). For higher cell counts, RNA was extracted from the Qiagen® RNeasy® Mini kit (catalog #74104).
Library Construction and Sequencing
RT-PCR multiplex primer sets (iRepertoire, Inc., Huntsville, AL, USA) were used to amplify the CDR3 region of the TCRβ chain. The whole library construction process was automatically operated in the iR-ProcecessorTM and iR-Cassette (iRepertoire, Inc., Huntsville, AL, USA). Then library products with different bar codes were pooled and paired-end sequenced by Illumina MiSeq v2 300-cycle Kit (Illumina Inc.), average read depth of 1M reads each sample (14, 15).
Raw Data Analysis
Sequences were aligned to TCRβ germline V-, D-, and J-genes according to IMGT/GENE-DB database. Analyzed by the Smith–Waterman algorithm using iR-map pipeline and visualized in iRweb (iRepertoire, Inc., AL, USA). Data analysis included peptide sequences, uCDR3, shared CDR3s, and V- and J-gene usage. Detailed method has been described by Wang et al. (16). The statistics of sequencing quality has been presented in Table S1. The sequencing quality of one SLE sample and one control sample was double-checked and shown in Figure S2. The raw data can be freely downloaded online at: https://figshare.com/search?q=DIO%3A10.6084%2Fm9.figshare.11911284&searchMode=1.
Statistical Analysis
All statistical analysis was performed using R software (version 3.6.1). Indexes of normal distribution were expressed by mean ± standard deviation. T-test for independent samples was performed on comparison between groups. Indexes of non-normal distribution were expressed by median (interquartile interval). Chi-square test was used to compare the counting indexes between groups. Logistic regression was used to analyze the relationship between the specific clone expression level and the clinical outcome. To identify the signature clonotypes, Random Forest analysis (“randomForest” package in R software) together with leave-one-out cross validation was performed to estimate the area under the receiver operating characteristics (ROC) curve and the importance of individual variables.
Results
Repertoire Diversity in Systemic Lupus Erythematosus
We primarily analyzed the abundance and diversity of different TCR clonotypes. The CDR3 sequences were divided into four groups (<0.001, 0.001–0.005, 0.005–top 101, and top 100, respectively) based on their frequency in our samples. The results showed that low abundance clones (i.e., frequency <0.001 and 0.001–0.005%) were less abundant, while top 100 clones were more frequent in SLE individuals (Figure 1A; Table S2), suggesting putatively decreased TCR diversity. The significantly lower D50 diversity index in the SLE group as compared to control group (Figure 1B) further confirmed that the TCR diversity is evidently impaired in SLE. On the other hand, we observed no substantial differences in CDR3 length and amino acid composition between SLE and control groups (Figure 2; Tables S3, S4).
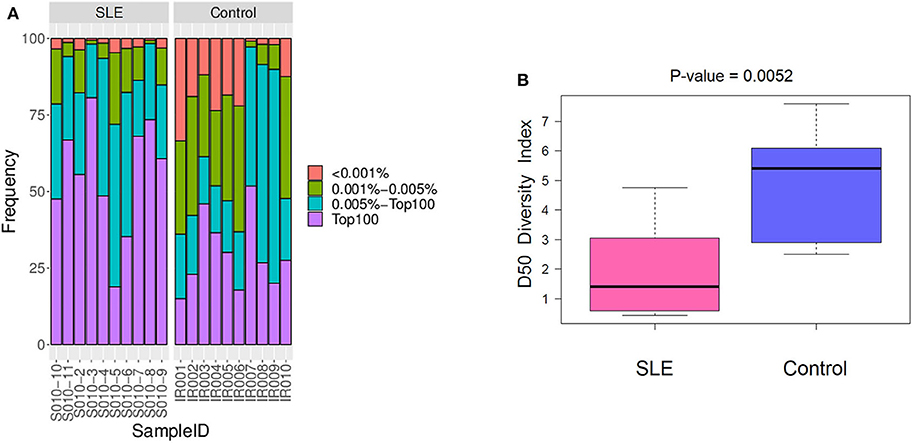
Figure 1. The abundance and diversity of T cell receptor (TCR) clonotype. (A) The frequency distribution of different clonotypes. (B) The TCR diversity of each group was measured by the D50 index at the level of the V-J combination.
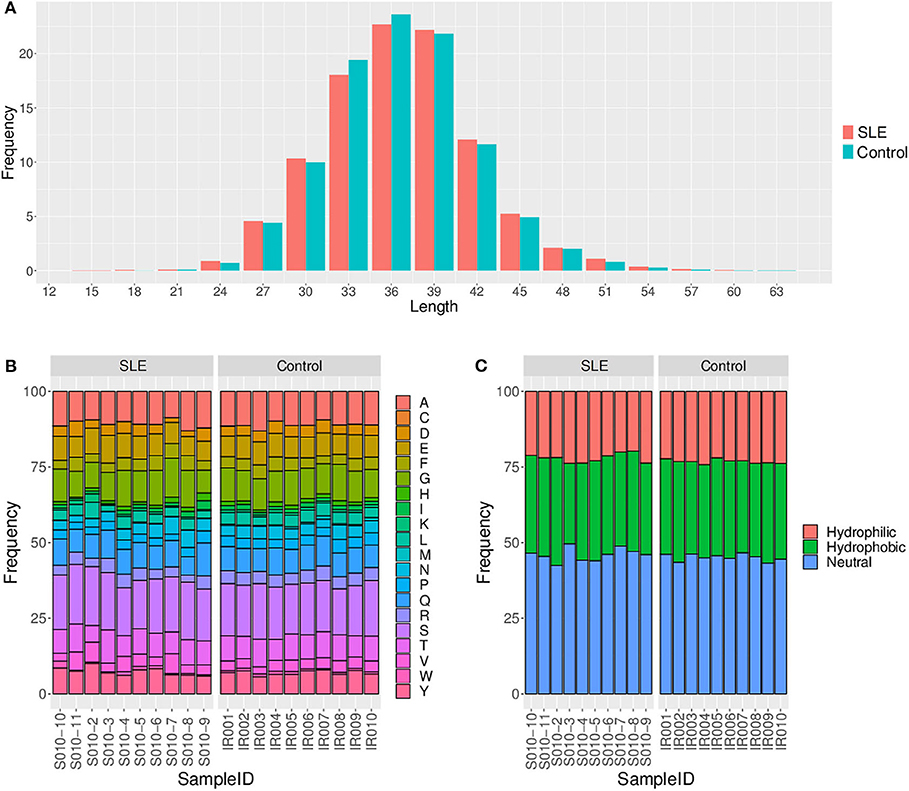
Figure 2. Comparison of the CDR3 length (A), amino acid composition (B), and amino acid hydrophilicity (C) between the systemic lupus erythematosus (SLE) group and control group.
Characteristics of TRBV and TRBJ Gene Usage in Lupus Nephritis
We then evaluated the gene usage of TRBV and TRBJ in SLE cases and control subjects (Figure 3A). A series of V–J combinations were identified for differential abundance in the two groups (Table 2). We further performed Principal Component Analysis (PCA) on the V–J combination frequency profile. As shown in the PCA plot (Figure 3B), a significant difference was found between SLE and control groups (PERMANOVA P < 0.05), as the samples from the control subjects were highly clustered in the upper right quarter of the graph. On the other hand, no obvious difference in sex or renal biopsy classification was detected on the PCA plot (Figure S1).
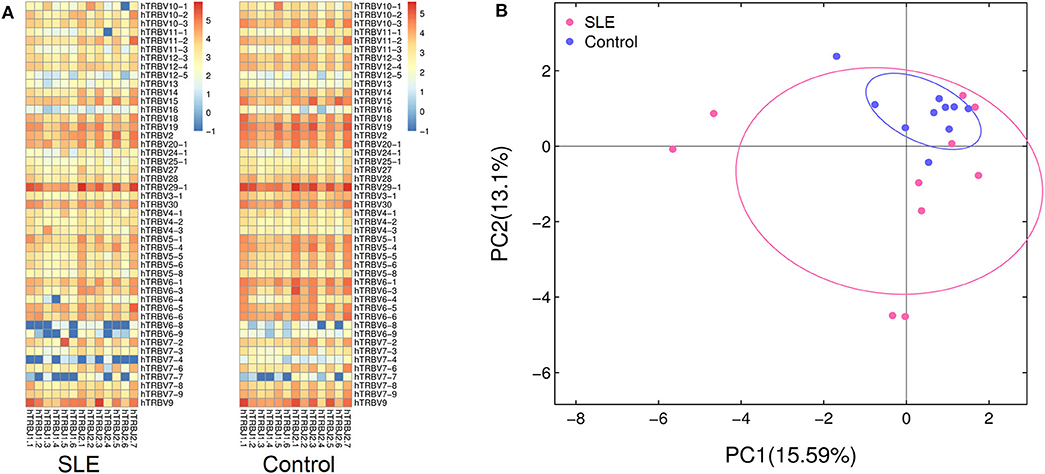
Figure 3. Characterization of TRBV and TRBJ usage. (A) The heat map showing frequencies of V-J combinations in the systemic lupus erythematosus (SLE) group and control group. (B) Principal component analysis (PCA) based on the abundance of T cell receptor (TCR) clones. The distance between the dots on the graph indicates the degree of dissimilarity of TCR profile between samples.
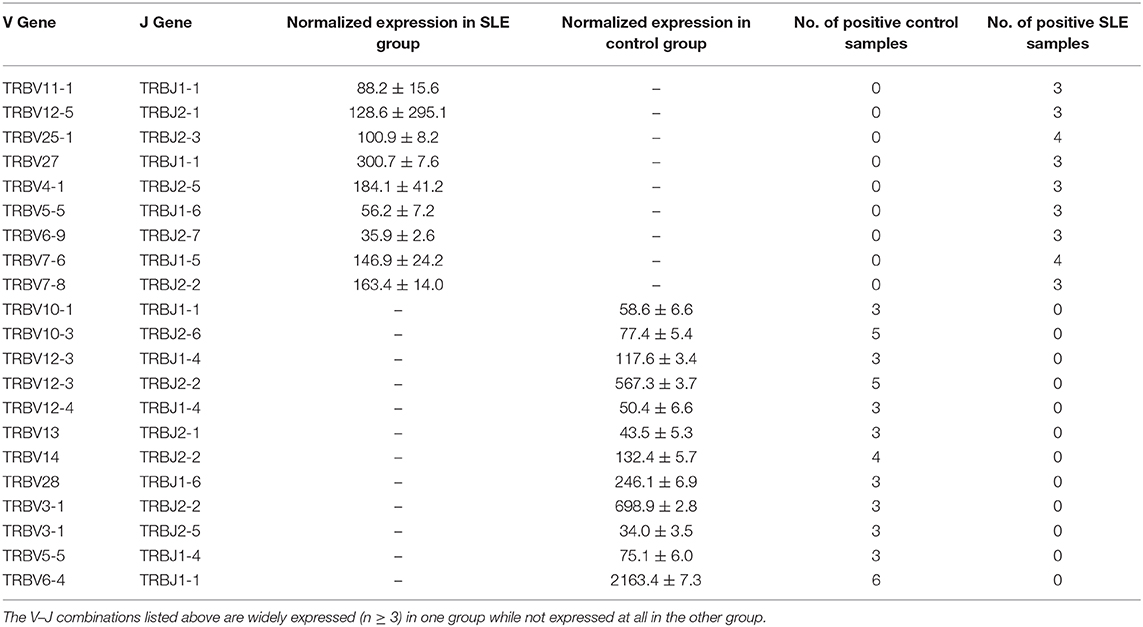
Table 2. V–J combinations with asymmetric expression in the two groups.
We also trained a random forest model (see Materials and Methods) to evaluate whether the TCR profile could help discriminate between SLE and normal subjects. In the ROC curve, a set of signature clones showed efficient performance in identifying SLE cases. The leave-one-out cross validation yielded an area under the curve (AUC) of 0.89 (95% CI: 0.74–1.00; Figure 4). Such distinction between SLE and control groups promised the possibility of developing TCR biomarkers for early diagnosis of SLE and possibly LN (see Discussion below).
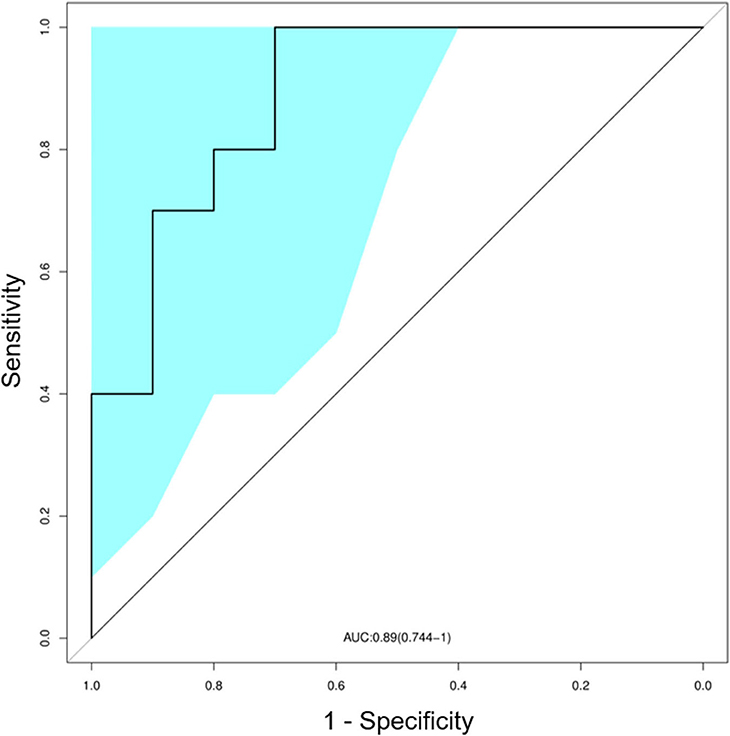
Figure 4. Classification of systemic lupus erythematosus (SLE) by random forest model with a receiver operating characteristics (ROC) curve evaluating the performance. The colored area showed the 95% confidence interval (CI) of the curve.
Discussion
To summarize, the results suggested that (1) the SLE status could substantially influence the immune system by impairing the TCR diversity of patients; (2) clear differences in particular V–J combinations could arise between SLE patients and healthy controls; (3) machine learning models were trained to effectively discriminate SLE individuals from control subjects, which may allow the development of diagnostic techniques for early detection of SLE (and possibly LN) risks.
A series of studies have characterized specific signatures of T cell repertoires in patients with various autoimmune diseases (17–19). For instance, Thapa et al. (13) used next-generation sequencing to assess T cell repertoire in peripheral blood (PB) of SLE patients. The results showed a significant decrease in TCR diversity of SLE patients compared to healthy controls (13). In particular, there was evidence that the TCR repertoire profile might serve as a potential biomarker of SLE (11, 12, 20, 21). In addition, Liu et al. (11) reported significant differences in V-J segment usage between the SLE and control groups. However, these studies did not examine the changes of TCR repertoire in LN status. Therefore, some of the differentially expressed clones in our study were not found in previous publications (e.g., TRBV12-5/TRBJ2-1, TRBV6-9/TRBJ2-7, TRBV10-1/TRBJ1-1, TRBV3-1/TRBJ2-2, etc.).
Here we clearly demonstrated that partial expansion of T cells could be observed in SLE patients with LN, which was characterized by decreased TCR diversity and the enrichment or reduction of specific V–J combinations. Due to the altered TCR profile, a series of clonotypes were used as a signature to a trained prediction model. In spite of a limited sample size, our model efficiently discriminated SLE (and possibly LN) individuals from healthy controls, which is worth further validation in larger cohorts. Our pilot study will inspire the subsequent research on the complicated immune environment in SLE and LN.
Of note, our findings are consistent with previously reported results that infiltrating T cells within renal tissue may be targeted toward nephritogenic antigens by the function of TCRβ genes. For example, Massengill et al. (20) found intrarenal lymphocytes in LN showing striking oligoclonal expansion. Our finding also suggested impaired TCR diversity in SLE and possibly LN. Moreover, Sui et al. (12) found the distributions of CDR3, VD indel, and DJ indel lengths to be comparable between the SLE and healthy controls, even though the degree of clonal expansion in the SLE group was significantly greater than in the healthy controls. Likewise, no significant differences in CDR3 length and amino acid composition were detected in our samples. The above evidences corroborated the reliability of our results.
The present study also has several important limitations. First of all, the sample size was relatively small, which impaired the statistical power. Considering potential factors that may confound the TCR characteristics, further studies with larger cohorts and long-term outcome measurements in both SLE patients and matched controls are required to better understand the immunological significance of TCR changes (22, 23). It would be more enlightening if a large sample enables to identify particular LN-specific TCR sequences. Secondly, the current sample did not include those from SLE patients without LN. Since a clinically important biomarker should predict which SLE individuals will develop LN later, subsequent research should make a comparison between SLE patients with and without LN. In addition, the human leukocyte antigen (HLA) gene profiles of the studied subjects are not assessed (24, 25), which may restrict the generalizability of our results.
In summary, we demonstrated a sequencing-based method to present the T cell repertoire characteristics of SLE patients with LN. As T cells play a pivotal role in the etiology of SLE, this study provided a better understanding of TCR-mediated adaptive immunity in SLE. More importantly, our results suggested the potential of developing non-invasive diagnostic solutions for SLE and possibly LN with TCR-based biomarkers.
Data Availability Statement
All datasets generated for this study are included in the article/Supplementary Material.
Ethics Statement
The studies involving human participants were reviewed and approved by the Ethics Committee of Zhejiang Provincial People's Hospital. The patients/participants provided their written informed consent to participate in this study. Written informed consent was obtained from the individual(s) for the publication of any potentially identifiable images or data included in this article.
Author Contributions
ZX and ZW contributed to the conception and design. XY, HZ, YL, JS, and QY acquired the samples. XY, JZ, and FS contributed to the execution of the experiments. PH and KW performed the analysis of the data. ZX, ZW, and KW drafted the manuscript. All authors approved the final version of the manuscript.
Funding
This work was funded by grants from the Zhejiang Provincial Natural Science Foundation of China (No. LGF20H310005), the Project of Application on Public Welfare Technology in Zhejiang Province (No. LGF18H160022), the General Project Funds from the Health Department of Zhejiang Province (No. 2020KY051), and the Research Fund for Lin He's Academician Workstation of New Medicine and Clinical Translation.
Conflict of Interest
ZW and JZ are employed by the company GS Medical (Beijing) Technology Development LLC.
The remaining authors declare that the research was conducted in the absence of any commercial or financial relationships that could be construed as a potential conflict of interest.
Supplementary Material
The Supplementary Material for this article can be found online at: https://www.frontiersin.org/articles/10.3389/fimmu.2020.01618/full#supplementary-material
Figure S1. Principal component analysis (PCA) plot illustrating sex category (A) and renal biopsy classification (class III to class V) of LN patients (B).
Figure S2. As shown in Table S1, subject S010-7, and IR010 seem to be different from other samples with lower rate of reads passing bioinformatics filters. However, removal of these two samples did not lead to substantial changes in the pattern of PCA plot (PERMANOVA P = 0.02).
Table S1. Sequence quality control statistics.
Table S2. The frequency of different types of clones for each study subject.
Table S3. The amino acid composition for each study subject.
Table S4. The composition of amino acid hydrophilicity for each study subject.
References
1. Anders HJ, Saxena R, Zhao MH, Parodis I, Salmon JE, Mohan C. Lupus nephritis. Nat Rev Dis Primers. (2020) 6:7. doi: 10.1038/s41572-019-0141-9
2. Jesus D, Matos A, Henriques C, Zen M, Larosa M, Iaccarino L, et al. Derivation and validation of the SLE disease activity score (SLE-DAS): a new SLE continuous measure with high sensitivity for changes in disease activity. Ann Rheum Dis. (2019) 78:365–71. doi: 10.1136/annrheumdis-2018-214502
3. Pakozdi A, Pyne D, Sheaff M, Rajakariar R. Utility of a repeat renal biopsy in lupus nephritis: a single centre experience. Nephrol Dial Transplant. (2018) 33:507–13. doi: 10.1093/ndt/gfx019
4. Liu Z, Zhang H, Liu Z, Xing C, Fu P, Ni Z, et al. Multitarget therapy for induction treatment of lupus nephritis: a randomized trial. Ann Intern Med. (2015) 162:18–26. doi: 10.7326/M14-1030
5. Sumida K, Kovesdy CP. Disease trajectories before ESRD: implications for clinical management. Semin Nephrol. (2017) 37:132–43. doi: 10.1016/j.semnephrol.2016.12.003
6. Watson L, Beresford MW. Urine biomarkers in juvenile-onset SLE nephritis. Pediatr Nephrol. (2013) 28:363–74. doi: 10.1007/s00467-012-2184-y
7. Sharabi A, Tsokos GC. T cell metabolism: new insights in systemic lupus erythematosus pathogenesis and therapy. Nat Rev Rheumatol. (2020) 16:100–12. doi: 10.1038/s41584-019-0356-x
8. Cui JH, Lin KR, Yuan SH, Jin YB, Chen XP, Su XK, et al. TCR repertoire as a novel indicator for immune monitoring and prognosis assessment of patients with cervical cancer. Front Immunol. (2018) 9:2729. doi: 10.3389/fimmu.2018.02729
9. Hou XL, Wang L, Ding YL, Xie Q, Diao HY. Current status and recent advances of next generation sequencing techniques in immunological repertoire. Genes Immun. (2016) 17:153–64. doi: 10.1038/gene.2016.9
10. Wang Y, Chen S, Chen J, Xie X, Gao S, Zhang C, et al. Germline genetic patterns underlying familial rheumatoid arthritis, systemic lupus erythematosus and primary Sjögren's syndrome highlight T cell-initiated autoimmunity. Ann Rheum Dis. (2020) 79:268–75. doi: 10.1136/annrheumdis-2019-215533
11. Liu X, Zhang W, Zhao M, Fu L, Liu L, Wu J, et al. T cell receptor β repertoires as novel diagnostic markers for systemic lupus erythematosus and rheumatoid arthritis. Ann Rheum Dis. (2019) 78:1070–8. doi: 10.1136/annrheumdis-2019-215442
12. Sui W, Hou X, Zou G, Che W, Yang M, Zheng C, et al. Composition and variation analysis of the TCR β-chain CDR3 repertoire in systemic lupus erythematosus using high-throughput sequencing. Mol Immunol. (2015) 67:455–64. doi: 10.1016/j.molimm.2015.07.012
13. Thapa DR, Tonikian R, Sun C, Liu M, Dearth A, Petri M, et al. Longitudinal analysis of peripheral blood T cell receptor diversity in patients with systemic lupus erythematosus by next-generation sequencing. Arthritis Res Ther. (2015) 17:132. doi: 10.1186/s13075-015-0655-9
14. Wu SG, Pan W, Liu H, Byrne-Steele ML, Brown B, Depinet M, et al. High throughput sequencing of T-cell receptor repertoire using dry blood spots. J Transl Med. (2019) 17:47. doi: 10.1186/s12967-019-1796-4
15. Wu J, Pendegraft AH, Byrne-Steele M, Yang Q, Wang C, Pan W, et al. Expanded TCRβ CDR3 clonotypes distinguish Crohn's disease and ulcerative colitis patients. Mucosal Immunol. (2018) 11:1487–95. doi: 10.1038/s41385-018-0046-z
16. Wang C, Sanders CM, Yang Q, Schroeder HW Jr, Wang E, Babrzadeh F, et al. High throughput sequencing reveals a complex pattern of dynamic interrelationships among human T cell subsets. Proc Natl Acad Sci USA. (2010) 107:1518–23. doi: 10.1073/pnas.0913939107
17. Hou X, Zeng P, Chen J, Diao H. No difference in TCRβ repertoire of CD4+ naive T cell between patients with primary biliary cholangitis and healthy control subjects. Mol Immunol. (2019) 116:167–73. doi: 10.1016/j.molimm.2019.09.019
18. de Jong A, Jabbari A, Dai Z, Xing L, Lee D, Li MM, et al. High-throughput T cell receptor sequencing identifies clonally expanded CD8+ T cell populations in alopecia areata. JCI Insight. (2018) 3:e121949. doi: 10.1172/jci.insight.121949
19. Nielsen SCA, Boyd SD. Human adaptive immune receptor repertoire analysis-Past, present, and future. Immunol Rev. (2018) 284:9–23. doi: 10.1111/imr.12667
20. Massengill SF, Goodenow MM, Sleasman JW. SLE nephritis is associated with an oligoclonal expansion of intrarenal T cells. Am J Kidney Dis. (1998) 31:418–26. doi: 10.1053/ajkd.1998.v31.pm9506678
21. Costa N, Pires AE, Gabriel AM, Goulart LF, Pereira C, Leal B, et al. Broadened T-cell repertoire diversity in ivIg-treated SLE patients is also related to the individual status of regulatory T-cells. J Clin Immunol. (2013) 33:349–60. doi: 10.1007/s10875-012-9816-7
22. Liu YY, Yang QF, Yang JS, Cao RB, Liang JY, Liu YT, et al. Characteristics and prognostic significance of profiling the peripheral blood T-cell receptor repertoire in patients with advanced lung cancer. Int J Cancer. (2019) 145:1423–31. doi: 10.1002/ijc.32145
23. Spassova I, Ugurel S, Terheyden P, Sucker A, Hassel JC, Ritter C, et al. Predominance of central memory T cells with high T-cell receptor repertoire diversity is associated with response to PD-1/PD-L1 inhibition in Merkel cell carcinoma. Clin Cancer Res. (2020) 26:2257–67. doi: 10.1158/1078-0432.CCR-19-2244
24. Ting YT, Dahal-Koirala S, Kim HSK, Qiao SW, Neumann RS, Lundin KEA, et al. A molecular basis for the T cell response in HLA-DQ2.2 mediated celiac disease. Proc Natl Acad Sci USA. (2020) 117:3063–73. doi: 10.1073/pnas.1914308117
Keywords: T cell receptor, lupus nephritis, systemic lupus erythematosus, immune repertoire, next-generation sequencing
Citation: Ye X, Wang Z, Ye Q, Zhang J, Huang P, Song J, Li Y, Zhang H, Song F, Xuan Z and Wang K (2020) High-Throughput Sequencing-Based Analysis of T Cell Repertoire in Lupus Nephritis. Front. Immunol. 11:1618. doi: 10.3389/fimmu.2020.01618
Received: 24 February 2020; Accepted: 17 June 2020;
Published: 06 August 2020.
Edited by:
Cees Van Kooten, Leiden University, NetherlandsReviewed by:
Anisur Rahman, University College London, United KingdomCarla Marie Cuda, Northwestern University Feinberg School of Medicine, United States
Copyright © 2020 Ye, Wang, Ye, Zhang, Huang, Song, Li, Zhang, Song, Xuan and Wang. This is an open-access article distributed under the terms of the Creative Commons Attribution License (CC BY). The use, distribution or reproduction in other forums is permitted, provided the original author(s) and the copyright owner(s) are credited and that the original publication in this journal is cited, in accordance with accepted academic practice. No use, distribution or reproduction is permitted which does not comply with these terms.
*Correspondence: Zixue Xuan, eHVhbnppeHVlMDIyMkAxNjMuY29t; Kejian Wang, a2VqaWFuLXdhbmdAZm94bWFpbC5jb20=
†These authors have contributed equally to this work