
94% of researchers rate our articles as excellent or good
Learn more about the work of our research integrity team to safeguard the quality of each article we publish.
Find out more
ORIGINAL RESEARCH article
Front. Immunol. , 31 March 2020
Sec. Antigen Presenting Cell Biology
Volume 11 - 2020 | https://doi.org/10.3389/fimmu.2020.00405
This article is part of the Research Topic Monocyte Heterogeneity and Function View all 19 articles
 Sergei Butenko1
 Senthil K. Satyanarayanan1
 Simaan Assi1
 Sagie Schif-Zuck1
 Dalit Barkan1Noa Sher2
 Amiram Ariel1*
Monocyte-derived macrophages are readily differentiating cells that adapt their gene expression profile to environmental cues and functional needs. During the resolution of inflammation, monocytes initially differentiate to reparative phagocytic macrophages and later to pro-resolving non-phagocytic macrophages that produce high levels of IFNβ to boost resolutive events. Here, we performed in-depth analysis of phagocytic and non-phagocytic myeloid cells to reveal their distinct features. Unexpectedly, our analysis revealed that the non-phagocytic compartment of resolution phase myeloid cells is composed of Ly6CmedF4/80− and Ly6ChiF4/80lo monocytic cells in addition to the previously described Ly6C−F4/80+ satiated macrophages. In addition, we found that both Ly6C+ monocytic cells differentiate to Ly6C−F4/80+macrophages, and their migration to the peritoneum is CCR2 dependent. Notably, satiated macrophages expressed high levels of IFNβ, whereas non-phagocytic monocytes of either phenotype did not. A transcriptomic comparison of phagocytic and non-phagocytic resolution phase F4/80+ macrophages showed that both subtypes express similar gene signatures that make them distinct from other myeloid cells. Moreover, we confirmed that these macrophages express closer transcriptomes to monocytes than to resident peritoneal macrophages (RPM) and resemble resolutive Ly6Clo macrophages and monocyte-derived macrophages more than their precursors, inflammatory Ly6Chi monocytes, recovered following liver injury and healing, and thioglycolate-induced peritonitis, respectively. A direct comparison of these subsets indicated that the non-phagocytic transcriptome is dominated by satiated macrophages and downregulate gene clusters associated with excessive tissue repair and fibrosis, ROS and NO synthesis, glycolysis, and blood vessel morphogenesis. On the other hand, non-phagocytic macrophages enhance the expression of genes associated with migration, oxidative phosphorylation, and mitochondrial fission as well as anti-viral responses when compared to phagocytic macrophages. Notably, conversion from phagocytic to satiated macrophages is associated with a reduction in the expression of extracellular matrix constituents that were demonstrated to be associated with idiopathic pulmonary fibrosis (IPF). Thus, macrophage satiation during the resolution of inflammation seems to bring about a transcriptomic transition that resists tissue fibrosis and oxidative damage while promoting the restoration of tissue homeostasis to complete the resolution of inflammation.
Acute inflammation is the protective response of the host to damaging events that may interrupt tissue homeostasis, such as physical or chemical injury, as well as microbial infections. A successful response eliminates the threat locally, repair the affected tissue, and restore its structure and function without deleterious fibrosis. Inflammation initiates with the production of soluble mediators by resident cells in the injured/infected tissue that promote the exudation of defense and/or signaling proteins, reinforced by the influx of granulocytes from the blood. Upon the arrival of these leukocytes, mostly neutrophils, they primarily function to phagocytose and eliminate foreign microorganisms via distinct intracellular killing mechanisms, resulting in neutrophils undergoing programmed cell death (apoptosis) (1, 2). This occurs alongside monocyte influx and their maturation into inflammatory macrophages upon infiltration of the inflamed tissue. Macrophages engulf apoptotic polymorphonuclear neutrophils (PMN) in a nonphlogistic process termed efferocytosis (1, 3). This clearance process initiates an active anti-inflammatory and pro-resolution phase that blocks excessive neutrophil recruitment and eliminates the early inflammatory elements and, in turn, results in clearance of these macrophages by either in situ apoptosis or egression via the lymphatic system (4, 5). Inflammatory macrophages polarize to distinct subpopulations following exposure to different bioactive molecules and environments. These subpopulations compose a wide spectrum of phenotypes that range from classically (M1) to alternatively (M2) activated macrophages—two commonly used myeloid measuring sticks generated during responses to bacterial or helminth infections and support Th1 or Th2 development, respectively (6). Recent molecular studies indicate that macrophage differentiation at different tissues and activation under different settings is associated with substantial shifts in gene expression patterns (hundreds of genes) depending on the specific stimuli (7–9). Nevertheless, most of these patterns define a distinct activation state of macrophages that cannot be confined to an M1 or M2 phenotype. As a result, the current literature promotes the usage of marker combinations or inducing agents to ascribe macrophage phenotypes rather than the M1 and M2 extremes (6, 10, 11).
Engulfment of apoptotic cells evokes signaling events that block the release of pro-inflammatory mediators from macrophages stimulated by microbial moieties, a phenomenon termed immune silencing. This process is accompanied by the production of cytokines that can promote the resolution of inflammation and wound repair (e.g., TGFβ and IL-10) (12, 13) with the production of pro-resolving lipid mediators, such as resolvin (Rv) E1 and RvD1 that block PMN infiltration and promote their clearance (1). Notably, the uptake and processing of high amounts of biopolymers, such as the ones expressed by apoptotic cells, require coping with large amounts of reactive oxygen species (ROS) generated in metabolic processes. Therefore, mitochondrial ROS production is limited in high-burden efferocytic macrophages, by means such as mitochondrial fission and lowering mitochondrial membrane potential (14, 15), to allow continued engulfment and avoid oxidative damage. Recent studies in spontaneously resolving, zymosan A-induced murine peritonitis characterized macrophages from resolving peritonitis into two distinct subtypes based on differing surface expression of the adhesion molecule CD11b that also composes complement receptor 3 (CR3) that mediates apoptotic cell engulfment by human macrophages (16). Compared to their CD11bhigh counterparts, the CD11blow macrophages are characterized by lower levels of pro-inflammatory mediators (e.g., TNFα, IL-1β, CCL2, 3, and 5) and proteins (e.g., iNOS and COX2), and pro-fibrotic factors (e.g., arginase-1). However, they display a higher secretion of the anti-infammatory/pro-resolving cytokine TGFβ and higher expression of the pro-resolving enzyme 12/15-lipoxygenase (LO). CD11blow macrophages migrate out of inflamed sites and, compared to CD11bhigh cells, exert decreased phagocytic activity despite containing higher numbers of PMNs previously engulfed. Hence, they were termed satiated or non-phagocytic macrophages (17, 18). A similar series of phenotypic transitions by monocyte-derived macrophages was previously reported in acute liver injury, where Ly6Chi monocytes infiltrate the liver, clear apoptotic neutrophils, and convert to Ly6Clo macrophages that express 12/15-LO (19–21).
Recently, IFNβ expression by non-phagocytic macrophages, and the novel roles of this cytokine as an effector in resolving bacterial inflammation were reported (17). We aimed to identify the satiated macrophage subset within the non-phagocytic macrophage population, determine the transcriptomic origin of resolution phase macrophages (of both the phagocytic and non-phagocytic phenotypes), and identify the unique gene clusters expressed by non-phagocytic/satiated macrophages. Furthermore, we sought to determine whether these unique clusters support key effector functions of satiated macrophages. Such functions include loss of phagocytic/efferocytic capacity while maintaining low ROS burden, deviation from the M2-like/reparative/pro-fibrotic phenotype to a pro-resolving phenotype, and metabolic shifts between various metabolic pathways. Here, we report that resolution phase non-phagocytic myeloid cells are composed of two distinct subsets, in addition to satiated macrophages. However, the Ly6C+ subsets are not becoming phagocytic prior to differentiation and do not express high levels of IFNβ as the satiated macrophages. We also found that both phagocytic and non-phagocytic resolution phase macrophages express a transcriptome that is more similar to the one expressed by monocytes than to RPM and more similar to reparative Ly6Clo monocyte-derived macrophages than inflammatory Ly6Chi monocytes from liver injury or peritoneal thioglycolate challenge. In addition, we found non-phagocytic macrophages to display a satiation-associated transcriptome with a significant change in expression patterns between phagocytic and satiated macrophages that attest to a complete phenotype switch in satiated macrophages that involves phagocytic properties, tissue repair and fibrosis, and metabolic programs.
C57BL/6 WT male mice were purchased from Harlan Laboratories. All mice that were used at the age of 8–15 weeks and did not undergo previous procedures. All mice were housed under a 12-h:12-h light–dark cycle and specific pathogen-free conditions, up to five mice per cage. Mice were fed standard pellet chow and reverse osmosis water ad libitum. Animal experiments were approved by the Committee of Ethics, University of Haifa (authorization no. 246/14).
Male C57BL/6 mice were randomly assigned to experimental groups. Mice were injected I.P. with zymosan A (1 mg/ml in PBS, 1 ml per mouse). PKH2-PCL green (0.25 mM; 0.5 ml; Sigma-Aldrich) was injected I.P. at 20, 44, 62, or 68 h, and peritoneal exudates were collected 4 h later. Peritoneal cells were stained with PE- or Brilliant violet-conjugated rat anti-mouse F4/80, PerCP-conjugated rat anti-mouse CD11b, Pacific Blue- or PerCP-conjugated rat anti-mouse Ly6C, PE-conjugated rat anti-mouse CD115, and PE/Cy7-conjugated mouse anti-mouse CX3CR1 (Biolegend) and analyzed by flow cytometry as in Supplemental Figure 1. F4/80+macrophages were sorted according to PKH2-PCL green signal intensity as in (17) using the FACSaria III sorter (Beckton-Dickinson) to give distinct F4/80+/PKH2hi and F4/80+/PKH2lo/neg macrophage populations. Ly6CmedF4/80neg and Ly6ChiF4/80lo monocytic cells were sorted using the SH800 sorter (Sony). In some experiments, flow cytometry analysis using the FlowJo software (Treestar) was performed to identify distinct leukocyte populations as detailed in the results section.
To ablate monocyte migration to the peritoneum, mice received 400 μl of anti-mouse CCR2 mAb (clone MC-21, generously given by Prof. Mack, Regensburg, Germany) conditioned media (29 μg Ab/ml, I.P.) concomitantly with zymosan A peritonitis onset (0 h) and at 24 h PPI.
RNA extraction was performed as previously described (17). Briefly, all RNA species from sorted cells were extracted using the Aurum Total RNA kit (Bio-Rad Laboratories, Inc.). RNA integrity was scored by Agilent 2100 Bioanalyzer using the Agilent RNA 6000 Pico kit (Agilent Technologies). Samples were prepared for Illumina sequencing using NEB's Ultra Directional RNA Library Prep Kit for Illumina (NEB#7420). Libraries were sequenced with a 50 bp SR run on Illumina HiSeq 2500 using a V3 flow cell.
Sequenced reads were compared to available murine Ensembl 70 genes using mouse genome build (GRCm38), and expression was compared between PKH2hi and PKH2lo macrophages using two separate analysis pipelines: RSEM/EdgeR and TopHat2/cuffdiff. Depending on the pipeline, between ~3,300 and 3,400 genes were found to be differentially expressed (FDR ≤ 0.05), with a wide overlap in results between the two pipelines. Significance values presented were from the TopHat2/cuffdiff analysis. Differentially expressed genes with statistical significance were filtered and visualized through a volcano plot, where F4/80+/PKH2hi cells served as a reference sample. Genes with FDR adjusted p-value (q value) ≤ 0.05 were considered as genes exhibiting differential expression between the two macrophage subsets and were selected for enriched gene ontology (GO) analysis. GO enrichment analysis was performed on the differentially up- or downregulated genes with the DAVID Bioinformatics Resources 6.7 software using the annotation categories of GOTERM_BP_5 and KEGG_PATHWAY, similarity threshold 0.7, and EASE score 0.25. For HeatMap analyses, expression values of genes were rescaled to a mean of 0 and a standard deviation of 1, and hierarchical clustering was performed using the R package Superheat with Euclidean distance and complete linkage methods (22). Published datasets were obtained in the form of gene raw counts or CPM-TMM normalized values at GREIN (23). For principal component analysis, resolution phase peritoneal PKH2hi and PKH2lo macrophage datasets were normalized to the resident macrophage RNAseq dataset from Lavin et al. (7) or to ImmGen OpenSource (24) using rlog utility of DESeq2 package (25). Alternatively, the same datasets were normalized to liver macrophage microarray datasets from Zigmond et al. (19), processed with robust multi-array average (RMA) of oligo package (26) and followed by quantile normalization. Combined datasets were corrected for batch effects using ComBat utility of SVA package (27). Data analysis was performed using the R program (https://www.r-project.org/). The accession number for the RNA-seq reported in this manuscript is BioProject: PRJNA390886.
Ly6C+F4/80− monocytes infiltrate the peritoneal cavity during the onset of resolution (12–24 h post peritonitis) and differentiate gradually to Ly6C−F4/80hi macrophages that are highly phagocytic/efferocytic (17, 28). These phagocytic peritoneal macrophages express high levels of the macrophage surface marker CD11b, in addition to high F4/80. However, following extensive efferocytosis, they lose their phagocytic capacity and convert to a state of satiation. This phenotype conversion is accompanied by a reprogramming process and a reduction in both aforementioned surface markers (18). Recently, it was shown that non-phagocytic F4/80+ macrophages express high levels of IFNβ that upon secretion promotes bacterial clearance and the resolution of inflammation (17). IFNβ expression by resolution phase macrophages was also upregulated by the uptake of apoptotic cells (17). Therefore, we sought to determine whether non-phagocytic macrophages are exclusively satiated. To this end, we injected the phagocytic dye PKH2-PCL green to mice during different phases of zymosan A-induced peritonitis and analyzed the phagocytic capacity of the various myeloid phenotypes in the exudates. Our results in Figures 1A–C show that Ly6CmedCD11bmedF4/80− monocyte-like cells are infiltrating the peritoneum at 24 h and convert at 72 h, at least in part, to Ly6C−CD11bhiF4/80hi macrophages. This conversion is associated with a transition of a F4/80−PKH2lo monocyte subset to an F4/80+PKH2hi macrophage subset reflecting improved phagocytosis upon maturation. Unexpectedly, we observed that a significant portion of the Ly6C+ cells remain undifferentiated and phagocytosis reluctant even at the later phase of resolution (72 h). Also notable is the presence of a small Ly6ChiF4/80lo subset (purple dots), commonly regarded as classical inflammatory monocytes, that is sustained during resolution but does not acquire phagocytic capacity and remains PKH2neg (Figure 1C). As expected from previous reports (17, 18, 28), a subset of F4/80hi/PKH2lo/neg cells corresponding to satiated macrophages was also evident in this analysis and distinguishable from non-phagocytic Ly6ChiF4/80lo monocytes. Since PMN-like cells can also be part of the Ly6CmedF4/80neg population, we performed an additional analysis of CD11b+ cells based on Ly6C and Ly6G expression. Our results (Figures 1D–F) show that the Ly6Cmed subset is composed of both monocytes (Ly6G−F4/80lo/neg cells, 23.5% of Ly6Cmed) and PMN-like cells ((Ly6G+F4/80neg cells, 76.5% of Ly6Cmed), whereas the Ly6ChiF4/80lo subset did not contain any PMNs.
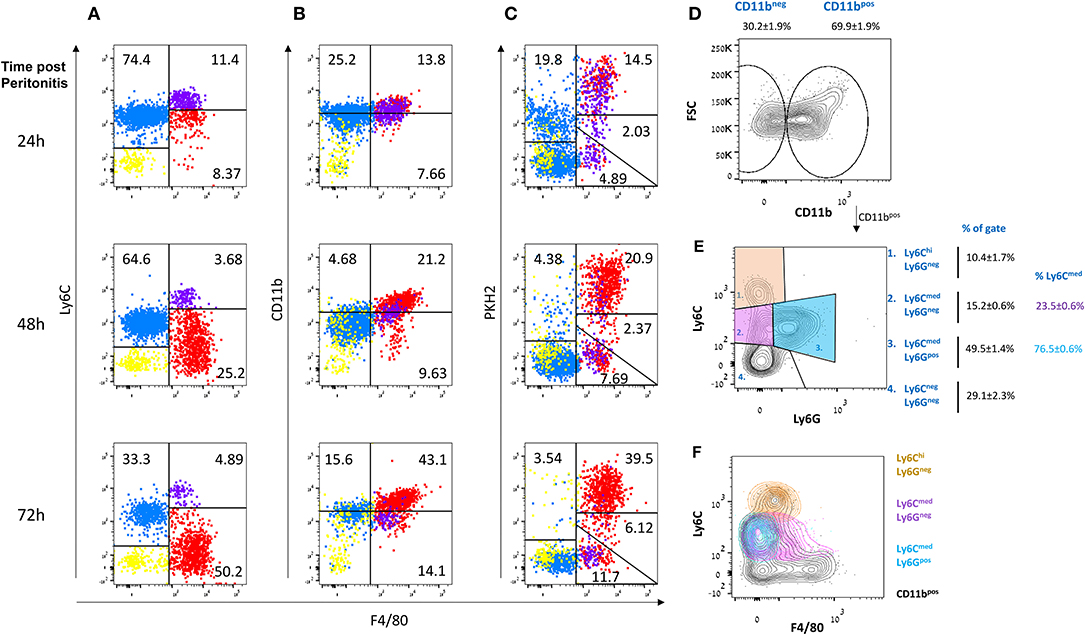
Figure 1. Non-phagocytic myeloid cells in peritoneal exudates contain monocytes and macrophages. Zymosan A (1 mg/mouse) was injected intraperitoneally to male mice. After 20, 44, or 68 h, these mice were injected I.P. with the phagocyte-specific dye PKH2-PCL green. Four hours later, the peritoneal cells were recovered and immunostained for F4/80 and CD11b. Dot plot analysis was performed for the expression of Ly6C (A, Y axis), CD11b (B), and PKH2-PCL acquisition (C), relative to F4/80 expression (X axis) by various exudate cells. Results are representatives from n = 8 mice for 24 h, six mice for 48 h, and seven mice for 72 h. (D–F) Peritoneal cells were recovered 66 h PPI and immunostained for CD11b, Ly6C, Ly6G, and F4/80 and analyzed by flow cytometry. Results are representative plots and means ± SEM (n = 12) showing CD11b+ gating (D), Ly6G vs. Ly6C (identifying monocytes and neutrophils, (E), and Ly6C vs. F4/80 (F).
To better understand the phagocytic properties of F4/80+ myeloid subsets, we further analyzed these samples by gating on PKH2hi, PKH2lo, or PKH2neg cells and analyzing their F4/80, Ly6C, and CD11b expression. Our results in Figures 2A–C show that phagocytic PKH2hi cells (red dots) were initially Ly6C+F4/80+ immature monocytes, but at 72 h, they completely matured to Ly6C−F4/80+ macrophages. The satiated PKH2lo macrophages (blue dots) followed a similar maturation path to the phagocytic ones, suggesting that they are indeed generated following complete maturation and loss of phagocytosis. Interestingly, the phagocytosis-reluctant F4/80lo monocytes showed a very different expression of maturation markers than the other subsets. They also expressed an Ly6C+F4/80+ phenotype at 24 h, but at 72 h, only half of these cells expressed the Ly6C−F4/80+ mature phenotype. Notably, the frequency of the PKH2neg cells in the exudates increased gradually with time, while the frequency of the PKH2lo/satiated macrophages increased only at 72 h (Figure 2C), and as previously reported, these cells contained a distinct population of CD11blow macrophages (Figure 2B). Thus, non-phagocytic F4/80+ cells contain, in addition to satiated macrophages, phagocytosis-reluctant Ly6ChiF4/80lomonocytes.
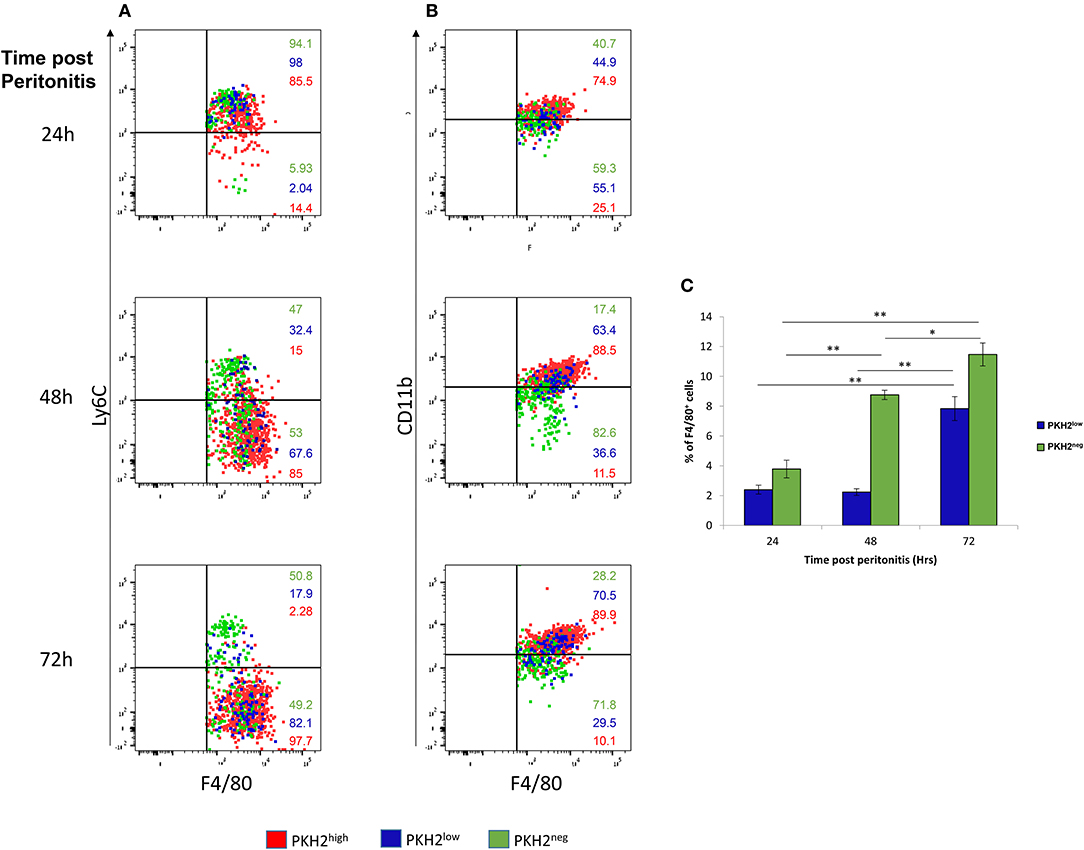
Figure 2. Non-phagocytic monocytes and satiated macrophages show different kinetics during the resolution of peritonitis. (A,B) Dot plots of F4/80+ PKH2-PCL high (red), low (blue), and negative (green) cells are presented relative to Ly6C (A) or CD11b (B). (C) Percentage of F4/80+PKH2low and PKH2negcells at 24–72 h PPI. Results are means ± SEM (n = 8 mice for 24 h, six mice for 48 h, and seven mice for 72 h). *P < 0.05, **P < 0.05 (Tukey's HSD).
The inflammatory monocytic subsets in the peritoneum during early resolution can differentiate to F4/80+ macrophages while being replaced by Ly6C+ cells that infiltrate from the circulation at later times. Therefore, we aimed to determine the extent of conversion of these monocytic cells to Ly6CnegF4/80+ macrophages. To this end, we sorted Ly6CmedF4/80neg (of both neutrophilic and monocytic origin) or Ly6ChiF4/80lo cells from peritoneal exudates at 48 h PPI, labeled them with CFSE, and transferred them to the peritoneum of mice at the same phase of peritonitis. After an additional 24 h, the peritoneal cells were recovered, and the expression of maturation markers in the labeled population was examined. Our results (Figures 3A–D) show that both the Ly6CmedF4/80neg and Ly6ChiF4/80lo subsets almost completely converted to the Ly6CnegF4/80+ phenotype. Importantly, no contribution of F4/80hiTim4+/− resident peritoneal cells to the F4/80+ macrophage subset was observed (Figures 3E,F) at this time, as previously reported for 48 h (17). Notably, the PMN-like cells were almost eliminated 24 h post transfer (Figure 3C), suggesting these cells underwent apoptosis and were engulfed by macrophages. Thus, both Ly6CmedF4/80neg and Ly6ChiF4/80lo cells seem to be monocytes that differentiate in vivo to Ly6CnegF4/80+ macrophages during the resolution of inflammation.
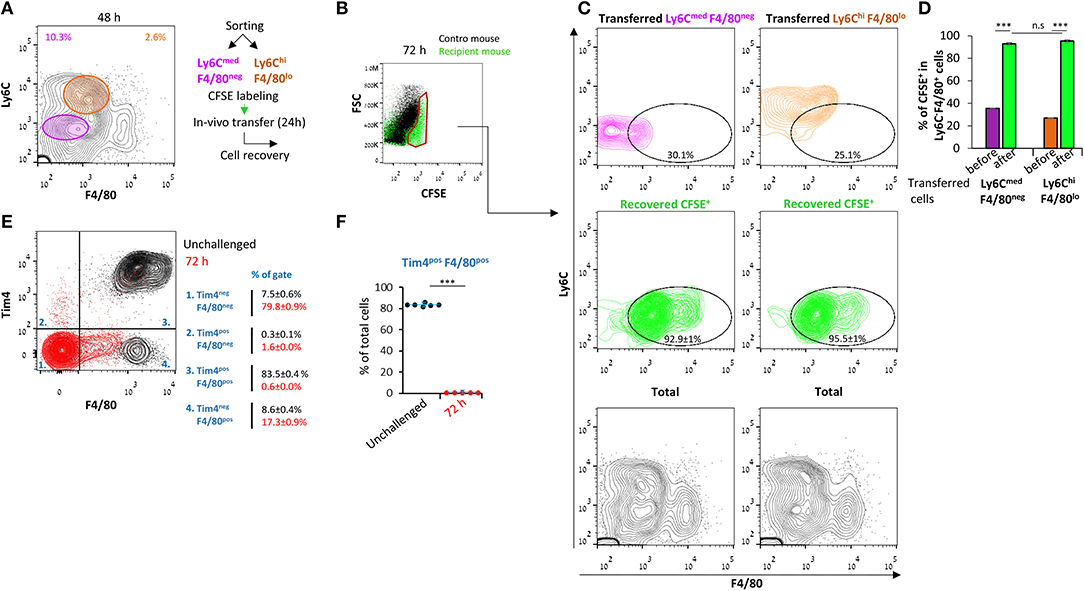
Figure 3. Ly6CmedF4/80neg and Ly6ChiF4/80lo cells both convert to Ly6Cneg F4/80+ macrophages. Peritoneal exudates were recovered from WT mice 48 h PPI. (A) Monocytic cells were sorted into Ly6CmedF4/80neg and Ly6ChiF4/80lo populations. (B–D) Sorted cells were labeled with CFSE and transferred to recipient mice with ongoing peritonitis at 48 h. At 72 h, peritoneal cells were recovered, immunostained for Ly6C and F4/80, and CFSE+ cells (B) were analyzed by flow cytometry (C, D). Results are stacked contour plot from six mice (C) and means ± SEM (n = 6). P < 0.001 (Student's t-test). (E,F) Peritoneal exudates were recovered from unchallenged mice or at 72 h PPI, immunostained for F4/80 and Tim4 and analyzed by flow cytometry. Results are stacked contour plots from six mice (E) and percentage means ± SEM of F4/80+ Tim4+ cells (F).***P < 0.001(Student's t-test).
CCR2 ligation was previously shown to be essential for monocyte recruitment and differentiation to macrophages during low-grade (0.1 mg/mouse) zymosan A-induced peritonitis (29). Therefore, we aimed to determine whether it is also essential for the recruitment of either Ly6CmedF4/80neg or Ly6ChiF4/80lo monocytes during medium-grade peritonitis and whether its blockage during inflammation will abrogate the generation of Ly6C−F4/80+ resolution phase macrophages. To distinguish the monocytic/macrophages from PMN-like cells, we stained the cells with the monocytic markers CX3CR1 and CD115 (30). Our results show (Figures 4A–C) that the anti-CCR2 antibody MC-21 significantly reduced the percentages and/or peritoneal cell counts of most CX3CR1+ myeloid cells, including the Ly6CmedF4/80negCD115lo, Ly6ChiF4/80lo, Ly6CnegF4/80hi, and Ly6CnegF4/80lo subsets. Notably, the percentages of the CX3CR1−Ly6CmedF4/80negPMN-like cells were not significantly changed, but their cell counts did reduce by 50%. The reduction in numbers of Ly6CmedF4/80neg PMN-like cells suggests resolution phase monocytic cells or macrophages also enhance the recruitment or delay the apoptotis/clearance of PMN-like cells during the resolution of inflammation. A comparison of the CD115 and CX3CR1 surface expression levels revealed similar expression of CD115 in both monocytic subsets that is increased upon maturation to macrophages and reduced following conversion to satiated Ly6CnegF4/80lo macrophages (Figure 4H). CX3CR1 expression was similar on all myeloid subsets except Ly6ChiF4/80lo monocytes that expressed significantly lower levels than all other myeloid cells (Figure 4I). Thus, our results suggest that all resolution phase monocytic cells are recruited through CCR2 or derived from CCR2-recruited precursors.
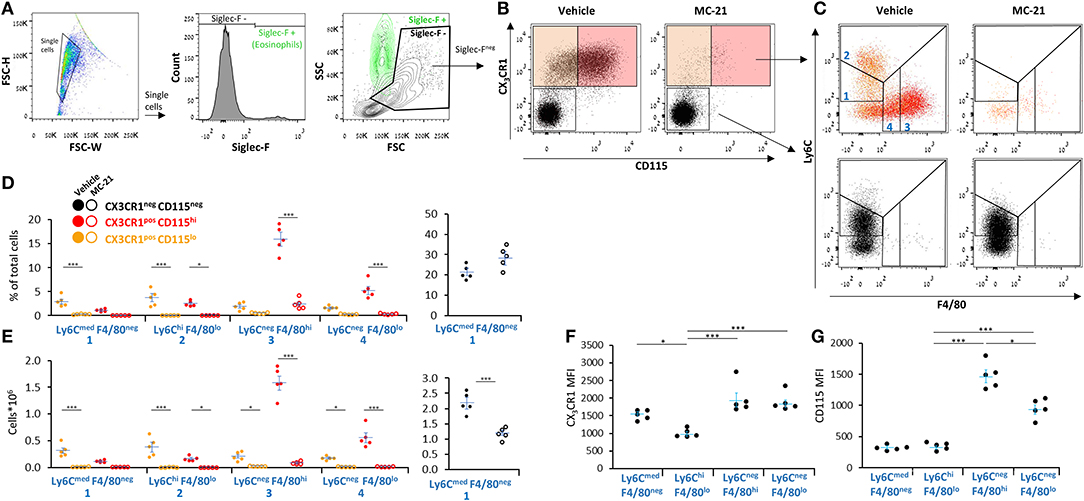
Figure 4. All resolution phase monocytic/macrophage subsets are CCR2-dependent. WT mice undergoing peritonitis were treated I.P. with anti-mouse CCR2 mAb (clone MC-21) or vehicle (control) at peritonitis initiation (0 h) and 24 h PPI. At 72 h, peritoneal cells were collected, immunostained for Ly6C, F4/80, CD115, CX3CR1, and Siglec–F and analyzed by flow cytometry. (A) The gating strategy excluded Siglec-F+ eosinophils (green). (B–D) Samples were analyzed according to CX3CR1 vs. CD115 (B) and CX3CR1+ (top) or CX3CR1− (bottom) cells were analyzed according to F4/80 vs. Ly6C and CD115hi (red dots) vs. CD115lo subsets (C). Analysis of the percentages (D) and cell numbers (E) of the indicated subsets is presented. Results are stacked dot plots (B,C) and means ± SEM (D,E) from n = 5. (F,G) CD115 (F) and CX3CR1 (G) expression by various CX3CR1+ myeloid subsets. Results are means ± SEM of MFI from n = 5. *P < 0.05, ***P < 0.001 (Student's t-test or Tukey's HSD).
It was previously shown that non-phagocytic F4/80+ macrophages express higher IFNβ mRNA and protein levels in comparison with their phagocytic counterparts (17). Therefore, we aimed to determine whether this expression is exclusive to satiated F4/80hiPKH2lo macrophages or also takes place in phagocytosis-reluctant F4/80loPKH2neg monocytes, or other resolution phase leukocytes. Our flow cytometry analysis (Figures 5A–D) shows that satiated F4/80hiPKH2lo macrophages indeed express the highest amount of IFNβ of all the analyzed leukocyte subsets. F4/80loPKH2neg monocytes/macrophages express significantly lower levels of IFNβ than satiated macrophages, whereas eosinophils and F4/80−PKH2+ monocytes express even lower amounts of this cytokine. Surprisingly, we found phagocytic F4/80hiPKH2hi macrophages to express high levels of IFNβ protein, but not as high as their satiated counterparts (Figure 5E). Thus, satiated macrophages seem to be the major producer of IFNβ in resolution phase exudates.
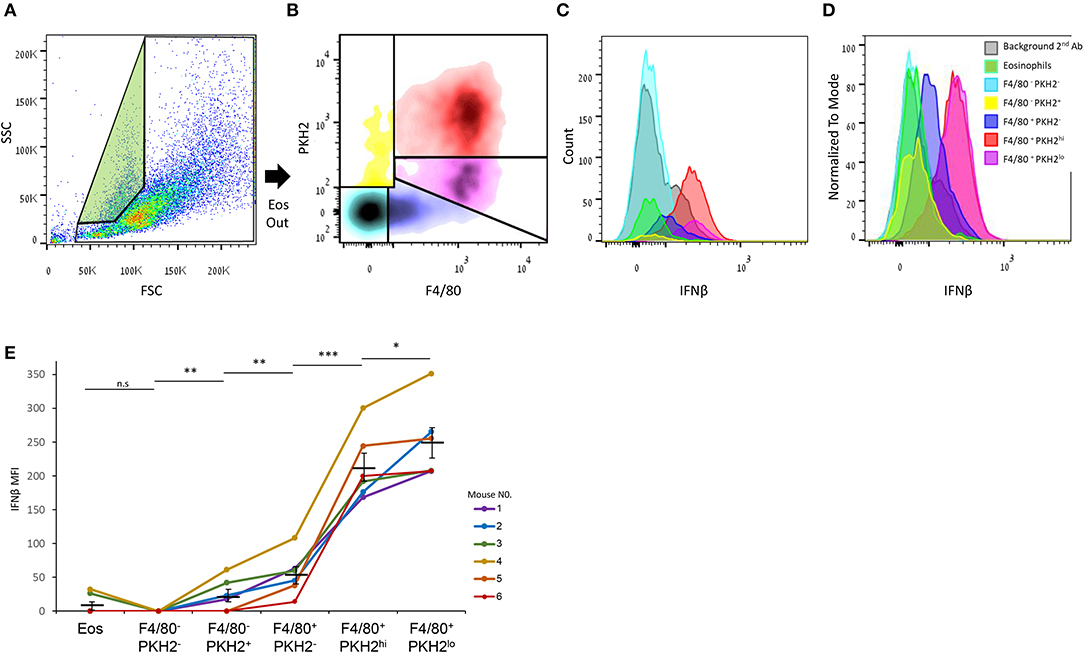
Figure 5. Satiated macrophages express the highest level of IFNβ of all resolution phase leukocytes. Peritoneal exudates were recovered from WT mice 66 h PPI, and the cells were immunostained for F4/80, fixed, permeabilized, and immunostained for IFNβ. (A) The gating strategy for eosinophils (green) and other immune cells. (B) Density plot analysis of F4/80 vs. PKH2 staining resulted in five distinct populations: F4/80−PKH2− (cyan), F4/80−PKH2+ (yellow), F4/80+PKH2− (blue), F4/80+PKH2hi (red), and F4/80+PKH2lo (purple). These populations were then analyzed for IFNβ expression, and results were presented as counts (C) and normalized to mode (D). MFI means ± SEM from six independent mice are shown (E). *P < 0.05, **P < 0.01, ***P < 0.001 (Student's t-test). Data for second antibody alone and eosinophils were previously reported in (17).
Previous studies have debated regarding the contribution of monocyte-derived inflammatory macrophages and their yolk sack-derived resident peritoneal counterparts in spontaneously resolving zymosan A-induced peritonitis (9, 17, 18, 28, 31). In order to improve our understanding of the transcriptomic origin of resolution phase macrophages and the changes that take place during the satiation process, mice were injected I.P. with PKH2-PCL at 62 h post zymosan A-induced peritonitis. After an additional 4 h, peritoneal macrophages were sorted, using flow cytometry, based on their phagocytic uptake of PKH2-PCL (17). The RNA from sorted PKH2hi and PKH2lo/neg macrophages was sequenced, and a total of 31,727 genes were annotated. A volcano plot was generated from the obtained data in order to assess the 3,442 differentially expressed genes (q ≤ 0.05, 10.9% of annotated genes) (Figure 6A). The produced differential gene list is presented across all the samples as a HeatMap (Figure 6B), in which hierarchical clustering generated two lists: 1,690 upregulated genes and 1,752 downregulated genes in PKH2lo relative to PKH2hi macrophages.
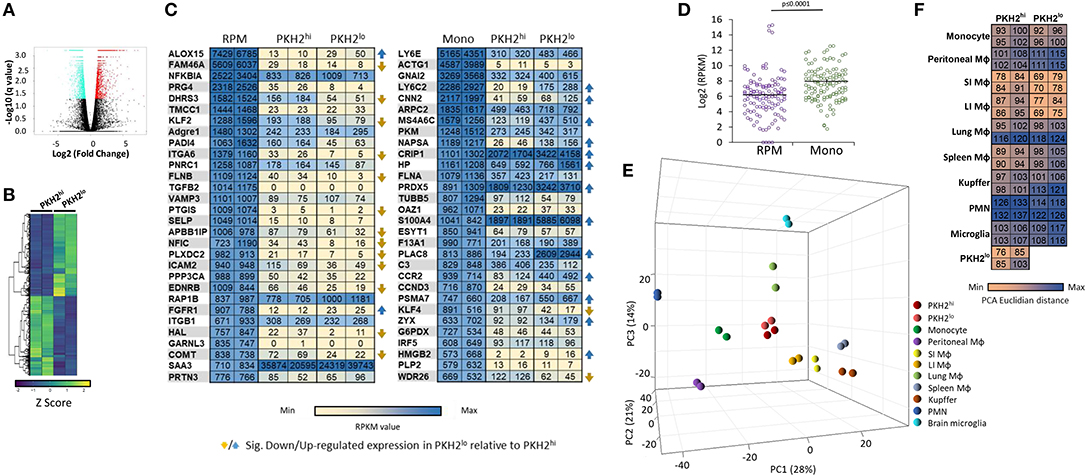
Figure 6. Transcriptomic analysis of PKH2hi/phagocytic and PKH2lo/neg/non-phagocytic resolution phase macrophages. Male C57BL/6 mice were injected intraperitoneally with zymosan A (1 mg/mouse) followed by an injection of PKH2-PCL at 62 h. Four hours later, the peritoneal cells were recovered and immunostained for F4/80 and CD11b. Then, F4/80+ macrophages were sorted based on the extent of PKH2-PCL acquisition (PKH2hi vs. PKH2low/neg populations; >98% purity) using the FACSAria II sorter [as reported in (17)]. The collected cells were immediately used for RNA extraction (with RNA integrity value above 7.5), and a gene expression microarray analysis was performed using Illumina hiSeq 2500. Annotated genes were plotted using a volcano plot to identify the significant differentially expressed genes comparing PKH2hi and PKH2lo macrophages with significance depicted at q ≤ 0.05 values (A). Differentially expressed genes were examined across samples and hierarchically clustered into HeatMap of two lists: 1,690 up- and 1,752 down-regulated genes in PKH2lo relative to PKH2hi. Data presented are Z score normalized (B). Annotated genes were examined in comparison to various resident murine macrophage populations, as well as monocytes and PMNs [database from (7)]. The 30 highest expressed genes (on CPM-TMM scale) from either resident peritoneal macrophages (out of 282 exclusive genes) or monocytes (out of 272 exclusive genes) were compared to PKH2hi and PKH2lo/neg macrophages by RPKM values (C) and by distribution around the expression median values of each sample (D). Differential distances of PKH2hi and PKH2lo/neg macrophages from resident peritoneal macrophages and from monocytes were visualized on a 3D PCA plot (E) and enumerated as PCA Euclidian distances (F).
We previously indicated that select genes from RPM are barely expressed in either phagocytic or non-phagocytic resolution phase macrophages from zymosan A-induced peritonitis, while monocyte markers are abundantly expressed in these cells (17). Since macrophages are able to change their transcriptome in an environment-specific manner (7), we aimed to further characterize the transcriptomes of phagocytic and satiated macrophages to determine whether genes expressed by peritoneal macrophages are also substantial in resolution phase macrophages. To this end, we designated 30 genes with the highest specific expression in either RPM or monocytes based on Lavin et al. (7) and compared their expression to phagocytic and non-phagocytic macrophages. Our results (Figure 6C) indicate that some genes (i.e., rap1b, saa3, and nfkbia) highly expressed by RPM are also abundantly expressed by phagocytic and non-phagocytic resolution phase macrophages. However, neither phagocytic nor non-phagocytic macrophages expressed notable mRNA levels of markers of RPM, such as timd4 [3.47 and 1.26 reads per kilobase million (RPKM) for phagocytic and non-phagocytic macrophages, respectively], vsig4 (2.58 and 4.39 RPKM, respectively), nt5e (1.31 and 2.24 RPKM, respectively), and cd209b (0 and 0.22 RPKM, respectively). Unexpectedly, although the canonical RPM transcription factor GATA6 is not expressed in resolution phase macrophages (17), some genes regulated by this transcription factor (8, 9), such as cd9 (139.19 and 266.25 RPKM for phagocytic and satiated macrophages, respectively), cd24a (68.35 and 1198.62 RPKM, respectively), and cd93 (44.35 and 12.37, respectively) were expressed by both phagocytic and non-phagocytic resolution phase macrophages and their levels were significantly modulated upon phenotype conversion.
Overall, analysis of our transcriptomic data against the 30th highest expressed genes in RPM and monocytes indicated a significantly increased median RPKM value for resolution phase macrophages of both phenotypes toward monocyte genes (Figure 6D) than toward their RPM counterparts. Moreover, analysis of the percentage of genes that were expressed at 10 RPKM or lower levels revealed a significantly higher percentage in RPM than in monocyte genes (Table 1). Principal component analysis (PCA) and calculation of PCA Euclidian distances revealed that PKH2hi (phagocytic) and PKH2lo (non-phagocytic) macrophages are positioned closer to one another, as well as to the small intestine and large intestine macrophages than to any other myeloid subset presented (Figures 6E,F). Moreover, both phagocytic and satiated resolution phase macrophages were positioned closer to monocytes than to RPM (Figures 6E,F). Of interest, intestinal macrophages that have many common features with monocytes (7) were the closest resident macrophage subset to resolution phase macrophages (Figures 6E,F). Notably, non-phagocytic macrophages were found to increase the expression of monocyte genes, in comparison to phagocytic macrophages (14 of 15 genes that were modulated in a statistically significant manner), whereas the expression of RPM genes was decreased in these cells (15 of 21 genes) (Figure 6C). Thus, our transcriptomic analysis indicates that both phagocytic and non-phagocytic resolution phase macrophages are monocyte-derived with similarities to resident peritoneal and intestinal macrophages.
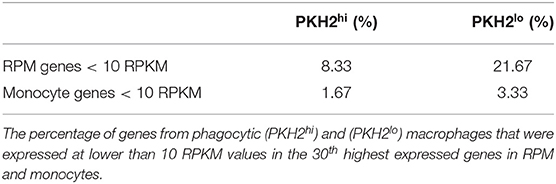
Table 1. RPM and monocyte genes under-represented in resolution phase macrophages.
Acetominophen-induced liver injury, like zymosan A-induced peritonitis, is hallmarked by inflammatory Ly6Chi monocyte differentiation to reparative Ly6Clo macrophages and the clearance of apoptotic neutrophils (19–21). Therefore, we compared the transcriptome of these liver-associated, monocyte-derived cells to peritoneal phagocytic and non-phagocytic macrophages. Our results show that in the 50 highest-fold changed genes downregulated in liver Ly6Clo macrophages, there is a significantly higher expression in both peritoneal phagocytic and non-phagocytic macrophages, compared to the upregulated genes (Figure 7A). Interestingly, the PCA and Euclidian distance analysis revealed an increased similarity of both phagocytic and non-phagocytic macrophages to Ly6Clo macrophages rather than to their Ly6Chi precursors or Kuppfer cells (Figures 7B,C), thus suggesting that the 50 highest expressed genes are less indicative of transcriptomic changes in this analysis. In addition, comparison of resolution phase macrophages and thioglycolate-elicited monocytes/macrophages analyzed by the ImmGEN consortium (24) revealed that both phagocytic and non-phagocytic macrophages show the highest resemblance to monocytes and macrophages elicited at 8–24 h post thioglycolate administration (PTA). These macrophages showed lower similarity to monocytes or macrophages recovered at 4 or 72 h PTA, respectively, or to various subsets of resident peritoneal macrophages (Figures 7D–F). Notably, phagocytic and non-phagocytic macrophages showed a significantly higher resemblance to one another (two fold) than to any other monocyte/macrophage subset, thus, underscoring their common origin. Together, this analysis suggests that the transcriptomic profile of both phagocytic and non-phagocytic macrophages resembles reparative macrophages from liver injury, and peritoneal monocyte-derived macrophages, which might contain or mature into both subsets. These results also suggest that the Ly6ChiF4/80lo monocytic subset does not contribute significantly to the transcriptome of non-phagocytic macrophages that is rather dominated by satiated macrophages.
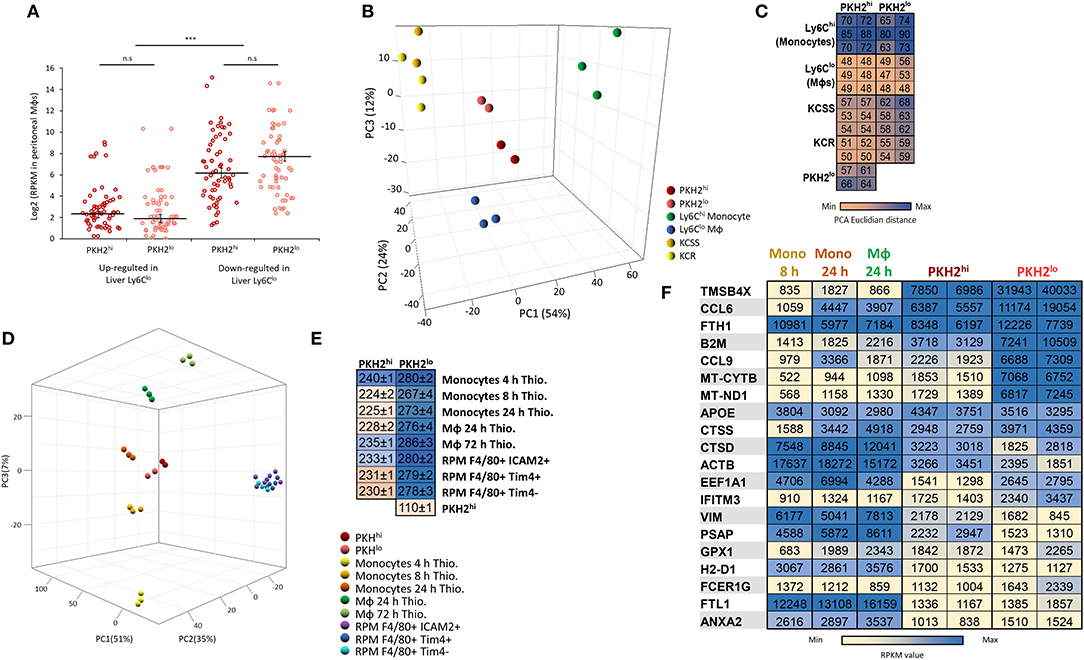
Figure 7. Resolution phase macrophages resemble liver reparative Ly6Clo macrophages and peritoneal monocyte-derived macrophages elicited by thioglycolate. Annotated genes were compared to the database of monocyte/macrophage populations from acute liver injury induced by overdose of N-acetyl-p-aminophenol (APAP) [Zigmond et al. (19)]. These subsets include inflammatory Ly6Chi monocytes and their descendants, Ly6Clo monocytes, as well as Kupffer cells from the steady state (KCSS) and recovered (KCR) phases. The 50 highest up- or downregulated genes in the liver Ly6Clo differentiated macrophages were compared to PKH2hi/phagocytic and PKH2lo/neg/non phagocytic macrophages (A). Differential distances of PKH2hi and PKH2lo/neg macrophages from liver macrophages and monocytes were visualized on a 3D PCA plot (B) and enumerated as PCA Euclidian distances (C). Alternatively, annotated genes were compared to the database of resident tissue macrophages and thioglycolate-elicited peritoneal monocyte/macrophage populations from the ImmGEN consortium (OpenSource mononuclear phagocyte project). The peritoneal resident populations were designated as RPM F4/80+ICAM2+ (F4/80+ICAM2+CD3−CD19−Ter119−) and RPM F4/80+ Tim4+/Tim4− (B220−Ly6C−F480+CD11b+CD64+Tim4+/Tim4−). The peritoneal thioglycolate-elicited populations were designated as follows: monocytes 4 and 8 h Thio (CD45+CD11b+CD115+Ly-6C+ICAM2−CD226−), monocytes 24 h Thio (CD45+CD11b+CD115+Ly-6C+CD36loICAM2−CD226−), and macrophages 24 and 72 h Thio (CD45+CD11b+CD115+Ly-6CloCD36+ICAM2−CD226−). Differential distances of PKH2hi and PKH2lo/neg macrophages from peritoneal resident, and thioglycolate-elicited monocytes/macrophages were visualized on a 3D PCA plot (D) and enumerated as PCA Euclidian distances presented as group to group mean ± SEM (E). The 20 highest expressed genes (on CPM-TMM scale) from either PKH2hi or PKH2lo/neg macrophages were compared to monocytes 4 and 8 h Thio and macrophages 24 h Thio by RPKM values (F).
In order to analyze the nature of the differential gene clustering and the potential variation in the properties of non-phagocytic macrophages, both upregulated and downregulated gene lists were separately analyzed by GO enrichment for biological processes and KEGG pathways at DAVID Bioinformatics Resources 6.7, National Institute of Allergy and Infectious Diseases (NIAID), NIH. Enrichment output was clustered into 88 upregulated and 143 downregulated biological processes together with three upregulated and 10 downregulated KEGG pathways. The 23 select clusters from the upregulated and downregulated genes (Figure 8A) represent fundamental shifts in cell metabolism, phagocytic activity, tissue interaction and repair, and paracrine modulation of inflammatory processes progress. Based on the above and in order to better understand the genes involved in macrophage phenotype acquisition in terms of modulation of phagocytosis, tissue repair, metabolism, and immune activity, a supervised search toward GO pathways was conducted based on MGI (32). Our results in Figure 8 show several phenotypic shifts at the transcriptomic level that are associated with macrophage loss of phagocytosis. Satiated macrophages show a significant reduction in the expression of gene clusters involved in intracellular signal transduction, vascular development, cell–substrate adhesion, actin cytoskeleton organization, and positive regulation of both fibroblast proliferation and extracellular matrix organization. These changes suggest a shift from an M2-like/reparative phenotype to a pro-resolving phenotype. Moreover, satiated macrophages express reduction in gene clusters involving collagen organization and focal adhesion (Figure 8B). These are two important gene clusters for macrophages that mediate tissue repair and wound healing, but also tissue fibrosis and scarring that leads to organ failure (33). Bitterman and colleagues previously indicated that fibrotic ECM can initiate a pro-fibrotic cycle in fibroblasts that leads to idiopathic pulmonary fibrosis (IPF) (34). Notably, of the 28 genes that were both significantly changed in IPF patients and significantly downregulated in satiated macrophages (two fold), 26 were upregulated, while two were downregulated in IPF patients (Table 2). These findings support the notion that resolution phase macrophages deviate from their M2/pro-fibrotic phenotype upon conversion from phagocytic to satiated macrophages and that M2-like resolution phase macrophages might promote tissue fibrosis by directly producing ECM components in addition to regulating fibroblast proliferation and ECM deposition.
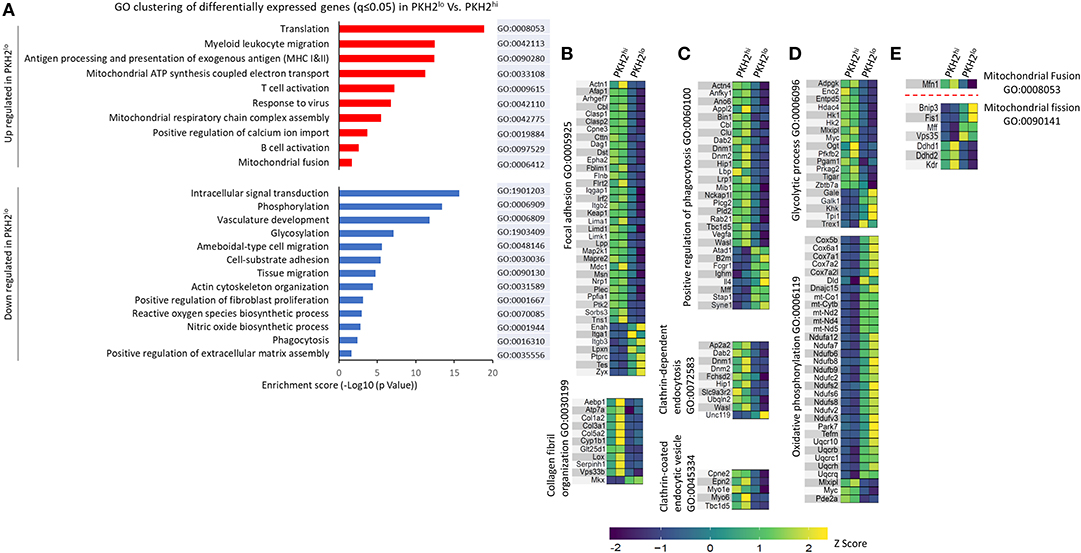
Figure 8. Select functional GO pathways skewed in non-phagocytic macrophages. Analysis of gene enrichment for biological processes and KEGG pathway was performed on the differential up- and down-regulated gene clusters (A). A search for GO pathways was performed to examine skewed functions comparing PKH2hi and PKH2lo macrophages in terms of tissue repair and fibrosis (B), phagocytic activity (C), bioenergetics (D), and mitochondrial dynamics (E). Data presented are differentially expressed (twofold change) genes from each GO term category with q ≤ 0.05.
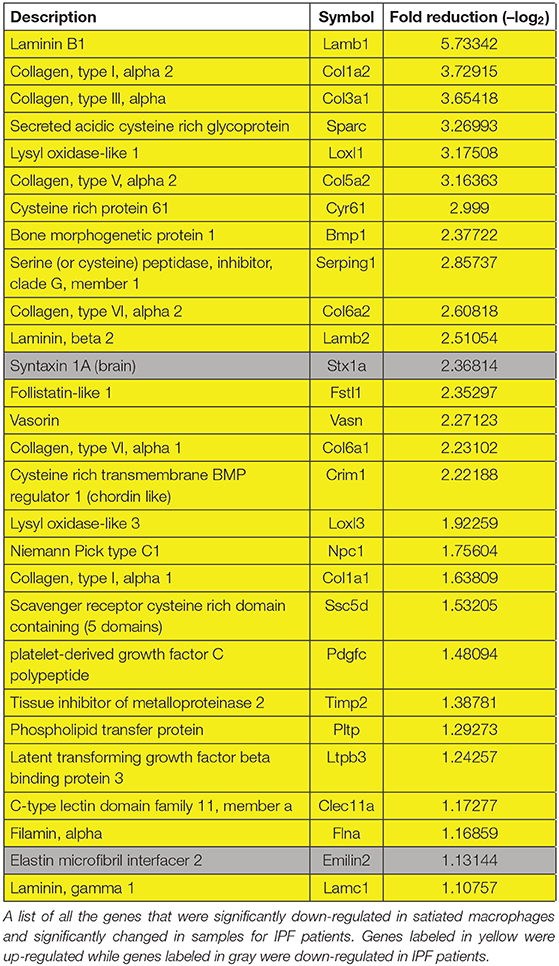
Table 2. Comparative analysis of genes modulated in satiated macrophages and IPF patients.
Previous reports have indicated that satiated macrophages lose their phagocytic potential upon conversion from their phagocytic counterparts and migrate to remote sites (17, 18). Our results in Figure 8A show that satiated macrophages downregulate gene clusters, such as phagocytosis, actin cytoskeleton organization, and ameboidal-type cell migration, while increasing clusters like myeloid leukocyte migration. Moreover, our GO analysis indicates that satiated macrophages mostly downregulate positive regulation of phagocytosis, clathrin-dependent endocytosis, and clathrin-coated endocytic vesicles (Figure 8C). These findings support the notion that phagocytic macrophages undergo a process of satiation that results in a loss of their phagocytic properties and their controlled departure of the injury site during the resolution of inflammation.
Previous studies in the last 20 years have indicated that a broad metabolic switch takes place during macrophage differentiation to M1- and M2-like phenotypes. While bacterial and inflammatory stimuli induce glycolytic pathways in macrophages that acquire M1-like features, oxidative phosphorylation and the TCA cycle are the preferred metabolic processes in M2-like macrophages (35). Our results reveal a similar dichotomy in phagocytic and satiated macrophages during the resolution of inflammation. Figure 8D shows increased expression of genes involved in mitochondrial ATP synthesis-coupled electron transport and respiratory chain complex assembly that compose an oxidative phosphorylation cluster, while genes included in the glycolytic process are downregulated. Moreover, genes associated with NO biosynthesis, a hallmark of M1 macrophages, are downregulated in satiated macrophages (Figure 8A). Notably, additional mitochondrial processes seem to take place on the transcriptomic level during satiation. Only one gene, mitofusin-1 (Mfn1), is significantly downregulated in the mitochondrial fusion cluster. However, this is a key regulator of mitochondria fusion (36). On the other hand, four genes associated with mitochondrial fission were upregulated in satiated macrophages (Figure 8E). Unexpectedly, the other three genes involved in mitochondrial fission were downregulated in satiated macrophages. However, these genes are also involved in other processes that are downregulated in these macrophages, such as inhibition of oxidative phosphorylation and blood vessel morphogenesis. ROS production is also downregulated in satiated macrophages by reducing the expression of this gene cluster specifically (Figure 8A). Thus, satiated macrophages seem to regulate the expression of various gene clusters involved in important functions that these cells execute highlighted by limiting excessive tissue repair and fibrosis.
The emergence of satiated Ly6C−F4/80+CD11blow macrophages that contained high numbers of apoptotic cell nuclei but engulfed low levels of the phagocytosis-acquired dye PKH2-PCL in vivo was previously reported during the resolution phase of murine peritonitis (17, 18). These macrophages were converted from phagocytic Ly6C−F4/80+CD11bhigh that contained low numbers of apoptotic cell nuclei. The expression and secretion of IFNβ by non-phagocytic F4/80+ macrophages was recently reported (17), and therefore, it was of interest to determine whether satiated macrophages are the only non-phagocytic myeloid subset. Surprisingly, our results revealed, in addition to the satiated F4/80+PKH2lo macrophage subset, two other subsets of Ly6C+ monocytes in resolving exudates. One subset was characterized as Ly6CmedF4/80neg monocytes that initially displayed low phagocytic capacity (at 24 h PPI). However, at 72 h PPI, the low phagocytic monocytes seem to differentiate to Ly6C−F4/80+ macrophages with high phagocytic capacity. Notably, a significant portion of these monocytes do not become mature and phagocytic even at 72 h PPI, suggesting that these phagocytosis-reluctant monocytes are key regulators of the resolution of inflammation on site. The second population of non-phagocytic monocytes is characterized as Ly6ChiF4/80lomonocytes. The frequency of these F4/80loPKH2neg cells is increasing continuously during the transition from the inflammatory to the resolving phases of peritonitis (Figure 2C) without acquiring any phagocytic activity. At 72 h PPI, only 50% of these cells are Ly6C−F4/80+, while transfer experiments showed that almost all of these cells become Ly6C−F4/80+ within 24 h of peritoneal maturation. Thus, this non-phagocytic Ly6ChiF4/80loCXC3CR1+CD115lo population also seems to be supplemented by blood-borne precursors, while maturing in vivo to an Ly6C−F4/80+ phenotype without acquiring phagocytic capacity. Importantly, these PKH2neg monocytes contain a higher percentage of CD11blow cells than their PKH2lo satiated counterparts (18) (Figure 2B) at 48 and 72 h, suggesting that modulation of CD11b expression is important for both acquisition and loss of phagocytosis capacity. It is important to note that the aforementioned changes in macrophage phenotypes should take into account the migration of young monocytes to the peritoneum that replenishes the non-phagocytic populations and the emigration of mature macrophage to remote sites that diminishes the frequency of phagocytic and/or satiated macrophages.
Since the expression of IFNβ by non-phagocytic macrophages was performed using a gating strategy that did not discriminate F4/80+ satiated and phagocytosis-reluctant monocytes, we used flow cytometry to directly evaluate IFNβ expression by each resolution phase leukocyte subset. We found (Figure 5) that F4/80−PKH2+ and F4/80loPKH2neg monocytes expressed very low amounts of IFNβ. Phagocytic (F4/80hiPKH2hi) and satiated (F4/80hiPKH2lo) macrophages, however, expressed high levels of this cytokine with the latter being significantly superior to all other leukocyte subsets. Notably, while phagocytic macrophages were found to express low levels of IFNβ mRNA and non-secreted isoforms of this protein, they did express higher levels of the secreted isoform (17), which could explain the relatively high detection of IFNβ protein by flow cytometry.
The big disparity in IFNβ expression between satiated and phagocytosis-reluctant monocytes suggests that the former are the major contributors to the transcriptome of non-phagocytic macrophages, especially considering the many IFN-responsive genes upregulated in non-phagocytic macrophages (17). These findings are also supported by the lack of difference in F4/80 expression between phagocytic and non-phagocytic macrophages (237.6 and 239.5 RPKM, respectively), whereas flow cytometry shows a twofold difference between Ly6ChiF4/80lo and Ly6C−F4/80hi cells (data not shown, N = 6). In addition, the relative similarity of the transcriptomes of both resolution phase macrophage subsets and resolution phase reparative Ly6Clo macrophages from liver injury, compared to their Ly6Chi monocyte counterparts, underscores the contribution of mature satiated macrophages rather than immature monocytes to the transcriptome of non-phagocytic macrophages. Notably, both resolution phase macrophage subsets had a higher transcriptomic similarity to monocytes and monocyte-derived macrophages rather than RPM. These findings are in accord with previously published results (17) and further support the notion that resolution phase macrophages in this zymosan A-induced inflammation are monocyte-derived. Non-phagocytic macrophages showed some increased transcriptomic similarity to monocytes than their phagocytic counterparts (Figure 6C). Therefore, we cannot exclude some contribution of Ly6ChiF4/80lo cells to their transcriptome. Nevertheless, it seems that the transcriptome of non-phagocytic macrophages is dominated by the satiated subset, and we will further discuss the function of these cells as satiated macrophages.
A comparison of the transcriptomes of phagocytic and satiated macrophages suggest that satiation is associated with an M1-to-M2 metabolic shift, namely, from glycolysis to oxidative phosphorylation, that is maintained during the resolution sequel, while satiated macrophages transition from a pro-fibrotic phenotype to a pro-resolving one. The increase in mitochondria fission and the reduction in ROS biosynthetic clusters seems linked to the high oxidative burden (from apoptotic debris) (15) that satiated macrophages need to tolerate, possibly by reducing their production of ROS. Thus, satiated macrophages seem to adjust to the balance between loss of the phagocytic machinery and the need to degrade cellular constituents and control ROS production.
Notably, we found satiated macrophages to upregulate gene clusters associated with T- and B-cell activation as well as responses to viruses. The unique IFNβ-associated gene signature previously observed in these macrophages (17) and the role of some inflammatory cytokines and chemokines in the resolution phase of inflammation (37–40) can partially account for this gene regulation. However, it is also documented that inflammatory cytokines, like TNFα, play a role in limiting muscle fibrosis by promoting the death of fibro/adipogenic progenitors in affected tissues (41). Resolution phase macrophages can also play a significant role in bridging the gap between innate and acquired immunity by attracting various myeloid subsets to the resolving site and affecting lymphoid responses (29).
In conclusion, we have shown that the resolution of inflammation yields several species of phagocytosis-reluctant and satiated myeloid cells, as well as phagocytic macrophages. The comparative analysis of the transcriptomes of satiated macrophages and their phagocytic precursors reveals a distinct shift in gene clusters that correspond to phagocytic, metabolic, and inflammatory properties. These genes and pathways are highlighted in the current report, suggesting a tissue repair and fibrosis-limiting role for satiated macrophages, and serving as a prelude to further studies that will decipher the intricate properties of resolution phase macrophages in various organs and inflammatory models.
The datasets analyzed for this study can be found in the BioProject repository with accession number PRJNA450293.
The animal study was reviewed and approved by the committee of Ethics in Animal Experimentation, University of Haifa.
SB and SS isolated macrophages extracted RNA and performed bioinformatics analysis of the sequences obtained. SB also performed the transfer, monocytic ablation, and MDSC characterization experiments, and wrote the manuscript. SS and SA performed the myeloid cell characterization. SS-Z and NS assisted in RNA isolation and data analysis. DB assisted in data analysis and discussion. AA designed the study and wrote the manuscript.
This study was funded by the Israel Science Foundation: grants nos. 534/09 and 678/13, by the Rosetrees Trust (grant no. M535) and the Wolfson Family Charitable Trust.
The authors declare that the research was conducted in the absence of any commercial or financial relationships that could be construed as a potential conflict of interest.
The Supplementary Material for this article can be found online at: https://www.frontiersin.org/articles/10.3389/fimmu.2020.00405/full#supplementary-material
Supplementary Figure 1. Gating strategy for analysis of monocyte/macrophage subsets. Immunostained peritoneal cells from 24–72 h PPI were plotted as FSC vs. SSC, and small apoptotic cells and lymphocytes, as well as granulocytic eosinophils were excluded from the analysis (A). Then, single cells were gated for further analysis (B) according to Ly6C vs. F4/80 (C), CD11b vs. F4/80 (D), and PKH2 vs. F4/80 (E).
1. Ortega-Gómez A, Perretti M, Soehnlein O. Resolution of inflammation: an integrated view: resolution of inflammation. EMBO Mol Med. (2013) 5:661–74. doi: 10.1002/emmm.201202382
2. Serhan CN, Brain SD, Buckley CD, Gilroy DW, Haslett C, O'Neill LAJ, et al. Resolution of inflammation: state of the art, definitions and terms. FASEB J. (2007) 21:325–32. doi: 10.1096/fj.06-7227rev
3. Headland SE, Norling LV. The resolution of inflammation: principles and challenges. Semin Immunol. (2015) 27:149–60. doi: 10.1016/j.smim.2015.03.014
4. Elliott MR, Ravichandran KS. The dynamics of apoptotic cell clearance. Dev Cell. (2016) 38:147–60. doi: 10.1016/j.devcel.2016.06.029
5. Uderhardt S, Herrmann M, Oskolkova OV, Aschermann S, Bicker W, Ipseiz N, et al. 12/15-lipoxygenase orchestrates the clearance of apoptotic cells and maintains immunologic tolerance. Immunity. (2012) 36:834–46. doi: 10.1016/j.immuni.2012.03.010
6. Murray PJ, Allen JE, Biswas SK, Fisher EA, Gilroy DW, Goerdt S, et al. Macrophage activation and polarization: nomenclature and experimental guidelines. Immunity. (2014) 41:14–20. doi: 10.1016/j.immuni.2014.06.008
7. Lavin Y, Winter D, Blecher-Gonen R, David E, Keren-Shaul H, Merad M, et al. Tissue-resident macrophage enhancer landscapes are shaped by the local microenvironment. Cell. (2014) 159:1312–26. doi: 10.1016/j.cell.2014.11.018
8. Okabe Y, Medzhitov R. Tissue-specific signals control reversible program of localization and functional polarization of macrophages. Cell. (2014) 157:832–44. doi: 10.1016/j.cell.2014.04.016
9. Rosas M, Davies LC, Giles PJ, Liao C-T, Kharfan B, Stone TC, et al. The transcription factor Gata6 links tissue macrophage phenotype and proliferative renewal. Science. (2014) 344:645–8. doi: 10.1126/science.1251414
10. Mantovani A, Biswas SK, Galdiero MR, Sica A, Locati M. Macrophage plasticity and polarization in tissue repair and remodelling: macrophage plasticity and polarization in tissue repair and remodelling. J Pathol. (2013) 229:176–85. doi: 10.1002/path.4133
11. Xue J, Schmidt SV, Sander J, Draffehn A, Krebs W, Quester I, et al. Transcriptome-based network analysis reveals a spectrum model of human macrophage activation. Immunity. (2014) 40:274–88. doi: 10.1016/j.immuni.2014.01.006
12. Voll RE, Herrmann M, Roth EA, Stach C, Kalden JR, Girkontaite I. Immunosuppressive effects of apoptotic cells. Nature. (1997) 390:350–1. doi: 10.1038/37022
13. Fadok VA, Bratton DL, Konowal A, Freed PW, Westcott JY, Henson PM. Macrophages that have ingested apoptotic cells in vitro inhibit proinflammatory cytokine production through autocrine/paracrine mechanisms involving TGF-beta, PGE2, and PAF. J Clin Invest. (1998) 101:890–8. doi: 10.1172/JCI1112
14. Park D, Han CZ, Elliott MR, Kinchen JM, Trampont PC, Das S, et al. Continued clearance of apoptotic cells critically depends on the phagocyte Ucp2 protein. Nature. (2011) 477:220–4. doi: 10.1038/nature10340
15. Wang Y, Subramanian M, Yurdagul A, Barbosa-Lorenzi VC, Cai B, de Juan-Sanz J, et al. Mitochondrial fission promotes the continued clearance of apoptotic cells by macrophages. Cell. (2017) 171:331–45.e22. doi: 10.1016/j.cell.2017.08.041
16. Mevorach D, Mascarenhas JO, Gershov D, Elkon KB. Complement-dependent clearance of apoptotic cells by human macrophages. J Exp Med. (1998) 188:2313–20. doi: 10.1084/jem.188.12.2313
17. Satyanarayanan SK, Kebir DE, Soboh S, Butenko S, Sekheri M, Saadi J, et al. IFN-β is a macrophage-derived effector cytokine facilitating the resolution of bacterial inflammation. Nat Commun. (2019) 10:1–6. doi: 10.1038/s41467-019-10903-9
18. Schif-Zuck S, Gross N, Assi S, Rostoker R, Serhan CN, Ariel A. Saturated-efferocytosis generates pro-resolving CD11blow macrophages: modulation by resolvins and glucocorticoids. Eur J Immunol. (2011) 41:366–79. doi: 10.1002/eji.201040801
19. Zigmond E, Samia-Grinberg S, Pasmanik-Chor M, Brazowski E, Shibolet O, Halpern Z, et al. Infiltrating monocyte-derived macrophages and resident Kupffer cells display different ontogeny and functions in acute liver injury. J Immunol. (2014) 193:344–53. doi: 10.4049/jimmunol.1400574
20. Graubardt N, Vugman M, Mouhadeb O, Caliari G, Pasmanik-Chor M, Reuveni D, et al. Ly6Chi monocytes and their macrophage descendants regulate neutrophil function and clearance in acetaminophen-induced liver injury. Front Immunol. (2017) 8:626. doi: 10.3389/fimmu.2017.00626
21. Yang W, Zhao X, Tao Y, Wu Y, He F, Tang L. Proteomic analysis reveals a protective role of specific macrophage subsets in liver repair. Sci Rep. (2019) 9:2953. doi: 10.1038/s41598-019-39007-6
22. Barter RL, Yu B. Superheat: an R package for creating beautiful and extendable heatmaps for visualizing complex data. J Comput Graph Stat. (2018) 27:910–22. doi: 10.1080/10618600.2018.1473780
23. Mahi NA, Najafabadi MF, Pilarczyk M, Kouril M, Medvedovic M. GREIN: an interactive web platform for re-analyzing GEO RNA-seq data. Sci Rep. (2019) 9:8. doi: 10.1038/s41598-019-43935-8
24. The ImmGen Consortium. Open-source ImmGen: mononuclear phagocytes. Nat Immunol. (2016) 17:741. doi: 10.1038/ni.3478
25. Love MI, Huber W, Anders S. Moderated estimation of fold change and dispersion for RNA-seq data with DESeq2. Genome Biol. (2014) 15:8. doi: 10.1186/s13059-014-0550-8
26. Carvalho BS, Irizarry RA. A framework for oligonucleotide microarray preprocessing. Bioinformatics. (2010) 26:2363–7. doi: 10.1093/bioinformatics/btq431
27. Johnson WE, Li C, Rabinovic A. Adjusting batch effects in microarray expression data using empirical Bayes methods. Biostatistics. (2006) 8:118–27. doi: 10.1093/biostatistics/kxj037
28. Bannenberg GL, Chiang N, Ariel A, Arita M, Tjonahen E, Gotlinger KH, et al. Molecular circuits of resolution: formation and actions of resolvins and protectins. J Immunol. (2005) 174:4345–55. doi: 10.4049/jimmunol.174.7.4345
29. Newson J, Stables M, Karra E, Arce-Vargas F, Quezada S, Motwani M, et al. Resolution of acute inflammation bridges the gap between innate and adaptive immunity. Blood. (2014) 124:1748–64. doi: 10.1182/blood-2014-03-562710
30. Mildner A, Marinkovic G, Jung S. Murine monocytes: origins, subsets, fates, and functions. Micro Spec. (2016) 4:33. doi: 10.1128/microbiolspec.MCHD-0033-2016
31. Stables MJ, Shah S, Camon EB, Lovering RC, Newson J, Bystrom J, et al. Transcriptomic analyses of murine resolution-phase macrophages. Blood. (2011) 118:e192–e208. doi: 10.1182/blood-2011-04-345330
32. Smith CL, Blake JA, Kadin JA, Richardson JE, Bult CJ, the Mouse Genome Database Group. Mouse Genome Database (MGD)-2018: knowledgebase for the laboratory mouse. Nucleic Acids Res. (2018) 46:D836–42. doi: 10.1093/nar/gkx1006
33. Wynn TA, Vannella KM. Macrophages in tissue repair, regeneration, and fibrosis. Immunity. (2016) 44:450–62. doi: 10.1016/j.immuni.2016.02.015
34. Parker MW, Rossi D, Peterson M, Smith K, Sikström K, White ES, et al. Fibrotic extracellular matrix activates a profibrotic positive feedback loop. J Clin Invest. (2014) 124:1622–35. doi: 10.1172/JCI71386
35. Saha S, Shalova IN, Biswas SK. Metabolic regulation of macrophage phenotype and function. Immunol Rev. (2017) 280:102–11. doi: 10.1111/imr.12603
36. Baker B, Maitra U, Geng S, Li L. Molecular and cellular mechanisms responsible for cellular stress and low-grade inflammation induced by a super-low dose of endotoxin. J Biol Chem. (2014) 289:16262–9. doi: 10.1074/jbc.M114.569210
37. Pashover-Schallinger E, Aswad M, Schif-Zuck S, Shapiro H, Singer P, Ariel A. The atypical chemokine receptor D6 controls macrophage efferocytosis and cytokine secretion during the resolution of inflammation. FASEB J. (2012) 26:3891–900. doi: 10.1096/fj.11-194894
38. Pallai A, Kiss B, Vereb G, Armaka M, Kollias G, Szekanecz Z, et al. Transmembrane TNF-α reverse signaling inhibits lipopolysaccharide-induced proinflammatory cytokine formation in macrophages by inducing TGF-β: therapeutic implications. J Immunol. (2016) 196:1146–57. doi: 10.4049/jimmunol.1501573
39. Aswad M, Assi S, Schif-Zuck S, Ariel A. CCL5 promotes resolution-phase macrophage reprogramming in concert with the atypical chemokine receptor D6 and apoptotic polymorphonuclear cells. J Immunol. (2017) 199:1393–404. doi: 10.4049/jimmunol.1502542
40. Tanaka T, Terada M, Ariyoshi K, Morimoto K. Monocyte chemoattractant protein-1/CC chemokine ligand 2 enhances apoptotic cell removal by macrophages through Rac1 activation. Biochem Biophys Res Commun. (2010) 399:677–82. doi: 10.1016/j.bbrc.2010.07.141
Keywords: inflammation, macrophages, efferocytosis, transcriptional profiling, fibrosis
Citation: Butenko S, Satyanarayanan SK, Assi S, Schif-Zuck S, Barkan D, Sher N and Ariel A (2020) Transcriptomic Analysis of Monocyte-Derived Non-Phagocytic Macrophages Favors a Role in Limiting Tissue Repair and Fibrosis. Front. Immunol. 11:405. doi: 10.3389/fimmu.2020.00405
Received: 31 May 2019; Accepted: 20 February 2020;
Published: 31 March 2020.
Edited by:
Chen Varol, Tel Aviv Sourasky Medical Center, IsraelReviewed by:
Jo A. Van Ginderachter, Vrije University Brussel, BelgiumCopyright © 2020 Butenko, Satyanarayanan, Assi, Schif-Zuck, Barkan, Sher and Ariel. This is an open-access article distributed under the terms of the Creative Commons Attribution License (CC BY). The use, distribution or reproduction in other forums is permitted, provided the original author(s) and the copyright owner(s) are credited and that the original publication in this journal is cited, in accordance with accepted academic practice. No use, distribution or reproduction is permitted which does not comply with these terms.
*Correspondence: Amiram Ariel, YW1pcmFtQHJlc2VhcmNoLmhhaWZhLmFjLmls
Disclaimer: All claims expressed in this article are solely those of the authors and do not necessarily represent those of their affiliated organizations, or those of the publisher, the editors and the reviewers. Any product that may be evaluated in this article or claim that may be made by its manufacturer is not guaranteed or endorsed by the publisher.
Research integrity at Frontiers
Learn more about the work of our research integrity team to safeguard the quality of each article we publish.