 Hung-Jen Chen1†
 Andrew Y. F. Li Yim2,3†
 Guillermo R. Griffith1
 Wouter J. de Jonge4Marcel M. A. M. Mannens2Enrico Ferrero5§
 Peter Henneman2‡
 Menno P. J. de Winther1,6*‡
- 1Department of Medical Biochemistry, Experimental Vascular Biology, Amsterdam University Medical Centers, University of Amsterdam, Amsterdam, Netherlands
- 2Genome Diagnostics Laboratory, Department of Clinical Genetics, Amsterdam University Medical Centers, University of Amsterdam, Amsterdam, Netherlands
- 3Epigenetics Discovery Performance Unit, GlaxoSmithKline, Stevenage, United Kingdom
- 4Tytgat Institute for Liver and Intestinal Research, Amsterdam University Medical Centers, University of Amsterdam, Amsterdam, Netherlands
- 5Computational Biology, Target Sciences, GlaxoSmithKline, Stevenage, United Kingdom
- 6Institute for Cardiovascular Prevention (IPEK), Ludwig Maximilians University, Munich, Germany
Macrophages are heterogeneous leukocytes regulated in a tissue- and disease-specific context. While in vitro macrophage models have been used to study diseases empirically, a systematic analysis of the transcriptome thereof is lacking. Here, we acquired gene expression data from eight commonly-used in vitro macrophage models to perform a meta-analysis. Specifically, we obtained gene expression data from unstimulated macrophages (M0) and macrophages stimulated with lipopolysaccharides (LPS) for 2–4 h (M-LPSearly), LPS for 24 h (M-LPSlate), LPS and interferon-γ (M-LPS+IFNγ), IFNγ (M-IFNγ), interleukin-4 (M-IL4), interleukin-10 (M-IL10), and dexamethasone (M-dex). Our meta-analysis identified consistently differentially expressed genes that have been implicated in inflammatory and metabolic processes. In addition, we built macIDR, a robust classifier capable of distinguishing macrophage activation states with high accuracy (>0.95). We classified in vivo macrophages with macIDR to define their tissue- and disease-specific characteristics. We demonstrate that alveolar macrophages display high resemblance to IL10 activation, but show a drop in IFNγ signature in chronic obstructive pulmonary disease patients. Adipose tissue-derived macrophages were classified as unstimulated macrophages, but acquired LPS-activation features in diabetic-obese patients. Rheumatoid arthritis synovial macrophages exhibit characteristics of IL10- or IFNγ-stimulation. Altogether, we defined consensus transcriptional profiles for the eight in vitro macrophage activation states, built a classification model, and demonstrated the utility of the latter for in vivo macrophages.
Introduction
The spatiotemporal regulation of tissue homeostasis relies on the complex network of diverse and heterogeneous immune cell populations. As a highly plastic and multifunctional immune cell, macrophages play a decisive role in the balance between pro-inflammatory defense and anti-inflammatory tissue repair (1). Dysregulation of macrophages has been implicated in a variety of disorders. As in vivo macrophages are often difficult to obtain in sufficient quantities, peripheral blood monocyte derived macrophages (MDMs) have been used extensively as in vitro model systems. To mimic in vivo macrophages encountering various triggers, MDMs are stimulated in vitro with lipopolysaccharides (LPS) and/or interferon-γ (IFNγ) to generate pro-inflammatory macrophages (M1), or activated with interleukin-4 (IL4), interleukin-10 (IL10) or glucocorticoids to generate anti-inflammatory macrophages (M2) (2). While in vitro model systems based on differential activation of MDMs emerge as a practical heuristic, they are not identical to in vivo tissue resident macrophages or infiltrating MDMs, which are often shaped by a complex and dynamic milieu within the microenvironment (1). Nonetheless, within the fast-growing field of systems immunology a crucial need exists for identifying and defining in vivo macrophage populations, as well as identifying an in vitro model capable of mimicking the tissue physiology and the systemic perturbation associated with diseases (3).
In the most comprehensive expression profiling study to date on in vitro macrophages, Xue et al. showed that macrophages display a more divergent reprogramming, thereby extending the classical pro- and anti-inflammatory dichotomy to an activation spectrum (4). While there have been attempts to summarize published studies in an effort to attain consensus for in vitro models (5), a proper integrative analysis on multiple published datasets has thus far not been performed. To address this, we integrated 206 microarray and bulk RNA-sequencing (RNA-seq) datasets from 19 different studies (6–23) to systematically characterize eight in vitro MDM activation states. Specifically, we investigated unstimulated macrophages (M0) and macrophages activated by: short exposure (2–4 h) to LPS (M-LPSearly) or long exposure (18–24 h) to LPS (M-LPSlate), LPS with IFNγ (M-LPS+IFNγ), IFNγ (M-IFNγ), IL-4 (M-IL4), IL-10 (M-IL10), and dexamethasone (M-dex) (Table 1). First, we identified consistently differentially expressed genes (cDEGs) and the associated pathways by comparing activated with unstimulated macrophages using a random effects meta-analysis (36). Second, we implemented penalized multinomial logistic regression and trained a classifier through repeated cross-validation that was capable of accurately and robustly distinguishing MDM activation states, independent of the macrophage differentiation factor applied and transcriptomic platform used. We named this classification model macIDR (macrophage identifier) and used it to project in vivo tissue-isolated and disease-associated macrophages onto the eight in vitro MDMs (26–29, 31–35) in an effort to identify potential macrophage-associated differences when comparing investigating tissues from different patient groups.

Table 1. Included datasets.
Methods
Data Sources and Search Strategy
Our initial search consisted of identifying public datasets for the meta-analysis and classification analysis, which we called the “training and test” data. Specifically, we searched the National Center for Biotechnology Information (NCBI) Gene Expression Omnibus (GEO) (37) and European Bioinformatics Institute (EBI) ArrayExpress (AE) (38) using the keywords “(macrophage) OR (monocyte) OR (MDM) OR (HBDM) OR (MoDM) OR (MAC) OR (dendritic cell) AND “Homo sapiens” [porgn:__txid9606].” Our search yielded 1,851 and 175 experiments for GEO and AE, respectively at the time of writing (May 2018). In a subsequent screening we filtered for studies that investigated primary macrophages where we excluded studies that investigated stem cell derived macrophages or immortalized cell lines. For consistency purposes, we limited the training and test data to macrophages differentiated with macrophage colony-stimulating factor (M-CSF) only as it is the most commonly used method to generate MDMs for both pro- and anti-inflammatory activations. We then categorized macrophage activation states according to stimulus and treatment time. For the meta-analysis and classification analysis, we sought to obtain at least 4 studies that included at least 2 biological replicates per activation state. Furthermore, studies were selected only if they included unstimulated control macrophages. Microarray datasets generated on platforms other than Illumina, Affymetrix or Agilent were excluded to ensure comparability. As we only investigated genes that were measured in every single study, datasets that displayed limited overlap in the measured genes with the other studies were also removed. To further validate the classification model, we expanded our search by acquiring data from granulocyte-macrophage colony-stimulating factor (GM-CSF) differentiated macrophages as well as data from non-macrophage cells. Finally, we expanded our search to include data from in vivo macrophages obtained from clinical specimen. An overview of our inclusion criteria and the general workflow can be found in Figure 1.
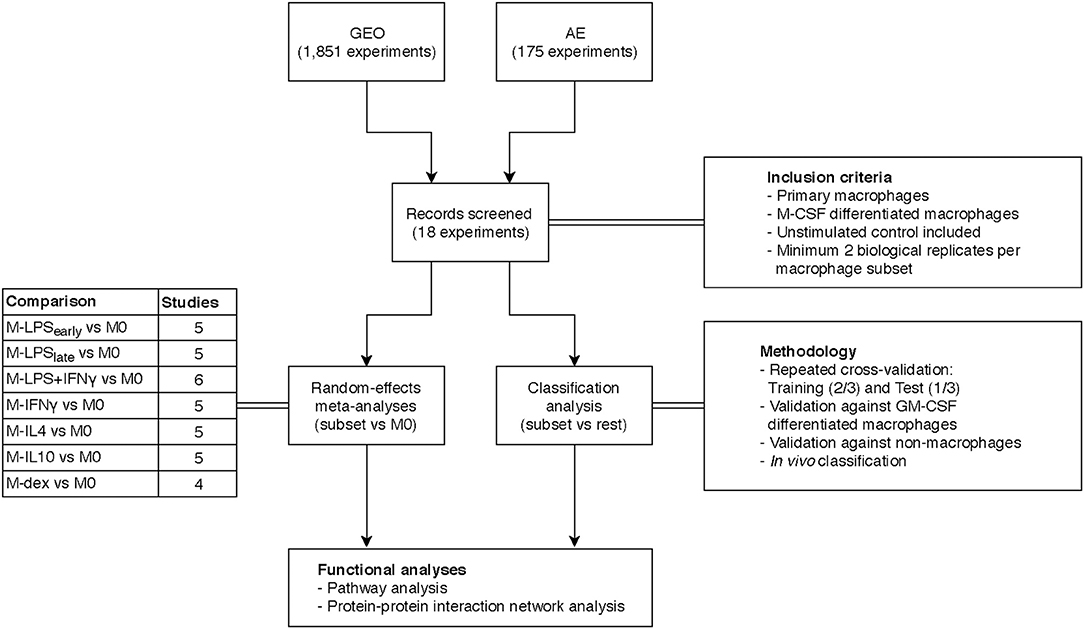
Figure 1. Overview study design. Transcriptome datasets were found on the Gene Expression Omnibus (GEO) or ArrayExpress (AE) and screened according to the inclusion criteria yielding 18 datasets. A separate meta-analysis and classification analysis was performed and results thereof were subjected to functional pathway analyses.
Data Extraction and Import
Microarray Data Preparation
All analyses were performed in the R statistical environment (v3.5.0) (39). The download and import of the raw and processed GEO and AE microarray was performed using the GEOquery (v2.48.0) (40) and the ArrayExpress (v1.40.0) (41) packages respectively. Raw data was normalized in a platform-specific fashion: Affymetrix microarrays were normalized using the rma function from the affy (v1.54.0) (42) and oligo (v1.40.2) (43) packages, whereas Illumina and Agilent microarrays were normalized using the neqc function from the limma (v3.31.14) (44) package. Quality control of the log2 transformed expression values was performed using WGCNA (v1.51) (45) and arrayQualityMetrics (v3.32.0) (46) to remove unmeasured samples, genes, and studies of insufficient quality. Microarray probes were reannotated to the Entrez ID according to the annotation files on Bioconductor. Probes that associated to multiple Entrez IDs were removed and multiple probes associating to the same Entrez ID were summarized by taking the median.
Bulk RNA Sequencing Data Preparation
Public raw sequencing reads were sourced from the NCBI Sequence Read Archive (SRA) (47) and converted to fastq files using the fastq-dump function from the SRA-tools package (v2.9.0). All raw fastq files were first checked for quality using FastQC (v0.11.7) (48) and MultiQC (v1.4) (49). The sequencing reads were aligned against the human genome GRCh38 using STAR (v2.5.4) (50). Post-alignment processing was performed using SAMtools (v1.7) (51) after which reads overlapping gene features obtained from Ensembl (v91) were counted using the featureCounts program in the Subread (v1.6.1) (52) package. Gene annotations were converted from Ensembl IDs to Entrez IDs using biomaRt (53).
Single-Cell RNA Sequencing Data Preparation
Processed count data was downloaded and analyzed in the R statistical environment. Normalization, scaling, clustering was done using the Seurat package (v3.0.2) (54). Macrophages were identified based on unsupervised Louvain clustering and identifying the cluster that expressed typical macrophage markers SPI1, C1QB, CD14, CD68, and CSF1R. The purported macrophage cells were extracted and a secondary unsupervised clustering analysis was performed. Classification of the individual was subsequently performed without the use of an intercept.
Data Analysis
Meta-Analysis
A random effects meta-analysis was performed on the normalized data using the GeneMeta package (v1.52.0) (55), which implements the statistical framework outlined by Choi et al. (36). In short, the standardized effect size (Cohen d adjusted using Hedges and Olkin's bias factor) and the associated variance were calculated for each study by comparing each activated macrophage with the unstimulated macrophage within each study. The standardized effect sizes were then compared across studies by means of random effects model to correct for the inter-study variation, thereby yielding a weighted least squares estimator of the effect size and its associated variance. The estimator of the effect size was then used to calculate the Z-statistic and the p-value, which was corrected for multiple testing using the Benjamini-Hochberg procedure. We modified the GeneMeta functions to incorporate the shrunken sample variances obtained from limma (44) for calculating the standardized effect sizes. Consistently differentially expressed genes (cDEGs) were defined by an adjusted p < 0.05.
Classification Analysis
Raw microarray and RNA-seq data were log2 transformed where necessary after which the data was (inner) merged and randomly divided into a training (2/3) and test set (1/3). As the test set should remain hidden from the training set, raw microarray and RNA-seq data was used instead of normalized data to prevent data leakage (56). Elastic net regression was subsequently performed using the R glmnet (v2.0) (57) package where we set the alpha to 0.8.
The training set was subjected to 10-fold cross-validation for tuning the regularization parameter lambda. This procedure was subsequently repeated 500 times to stabilize the randomness introduced by the initial splitting step for cross-validation (58). We considered genes to be stable classifiers if they displayed a non-zero log odds ratio in at least 50% of the 500 iterations. The final log odds ratio was selected by taking the median of each stable predictor gene across the 500 iterations. We subsequently validated our classification model on the withheld test set.
In addition to the training and test data, we downloaded and imported additional datasets from GM-MDMs, non-macrophage cells, and in vivo macrophages. Subsequent classification was performed using the macIDR package. Unlike the studies included for training and testing, some of the included studies were performed on platforms that did not measure the expression of some of the predictor genes. To that end, the relative log odds ratios were calculated, which represent the log odds ratio present relative to the total log odds ratio had all predictor genes been present.
Functional Gene Set Analyses
Gene set analyses of the 8000 cDEGs with the lowest p-values were performed using the Ingenuity Pathway Analysis (59) software package, whereas the predictor genes were functionally assessed using the Metascape software (60). Additionally, potential relationships between the cDEGs were assessed and visualized by performing a protein-protein association (PPA) analysis on the 100 cDEGs with the lowest p-values for each comparison using the STRING database (61). In short, the cDEGs were interrogated for cataloged associations with evidence from the literature that the encoded proteins interacted, co-expressed, or co-evolved with one another based on text mining, curated databases, and experiments. We limited the PPA-analyses to the top 100 cDEGs to make networks comparable across the different stimuli and to prevent overcrowding.
In vitro Validation Experiment
Human Monocyte-Derived Macrophage Differentiation and Stimulation
Buffy coats from three healthy anonymous donors were acquired from the Sanquin blood bank in Amsterdam, the Netherlands. All the subjects provided written informed consent prior to donation to Sanquin. Monocytes were isolated through density centrifugation using Lymphoprep™ (Axis-Shield) followed by human CD14 magnetic beads purification with the MACS® cell separation columns (Miltenyi). The resulting monocytes were seeded on 24-well tissue culture plates at a density of 0.8 million cells/well. Cells were subsequently differentiated to macrophages for 6 days in the presence of 50ng/mL human M-CSF (Miltenyi) with Iscove's Modified Dulbecco's Medium (IMDM) containing 10% heat-inactivated fetal bovine serum, 1% Penicillin/Streptomycin solution (Gibco) and 1% L-glutamine solution (Gibco). The medium was renewed on the third day. After differentiation, the medium was replaced by culture medium without M-CSF and supplemented with the following stimuli: nothing, 10 ng/mL LPS (Sigma, E. coli E55:O5), 10 ng/mL LPS plus 50 ng/mL IFNγ (R&D), 50ng/mL IFNγ, 50 ng/mL IL4 (PeproTech), 50 ng/mL IL10 (R&D), 100 nM dexamethasone (Sigma) for 24 h. LPSearly macrophages were first cultured with culture medium for 21 h and then stimulated with 10 ng/mL LPS for 3 h prior to harvest. Total RNA was isolated with Qiagen RNeasy Mini Kit per the manufacturer's recommended protocol. RNA sequencing libraries were prepared using the standard protocols of NuGEN Ovation RNA-Seq System V2 kit. Size-selected cDNA library samples were sequenced on a HiSeq 4000 sequencer (Illumina) to a depth of 16M per sample according to the 50 bp single-end protocol at the Amsterdam University Medical Centers, location Vrije Universiteit medical center. Raw fastq files were subsequently processed in the same manner as the public datasets to maintain consistency.
Results
Overview Datasets
Altogether, we identified 206 suitable microarray and bulk RNA-sequencing (RNA-seq) datasets from 19 different studies (6–23) for the meta-analysis and classification analysis (Figure 1). These datasets comprised eight in vitro MDM activation states, namely unstimulated macrophages (M0) and macrophages activated by: short exposure (2 to 4 h) to LPS (M-LPSearly) or long exposure (18 to 24 h) to LPS (M-LPSlate), LPS with IFNγ (M-LPS+IFNγ), IFNγ (M-IFNγ), IL-4 (M-IL4), IL-10 (M-IL10), and dexamethasone (M-dex) (Table 1).
Identification of Well-Known and Novel Transcriptional Markers and Pathways of Macrophage Activation
We identified genes that were consistently differentially expressed across studies (cDEGs) by means of a random effects meta-analysis (Supplementary Table 1). Many of the observed cDEGs were known to be characteristic for certain macrophage activation states. For example, interleukin-1 beta (IL1B), C-C Motif Chemokine Ligand 17 (CCL17) and Cluster of Differentiation 163 (CD163) were consistently upregulated in M-LPSlate, M-IL4, and M-dex compared with M0, respectively (5). Notably, we identified several novel genes that were not widely considered as activated macrophage markers. Consistent upregulation of interleukin-7 receptor (IL7R) and CD163 Molecule Like 1 (CD163L1) was observed in M-LPSearly and M-IL10, respectively. Similarly, consistent downregulation of Nephroblastoma Overexpressed (NOV) and Adenosine A2b receptor (ADORA2B) was observed when comparing M-IFNγ, M-LPSlate, and M-LPS+IFNγ with M0, respectively.
At the genome-wide level, pairwise correlation analysis of the standardized effect sizes across studies showed that M-LPSearly, M-LPSlate, M-IFNγ, and M-LPS+IFNγ formed one cluster, whereas M-IL4, M-IL10 and M-dex formed a second cluster (Figure 2A). Other activation states could not be discerned easily, which could be attributed to study-specific effects. This observation agrees with previous studies where transcriptional alterations induced with these conventional pro- and anti-inflammatory stimuli were found to cluster according to the M1-M2 dichotomy (4, 62). Further sub-clustering appeared to divide the macrophages according to the stimuli. The separation between the M1 and the M2 was also apparent as the first principal component (PC1), which displayed a clear separation between M1 and M2 associated stimuli on the left and right, respectively (Figure 2B). Relative to the M1 macrophages, the M2 macrophages appeared to display a stronger diversity along PC2, suggesting a more distinctive transcriptional programming of the individual activation states.
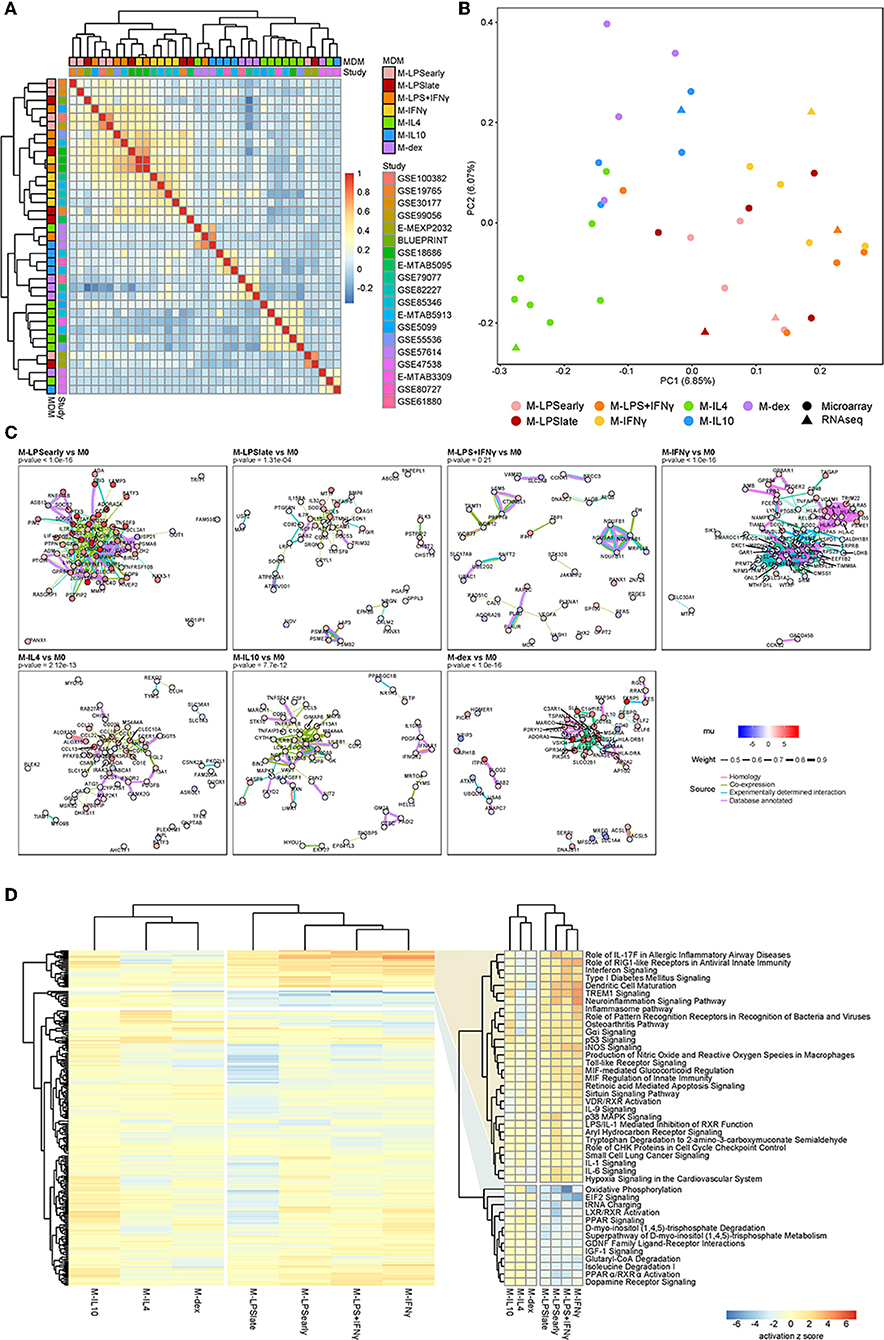
Figure 2. Summary meta-analysis. (A) Heatmap of the Cohen d pairwise Spearman correlation coefficients. (B) Principal component analysis of the Z-values obtained from the meta-analysis. (C) Protein-protein association network as obtained from the top 100 cDEGs using the STRING database. Node colors represent the unbiased estimator of the effect size (mu), whereas the edge colors and thickness represent the source of the cataloged association and the weight of the evidence. (D) Heatmap of the canonical pathways with the intensity representing the activation z score. Two most defining clusters have been enlarged and annotated on the right.
cDEGs Are Enriched for Pro- and Anti-inflammatory Pathways
To investigate the functional relevance of the cDEGs, we performed protein-protein association (PPA) analyses on the top 100 cDEGs. Per comparison, we observed cluster formation visually as well as statistically, where an overrepresentation analysis identified more PPAs than would have been observed by chance for a random gene set of similar size. Notably, M-LPSearly, M-LPSlate, M-IFNγ, M-IL4, M-IL10, and M-dex cDEGs all displayed significantly more interactions (Figure 2C). M-LPSearly cDEGs formed an upregulated PPA-network centered around the pro-inflammatory mediators tumor necrosis factor α (TNFα), interleukin-6 (IL6), and prostaglandin-endoperoxide synthase 2 (PTGS2). M-IFNγ cDEGs revealed two separate clusters, one for major histocompatibility complex (MHC) proteins (upregulated) and one for nucleic acid and nitrogen metabolism-associated proteins (downregulated). The PPA network found for M-IL4 cDEGs suppressed pro-inflammatory proteins interleukin-1B (IL1B) and interleukin-1 receptor-associated kinase 3 (IRAK3), but enhanced chemokine ligands (CCL) considered to be co-expressed with IL1B, such as CCL13, CCL17, CCL18, and CCL22 (Figure 2C). Finally, M-dex cDEGs displayed a cluster centered at V-Set And Immunoglobulin Domain Containing 4 (VSIG4) with many of the genes encoding anti-inflammatory proteins, such as Macrophage Receptor With Collagenous Structure (MARCO) (63) and membrane-spanning, four domain family, subfamily A (MS4A4A) (64). As VSIG4 has been shown to modulate macrophage inflammatory function via mitochondrial reprogramming (65), the PPA network in M-dex vs. M0 suggests concordant immunosuppressive metabolic changes in macrophages.
To systematically identify whether the cDEGs were enriched for particular pathways, we performed pathways analyses using the Ingenuity Pathway Analysis (IPA) software package. While the clusters were slightly different among individual macrophage activation states, the overall separation between M1 and M2 was apparent with hierarchical clustering revealing two sets of pathways that appeared to be responsible for the separation (Figure 2D and Supplementary Table 2). Pathways known for their pro- and anti-inflammatory responses, such as interferon signaling and LXR/RXR activation, displayed a clear and distinct pattern for the M1 and M2 macrophages, respectively.
Elastic Net Classification
Classification Analysis Distinguishes Macrophage Activation States With High Accuracy
We merged the data from different microarray and RNA-seq experiments and performed multinomial elastic net regression on the 5986 overlapping genes present in all datasets to identify gene sets capable of distinguishing macrophage activation states. The merged expression data was randomly split into a training (2/3) and a test (1/3) set whereupon the training set was used to build a model through 10-fold cross-validation. To achieve robust performance, we repeated the cross-validation procedure 500 times and took the median thereof to stabilize the log odds ratios (58). Genes were considered stable predictors if their log odds ratio was non-zero in more than 50% of the iterations (Supplementary Figure 1). Subsequent classification was performed using the median log odds ratio per gene across all iterations (Figure 3A). Altogether, our classifier was composed of 97 median-stabilized predictor genes, and was compiled as an R package called macIDR (https://github.com/ND91/macIDR).
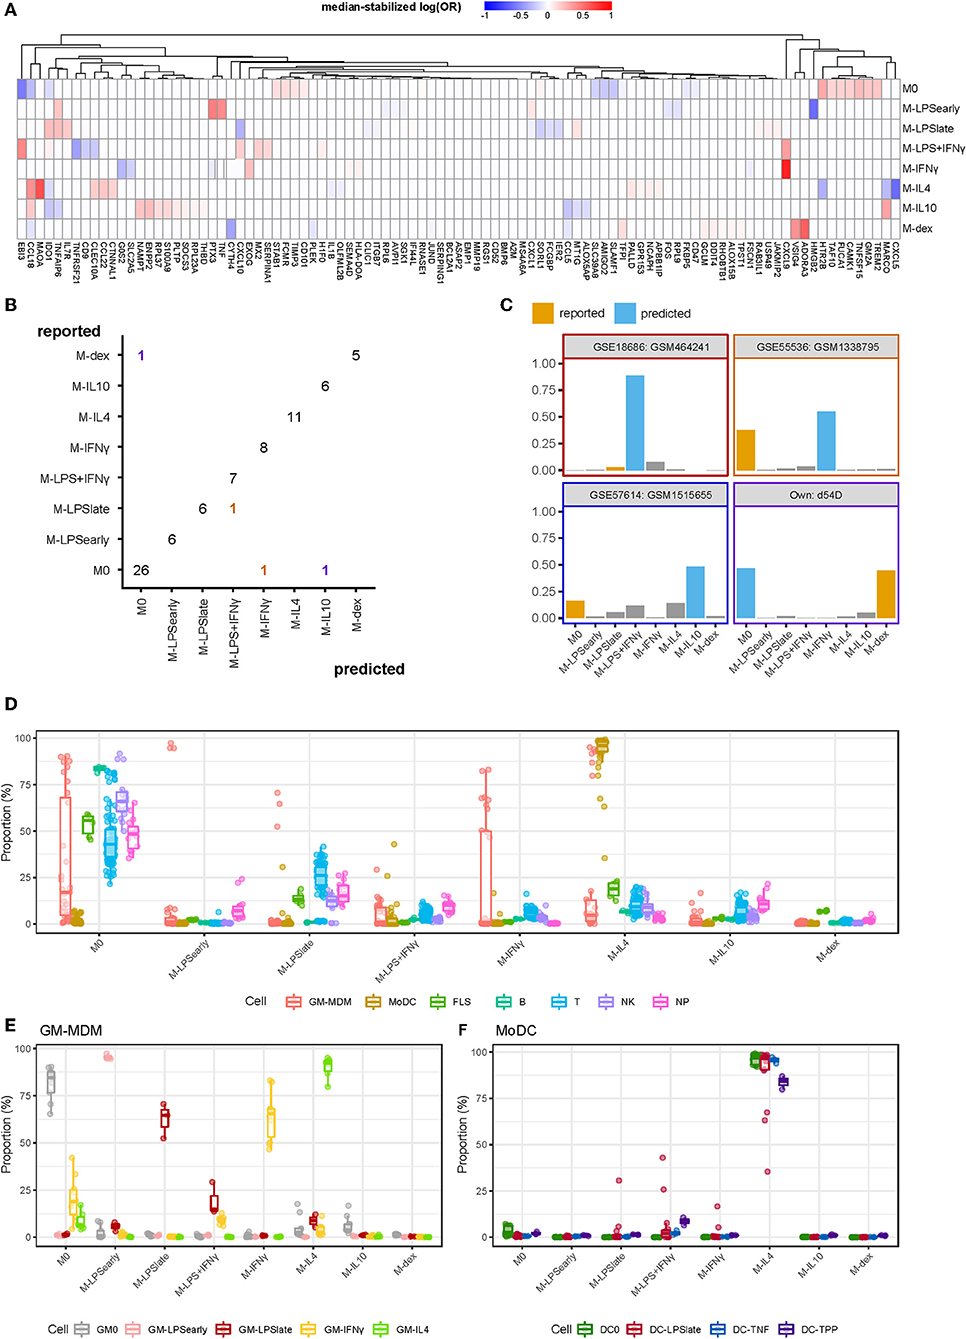
Figure 3. Summary classification analysis. (A) Heatmap of the median-stabilized log odds ratios per macrophage activation state for each of the 97 predictor genes. (B) Confusion matrix representing the number of correctly classified samples (entries on the diagonal) vs. the misclassified samples (entries on the off-diagonal). Classes on the y-axis represents the reported class while classes on the x-axis represent the predicted class. Colors represent the predicted classes with purple, red, yellow, and blue representing M-dex, M-LPS+IFNγ, M-IFNγ, and M-IL10, respectively. (C) Bar plots of the misclassified samples depicting the classification signal on a scale of 0 to 1 where the class with the largest signal represents the predicted class. Blue bars represent the incorrectly predicted class and orange bars represent the reported class. Border colors represent the predicted classes with purple, red, yellow, and blue representing M-dex, M-LPS+IFNγ, M-IFNγ, and M-IL10, respectively. (D) Boxplots representing the classification signal on a scale of 0 to 1 where classes with the largest signal represents the predictions. Colors represent GM-CSF differentiated macrophages (GM-MDMs), monocyte-derived dendritic cells (MoDCs), fibroblast-like synoviocytes (FLS), B lymphocytes (B), T lymphocytes (T), natural killer cells (NK), and neutrophils (NP). (E) GM-MDMs and (F) MoDCs colored by stimulation.
To validate our model, we tested macIDR against the previously withheld test set, which included a newly-generated RNA-seq experiment containing all included activation states (E-MTAB-7572). Classification of the test set revealed an accuracy above 0.95 with both high sensitivity (>0.98) and specificity (>0.83; Table 2). In total, 75 out of 79 test samples were correctly classified (Figure 3B). Notably, for three of the four misclassified samples, the second-best prediction was the activation model as reported by the authors. Investigation of the four misclassified samples revealed that most errors were made regarding M0: two M0 datasets were classified as M-IL10 (GSM151655) and M-IFNγ (GSM1338795), and one M-dex dataset (d54D) as M0. The fourth misclassification pertained a M-LPSlate (GSM464241) dataset classified as M-LPS+IFNγ (Figure 3C).

Table 2. Classification testing.
Next, we wanted to test the potential limitations of macIDR by classifying macrophage differentiated with granulocyte-macrophage colony-stimulating-factor (GM-CSF) stimulated MDMs (GM-MDMs) as well as non-macrophage cell types. To this end, we classified data from four different studies (4, 23–25). We observed that the GM-MDMs were classified as their M-CSF counterparts (Figures 3D,E), whereas most non-MDMs were classified as M0 (Figure 3D, Supplementary Table 3). Notably, the monocyte-derived dendritic cells (MoDCs) were recognized as M-IL4 (Figure 3D), even after stratifying for subsequent stimulation (Figure 3F). We speculate that this might due to the differentiation method (GM-CSF + IL4) used to generate MoDCs in vitro.
Pathway analysis of all predictor genes revealed enrichment for inflammatory pathways, such as TNFα signaling, inflammatory response and interferon gamma signaling, underscoring the importance of inflammation regulation in macrophage activation (Supplementary Figure 2A, Supplementary Table 4). A follow-up transcription factor motif analysis on the promoters of the predictor genes showed significant enrichment for macrophage-specific transcription factors, the E26 transformation-specific PU.1 (Spi1) and SpiB (Supplementary Figure 2B).
In vivo Macrophage Classification
Alveolar Macrophages From COPD and Smoking Individuals Display Reduced M-IFNγ Signal
We next classified macrophages derived from patient tissues to study their semblance to in vitro MDMs. We investigated alveolar macrophages (AMs) obtained through bronchoalveolar lavage from smoking individuals, COPD patients, asthma patients (31), and healthy control (HCs). Overall, we found that the AMs were classified primarily as M-IL10 (Figure 4A), which appears to be driven by the MARCO signal. This corroborates the observation that lung tissue, specifically AMs, display significantly higher gene expression of MARCO relative to surrounding cells and other tissues (66, 67). Moreover, MARCO was found to be necessary in AMs for mounting a proper defense response (66–68). Further comparisons of the AMs derived from different patient groups, we found that the macrophage signal could be stratified according to health status where COPD- and smoker-derived AMs displayed a higher M-IL4, M-IL10, and M-dex signal and a reduced M-IFNγ and M-LPS+IFNγ signal compared to AMs obtained from HCs. This observation indicates a stronger M2- and lesser M1-like phenotype, which was also noted in previous studies (4, 31). This difference in classification signal was found to be driven by decreased log odds for C-X-C Motif Chemokine Ligand 9 (CXCL9) (M-IFNγ and M-LPS+IFNγ) and CXCL5 (M-IL4) and increased log odds for TNFAIP6 (M-IL10), and ADORA3 (M-dex; Supplementary Figure 3).
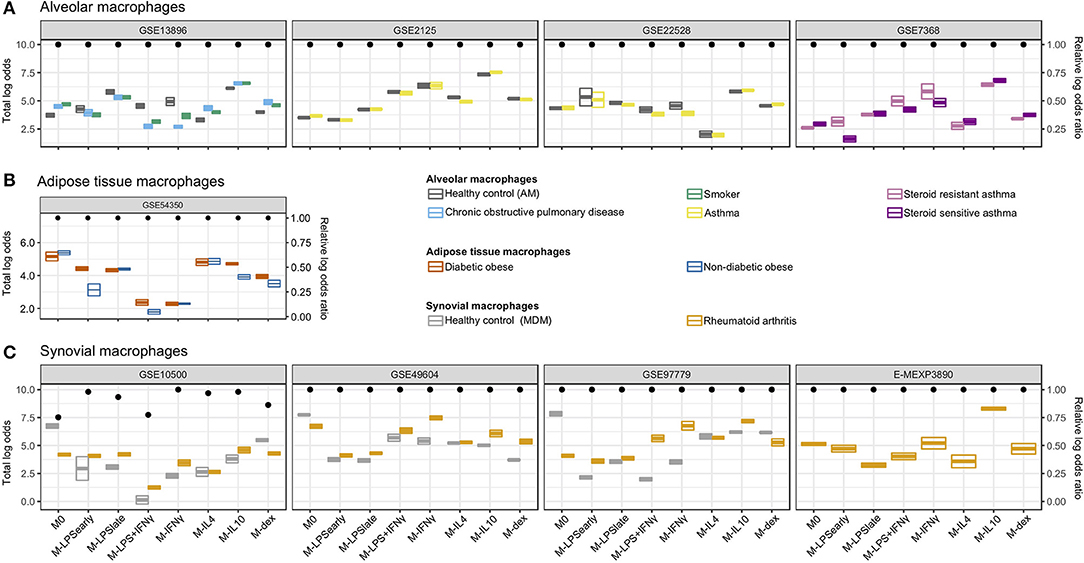
Figure 4. Classification of in vivo macrophages. Summarized classification results per dataset with cross-bars representing the mean and the standard errors of the log odds colored by the macrophage in vivo type. Dots above represent the log odds ratio [log(OR)] relative to the sum of the log odds ratios if all predictor genes were measured. (A) Alveolar macrophages obtained from smoking individuals, chronic obstructive pulmonary disease (COPD), asthma patients, as well as healthy controls. (B) Adipose tissue macrophages obtained from diabetic obese and non-diabetic obese patients. (C) Synovial macrophages obtained from rheumatoid arthritis (RA) patients and MDMs from healthy controls (HCs).
While no clear differences were observed when comparing AMs from asthma patients to HCs, AMs from steroid-resistant asthma patients displayed a decreased M-dex signal and increased M-LPSearly, M-IFNγ, and M-LPS+IFNγ signal relative to steroid sensitive asthma AMs (Figure 4A). The apparent difference in steroid sensitivity appeared to be caused by a difference in TNF and CXCL9 signals contributing to the M-LPSearly and M-IFNγ classification, respectively (Supplementary Figure 3). This observation corroborates previous studies where IFNγ signaling was found to suppress glucocorticoid-triggered transcriptional remodeling in macrophages leading to the macrophage-dependent steroid-resistance (69), thereby reflecting a higher level of IFNγ in steroid-resistant relative to steroid-sensitive asthma patients (70).
Adipose Macrophages Show Similarity With M0 and M-IL4
We subsequently investigated visceral adipose tissue macrophages (ATMs) derived from diabetic and non-diabetic obese patients (35). Classification analysis suggested visceral ATMs showed most similarity with M0 followed by M-IL4 (Figure 4B). While we were not capable of defining a set of genes responsible for the M0 classification, we observed that the concordant expression of Monoamine oxidase A (MAOA) and CCL18 contributed the most to the M-IL4 signal (Supplementary Figure 4). MAOA encodes a norepinephrine degradation enzyme and is expressed primarily in sympathetic neuron-associated macrophages isolated from the subcutaneous adipose tissue. In these cells, MAOA's norepinephrine clearance activity has been linked to obesity (71). Interestingly, when comparing ATMs from diabetic obese with non-diabetic obese patients, we observed a stronger signal of M-IL10 and M-LPSearly driven by CCL18 and TNF, respectively (Supplementary Figure 4). Notably, CCL18 expression in both visceral and subcutaneous adipose tissue has been associated with insulin-resistant obesity (72, 73). Furthermore, several studies have demonstrated that ATMs could be divided into CD11C+CD206+ and CD11C−CD206+ subpopulations (74, 75). Specifically, an increased density of the IL10 and TNFα-secreting CD11C+CD206+ ATMs in adipose tissue was associated with insulin resistance (74), which coincides with the observed increase of M-IL10 and M-LPSearly signals while the M-IL4 signal remained unaltered.
Synovial Macrophages From Rheumatoid Arthritis Patients Similar to M- IFNγ and M-IL10
Finally, we analyzed synovial macrophages (SMs) from RA patients and MDMs from HCs (26–29). Whereas, unstimulated MDMs were successfully classified as M0, SMs from RA patients were classified as either M-IL10 or M-IFNγ (Figure 4C). Specifically, RA-derived synovial macrophages (RA-SMs) from 3 studies (26, 28, 29) were classified as M-IL10, whereas samples from one study (27) were classified as M-IFNγ. Comparison of the classification signal of the RA-SMs with the HC MDMs displayed a higher signal for M-IFNγ and M-IL10 (Figure 4C). Concordantly, a previous study reported an increased gene expression of IFNγ and IL10 in RA synovial fluid mononuclear cells compared with PBMCs from both RA patients and HCs (76). Further investigation of the M-IFNγ and M-IL10 classification revealed dominant signals for M-IFNγ predictor gene CXCL9 and for M-IL10 predictor gene MARCO (Supplementary Figure 5). This observation agrees with previous studies where elevated gene and protein expression of CXCL9 was found in the synovium of RA patients compared with that of osteoarthritis patients (77, 78). Similarly, an increased presence of MARCO was detected in the inflamed joints, particularly in RA patients (79).
We extended our analysis to single-cell RNA-seq (scRNA-seq) data from RA-derived biopsies (30). We extracted the macrophage cluster (cluster 0) based on the expression of the typical macrophage markers Spi-1 proto-oncogene (SPI1), complement C1q B chain (C1QB), CD14 molecule (CD14), CD68 molecule (CD68), and colony stimulating factor 1 receptor (CSF1R) (Figure 5A and Supplementary Figure 6). Classification of the individual macrophages using macIDR indicated that most macrophages were classified as M-IL10 (Figure 5B). Notably, the macrophage predictions did not match with according to RA-SM sub-clusters (Supplementary Figure 7).
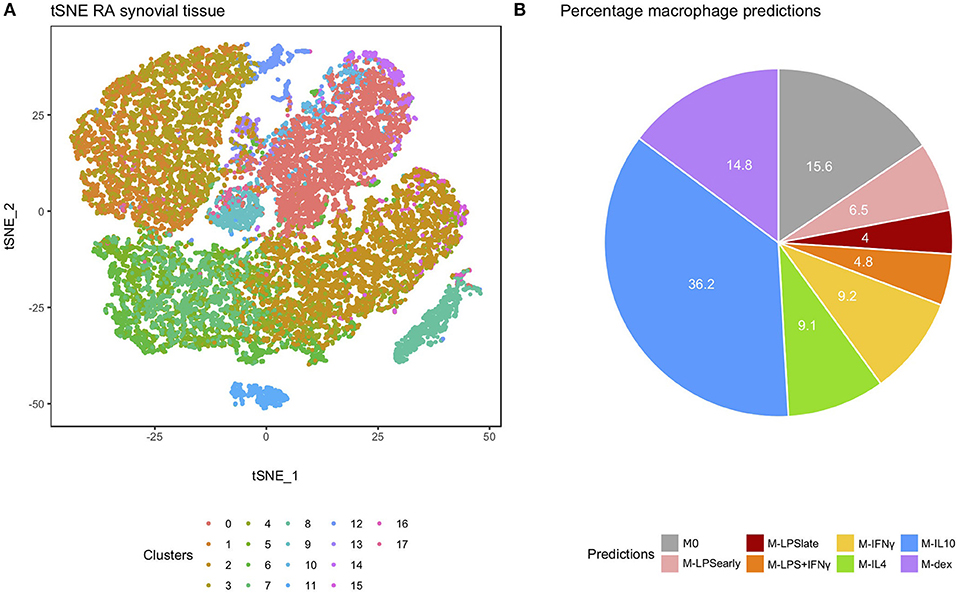
Figure 5. Analysis of the rheumatoid arthritis-derived synovial cells. (A) t-distributed stochastic neighbor embedding (tSNE) visualization of the synovial biopsy-derived cells as obtained through Louvain clustering. (B) Pie chart depicting the frequency of each macrophage activation model as predicted by macIDR.
Discussion
In this study, we characterized macrophages by integrating public gene expression datasets of eight in vitro macrophage models. We identified both well-known and novel markers for activated macrophages across different studies. We subsequently built a classification model capable of defining and discriminating macrophage activation states and made this available as an R package called macIDR. By applying macIDR to in vivo macrophages, we projected the latter onto the in vitro macrophage model system providing insights in how disease and tissue of origin affect activation composition.
Previous macrophage characterization studies focused primarily on gathering large cohorts. Xue et al. adopted an inclusive strategy by categorizing genes into different activation states through self-organizing maps and correlation analyses (4). Instead, we sought to find consensus from published data by implementing a descriptive and an exclusive strategy represented by the meta-analysis and the elastic net classification analysis, respectively. Where the meta-analysis identified genes that were consistently differentially expressed across studies when comparing stimulated with unstimulated MDMs, elastic net classification analysis represented a rigorous feature selection approach that yielded predictor genes capable of classifying the MDMs with high accuracy. As a meta-analysis-based computational model, the strength of our approach would continuously increase as public repositories expand. Furthermore, we implemented an additional layer of robustness by performing repeated cross-validation to ensure that the final output of the elastic net regression was stable.
Many of the observed cDEGs and predictor genes have been recognized as bona fide markers for different activation states, such as TNF (M-LPSearly), IDO1 (M-LPS+IFNγ), CXCL9 (M-IFNγ), and ADORA3 (M-dex) (5) (Supplementary Table 1 and Figure 3A). We also identified several novel marker genes, which have been reported to be differentially expressed in diseases correlated with the stimuli. For example, deficiency of NOV (also known as CCN3), a down-regulated cDEG when comparing M-LPSlate and M-IFNγ with M0, increases foam cell formation and exacerbates atherosclerosis in mice (80, 81). Similarly, the regulation of NOV might play a bridging role in inflammatory response and lipid accumulation in macrophages during atherogenesis as both toll-like receptor 4 and IFNγ-signaling represent major regulators in atherosclerosis (82). Pathway and transcription factor motif analyses of the predictor genes revealed enrichment for inflammatory pathways and macrophage transcription factors PU.1 and SpiB. As both key transcription factors drive macrophage differentiation (83), our observation suggests that macrophage activation is determined by the regulation of the lineage-specific inflammation. We also observed that some predictor genes were associated to pathways not typically described within the context of macrophage activation. For example, ribosomal proteins (RPL) 6 and 9 were found to be negative predictor genes of M-LPSearly and are typically involved in translation. This finding might be akin to the downregulation of ribosomal translation during the maturation of MoDCs with LPS (84). Another example pertains M-IL4 for which we observed changes in serotonin processing. We observed that serotonin receptor 5-Hydroxytryptamine Receptor 2B (HTR2B) (76) was represented by a negative log odds ratio, whereas serotonin degrading enzyme MAOA (85) was represented by a positive log odds ratio. Together, it appears as though M-IL4 favors the absence of serotonin, despite the fact that serotonin reportedly attenuates the secretion of the pro-inflammatory cytokine TNFα (86). While it remains enticing to describe the functionality of the novel macrophage genes based on previous literature, it should be understood that the current study is associative in nature with the reported genes being different in expression. Our observations warrant future mechanistic studies that elucidate the physiological and functional relevance of these genes within macrophages.
To test the limits of the classification model, we classified non-MDM cells. Classification of MoDCs indicated that they were most similar to M-IL4, even after treatment with pro-inflammatory agents such as LPS. This observation is likely due to the method used to generate MoDCs, where monocytes are differentiated with GM-CSF and IL4. Notably, while the MoDCs were classified primarily as M-IL4, some MoDCs matured with LPS for 24 h displayed a mildly increased signal toward M-LPS+IFNγ and M-LPSlate. Similarly, immature MoDCs (DC0) displayed a slightly higher response for M0. All other non-macrophage cells were classified as M0. While the log odds of proper M0 classifications were slightly higher than improper M0 classifications, we acknowledge that no clear threshold could be defined. We are unsure why M0 was predicted as a class for non-MDM and non-MoDC datasets, but we speculate that it might be related to the M0 class being represented by most predictor genes relative to the other classes. We therefore recommend potential users of macIDR to determine a priori that their dataset of interest represents macrophages either experimentally or using in silico cell-composition estimation methods, such as CIBERSORT (87) or xCell (88).
As macIDR was capable of properly classifying differentially differentiated in vitro MDMs, we applied it to in vivo macrophages with the goal of extracting activation information. We observed differences in predictions, such as reduced signals of M-IFNγ and M-LPS+IFNγ and increased signals of M-IL4, M-IL10, and M-dex when comparing AMs from COPD patients with HCs. Moreover, we observed that the tissue of origin had a large impact on the macrophage classification with in vivo tissue-resident macrophages obtained from HCs not always being classified as M0 as was observed for the AMs. Since some in vivo macrophages obtained from healthy tissue were classified as in vitro activated MDMs, unstimulated in vitro MDMs (M0) likely do not reflect the basal state of all tissue-resident macrophages underpinning the importance of how multiple factors in the microenvironment shape the transcriptome. Our results suggest that for some in vitro models, using activated MDMs might achieve a more comparable phenotype to the in vivo tissue macrophages that express the tissue transcriptomic signatures.
Unlike the AMs, no transcriptomic data was available of SMs from healthy donors. We were therefore unable to conclude whether the M-IL10 and M-IFNγ predictions for the RA samples were tissue-specific or disease-associated. Though samples from different studies were classified as M-IL10 or M-IFNγ, these two activation states appeared to be the highest two predicted classes among all recruited datasets. Characterization studies on RA-SMs suggested that they represent multiple subpopulations, such as the CD163+ anti-inflammatory tissue-resident macrophages and the S100A8/9+ pro-inflammatory macrophages recruited from peripheral monocytes (89). As in vivo macrophages represent a more heterogeneous population, prediction of mixed cell clusters using macIDR will return signals from multiple different models. The classification could therefore reflect perturbations of the macrophage composition associated with disease states. Since scRNA-seq enables deconvolution of cellular identities, we reasoned that integrating macIDR with single-cell profiling would enhance the understanding of in vivo macrophage heterogeneity in diseases and improve the resolution of cellular clusters as classified functional groups. By applying macIDR to the macrophages observed in the RA synovial samples obtained through scRNA-seq we found that most macrophages were M-IL10-like. However, the predictions did not match with the observed macrophage sub clusters suggesting that while RA-SMs are composed of different macrophage subsets, they might not necessarily coincide with the eight in vitro models.
In conclusion, our work represents a practical and robust platform-independent approach to characterize and classify in vitro macrophages. We anticipate that our approach could be expanded to multiple cell types and states, not only for modeling the activation, but also for characterizing the functional cell groups in vivo. Altogether, we have established a consensus gene expression profile and built a classification model called macIDR that is capable of deconvoluting heterogeneous signals both in vitro and in vivo.
Data Availability Statement
The processed RNA-seq counts are available in the ArrayExpress repository E-MTAB-7572. The raw RNA-seq reads are available in the European Genome-phenome Archive under the accession number: EGAS00001003451 to protect the privacy of the individuals in accordance to Dutch privacy laws. All public datasets analyzed during the current study are available in the Gene Expression Omnibus, ArrayExpress, and dbGaP repositories. Studies from the GEO repository include: GSE18686, GSE19765, GSE30177, GSE47538, GSE5099, GSE57614, GSE61880, GSE79077, GSE85346, GSE99056, GSE100382, GSE55536, GSE80727, GSE82227, GSE99056, GSE75938, GSE46903, GSE93776, GSE10500, GSE49604, GSE97779, and GSE13896. Studies from the ArrayExpress repository include: E-MEXP-2032, E-MTAB-3309, E-MTAB-5095, E-MTAB-5913, and E-MEXP-3890. The macIDR package is stored in the GitHub repository at https://github.com/ND91/macIDR. The study from the dbGaP repository pertained phs001529.v1.p1. The scripts for performing the analyses are stored in the GitHub repository at https://github.com/ND91/PRJ0000004_MACMETA.
Author Contributions
H-JC performed the literature search. H-JC and GG cultured the cells, isolated the RNA for the RNA sequencing analysis. AL downloaded, cleaned and performed the in silico analyses of the public and in-house generated data. H-JC, AL, PH, and MW decided on the inclusion criteria for the public data. H-JC and AL drafted the manuscript. PH and MW conceived the study and participated together with EF, WJ, and MM in the design and coordination of the study. All authors read and approved the final manuscript.
Funding
This work was supported by the European Union (EU) Horizon 2020 program EPIMAC (SEP-210163258). MW was supported by The Netherlands Heart Foundation (CVON 2011/B019, CVON 2017-20), Spark-Holding BV (2015B002), Fondation Leducq (Transatlantic Network Grant No. 16CVD01), and the EU Horizon 2020 program REPROGRAM Grant No. 667837. GlaxoSmithKline provided support in the form of salary for AL. GlaxoSmithKline and Novartis provided support in the form of salary for EF. GlaxoSmithKline and Novartis had no additional role in the study design, data collection and analysis, decision to publish, or preparation of the manuscript. Funding for open access charge will be covered by Amsterdam University Medical Centers, University of Amsterdam.
Conflict of Interest
GlaxoSmithKline provided support in the form of salary for author AL. GlaxoSmithKline and Novartis provided support in the form of salary for author EF. GlaxoSmithKline and Novartis had no additional role in the study design, data collection and analysis, decision to publish, or preparation of the manuscript. Funding for open access charge will be covered by Amsterdam University Medical Centers, University of Amsterdam.
The remaining authors declare that the research was conducted in the absence of any commercial or financial relationships that could be construed as a potential conflict of interest.
Acknowledgments
We are thankful to all authors and participants of the studies included in this research for sharing their transcriptomic data. This study makes use of data generated by the Blueprint Consortium. A full list of the investigators who contributed to the generation of the data is available from www.blueprint-epigenome.eu. Funding for the project was provided by the European Union's Seventh Framework Programme (FP7/2007-2013) under grant agreement no 282510—BLUEPRINT. We thank the authors of Stephenson et al. (30), especially the staff at the New York Genome Center Technology/Innovation and the Satija Labs, for granting us access to their single-cell RNA sequencing data on rheumatoid arthritis synovial tissue samples. This manuscript has been released as a Pre-Print at https://www.biorxiv.org/content/10.1101/532986v1 (90).
Supplementary Material
The Supplementary Material for this article can be found online at: https://www.frontiersin.org/articles/10.3389/fimmu.2019.02887/full#supplementary-material
References
1. Wynn TA, Chawla A, Pollard JW. Macrophage biology in development, homeostasis and disease. Nature. (2013) 496:445–55. doi: 10.1038/nature12034
2. Murray PJ. Macrophage polarization. Annu Rev Physiol. (2017) 79:541–66. doi: 10.1146/annurev-physiol-022516-034339
3. Davis MM, Tato CM, Furman D. Systems immunology: just getting started. Nat Immunol. (2017) 18:725. doi: 10.1038/ni.3768
4. Xue J, Schmidt SV, Sander J, Draffehn A, Krebs W, Quester I, et al. Transcriptome-based network analysis reveals a spectrum model of human macrophage activation. Immunity. (2014) 40:274–88. doi: 10.1016/j.immuni.2014.01.006
5. Murray PJ, Allen JE, Biswas SK, Fisher EA, Gilroy DW, Goerdt S, et al. Macrophage activation and polarization: nomenclature and experimental guidelines. Immunity. (2014) 41:14–20. doi: 10.1016/j.immuni.2014.06.008
6. Fuentes-Duculan J, Suarez-Farinas M, Zaba LC, Nograles KE, Pierson KC, Mitsui H, et al. A subpopulation of CD163-positive macrophages is classically activated in psoriasis. J Invest Dermatol. (2010) 130:2412–22. doi: 10.1038/jid.2010.165
7. Schroder K, Irvine KM, Taylor MS, Bokil NJ, Le Cao K-A, Masterman K-A, et al. Conservation and divergence in Toll-like receptor 4-regulated gene expression in primary human versus mouse macrophages. Proc Natl Acad Sci USA. (2012) 109:E944–53. doi: 10.1073/pnas.1110156109
8. Tsang J, Chain BM, Miller RF, Webb BL, Barclay W, Towers GJ, et al. HIV-1 infection of macrophages is dependent on evasion of innate immune cellular activation. AIDS. (2009) 23:2255–63. doi: 10.1097/QAD.0b013e328331a4ce
9. Przybyl L, Haase N, Golic M, Rugor J, Solano ME, Arck PC, et al. CD74-downregulation of placental macrophage-trophoblastic interactions in preeclampsia. Circ Res. (2016) 119:55–68. doi: 10.1161/CIRCRESAHA.116.308304
10. Byng-Maddick R, Turner CT, Pollara G, Ellis M, Guppy NJ, Bell LCK, et al. Tumor Necrosis Factor (TNF) bioactivity at the site of an acute cell-mediated immune response is preserved in rheumatoid arthritis patients responding to anti-TNF therapy. Front Immunol. (2017) 8:932. doi: 10.3389/fimmu.2017.00932
11. Surdziel E, Clay I, Nigsch F, Thiemeyer A, Allard C, Hoffman G, et al. Multidimensional pooled shRNA screens in human THP-1 cells identify candidate modulators of macrophage polarization. PLoS ONE. (2017) 12:e0183679. doi: 10.1371/journal.pone.0183679
12. Park SH, Kang K, Giannopoulou E, Qiao Y, Kang K, Kim G, et al. Type I interferons and the cytokine TNF cooperatively reprogram the macrophage epigenome to promote inflammatory activation. Nat Immunol. (2017) 18:1104–16. doi: 10.1038/ni.3818
13. Zhang H, Xue C, Shah R, Bermingham K, Hinkle CC, Li W, et al. Functional analysis and transcriptomic profiling of iPSC-derived macrophages and their application in modeling Mendelian disease. Circ Res. (2015) 117:17–28. doi: 10.1161/CIRCRESAHA.117.305860
14. Martins AJ, Narayanan M, Prustel T, Fixsen B, Park K, Gottschalk RA, et al. Environment tunes propagation of cell-to-cell variation in the human macrophage gene network. Cell Syst. (2017) 4:379–92 e12. doi: 10.1016/j.cels.2017.03.002
15. Realegeno S, Kelly-Scumpia KM, Dang AT, Lu J, Teles R, Liu PT, et al. S100A12 is part of the antimicrobial network against mycobacterium leprae in human macrophages. PLoS Pathog. (2016) 12:e1005705. doi: 10.1371/journal.ppat.1005705
16. Benoit ME, Clarke EV, Morgado P, Fraser DA, Tenner AJ. Complement protein C1q directs macrophage polarization and limits inflammasome activity during the uptake of apoptotic cells. J Immunol. (2012) 188:5682–93. doi: 10.4049/jimmunol.1103760
17. Chandriani S, DePianto DJ, N'Diaye EN, Abbas AR, Jackman J, Bevers J III, et al. Endogenously expressed IL-13Rα2 attenuates IL-13-mediated responses but does not activate signaling in human lung fibroblasts. J Immunol. (2014) 193:111–9. doi: 10.4049/jimmunol.1301761
18. Martinez FO, Gordon S, Locati M, Mantovani A. Transcriptional profiling of the human monocyte-to-macrophage differentiation and polarization: new molecules and patterns of gene expression. J Immunol. (2006) 177:7303–11. doi: 10.4049/jimmunol.177.10.7303
19. Derlindati E, Dei Cas A, Montanini B, Spigoni V, Curella V, Aldigeri R, et al. Transcriptomic analysis of human polarized macrophages: more than one role of alternative activation? PLoS ONE. (2015) 10:e0119751. doi: 10.1371/journal.pone.0119751
20. Jubb AW, Young RS, Hume DA, Bickmore WA. Enhancer turnover is associated with a divergent transcriptional response to glucocorticoid in mouse and human macrophages. J Immunol. (2016) 196:813–22. doi: 10.4049/jimmunol.1502009
21. Steiger J, Stephan A, Inkeles MS, Realegeno S, Bruns H, Kroll P, et al. Imatinib triggers phagolysosome acidification and antimicrobial activity against Mycobacterium bovis bacille calmette-guerin in glucocorticoid-treated human macrophages. J Immunol. (2016) 197:222–32. doi: 10.4049/jimmunol.1502407
22. Fujiwara Y, Hizukuri Y, Yamashiro K, Makita N, Ohnishi K, Takeya M, et al. Guanylate-binding protein 5 is a marker of interferon-gamma-induced classically activated macrophages. Clin Transl Immunol. (2016) 5:e111. doi: 10.1038/cti.2016.59
23. Riera-Borrull M, Cuevas VD, Alonso B, Vega MA, Joven J, Izquierdo E, et al. Palmitate conditions macrophages for enhanced responses toward inflammatory stimuli via JNK activation. J Immunol. (2017) 199:3858–69. doi: 10.4049/jimmunol.1700845
24. Vento-Tormo R, Company C, Rodriguez-Ubreva J, de la Rica L, Urquiza JM, Javierre BM, et al. IL-4 orchestrates STAT6-mediated DNA demethylation leading to dendritic cell differentiation. Genome Biol. (2016) 17:4. doi: 10.1186/s13059-015-0863-2
25. Tasaki S, Suzuki K, Kassai Y, Takeshita M, Murota A, Kondo Y, et al. Multi-omics monitoring of drug response in rheumatoid arthritis in pursuit of molecular remission. Nat Commun. (2018) 9:2755. doi: 10.1038/s41467-018-05044-4
26. Yarilina A, Park-Min KH, Antoniv T, Hu X, Ivashkiv LB. TNF activates an IRF1-dependent autocrine loop leading to sustained expression of chemokines and STAT1-dependent type I interferon-response genes. Nat Immunol. (2008) 9:378–87. doi: 10.1038/ni1576
27. You S, Yoo SA, Choi S, Kim JY, Park SJ, Ji JD, et al. Identification of key regulators for the migration and invasion of rheumatoid synoviocytes through a systems approach. Proc Natl Acad Sci USA. (2014) 111:550–5. doi: 10.1073/pnas.1311239111
28. Kang K, Park SH, Chen J, Qiao Y, Giannopoulou E, Berg K, et al. Interferon-γ represses M2 gene expression in human macrophages by disassembling enhancers bound by the transcription factor MAF. Immunity. (2017) 47:235–50 e4. doi: 10.1016/j.immuni.2017.07.017
29. Asquith DL, Ballantine LE, Nijjar JS, Makdasy MK, Patel S, Wright PB, et al. The liver X receptor pathway is highly upregulated in rheumatoid arthritis synovial macrophages and potentiates TLR-driven cytokine release. Ann Rheum Dis. (2013) 72:2024–31. doi: 10.1136/annrheumdis-2012-202872
30. Stephenson W, Donlin LT, Butler A, Rozo C, Bracken B, Rashidfarrokhi A, et al. Single-cell RNA-seq of rheumatoid arthritis synovial tissue using low-cost microfluidic instrumentation. Nat Commun. (2018) 9:791. doi: 10.1038/s41467-017-02659-x
31. Shaykhiev R, Krause A, Salit J, Strulovici-Barel Y, Harvey BG, O'Connor TP, et al. Smoking-dependent reprogramming of alveolar macrophage polarization: implication for pathogenesis of chronic obstructive pulmonary disease. J Immunol. (2009) 183:2867–83. doi: 10.4049/jimmunol.0900473
32. Woodruff PG, Koth LL, Yang YH, Rodriguez MW, Favoreto S, Dolganov GM, et al. A distinctive alveolar macrophage activation state induced by cigarette smoking. Am J Respir Crit Care Med. (2005) 172:1383–92. doi: 10.1164/rccm.200505-686OC
33. Madore AM, Perron S, Turmel V, Laviolette M, Bissonnette EY, Laprise C. Alveolar macrophages in allergic asthma: an expression signature characterized by heat shock protein pathways. Hum Immunol. (2010) 71:144–50. doi: 10.1016/j.humimm.2009.11.005
34. Goleva E, Hauk PJ, Hall CF, Liu AH, Riches DW, Martin RJ, et al. Corticosteroid-resistant asthma is associated with classical antimicrobial activation of airway macrophages. J Allergy Clin Immunol. (2008) 122:550–9 e3. doi: 10.1016/j.jaci.2008.07.007
35. Dalmas E, Venteclef N, Caer C, Poitou C, Cremer I, Aron-Wisnewsky J, et al. T cell-derived IL-22 amplifies IL-1beta-driven inflammation in human adipose tissue: relevance to obesity and type 2 diabetes. Diabetes. (2014) 63:1966–77. doi: 10.2337/db13-1511
36. Choi JK, Yu U, Kim S, Yoo OJ. Combining multiple microarray studies and modeling interstudy variation. Bioinformatics. (2003) 19:i84–90. doi: 10.1093/bioinformatics/btg1010
37. Barrett T, Wilhite SE, Ledoux P, Evangelista C, Kim IF, Tomashevsky M, et al. NCBI GEO: archive for functional genomics data sets–update. Nucleic Acids Res. (2013) 41:D991–5. doi: 10.1093/nar/gks1193
38. Kolesnikov N, Hastings E, Keays M, Melnichuk O, Tang YA, Williams E, et al. ArrayExpress update–simplifying data submissions. Nucleic Acids Res. (2015) 43:D1113–6. doi: 10.1093/nar/gku1057
39. R Development Core Team. R: A Language and Environment for Statistical Computing. Vienna: R Foundation for Statistical Computing (2008). Available onlne at: http://www.r-project.org/
40. Davis S, Meltzer PS. GEOquery: a bridge between the Gene Expression Omnibus (GEO) and BioConductor. Bioinformatics. (2007) 23:1846–7. doi: 10.1093/bioinformatics/btm254
41. Kauffmann A, Rayner TF, Parkinson H, Kapushesky M, Lukk M, Brazma A, et al. Importing ArrayExpress datasets into R/Bioconductor. Bioinformatics. (2009) 25:2092–4. doi: 10.1093/bioinformatics/btp354
42. Gautier L, Cope L, Bolstad BM, Irizarry RA. affy–analysis of Affymetrix GeneChip data at the probe level. Bioinformatics. (2004) 20:307–15. doi: 10.1093/bioinformatics/btg405
43. Carvalho BS, Irizarry RA. A framework for oligonucleotide microarray preprocessing. Bioinformatics. (2010) 26:2363–7. doi: 10.1093/bioinformatics/btq431
44. Ritchie ME, Phipson B, Wu D, Hu Y, Law CW, Shi W, et al. limma powers differential expression analyses for RNA-sequencing and microarray studies. Nucleic Acids Res. (2015) 43:e47. doi: 10.1093/nar/gkv007
45. Langfelder P, Horvath S. WGCNA: an R package for weighted correlation network analysis. BMC Bioinformatics. (2008) 9:559. doi: 10.1186/1471-2105-9-559
46. Kauffmann A, Gentleman R, Huber W. arrayQualityMetrics–a bioconductor package for quality assessment of microarray data. Bioinformatics. (2009) 25:415–6. doi: 10.1093/bioinformatics/btn647
47. Leinonen R, Sugawara H, Shumway M International nucleotide sequence database C. the sequence read archive. Nucleic Acids Res. (2011) 39:D19–21. doi: 10.1093/nar/gkq1019
48. Andrews S. FastQC: A Quality Control Tool for High Throughput Sequence Data. Available online at: http://www.bioinformatics.babraham.ac.uk/projects/fastqc
49. Ewels P, Magnusson M, Lundin S, Kaller M. MultiQC: summarize analysis results for multiple tools and samples in a single report. Bioinformatics. (2016) 32:3047–8. doi: 10.1093/bioinformatics/btw354
50. Dobin A, Davis CA, Schlesinger F, Drenkow J, Zaleski C, Jha S, et al. STAR: ultrafast universal RNA-seq aligner. Bioinformatics. (2013) 29:15–21. doi: 10.1093/bioinformatics/bts635
51. Li H, Handsaker B, Wysoker A, Fennell T, Ruan J, Homer N, et al. The sequence Alignment/Map format and SAMtools. Bioinformatics. (2009) 25:2078–9. doi: 10.1093/bioinformatics/btp352
52. Liao Y, Smyth GK, Shi W. featureCounts: an efficient general purpose program for assigning sequence reads to genomic features. Bioinformatics. (2014) 30:923–30. doi: 10.1201/b16589
53. Durinck S, Moreau Y, Kasprzyk A, Davis S, De Moor B, Brazma A, et al. BioMart and Bioconductor: a powerful link between biological databases and microarray data analysis. Bioinformatics. (2005) 21:3439–40. doi: 10.1093/bioinformatics/bti525
54. Butler A, Hoffman P, Smibert P, Papalexi E, Satija R. Integrating single-cell transcriptomic data across different conditions, technologies, and species. Nat Biotechnol. (2018) 36:411–20. doi: 10.1038/nbt.4096
55. Lusa L, Gentleman R, Ruschhaupt M. $$GeneMeta: MetaAnalysis for High Throughput Experiments. (2018)
56. Kaufman S, Rosset S, Perlich C. Leakage in Data Mining: Formulation, Detection, and Avoidance. San Diego, CA: ACM (2011). doi: 10.1145/2020408.2020496
57. Zou H, Hastie T. Regression and variable selection via the elastic net. J R Stat Soc Ser B. (2005) 67:301–20. doi: 10.1111/j.1467-9868.2005.00503.x
58. Meinshausen N, Bühlmann P. Stability selection. J R Stat Soc Ser B Stat Methodol. (2010) 72:417–73. doi: 10.1111/j.1467-9868.2010.00740.x
59. Kramer A, Green J, Pollard J Jr, Tugendreich S, Krämer A, Green J, et al. Causal analysis approaches in ingenuity pathway analysis. Bioinformatics. (2014) 30:523–30. doi: 10.1093/bioinformatics/btt703
60. Zhou Y, Zhou B, Pache L, Chang M, Khodabakhshi AH, Tanaseichuk O, et al. Metascape provides a biologist-oriented resource for the analysis of systems-level datasets. Nat Commun. (2019) 10:1523. doi: 10.1038/s41467-019-09234-6
61. Szklarczyk D, Gable AL, Lyon D, Junge A, Wyder S, Huerta-Cepas J, et al. STRING v11: protein-protein association networks with increased coverage, supporting functional discovery in genome-wide experimental datasets. Nucleic Acids Res. (2019) 47:D607–13. doi: 10.1093/nar/gky1131
62. Martinez FO, Gordon S. The M1 and M2 paradigm of macrophage activation: time for reassessment. F1000Prime Rep. (2014) 6:13. doi: 10.12703/P6-13
63. Georgoudaki A-MM, Prokopec KEE, Boura VFF, Hellqvist E, Sohn S, Ostling J, et al. Reprogramming tumor-associated macrophages by antibody targeting inhibits cancer progression and metastasis. Cell Rep. (2016) 15:2000–11. doi: 10.1016/j.celrep.2016.04.084
64. Sanyal R, Polyak MJ, Zuccolo J, Puri M, Deng L, Roberts L, et al. MS4A4A: a novel cell surface marker for M2 macrophages and plasma cells. Immunol Cell Biol. (2017) 95:611–19. doi: 10.1038/icb.2017.18
65. Li J, Diao B, Guo S, Huang X, Yang C, Feng Z, et al. VSIG4 inhibits proinflammatory macrophage activation by reprogramming mitochondrial pyruvate metabolism. Nat Commun. (2017) 8:1322. doi: 10.1038/s41467-017-01327-4
66. Wu C, Jin X, Tsueng G, Afrasiabi C, Su AI. BioGPS: building your own mash-up of gene annotations and expression profiles. Nucleic Acids Res. (2016) 44:D313–6. doi: 10.1093/nar/gkv1104
67. Palecanda A, Paulauskis J, Al-Mutairi E, Imrich A, Qin G, Suzuki H, et al. Role of the scavenger receptor MARCO in alveolar macrophage binding of unopsonized environmental particles. J Exp Med. (1999) 189:1497–506. doi: 10.1084/jem.189.9.1497
68. Arredouani M, Yang Z, Ning Y, Qin G, Soininen R, Tryggvason K, et al. The scavenger receptor MARCO is required for lung defense against pneumococcal pneumonia and inhaled particles. J Exp Med. (2004) 200:267–72. doi: 10.1084/jem.20040731
69. Li JJ, Wang W, Baines KJ, Bowden NA, Hansbro PM, Gibson PG, et al. IL-27/IFN-gamma induce MyD88-dependent steroid-resistant airway hyperresponsiveness by inhibiting glucocorticoid signaling in macrophages. J Immunol. (2010) 185:4401–9. doi: 10.4049/jimmunol.1001039
70. Chambers ES, Nanzer AM, Pfeffer PE, Richards DF, Timms PM, Martineau AR, et al. Distinct endotypes of steroid-resistant asthma characterized by IL-17A(high) and IFN-gamma(high) immunophenotypes: Potential benefits of calcitriol. J Allergy Clin Immunol. (2015) 136:628–37 e4. doi: 10.1016/j.jaci.2015.01.026
71. Pirzgalska RM, Seixas E, Seidman JS, Link VM, Sanchez NM, Mahu I, et al. Sympathetic neuron-associated macrophages contribute to obesity by importing and metabolizing norepinephrine. Nat Med. (2017) 23:1309–18. doi: 10.1038/nm.4422
72. Eriksson Hogling D, Petrus P, Gao H, Backdahl J, Dahlman I, Laurencikiene J, et al. adipose and circulating CCL18 levels associate with metabolic risk factors in women. J Clin Endocrinol Metab. (2016) 101:4021–29. doi: 10.1210/jc.2016-2390
73. Hardy OT, Perugini RA, Nicoloro SM, Gallagher-Dorval K, Puri V, Straubhaar J, et al. Body mass index-independent inflammation in omental adipose tissue associated with insulin resistance in morbid obesity. Surg Obes Relat Dis. (2011) 7:60–7. doi: 10.1016/j.soard.2010.05.013
74. Wentworth JM, Naselli G, Brown WA, Doyle L, Phipson B, Smyth GK, et al. Pro-inflammatory CD11c+CD206+ adipose tissue macrophages are associated with insulin resistance in human obesity. Diabetes. (2010) 59:1648–56. doi: 10.2337/db09-0287
75. Morris DL, Singer K, Lumeng CN. Adipose tissue macrophages: phenotypic plasticity and diversity in lean and obese states. Curr Opin Clin Nutr Metab Care. (2011) 14:341–6. doi: 10.1097/MCO.0b013e328347970b
76. Schmuck K, Ullmer C, Engels P, Lubbert H. Cloning and functional characterization of the human 5-HT2B serotonin receptor. FEBS Lett. (1994) 342:85–90. doi: 10.1016/0014-5793(94)80590-3
77. Ruschpler P, Lorenz P, Eichler W, Koczan D, Hänel C, Scholz R, et al. High CXCR3 expression in synovial mast cells associated with CXCL9 and CXCL10 expression in inflammatory synovial tissues of patients with rheumatoid arthritis. Arthritis Res Ther. (2003) 5:R241–52. doi: 10.1186/ar783
78. Patel DD, Zachariah JP, Whichard LP. CXCR3 and CCR5 ligands in rheumatoid arthritis synovium. Clin Immunol. (2001) 98:39–45. doi: 10.1006/clim.2000.4957
79. Seta N, Granfors K, Sahly H, Kuipers JG, Song YW, Baeten D, et al. Expression of host defense scavenger receptors in spondylarthropathy. Arthritis Rheum. (2001) 44:931–9. doi: 10.1002/1529-0131(200104)44:4<931::AID-ANR150>3.0.CO;2-T
80. Liu J, Ren Y, Kang L, Zhang L. Overexpression of CCN3 inhibits inflammation and progression of atherosclerosis in apolipoprotein E-deficient mice. PLoS ONE. (2014) 9:e94912. doi: 10.1371/journal.pone.0094912
81. Shi H, Zhang C, Pasupuleti V, Hu X, Prosdocimo DA, Wu W, et al. CCN3 regulates macrophage foam cell formation and atherosclerosis. Am J Pathol. (2017) 187:1230–7. doi: 10.1016/j.ajpath.2017.01.020
82. Li H, Sun B. Toll-like receptor 4 in atherosclerosis. J Cell Mol Med. (2007) 11:88–95. doi: 10.1111/j.1582-4934.2007.00011.x
83. Zhang DE, Hetherington CJ, Chen HM, Tenen DG. The macrophage transcription factor PU.1 directs tissue-specific expression of the macrophage colony-stimulating factor receptor. Mol Cell Biol. (1994) 14:373–81. doi: 10.1128/MCB.14.1.373
84. Ceppi M, Clavarino G, Gatti E, Schmidt EK, de Gassart A, Blankenship D, et al. Ribosomal protein mRNAs are translationally-regulated during human dendritic cells activation by LPS. Immunome Res. (2009) 5:5. doi: 10.1186/1745-7580-5-5
85. Finocchiaro LM, Arzt ES, Fernandez-Castelo S, Criscuolo M, Finkielman S, Nahmod VE. Serotonin and melatonin synthesis in peripheral blood mononuclear cells: stimulation by interferon-gamma as part of an immunomodulatory pathway. J Interferon Res. (1988) 8:705–16. doi: 10.1089/jir.1988.8.705
86. Herr N, Bode C, Duerschmied D. The effects of serotonin in immune cells. Front Cardiovasc Med. (2017) 4:48. doi: 10.3389/fcvm.2017.00048
87. Newman AM, Liu CL, Green MR, Gentles AJ, Feng W, Xu Y, et al. Robust enumeration of cell subsets from tissue expression profiles. Nat Methods. (2015) 12:453–7. doi: 10.1038/nmeth.3337
88. Aran D, Hu Z, Butte AJ. xCell: digitally portraying the tissue cellular heterogeneity landscape. Genome Biol. (2017) 18:220. doi: 10.1186/s13059-017-1349-1
89. Kurowska-Stolarska M, Alivernini S. Synovial tissue macrophages: friend or foe? RMD Open. (2017) 3:e000527. doi: 10.1136/rmdopen-2017-000527
Keywords: meta-analysis, elastic net classification, macrophages, alveolar macrophages (AMs), synovial macrophages (SMs), adipose tissue macrophages (ATMs), macrophage identifier (macIDR)
Citation: Chen H-J, Li Yim AYF, Griffith GR, de Jonge WJ, Mannens MMAM, Ferrero E, Henneman P and de Winther MPJ (2019) Meta-Analysis of in vitro-Differentiated Macrophages Identifies Transcriptomic Signatures That Classify Disease Macrophages in vivo. Front. Immunol. 10:2887. doi: 10.3389/fimmu.2019.02887
Received: 15 July 2019; Accepted: 25 November 2019;
Published: 11 December 2019.
Edited by:
Claudia Monaco, University of Oxford, United KingdomReviewed by:
Peter C. Cook, University of Manchester, United KingdomJo A. Van Ginderachter, Vrije University Brussel, Belgium
Copyright © 2019 Chen, Li Yim, Griffith, de Jonge, Mannens, Ferrero, Henneman and de Winther. This is an open-access article distributed under the terms of the Creative Commons Attribution License (CC BY). The use, distribution or reproduction in other forums is permitted, provided the original author(s) and the copyright owner(s) are credited and that the original publication in this journal is cited, in accordance with accepted academic practice. No use, distribution or reproduction is permitted which does not comply with these terms.
*Correspondence: Menno P. J. de Winther, bS5kZXdpbnRoZXImI3gwMDA0MDthbXN0ZXJkYW11bWMubmw=
†These authors have contributed equally to this work
‡These authors share senior authorship
§Present address: Enrico Ferrero, Autoimmunity Transplantation and Inflammation Bioinformatics, Novartis Institutes for BioMedical Research, Basel, Switzerland