 Olga Gruzdeva1,2
 Evgenya Uchasova1*
 Yulia Dyleva1
 Daria Borodkina3Olga Akbasheva4Larisa Antonova1Vera Matveeva1Ekaterina Belik1Sergei Ivanov1Anton Sotnikov1Kirill Kozyrin1Natalia Brel1
 Maxim Sinitsky1Victoria Karetnikova1,2
 Alexander Kokov1Evgenya Bychkova2Tamara Pecherina1Olga Barbarash1,2
- 1Federal State Budgetary Institution, Research Institute for Complex Issues of Cardiovascular Diseases, Kemerovo, Russia
- 2Federal State Budget Educational Institution of Higher Education, Kemerovo State Medical University of the Ministry of Healthcare of the Russian Federation, Kemerovo, Russia
- 3Regional Center for Diabetes, Autonomous Public Healthcare Institution of the Kemrovo Region, Kemerovo Regional Clinical Hospital Named After S.V. Beliyaev, Kemerovo, Russia
- 4Federal State Budget Educational Institution of Higher Education, Siberian State Medical University of the Ministry of Healthcare of the Russian Federation, Tomsk, Russia
This study aimed to investigate the adipokine and cytokine profiles of adipocytes from epicardial and subcutaneous adipose tissues in interconnection with the visceral adipose tissue area and the biochemical and clinical characteristics of patients with coronary artery disease. We assessed 84 patients with coronary artery disease (65 men, 19 women) and divided them into two groups based on the presence of visceral obesity. We sampled epicardial and subcutaneous adipose tissues from the patients with visceral obesity. We then cultured the adipocytes and evaluated their adipokine profiles and pro-inflammatory activity. Results show that the mRNA expression of adiponectin in cultures of epicardial adipocytes from patients with and without visceral obesity was lower than that in subcutaneous adipocytes. Moreover, adiponectin mRNA expression in cultures of subcutaneous and epicardial adipocytes from patients with visceral obesity was lower than that in patients without obesity. For leptin, the reverse pattern was observed, with expression higher in cultures of epicardial adipocytes than in subcutaneous adipocytes and higher in epicardial adipocytes from patients with visceral obesity than in those from subjects without visceral obesity. In addition, in epicardial adipocytes, increased expression of proinflammatory cytokine genes (IL6, TNF) was observed compared with that in subcutaneous adipocytes. In contrast, expression of IL10 was higher in cultures of subcutaneous adipocytes than in epicardial adipocytes. The epicardial adipose tissue area was associated with the presence of higher levels of leptin and TNF-α within adipocytes and serum, increased lipid and carbohydrate metabolism. Coronary artery disease, in the context of the status of epicardial adipocytes, can be characterized as “metabolic inflammation,” suggesting the direct involvement of adipocytes in pathogenesis through the development of adipokine imbalances and activation of proinflammatory processes.
Introduction
Cardiovascular disease (CVD) is the leading cause of disability and mortality worldwide (1). In 2013, more than 17.3 million people died from CVD, an increase of 40.8% from 1990 (2). This increase was driven by a change in the number of deaths attributed to the aging population and the negative impact of cardiovascular risk factors, including obesity (3). Total body fat comprises accumulated fat in both the subcutaneous and visceral depots (4). Visceral adipose tissue (VAT) surrounds the internal organs and is associated with cardiometabolic risk factors, regardless of the total fat mass (5, 6).
Previous publications have highlighted associations between ectopic fat deposits and cardiometabolic risks for and clinical manifestations of CVD (7). Epicardial adipose tissue (EAT) is visceral fat deposited around the heart, particularly around epicardial coronary vessels. Because of its proximity to the myocardium and the absence of fascia, epicardial fat may directly affect the coronary arteries and myocardium (8). Several studies have shown that excessive amounts of EAT are accompanied by a reduction in adiponectin synthesis, myocardial hypertrophy, fibrosis, and the apoptosis of cardiomyocytes, leading to ventricular arrhythmias (9). However, epicardial adipocytes under physiological conditions have specific cardioprotective functions that include absorbing excess free fatty acids (FFAs), acting as a source of energy during ischaemia, and synthesizing adiponectin and adrenomedullin, both of which have cardioprotective effects (10). In addition, there is evidence of differences in the expression of the adipokine, leptin, and cytokine genes at the mRNA level in epicardial and subcutaneous adipose tissue (SAT) (11–13).
The present study aimed to investigate the adipokine and cytokine profiles of adipocytes from the EAT and SAT and in the serum, as well as to determine their relationships with the visceral fat area and the biochemical and clinical parameters of patients with coronary artery disease (CAD).
Materials and Methods
Ethical Considerations
The study protocol was approved by the Local Ethics Committee of the Federal State Budgetary Institution Research Institute for Complex Issues of Cardiovascular Diseases and was developed in accordance with the WMA Declaration of Helsinki on Ethical Principles for Medical Research Involving Human Subjects, 2000 edition, and the GCP Principles in the Russian Federation approved by the Russian Ministry of Health (2003). All patients provided written informed consent.
Study Subjects
Eighty-four patients with CAD, including 65 men and 19 women with a mean age of 61.9 years (range: 53.7–68.5 years) were included in the study (all women were postmenopausal), who underwent coronary artery bypass grafting. Diagnosis of CAD was achieved according to the criteria of the All-Russian Scientific Society of Cardiology (2007) and the European Cardiology Society (2013). Blood samples were taken from patients with and without VO for assessment of serum levels of adipokines, cytokines, and regulators of lipid and carbohydrate metabolism. All patients were administered standard antianginal and antiplatelet therapies.
The control group comprised 30 male patients who did not have CVD and whose mean age was 58.42 years (range: 52.2–71.1 years). The ages of the patients in the control group were comparable with those in the study group (p = 0.64).
Imaging Assessments
Multi-spiral computed tomography (MSCT) was performed on a Siemens Somatom 64 computed tomography scanner (Siemens Healthcare, Erlangen, Germany) for measurement of the visceral fat area and subcutaneous fat area to confirm the presence of visceral obesity (VO). A visceral fat area >130 cm2 and a VAT-to-SAT ratio at the level of the umbilicus of ≥0.4 were used as diagnostic cut-off values for VO (14) (Figure 1). Of the 84 patients, 54 had VO.
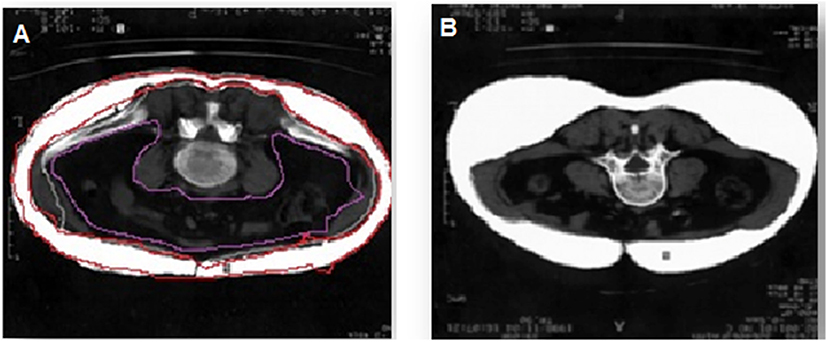
Figure 1. Diagnosis of visceral obesity via multi-spiral computed tomography. (A) Patient with obesity, (B) patient without obesity.
Determination of the thickness of EAT was performed by magnetic resonance imaging (MRI) on an Exelart Atlas 1.5-T MR imager (Toshiba, Tokyo, Japan). Measurements were carried out on images oriented along the short axis of the heart. EAT thickness was measured at three points along the anterior wall of the right ventricle, and the average value was then calculated (Figure 2).
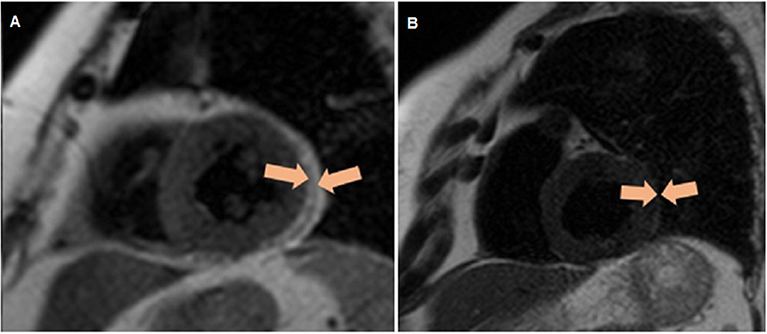
Figure 2. Quantitative assessment of the thickness of epicardial adipose tissue along the anterior wall of the right ventricle, as well as the thickness of the epicardial adipose tissue (orange contour) along the posterior wall of the left ventricle via magnetic resonance imaging. (A) Patient without obesity, (B) patient with obesity.
The body weight in kilograms, height in meters, waist circumference (WC) in centimeters, and hip circumference (HC) in centimeters were measured in each subject, and the waist-to-hip ratio (WHR) and body mass index (BMI) in kilograms per square meter were calculated.
Adipocyte Extraction and Culture
From each patient, 3–5 g of SAT and EAT biopsies were collected during coronary artery bypass surgery for isolation of adipocytes from freshly harvested tissues. EAT samples were obtained from fat depots located mainly around the right heart chambers, and SAT samples were obtained from the subcutaneous tissue in the region of the inferior mediastinum. The adipose tissue samples were placed in Hanks' Balanced Salt Solution (Merck KGaA, St. Louis, MO, USA) containing penicillin (100 U/L), streptomycin (100 mg/mL), and gentamicin (50 μg/mL). Adipocytes were isolated from adipose tissues under sterile conditions in a laminar flow hood (BOV-001-AMS MZMO, Millerovo, Russia) using the protocol developed by Carswell et al. (15). Adipose tissue samples (1–2 mm3) were incubated in a collagenase solution (0.5 mg/mL) (Thermo Fisher Scientific, Waltham, MA, USA) containing 200 nM adenosine (Merck KGaA) in a water bath at 37°C for 30 min. Then, the adipocytes were poured through a Falcon™ 100-μm sterile mesh (Thermo Fisher Scientific) and washed with Gibco® M199 culture medium (Thermo Fisher Scientific) containing 1% 4-(2-hydroxyethyl)-1-piperazineethanesulfonic acid buffer (Thermo Fisher Scientific), 1% l-glutamine with penicillin and streptomycin (Thermo Fisher Scientific), 0.4% amphotericin B (Thermo Fisher Scientific), and glucose at a final concentration of 5 mmol/L, supplemented with 10% fetal bovine serum (Thermo Fisher Scientific). The volume of the liquid containing the cells was adjusted to 5 mL, and the cells were centrifuged for 2 min at 200 × g. Isolated adipocytes were placed in a separate tube, and the volume was adjusted to 1 mL with culture medium. Adipocytes were counted in a Goryaev's chamber, and cell viability was evaluated as described previously (16). Adipocytes (20 × 105) were seeded into a 24-well-plate (Greiner Bio One International GmbH, Kremsmünster, Austria), and the volume in each well was adjusted to 1 mL with culture medium. Incubated for 24 h at a temperature of (37 ± 1) °C in an atmosphere of 5% CO2 and 10% oxygen. After 24 h, adipokine and cytokine profiles were analyzed.
RNA Extraction
Before RNA extraction, all work surfaces and laboratory equipment were treated with RNaseZap™ RNase Decontamination Solution (Invitrogen, Carlsbad, CA, USA). Total RNA purification from isolated adipocytes was performed using the commercial RNeasy® Plus Universal Mini Kit (Qiagen, Hilden, Germany) according to the manufacturer's protocol with some modifications described previously (17). Briefly, not more than 5 × 10⁵ cells were washed with phosphate-buffered saline (PBS) and homogenized with 750 μL of QIAzol™ Lysis Reagent (Qiagen). Homogenate was centrifuged at 12,000 × g for 10 min at 4°C. The upper fat monolayer was completely discarded and 75 μL of gDNA Eliminator Solution (Qiagen) and 150 μL of chloroform were added to each tube; the samples were then centrifuged at 12,000 × g for 30 min at 4°C. The clean upper aqueous phase was transferred into new tube, admixed with 1.5 volumes of 95% ethanol, and processed for binding, washing, and elution of total RNA according to the protocol. Extracted RNA was stored at −70°C.
The quantity and quality of purified RNA were assessed using a NanoDrop 2000 Spectrophotometer (Thermo Fisher Scientific) by measuring the light absorbance at 280 nm, 260 nm, and 230 nm and calculating the 260/280 (A260/280) and 260/230 (A260/230) ratios. The integrity of the RNA was determined by electrophoresis in agarose gel, followed by visualization using the Gel Doc™ XR+ System (Bio-Rad, Hercules, CA, USA).
cDNA Synthesis
Single-stranded cDNA was synthesized using the High-Capacity cDNA Reverse Transcription Kit (Applied Biosystems, Foster City, CA, USA) on a Veriti™ 96-Well Thermal Cycler (Applied Biosystems). Each 20-μL reverse transcription mix contained 2 μL of RT buffer, 0.8 μL of 100 nM dNTP mix, 2 μL of random primers, 1 μL of reverse transcriptase, 1 μL of RNase inhibitor, 3.2 μL of nuclease-free water, and 10 μL of RNA template (50 ng of RNA + nuclease-free water). Reverse transcription was performed using the program suggested by the kit's manufacturer.
The quantity and quality of synthesized cDNA were assessed using a NanoDrop 2000 Spectrophotometer. Samples were stored at −20°C.
Gene Expression Analysis
Expression of the adiponectin, leptin and cytokines IL6, TNF, IL10 genes was evaluated by quantitative real-time polymerase chain reaction (qPCR) using TaqMan™ Gene Expression Assays (Applied Biosystems) on a ViiA 7 Real-Time PCR System (Applied Biosystems). Each 20-μL reaction mix contained 10 μL of TaqMan™ Gene Expression Master Mix (Applied Biosystems), 1 μL of TaqMan™ Gene Expression Assay (Applied Biosystems), and 9 μL of cDNA template (100 ng of cDNA + nuclease-free water) and was amplified under the following thermal cycling conditions: 2 min at 50°C, 10 min at 95°C, and 40 cycles of 15 s at 95°C and 1 min at 60°C. As a negative control, we used 20 μL of reaction mix with no cDNA template. For each sample and negative control, three technical replicates were prepared.
Normalization of the PCR results was carried out using three reference genes, ACTB, GAPDH, and HPRT1, in accordance with currently accepted recommendations (18). To assess the effectiveness of PCR, amplification graphs and standard curves were analyzed using QuantStudio™ Real-Time PCR Software v.1.3 (Applied Biosystems). The expression of the studied genes (normalized quantification ratio, NRQ) was calculated by the Pfaffl method and is represented on a logarithmic (log10) scale as the fold change compared to that in control samples. Gene expression experiments were performed in accordance with MIQE Guidelines (19, 20).
Laboratory Assays
Levels of leptin and adiponectin in the culture medium from EAT and SAT adipocytes and in serum samples were measured using commercially available enzyme immunoassay kits (R&D Systems, Minneapolis, MN, USA) according to manufacturer's instructions. Each sample was tested twice, and intra-assay coefficients of variation (CVs) averaged 5.8%, with all standard curve correlation coefficients >0.998. The levels of interleukin (IL)-6, IL-10, and tumor necrosis factor-α (TNF-α) in the culture medium from EAT and SAT adipocytes and in serum samples were measured using commercially available enzyme-linked immunosorbent assays (ELISAs) (Bender MedSystems GmbH, Vienna, Austria) (CV: 7.03–8.99%).
Serum total cholesterol (TC), triglyceride (TG), very low-density lipoprotein cholesterol (VLDL-C), low-density lipoprotein cholesterol (LDL-C), high-density lipoprotein cholesterol (HDL-C), apolipoprotein (Apo)-A1, Apo-B, FFA, glucose, and glycated hemoglobin (HbA1c) levels were measured using enzymatic methods with end points on an automatic biochemical analyser (Konelab 30i; Thermo Fisher Scientific). Serum insulin and C-reactive peptide levels were measured using commercially available ELISA kits (Monobind, Lake Forest, CA, USA). Insulin sensitivity was evaluated based on insulin and fasting glucose levels using the homeostasis model assessment (HOMA) index, as follows: insulin level × glucose level/22.5. Insulin resistance (IR) was diagnosed when the HOMA-IR index was >2.77 (21).
Statistical Analyses
Statistical analysis was performed using GraphPad Prism 6 (GraphPad Software, La Jolla, CA, USA) and Statistica software, version 6.1 (Dell Software, Inc., Round Rock, TX, USA). The Mann–Whitney U-test was used to compare non-normally distributed independent variables. Spearman's rank correlation coefficients were calculated to identify dependencies between variables. The data are presented as medians and 25th and 75th quartiles. Differences with values of p < 0.05 were considered statistically significant.
Results
Anthropometric and Clinical Data
Demographic and clinical data of the study patients are shown in Table 1. Patients were divided into two groups based on presence of VO: the first group included 54 patients with VO, and the second group included 30 without VO (Table 2). Patients in the two groups were comparable in age, presence of risk factors for CVD (i.e., hypertension, smoking, dyslipoproteinaemia, angina pectoris, and congestive heart failure), and myocardial infarction based on clinical history.
Table 1. Clinical and anamnestic characteristics of the study patients.
Table 2. Baseline clinical characteristics of the study patients, based on the presence of visceral obesity.
Adipokine and Cytokine Expression Levels in the SAT and EAT
The mRNA expression levels of adiponectin, leptin, and cytokines IL6, TNF, IL10 were assessed in adipocyte cultures isolated from EAT and SAT. Expression of adiponectin in cultures of epicardial adipocytes from both patients with VO (p = 0.001) and without VO (p = 0.002) was lower than that in SAT adipocytes (Figure 3).
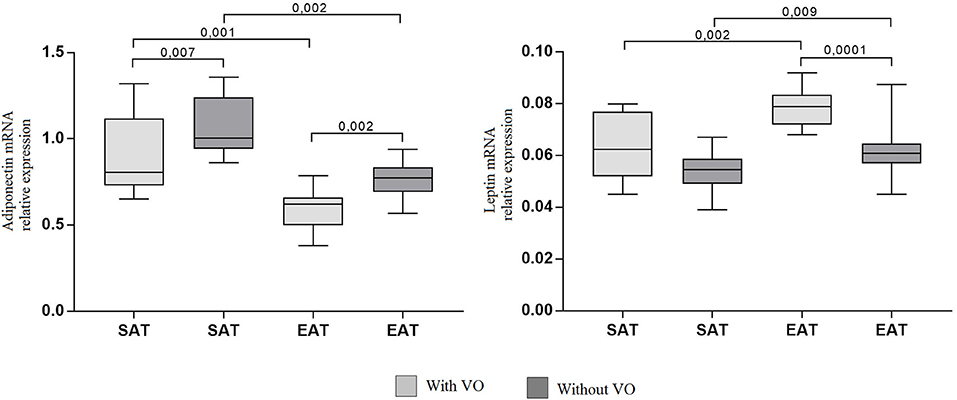
Figure 3. Expression of adipokine genes in adipocytes from the subcutaneous and epicardial fat depots. The data presented are the medians and the 25th and 75th quartiles. p < 0.05 for comparisons between the study groups.
At the same time, adiponectin mRNA expression in cultures of subcutaneous (p = 0.007) and epicardial (p = 0.002) adipocytes from patients with VO was lower than that in cultures from patients without obesity. For leptin, the reverse pattern was observed: expression was higher in cultures of epicardial adipocytes (p = 0.002, p = 0.009) than in those of subcutaneous adipocytes, and patients with VO (p = 0.002) exhibited higher expression of leptin mRNA in EAT adipocytes than in those without VO (p = 0.0001). In addition, in EAT adipocytes, increased expression of proinflammatory cytokines IL6 and TNF was observed compared with that in SAT adipocytes (Figure 4). Moreover, expression in patients with VO was significantly higher than that in patients without VO, in both SAT and EAT cultures. In contrast, levels of IL10 expression in SAT cultures were higher than those in EAT adipocytes. Between the two study groups, patients with VO were characterized by reduced expression of IL10 (Figure 4).
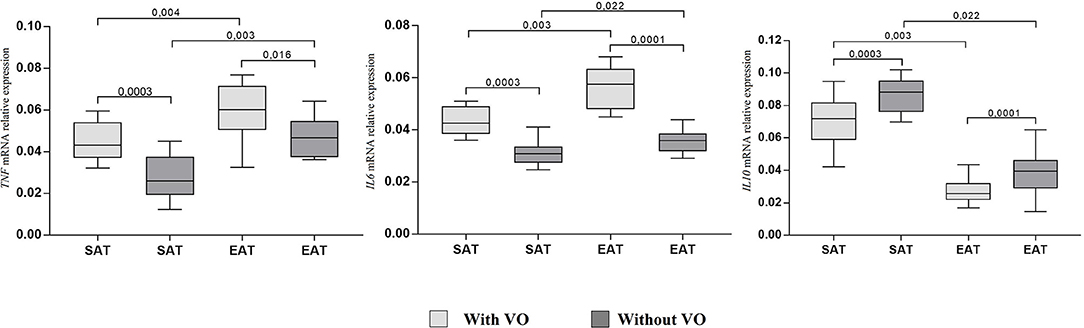
Figure 4. Expression of cytokine genes in adipocytes from the subcutaneous and epicardial fat depots. The data presented are the medians and the 25th and 75th quartiles. p < 0.05 for comparisons between the study groups.
The concentrations of adipokines and cytokines in the cultures of EAT and SAT adipocytes from patients with CAD are presented in Table 3. The leptin content was not significantly different between the cultures of epicardial and subcutaneous adipocytes. However, levels of leptin in patients with VO were significantly higher than those in patients without VO. Unlike leptin, levels of the protective molecule adiponectin were lower in EAT adipocytes than in SAT adipocytes, both in patients with VO (15% reduction) and without VO (21% reduction). At the same time, in patients without VO, levels of adiponectin in the culture media were significantly higher than those in patients with VO.
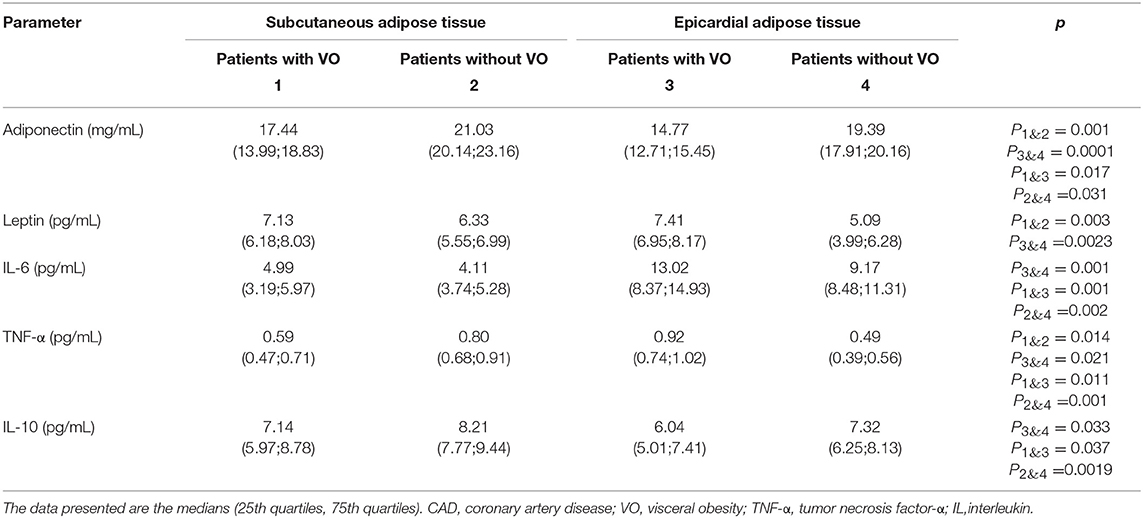
Table 3. Adipokine and cytokine levels in the adipocytes culture medium.
Levels of proinflammatory cytokines TNF and IL6 were significantly higher in EAT adipocytes than in SAT adipocytes, whereas concentrations of the protective cytokine IL10 were lower in EAT than in SAT cultures, among both patients with VO (25% reduction) and without VO (30% reduction). Moreover, higher levels of proinflammatory cytokines and lower levels of the anti-inflammatory IL10 were noted in patients with VO compared to levels in patients without VO.
Serum Adipokine and Cytokine Levels
Analysis of the sera from CAD patients with VO (Table 4) showed that serum adiponectin levels in patients with VO were 27.6% lower than those in patients without VO. Additionally, a 1.67-fold increase in leptin levels was observed in patients with VO compared to levels in CAD patients without VO.
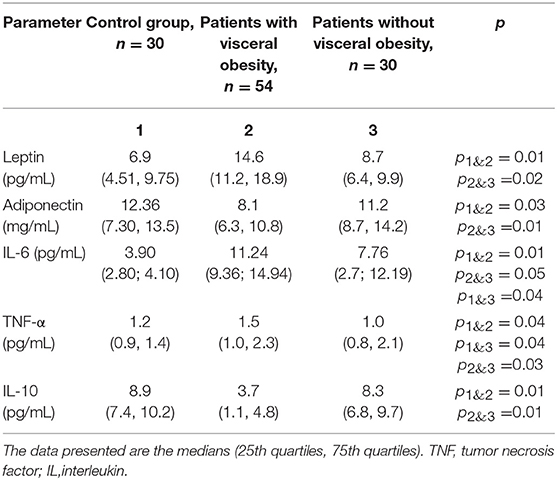
Table 4. Adipokine and cytokine levels in the serum of patients with cardiovascular disease with and without visceral obesity.
Serum TNF-α levels were 1.5-fold higher in patients with VO than in those without VO. Levels of IL-6 also increased 2.9 and 2 times in patients with VO and without VO, respectively, indicating higher levels in patients with VO than in those without VO. IL-10 levels were 2-fold lower in patients with VO than in patients without VO. Positive correlations between levels of leptin, TNF-α, and IL-10 in adipocytes and those in sera were evident, with correlation coefficients of 0.43 (p = 0.04), 0.53 (p = 0.02), and 0.50 (p = 0.04), respectively.
Factors Associated With Lipid and Carbohydrate Metabolism
Compared with patients without VO, serum levels of atherogenic factors associated with lipid metabolism, namely, LDL-C, VLDL-C, Apo-B, TGs, and Apo-B/Apo-Al, increased significantly in patients with VO, whereas antiatherogenic fractions, namely, HDL-C and Apo-A1, were lower in patients with VO. Changes in carbohydrate metabolism were more pronounced in CAD patients with VO compared to those in patients without VO. IR was present in CAD patients with VO, who showed a 1.5-fold increase in the HOMA index compared with that in patients without VO. Hyperinsulinaemia was often present in patients with VO, and their C-reactive peptide levels were elevated compared with those in patients without VO. The two groups did not differ significantly with respect to glucose or HbA1c levels (p > 0.05).
Correlations Between Adipose Tissue Area and Adipokine and Cytokine Levels
Some of the patients with VO had normal BMIs. Likewise, some of the patients with high BMIs and class II or III obesity did not have VO. In contrast to the SAT area, the EAT area was positively associated with higher levels of leptin and TNF-α in the adipocytes and serum, along with higher levels of factors associated with lipid and carbohydrate metabolism (Table 5). In contrast, serum adiponectin levels were associated with the SAT area (r = 0.47, p = 0.03).
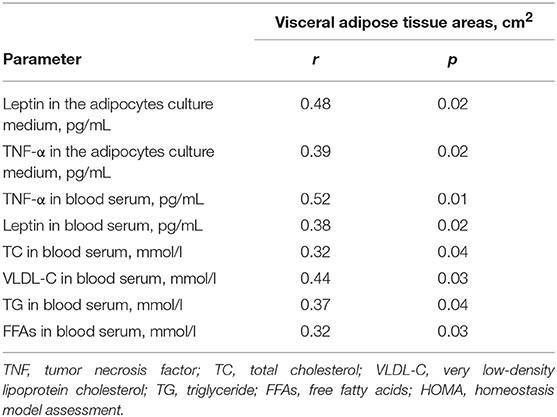
Table 5. Correlations between the level of adipokines and cytokines in serum, in the adipocytes culture medium and the area of visceral adipose tissue.
Discussion
Obesity is a leading risk factor associated with CVD, and VO is the factor with the strongest influence on the development of CVD. Cardiovascular risk increases by 2.75-fold for patients who present with VO and whose body weights are normal, and the risk of all-cause mortality increases by 2.08-fold compared with patients who do not have VO (22–26).
VAT is an active endocrine organ that releases adipokines, regulators of lipid and carbohydrate metabolism, and cytokines; hence, it can potentially contribute to atherogenesis. Moreover, VAT has unique metabolic functions. Compared with adipocytes from other fat depots, VAT adipocytes exhibit increases in β3-adrenoreceptor expression and function and a decrease in the number of insulin receptors, leading to an increase in lipid metabolism. Accumulations of FFAs and ceramide non-oxidized metabolites can stimulate the development of lipotoxic disorders, resulting in IR, dyslipidaemia, cardiomyopathy, and higher blood pressure (22). Within the VAT, the EAT may be of particular importance. EAT is a unique fat depot, the thickness, and metabolic activity of which correlate directly with the VAT area (27). The thickness of the EAT correlates directly with the severity of CAD in patients and with the thickness of the left ventricular myocardium (28).
VO is adversely associated with the development of cardiac pathology. We hypothesized that the adipokines and cytokines synthesized by EAT adipocytes from patients with VO and released into the blood were cardiovascular risk factors; hence, this study's primary focus was to investigate adipokine and cytokine profiles in adipocytes and in serum samples from CAD patients with VO. We found that EAT adipocytes had elevated leptin levels and reduced adiponectin levels compared with those in SAT adipocytes. The elevated leptin levels in the EAT and SAT adipocytes correlated directly with elevated concentrations in the serum.
In contrast to the present study, in the literature, there are several lines of evidence for the absence of a correlation between EAT-secreted cytokines and circulating cytokine levels. Early on, this contradiction was reported only for adiponectin; expression of adiponectin in EAT may or may not correlate with plasma concentrations, which are presumably derived from the SAT and most often decrease in obesity (29). Thus, we found that the expression of the adiponectin gene in cultures of epicardial adipocytes in both patients with and without VO was lower than that in subcutaneous adipocytes. This contradiction can be attributed to the nature of correlation analysis: a correlation between two variables may indicate the existence of a common cause, rather than a direct interaction between the two. After a chronic positive energy balance, the adipocytes in the VAT induce FFA uptake and accumulation. Expansion of VAT triggers the expression of proinflammatory adipokines, oxidative stress, and activation of the renin-angiotensin-aldosterone system. Hypertrophic but not hyperplastic adipocytes are associated with IR (30). Thus, the VAT becomes dysfunctional, dysregulating adipocyte apoptosis and increasing autophagy (30). Nevertheless, the accumulation of fat may saturate VAT capacity. The resultant failure of VAT to store triacylglycerides could result in ectopic deposition of toxic fatty acids species (i.e., diacylglycerol, ceramide) in additional adipose tissue such as the myocardium, leading to an increase in EAT thickness (31). Importantly, the amount of VAT correlates with the volume of the EAT, and thus, significant weight loss in obese patients has been associated with noteworthy reductions in EAT volume (32–34). In obesity, many changes occur, as EAT volumes substantially increase. These changes are often characterized by hypertrophy, failure to store triglycerides, increased lipolysis, and inflammation (35). Dysfunctional adipocytes express high levels of proinflammatory factors (i.e., IFN-γ) that enhance the proinflammatory response of infiltrated immune cells, such as dendritic cells, macrophages, T and B cells, and eosinophils (36). As EAT expands, it becomes hypoxic and dysfunctional (37) and is invaded by an increasing number of macrophages and T lymphocytes, resulting in a shift in its metabolic profile. The result is increased secretion of proinflammatory cytokines such as TNF-α, IL-6, and others that contribute to the inflammatory environment characteristic of atherogenesis (38). Consistent with this, in our study, increased expression of proinflammatory cytokines and decreased expression of an anti-inflammatory cytokine were observed in EAT adipocytes compared with levels in SAT adipocytes. All patients were found to have dyslipidaemia; however, in subjects with VO, levels of TGs, and FFAs were significantly higher than those in subjects without VO. It is possible that TGs act as a pathogenic trigger of adiposopathy in VAT and EAT.
Given the ability of proinflammatory cytokines to modulate the synthesis and secretion of adipokines, activation of inflammation may increase leptin levels and inhibit the protective effects of adiponectin in EAT adipocytes. The activation of inflammation in SAT adipocytes is associated with high levels of IL-10, and elevated leptin levels are accompanied by high adiponectin levels. Thus, analysis of the adipokine and cytokine profiles in this study suggested differences between EAT and SAT adipocytes.
Changes in the levels of leptin, adiponectin, TNF-α, IL-6, and IL-10 in the serum and in EAT adipocytes appeared to show similar patterns; hence, increases in levels of pathogenic factors and reductions in levels of protective factors were observed.
Importantly, the imbalance between disease-promoting and protective adipokines and cytokines in patients with VO was accompanied by more pronounced impairments in lipid and carbohydrate metabolism compared with those observed in patients without VO. Patients with VO showed more pronounced changes in adipokine and cytokine profiles of the serum and adipose tissue. However, changes in metabolism are not dependent on the thickness of the subcutaneous fat layer. The local and systemic imbalances of the adipokine and cytokine profiles in the patients with VO were accompanied by multivessel CAD with stenotic lesions that narrowed the vessels by 30–50%, angina pectoris functional class 2 or 3, increases in atherogenic fractions of serum lipids, and the development of IR. Adipokines and cytokines are apparently released directly into the coronary blood flow owing to the anatomical proximity of the EAT to the coronary arteries, which may have adverse consequences. Administration of TNF-α intra-arterially is accompanied by endothelium-dependent vasodilation and the initiation of inflammation in the vascular wall (39–42). The proatherogenic effects of TNF-α also include the promotion of leucocyte migration to the endothelium, increases in the synthesis of adhesion molecules and chemoattractants, and enhanced vascular permeability (38, 41). Based on the cytokine profiles observed in adipocytes, we conclude that the activation of inflammation in EAT adipocytes in patients with VO may be extremely important in CAD, with increases in TNF-α, IL-1, and IL-6 levels accompanied by decreases in IL-10 levels.
EAT adipocytes in CAD patients with VO may characterize “metabolic inflammation,” indicating that adipocytes are directly involved in the pathogenesis of CAD through development of an adipokine imbalance and activation of proinflammatory processes (43).
Data Availability
The datasets analyzed in this manuscript are not publicly available. Requests to access the datasets should be directed to b19ncnV6ZGV2YUBtYWlsLnJ1.
Ethics Statement
The Ethics Committee of the Federal State Budgetary Institution, Research Institute for Complex Issues of Cardiovascular Diseases approved this study (Protocol No. 22 from 15.08.2017). All patients provided informed consent.
Author Contributions
OG was principal investigator, study co-ordinator and investigator, participated in all stages of recruitment of the patients and in analysis of the data, drafted, and critically reviewed the manuscript. OA and VK were study co-ordinator and investigator, participated in all stages of recruitment of the patients and in analysis of the data, drafted, and critically reviewed the manuscript. EU, AK, TP, EBe, LA, VM, and YD were study investigator, participated in all stages of recruitment of patients and critically reviewed the manuscript. SI, AS, and KK obtained bioptaps of adipose tissue of various localization during coronary bypass surgery. OB was principal investigator. EBy was study investigator, participated in all stages of recruitment of patients and collected the data. All other study investigators conducted the study and collected the data. All authors read and approved the final manuscript.
Funding
The work was supported by the Russian Science Foundation [grant number: 17-75-20026].
Conflict of Interest Statement
The authors declare that the research was conducted in the absence of any commercial or financial relationships that could be construed as a potential conflict of interest.
References
1. Lozano R, Naghavi M, Foreman K, Lim S, Shibuya K, Aboyans V, et al. Global and regional mortality from 235 causes of death for 20 age groups in 1990 and 2010: a systematic analysis for the Global Burden of Disease Study (2010). Lancet. (2012) 380:2095–128. doi: 10.1016/S0140-6736(12)61728-0
2. Roth GA, Forouzanfar MH, Moran AE, Barber R, Nguyen G, Feigin VL, et al. Demographic and epidemiologic drivers of global cardiovascular mortality. N Engl J Med. (2015) 372:1333–41. doi: 10.1056/NEJMoa1406656
3. Lainscak M, Blue L, Clark AL, Dahlström U, Dickstein K, Ekman I, et al. Self-care management of heart failure: practical recommendations from the Patient Care Committee of the Heart Failure Association of the European Society of Cardiology. Eur J Heart Fail. (2011) 13:115–26. doi: 10.1093/eurjhf/hfq219
4. Veilleux A, Côté JA, Blouin K, Nadeau M, Pelletier M, Marceau P. Glucocorticoid-induced androgen inactivation by aldo-keto reductase 1C2 promotes adipogenesis in human preadipocytes. Am J Physiol Endocrinol Metab. (2012) 302:941–9. doi: 10.1152/ajpendo.00069.2011
5. Jensen MD. Role of body fat distribution and the metabolic complications of obesity. J Clin Endocrinol Metab. (2008) 93:57–63. doi: 10.1210/jc.2008-1585
6. Hall JE, da Silva AA, do Carmo JM, Dubinion J, Hamza S, Munusamy S, et al. Obesity-induced hypertension: role of sympathetic nervous system, leptin, and melanocortins. J Biol Chem. (2010) 285:17271–76. doi: 10.1074/jbc.R110.113175
7. Bergman RN, Kim SP, Catalano KJ, Hsu IR, Chiu JD, Kabir M, et al. Why visceral fat is bad: mechanisms of the metabolic syndrome. Obesity. (2006) 14:16–9. doi: 10.1038/oby.2006.277
8. Baker A, da Silva N, Quinn D, Harte A, Pagano D, Bonser R, et al. Human epicardial adipose tissue expresses a pathogenic profile of adipocytokines in patients with cardiovascular disease. Cardiovasc Diabetol. (2006) 5:1. doi: 10.1186/1475-2840-5-1
9. Guzik TJ, Skiba DS, Touyz RM, Harrison DG. The role of infiltrating immune cells in dysfunctional adipose tissue. Cardiovasc Res. (2017) 113:1009–23. doi: 10.1093/cvr/cvx108
10. Iacobellis G, Corradi D, Sharma AM. Epicardial adipose tissue: anatomic, biomolecular and clinical relationships with the heart. Nat Clin Pract Cardiovasc Med. (2005) 2:536–43. doi: 10.1038/ncpcardio0319
11. Britton KA, Fox CS. Ectopic fat depots and cardiovascular disease. Circulation. (2011) 124:837–41. doi: 10.1161/CIRCULATIONAHA.111.077602
12. Bambacea C, Telescab M, Zoicoa E, Sepe A, Olioso D, Rossi A, et al. Adiponectin gene expression and adipocyte diameter: a comparison between epicardial and subcutaneous adipose tissue in men. Cardiovasc Pathol. (2011) 20:153–6. doi: 10.1016/j.carpath.2010.07.005
13. Gormez S, Demirkan A, Atalar F, Caynak B, Erdim R, Sozer V, et al. Adipose tissue gene expression of adiponectin, tumor necrosis factor-α and leptin in metabolic syndrome patients with coronary artery disease. Intern Med. (2011) 50:805–10. doi: 10.2169/internalmedicine.50.4753
14. Sjöström LA. Computer-tomography based multicompartment body composition technique and anthropometric predictions of lean body mass, total and subcutaneous adipose tissue. Int J Obes. (1991) 15:19–30.
15. Carswell KA, Lee MJ, Fried SK. Culture of isolated human adipocytes and isolated adipose tissue. Methods Mol Biol. (2012) 806:203–14. doi: 10.1007/978-1-61779-367-7_14
16. Suga H, Matsumoto D, Inoue K, Shigeura T, Eto H, Aoi N, et al. Numerical measurement of viable and nonviable adipocytes and other cellular components in aspirated fat tissue. Plast Reconstr Surg. (2008) 122:103–14. doi: 10.1097/PRS.0b013e31817742ed
17. Sinitsky MY, Matveeva VG, Asanov MA, Ponasenko AV. Modifications in routine protocol of RNA isolation can improve quality of RNA purified from adipocytes. Anal Biochem. (2018) 543:128–31. doi: 10.1016/j.ab.2017.12.020
18. Vandesompele J, De Preter K, Pattyn F, Poppe B, Van Roy N, De Paepe A, et al. Accurate normalization of real-time quantitative RT-PCR data by geometric averaging of multiple internal control genes. Genome Biol. (2002) 3:research0034. doi: 10.1186/gb-2002-3-7-research0034
19. Pfaffl MW. A new mathematical model for relative quantification in real-time RT-PCR. Nucleic Acids Res. (2001) 29:e45. doi: 10.1093/nar/29.9.e45
20. Bustin SA, Benes V, Garson JA, Hellemans J, Huggett J, Kubista M, et al. The MIQE guidelines: minimum information for publication of quantitative real-time PCR experiments. Clin Chem. (2009) 55:611–22. doi: 10.1373/clinchem.2008.112797
21. Matthews DR, Hosker JP, Rudenski AS, Naylor BA, Treacher DF, Turner RC. Homeostasis model assessment: insulin resistance and beta-cell function from fasting plasma glucose and insulin concentrations in man. Diabetologia. (1985) 28:412–9. doi: 10.1007/BF00280883
22. Mahabadi AA, Massaro JM, Rosito GA, Levy D, Murabito JM, Wolf PA, et al. Association of pericardial fat, intrathoracic fat, and visceral abdominal fat with cardiovascular disease burden: the Framingham Heart Study. Eur Heart J. (2009) 30:850–6. doi: 10.1093/eurheartj/ehn573
23. Gruzdeva O, Uchasova E, Dyleva Y, Borodkina D, Akbasheva O, Belik E, et al. Relationships between epicardial adipose tissue thickness and adipo fibrokine indicator profiles post myocardial infarction. Cardiovasc Diabetol. (2018) 17:40. doi: 10.1186/s12933-018-0679-y
24. Björntorp P. Metabolic implications of body fat distribution. Diabetes Care. (1991) 14:1132–43. doi: 10.2337/diacare.14.12.1132
25. Jeong JW, Jeong MH, Yun KH, Oh SK, Park EM, Kim YK, et al. Echocardiographic epicardial fat thickness and coronary artery disease. Circ J. (2007) 71:536–9. doi: 10.1253/circj.71.536
26. Cheng KH, Chu CS, Lee KT, Lin TH, Hsieh CC, Chiu CC, et al. Adipocytokines and proinflammatory mediators from abdominal and epicardial adipose tissue in patients with coronary artery disease. Int J Obes. (2008) 32:268–74. doi: 10.1038/sj.ijo.0803726
27. Könner AC, Brüning JC. Selective insulin and leptin resistance in metabolic disorders. Cell Metab. (2012) 16:144–52. doi: 10.1016/j.cmet.2012.07.004
28. Donoso MA, Muñoz-Calvo MT, Barrios V, Martínez G, Hawkins F, Argente J. Increased leptin/adiponectin ratio and free leptin index are markers of insulin resistance in obese girls during pubertal development. Horm Res Paediatr. (2013) 80:363–70. doi: 10.1159/000356046
29. Margaritis M, Antonopoulos AS, Digby J, Lee R, Reilly S, Coutinho P, et al. Interactions between vascular wall and perivascular adipose tissue reveal novel roles for adiponectin in the regulation of endothelial nitric oxide synthase function in human vessels. Circulation. (2013) 127:2209–21. doi: 10.1161/CIRCULATIONAHA.112.001133
30. Tchernof A, Després JP. Pathophysiology of human visceral obesity: an update. Physiol Rev. (2013) 93:359–404. doi: 10.1152/physrev.00033.2011
31. Fitzgibbons TP, Czech MP. Epicardial and perivascular adipose tissues and their influence on cardiovascular disease: basic mechanisms and clinical associations. J Am Heart Assoc. (2014) 3:e000582. doi: 10.1161/JAHA.113.000582
32. Iacobellis G, Singh N, Wharton S, Sharma AM. Substantial changes in epicardial fat thickness after weight loss in severely obese subjects. Obesity. (2008) 16:1693–97. doi: 10.1038/oby.2008.251
33. Fernández-Trasancos Á, Guerola-Segura R, Paradela-Dobarro B, Álvarez E, García-Acuña JM, et al. Glucose and inflammatory cells decrease adiponectin in epicardial adipose tissue cells: paracrine consequences on vascular endothelium. J Cell Physiol. (2016) 231:1015–23. doi: 10.1002/jcp.25189
34. Harada K, Amano T, Kataoka T, Takeshita M, Harada K, Kunimura A, et al. Impact of abdominal and epicardial fat on the association between plasma adipocytokine levels and coronary atherosclerosis in non-obese patients. Atherosclerosis. (2014) 237:671–76. doi: 10.1016/j.atherosclerosis.2014.10.014
35. Dessouky KM, Sheridah AR, Salah KH. Epicardial adipose tissue thickness as useful marker of metabolic syndrome in adult Egyptian patients. Am J Med Med Sci. (2016) 6:160–5. doi: 10.5923/j.ajmms.20160605.03
36. Henrichot E, Juge-Aubry CE, Pernin A, Pache J-C, Velebit V, Dayer JM, et al. Production of chemokines by perivascular adipose tissue a role in the pathogenesis of atherosclerosis? Arterioscler Thromb Vasc Biol. (2005) 25:2594–9. doi: 10.1161/01.ATV.0000188508.40052.35
37. Greenstein AS, Khavandi K, Withers SB, Sonoyama K, Clancy O, Jeziorska M, et al. Local inflammation and hypoxia abolish the protective anticontractile properties of perivascular fat in obese patients. Circulation. (2009) 119:1661–70. doi: 10.1161/CIRCULATIONAHA.108.821181
38. Mazurek T, Zhang L, Zalewski A, Mannion JD, Diehl JT, Arafat H, et al. Human epicardial adipose tissue is a source of inflammatory mediators. Circulation. (2003) 108:2460–6. doi: 10.1161/01.CIR.0000099542.57313.C5
39. Chia S, Qadan M, Newton R, Ludlam CA, Fox KA, Newby DE. Intra-arterial tumor necrosis factor-alpha impairs endothelium-dependent vasodilatation and stimulates local tissue plasminogen activator release in humans. Arterioscler Thromb Vasc Biol. (2003) 23:695–701. doi: 10.1161/01.ATV.0000065195.22904.FA
40. Lima MM, Pareja JC, Alegre SM, Geloneze SR, Kahn SE, Astiarraga BD, et al. Visceral fat resection in humans: effect on insulin sensitivity, beta-cell function, adipokines, and inflammatory markers. Obesity. (2013) 21:182–9. doi: 10.1002/oby.20030
41. Gaggini M, Gastaldelli A. Brown versus white fat: are they really playing a role in obesity and cardiometabolic risk? Clin Lipidol. (2015) 10:365–8. doi: 10.2217/clp.15.32
42. Gómez-Hernández A, Perdomo L, de las Heras N, Beneit N, Escribano Ó, Otero YF, et al. Antagonistic effect of TNF-alpha and insulin on uncoupling protein 2 (UCP-2) expression and vascular damage. Cardiovasc Diabetol. (2014) 13:108. doi: 10.1186/s12933-014-0108-9
Keywords: visceral obesity, epicardial adipose tissue, insulin resistance, inflammation, cytokine, adipokine
Citation: Gruzdeva O, Uchasova E, Dyleva Y, Borodkina D, Akbasheva O, Antonova L, Matveeva V, Belik E, Ivanov S, Sotnikov A, Kozyrin K, Brel N, Sinitsky M, Karetnikova V, Kokov A, Bychkova E, Pecherina T and Barbarash O (2019) Adipocytes Directly Affect Coronary Artery Disease Pathogenesis via Induction of Adipokine and Cytokine Imbalances. Front. Immunol. 10:2163. doi: 10.3389/fimmu.2019.02163
Received: 18 June 2019; Accepted: 28 August 2019;
Published: 19 September 2019.
Edited by:
Valentin A. Pavlov, Northwell Health, United StatesReviewed by:
Jose Ramón González-Juanatey, Hospital Clínico Universitario de Santiago, SpainP. Trayhurn, University of Liverpool, United Kingdom
Copyright © 2019 Gruzdeva, Uchasova, Dyleva, Borodkina, Akbasheva, Antonova, Matveeva, Belik, Ivanov, Sotnikov, Kozyrin, Brel, Sinitsky, Karetnikova, Kokov, Bychkova, Pecherina and Barbarash. This is an open-access article distributed under the terms of the Creative Commons Attribution License (CC BY). The use, distribution or reproduction in other forums is permitted, provided the original author(s) and the copyright owner(s) are credited and that the original publication in this journal is cited, in accordance with accepted academic practice. No use, distribution or reproduction is permitted which does not comply with these terms.
*Correspondence: Evgenya Uchasova, ZXZnLnVjaGFzb3ZhQHlhbmRleC5ydQ==