 Dmitry Grebennikov1,2,3*
 Anass Bouchnita4
 Vitaly Volpert3,5,6
 Nikolay Bessonov7
 Andreas Meyerhans8,9
 Gennady Bocharov2,10*
- 1Moscow Institute of Physics and Technology, National Research University, Dolgoprudny, Russia
- 2Marchuk Institute of Numerical Mathematics, Russian Academy of Sciences, Moscow, Russia
- 3Peoples' Friendship University of Russia (RUDN University), Moscow, Russia
- 4Division of Scientific Computing, Department of Information Technology, Uppsala University, Uppsala, Sweden
- 5Institut Camille Jordan, UMR 5208 CNRS, University Lyon 1, Villeurbanne, France
- 6INRIA Team Dracula, INRIA Lyon La Doua, Villeurbanne, France
- 7Institute of Problems of Mechanical Engineering, Russian Academy of Sciences, Saint Petersburg, Russia
- 8Infection Biology Laboratory, Department of Experimental and Health Sciences, Universitat Pompeu Fabra, Barcelona, Spain
- 9Institució Catalana de Recerca i Estudis Avançats (ICREA), Barcelona, Spain
- 10Sechenov First Moscow State Medical University, Moscow, Russia
A Corrigendum on
Spatial Lymphocyte Dynamics in Lymph Nodes Predicts the Cytotoxic T Cell Frequency Needed for HIV Infection Control
by Grebennikov, D., Bouchnita, A., Volpert, V., Bessonov, N., Meyerhans, A., and Bocharov, G. (2019). Front. Immunol. 10:1213. doi: 10.3389/fimmu.2019.01213
In the original article, there was a typo in Figure 2A color legend as published. The colored circles denoting Ag-specific and non-specific T cells should be swaped. That is, the dark green color should represent Ag-specific CD4+ TCs, the light green color—non-specific CD4+ TCs; the dark blue color should represent Ag-specific CD8+ TCs, the light blue color—non-specific CD8+ TCs. The corrected Figure 2 appears below.
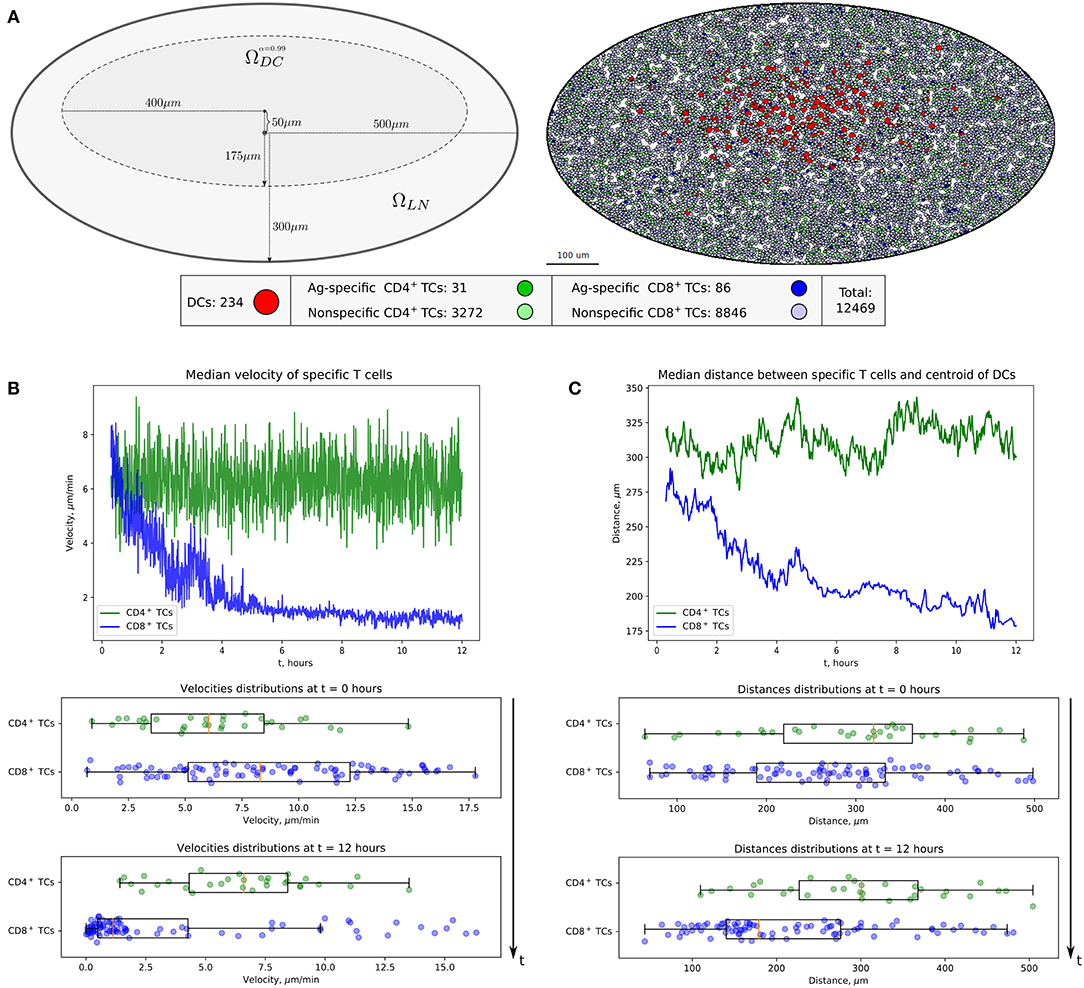
Figure 2. Heterogeneous dynamics of T cells in LNs. (A) The scheme of a LN and illustration of the initial configuration generated for simulations. DCs, CD4+ T cells, and CD8+ T cells are placed within a LN as described in the Supplementary Text with total cellularity of 12,469 cells, ≈80% packing density and ≈1% precursor frequency. (B) Twelve-hour kinetics of median velocities of antigen-specific CD8+ T and CD4+ T cells, and their distributions at the start and at the end of a 12-h simulation. (C) Twelve-hour kinetics of median distances from T cells to the centroid of DCs, measured for antigen-specific CD8+ T and CD4+ T cells, and their distributions at the start and at the end of a 12-h simulation. TC, T cell; DC, dendritic cell.
The authors apologize for this error and state that this does not change the scientific conclusions of the article in any way. The original article has been updated.
Keywords: lymphoid tissue, cell motility, HIV infection, cytotoxic T cell scanning, multicellular dynamics, dissipative particle dynamics, stochastic differential equation
Citation: Grebennikov D, Bouchnita A, Volpert V, Bessonov N, Meyerhans A and Bocharov G (2019) Corrigendum: Spatial Lymphocyte Dynamics in Lymph Nodes Predicts the Cytotoxic T Cell Frequency Needed for HIV Infection Control. Front. Immunol. 10:1538. doi: 10.3389/fimmu.2019.01538
Received: 18 June 2019; Accepted: 19 June 2019;
Published: 03 July 2019.
Approved by:
Frontiers Editorial Office, Frontiers Media SA, SwitzerlandCopyright © 2019 Grebennikov, Bouchnita, Volpert, Bessonov, Meyerhans and Bocharov. This is an open-access article distributed under the terms of the Creative Commons Attribution License (CC BY). The use, distribution or reproduction in other forums is permitted, provided the original author(s) and the copyright owner(s) are credited and that the original publication in this journal is cited, in accordance with accepted academic practice. No use, distribution or reproduction is permitted which does not comply with these terms.
*Correspondence: Dmitry Grebennikov, ZG1pdHJ5LmV3QGdtYWlsLmNvbQ==; Gennady Bocharov, Ym9jaGFyb3ZAbS5pbm0ucmFzLnJ1