- 1School of Medicine, Center for Global Health-Division of Infectious Diseases, University of New Mexico, Albuquerque, NM, United States
- 2Human Ecology, Centro de Investigación y de Estudios Avanzados (CINVESTAV), Mérida, Mexico
- 3Stremble Ventures LTD, Limassol, Cyprus
- 4Department of Pathology, School of Medicine, University of New Mexico, Albuquerque, NM, United States
- 5Biosecurity and Public Health, Los Alamos National Laboratory, Los Alamos, NM, United States
- 6Loyola University Medical Center, Chicago, IL, United States
- 7Department of Veterinary Tropical Diseases, University of Pretoria, Pretoria, South Africa
- 8Food and Agriculture Organization of the United Nations, Dar es Salaam, Tanzania
- 9GAMA Therapeutics LLC, Mansfield, MA, United States
- 10Centre National de la Recherche Scientifique (CNRS), School of Biotechnology, University of Strasbourg, Strasbourg, France
Investigating disease pathogenesis and personalized prognostics are major biomedical needs. Because patients sharing the same diagnosis can experience different outcomes, such as survival or death, physicians need new personalized tools, including those that rapidly differentiate several inflammatory phases. To address these topics, a pattern recognition-based method (PRM) that follows an inverse problem approach was designed to assess, in <10 min, eight concepts: synergy, pleiotropy, complexity, dynamics, ambiguity, circularity, personalized outcomes, and explanatory prognostics (pathogenesis). By creating thousands of secondary combinations derived from blood leukocyte data, the PRM measures synergic, pleiotropic, complex and dynamic data interactions, which provide personalized prognostics while some undesirable features—such as false results and the ambiguity associated with data circularity-are prevented. Here, this method is compared to Principal Component Analysis (PCA) and evaluated with data collected from hantavirus-infected humans and birds that appeared to be healthy. When human data were examined, the PRM predicted 96.9 % of all surviving patients while PCA did not distinguish outcomes. Demonstrating applications in personalized prognosis, eight PRM data structures sufficed to identify all but one of the survivors. Dynamic data patterns also distinguished survivors from non-survivors, as well as one subset of non-survivors, which exhibited chronic inflammation. When the PRM explored avian data, it differentiated immune profiles consistent with no, early, or late inflammation. Yet, PCA did not recognize patterns in avian data. Findings support the notion that immune responses, while variable, are rather deterministic: a low number of complex and dynamic data combinations may be enough to, rapidly, unmask conditions that are neither directly observable nor reliably forecasted.
Introduction
Understanding the processes that, later, result in different outcomes–such as survival or death–, is an elusive goal. To improve research on disease pathogenesis, new methods are needed (1, 2), which should consider, at least, eight concepts: synergy, pleiotropy, complexity, dynamics, ambiguity, circularity, personalized outcomes, and explanatory prognostics.
Because living creatures are permanently interacting with the environment, they are both closed and open (3). While adjustments to changes originated in the environment may lead to higher costs, the costs imposed by higher complexity can be compensated with the lower costs induced by synergic pleiotropy, e.g., mutations in one gene can improve two or more traits without increasing the overall cost of complexity (4). Therefore, to assess living creatures that interact with their environment, new methods should measure both “one-to-many” (pleiotropic) and “many-to-one” (synergic) relationships, that is, “bow tie”-like processes (5).
The evidence that “one-to-many/many-to-one” constructs promote economically efficient biological systems is abundant: in spite of thousands of microbes potentially pathogenic, approximately 210 cell types suffice to confer survival (6). A few combinations of factors (cell types, in this example) perform many functions better, faster, and/or at a lower cost.
Consequently, the reductionist “one-to-one” (one structure/one function or “one target”) theory no longer holds (7). To capture pleiotropic synergies, new methods should measure two properties observed when living creatures respond to changes originated in their environment: complexity and dynamics. In infectious diseases, complexity refers to the numerous combinations that host-microbial interactions may generate, which differ over time, i.e., they are dynamic (2).
Synergy, pleiotropy, complexity, and dynamics can express ambiguity: the same numerical value of the same variable does not always have the same meaning nor always performs the same function. Vice versa, different values of the same variable may be associated with the same function or meaning (8). For example, interleukin (IL) 6 is ambiguous. Given its pleiotropy–IL-6 is both a pro- and anti-inflammatory cytokine (9)–, its mere detection, in isolation and/or at a single time point, is error-prone. Similarly, monocytes are ambiguous: because they both promote neutrophil activity (at the beginning of an inflammation) and neutrophil destruction (at the end of the inflammation or recovery phase), measuring monocytes, alone and at a single time point, cannot distinguish between a new and a late inflammation (10).
Ambiguity may be characterized by data circularity (11). Because infections are temporal processes, they tend to express circular and ambiguous data. That is so because the functions performed by living creatures never stop. Consequently, no data pattern remains constant: if the individual survives, one pattern will eventually be replaced by a different (if not the opposite) pattern –a process that creates an oscillatory or circular shape. Thus, each value of each variable may, at least, have two meanings or perform two functions which are associated with either positive (feed forward) or negative feedback responses. For instance, similar values of mononuclear cells (MC or lymphocytes and monocytes) can predict both high and low MC/neutrophil (MC/N) ratios (8). The apparent ambiguity of the MC/N ratio may not be so but a valuable new piece of information: in the example mentioned above, septic patients that, after showing similar immunological values, exhibited opposite profiles, were infected by different bacteria, i.e., what seemed to be ambiguous could be distinguished (8). While circularity is observed when temporal data are plotted (11), tests conducted at a single time point may also display circularity or other non-linear patterns. Therefore, a group of individuals that experience different inflammatory phases may reveal distinct spatial patterns even when tested only once.
Randomization, alone, does not prevent ambiguity (11). However, 3D/4D temporal data directionality (arrows that denote where the data are coming from) may prevent ambiguity (8).
Because patients that share the same diagnosis may experience different outcomes, prognosis-oriented methods are needed (1, 12, 13). When based on personalized phenomena, prognostics may promote both research on disease pathogenesis and personalized practices. Such methods could detect immunomodulation before cytotoxicity occurs (1, 14).
In contrast, population-based models are unlikely to predict the outcome of a specific patient (15). Personalized prognostics may also avoid error-prone models. For example, classic statistics assume that the variables under analysis are independently distributed. However, immunological variables interact and, therefore, are interdependent (2). That is the case of pleiotropic integrins (e.g., CD11b), which participate in many functions, including cell activation, transendothelial migration and phagocytosis (16, 17).
Hence, methods meant to prevent ambiguity can use numbers but should not depend on numerical assumptions. Pattern Recognition (PR) meets such criteria. Today facilitated by computerized technologies (e.g., “machine learning”), the spatial/temporal (4D) recognition of data patterns may apply to personalized medicine (18).
Biomedical methods can follow reductionist or non-reductionist theories. While, in the first group, omissions and/or errors are likely to occur because neither complexity nor dynamics are explored and dimensions are reduced (19), the second group does not reduce the number of dimensions and considers that biological systems are both complex and dynamic (2).
Methods may also be differentiated by the problem they investigate, which may be either direct (forward or upstream) or inverse (downstream). Inverse problem-based research starts with a result and then, following an inductive approach, goes back in history and looks for one or several possible cause(s). In contrast, direct problems start with known causes and, using deductive reasoning based on established mechanisms, collect new data to infer effects (20).
The type of knowledge generated can distinguish invention- from discovery-oriented methods (21). While the first type implements operations previously unfeasible, discovery-oriented methods unveil pre-existing but unknown phenomena (22). To our knowledge, invention- and discovery-oriented approaches have not yet been explored in Immunology.
Metrics can describe methods, too. Metrics can be something directly measurable, which is usually tested in isolation (e.g., counts or relative percentages of a given cell type) or dimensionless indices that capture relationships between two or more variables, such as the ratio between CD4+ and CD8+ lymphocyte counts or percentages (2, 23).
Methods also differ in the question they address. Dichotomous questions induce errors when three or more results are likely (11). For instance, methods that promote “yes/no” answers cannot assess inflammation, which can reveal three or more stages (no inflammation, early inflammation, late inflammation). Because they can offer polychotomous answers, pattern recognition-oriented methods prevent dichotomization-related errors (24).
Methods are also influenced by medical needs. For example, real-time information, as well as data visualizations, are needed (25, 26).
According to the number of patients under analysis, methods are cataloged as either population-oriented or personalized (27). When the number of patients is n = 1 (personalized medicine), no average (a population metric) can be produced and, therefore, no statistical analysis is possible. Methods that measure inverse problems and capture complex dynamics can be validated when they reveal a property typical of complex systems: emergence (28).
Emergence refers to patterns not directly observed when simple variables are measured in isolation, which become distinguishable when complex and dynamic interactions are analyzed (2). An emergence-based methodology grounds its reproducibility not on assumptions of unknown validity, but biologically explicit evidence.
Following an inverse problem approach, a non-reductionist, pattern recognition-oriented method (PRM) was developed to (a) capture complex and dynamic interactions (synergy and pleiotropy) that may express circularity; (b) prevent ambiguity; and (c) foster personalized prognostics (research on pathogenesis). This construct was evaluated with retrospective data collected from hantavirus-infected humans. To compare the informative ability of PRM, the same data were also explored with Principal Component Analysis or PCA (29). To estimate the reproducibility of the PRM, apparently healthy birds were also tested with both PRM and PCA.
Personalized prognosis is critical in hantavirus infections because its pathogenesis remains unclear and 20–40% of infected individuals may die within a couple of weeks (30). With two major clinical presentations (a hantavirus cardio-pulmonary [HCPS] and a hantavirus renal [HFRS] syndrome), efforts aimed at differentiating survival from non-survival are highly relevant in HCPS, where predictive factors have not yet been identified (31).
To estimate whether the PRM can capture functions conserved throughout evolution, avian data were also tested. Avian leukocyte data can inform on inflammation, a critical process in infectious and non-infectious diseases (32). For example, a documented inflammation may support diagnostics of septic infants (33). Because immunomodulation may occur in the absence of cytotoxicity, an unambiguous diagnosis of chronic inflammation is relevant in numerous fields, including toxicology, gerontology, and cancer (24, 34, 35).
These two datasets helped evaluate this proof-of-concept. Its purpose was to determine whether the PRM may extract more information than alternative methods.
Materials and Methods
Human Data
Following protocol numbers #13-463 and 16-084, a retrospective analysis investigated de-identified blood data collected from 40 humans (26 females and 14 males) admitted to the Health Science Center of the University of New Mexico (UNM), United States, where they were diagnosed as hantavirus-positive and treated, accordingly. These records included 8 fatalities.
Avian Data
Avian blood samples (≤0.2 cc, n = 94) were collected or analyzed under protocol SGPA/SGVS/12648/13 of the Mexican Ministry for the Environment and Natural Resources. Clay colored thrushes (Turdus grayi, n = 72) and great-tailed grackles (Quiscalus mexicanus, n = 22) were sampled at: (i) an urban (20°58′47″N, 89°36′53″W) and (ii) a rural site (20°47′19″N, 89°35′26″W) of Mexico. The eosinophil counting method (Unopette Test 5877, Vacutainer Systems, BD Biosciences, Franklin Lakes, NJ, USA) was used to quantify white blood cells. Blood smears were stained with a modified Wright-Giemsa (Hematology Three-step Stain; Accra Lab, Bridgeport, NJ, USA). Differential cells counts were performed at the Environmental Health Laboratory of the Advanced Research Center (CINVESTAV), Merida, Yucatan, Mexico.
Algorithm
Pattern recognition of blood data was facilitated by a proprietary algorithm (European Patent Office 2959295, 2018), which creates numerous data combinations among monocyte (M), neutrophil (N), and lymphocyte (L) counts or percentages. Its process is described in Supplementary Presentation SF 1–5). While all combinations are identical in primary (input) data, the number they generate (a dimensionless indicator or DI) differs for each combination. DIs –described here with a two- or three-letter identifier, e.g., AAA– are temporary guides used to recognize patterns. These acronyms do not refer to any known biological entity.
The algorithm consists of three steps, which (i) create and expand the number of complex data structures, (ii) keep only data structures that exhibit distinct patterns (data circularity, orthogonal data subsets, and data clusters), and (iii) retrieve the immune profile(s) associated with each data pattern. Steps I and II unmask hidden patterns. Step III identifies biologically interpretable indicators, removes artifacts, and releases new or unexpected information.
This procedure was conducted with blood leukocyte counts or relative percentages (Complete Blood Cell count or CBC). Each CBC of each patient was transformed into indices that included at least one interaction that involved at least two leukocyte cell types, which were then investigated as triplets in 3D/4D plots. A series of 3D analyses were then conducted, focusing each on: (i) temporal observations (if available), (ii) outcomes (if data on two or more outcomes were available), (iii) individuals, and/or (iv) pathogenesis (the immune profile specific of either survivors or non-survivors, or some feature of interest, e.g., immunomodulation). For comparison, PCA (a classic approach used in pattern recognition) was also utilized (36).
Principal Component Analysis
Developed in 1901 (29), PCA both reduces the number of variables under analysis and explains most of the variance. When variables differ in scale, a correlation matrix is used, which gives equal weight to all variables. To that end, the data are standardized, i.e., the mean is subtracted. Thus, the standardized zero separates observations below the mean (negatives values) from those above the mean (positive values). Consequently, “positive” observations will be orthogonal and uncorrelated to “negative” ones. Otherwise, a covariance matrix is utilized (37).
Validation
Four types of validity were assessed: (i) the ability to extract more information than alternatives (construct validity); (ii) the ability to convey similar information when different data structures are considered (internal validity); (iii) the ability to demonstrate similar findings when a different biological condition is tested in a different host, time, and/or place (external validity); and (iv) the reproducibility of a method when compared to a statistical alternative (statistical validity).
Statistical Analysis
Medians were explored with the Mann-Whitney test (Minitab Inc, State College, PA, USA). The same software package was used to conduct PCA (including data standardization) and create 3D plots. To allow readers reproduce critical analyses, primary data, some of the complex variables derived from blood data, and related classes (e.g., survivor or non-survivor; no, early, or late inflammation) are shown in Supplementary Tables 1 and 2. Prognostic redundancy (i.e., whether two or more data structures assigned the same prognosis to the same person) is reported in Supplementary Table 3.
Results
Both percentages and complex indicators failed to separate the outcomes of hantavirus-infected patients (Figures 1A,B). Other indicators (including blood cell-related parameters, weight, body mass index, gender, and age) were also unable to distinguish survivors from non-survivors (Supplementary Presentation SF 6). Given the de-identified nature of the data analyzed, the influence of co-morbidities and prior conditions was not assessed. In spite of such limitations, several non-overlapping data distributions differentiated survivors from non-survivors when complex indicators were measured in 3D space and time, as well as outcomes, were also considered (Figures 2A–C and Supplementary Video 1). Analyses conducted with immunological indicators of increasing complexity validated such findings (Figures 2D–H).

Figure 1. No variable, per se, is discriminant. Directly measured variables, such as the relative percentages of lymphocytes (L), monocytes (M), and neutrophils (N) did not separate outcomes of hantavirus-infected humans when measured in 3D space (A). Complex and dimensionless variables (here identified as BAL, BAJ, BAQ, BAS, and BBE) also showed overlapping data distributions when survivors and non-survivors were measured (B). The median L, M, and N percentages, as well as the median BAL, BAJ, BAQ, BAS, and BBE of survivors did not differ at a statistically significant level from those of non-survivors (P > 0.10, Mann-Whitney test).
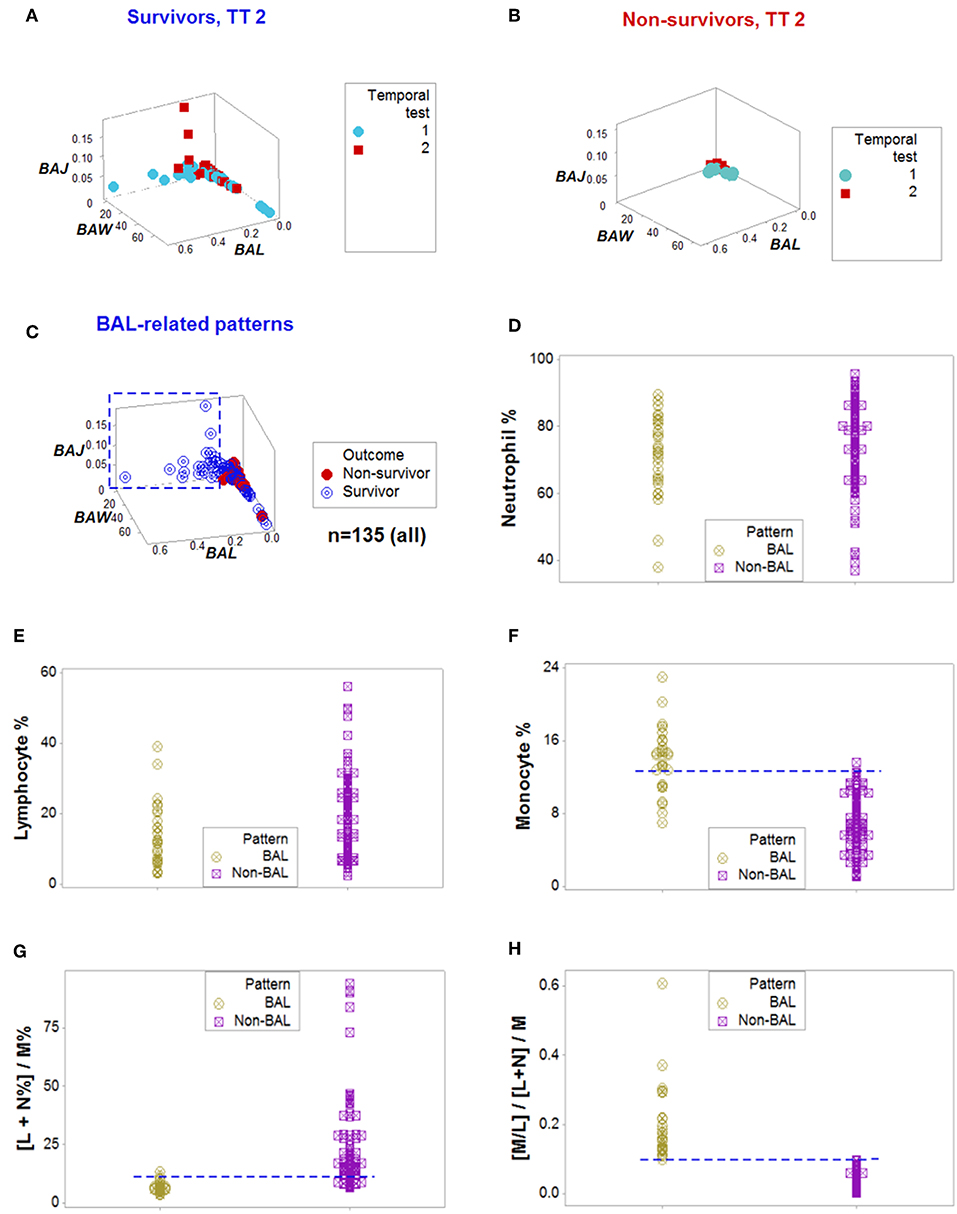
Figure 2. From pattern detection to biological validation. When spatial and temporal patterns were considered, as well as outcomes, emergent and non-random patterns were noticed since temporal test (TT) 2 (A,B). While survivors displayed a perpendicular data departure at TT2 (A), non-survivors exhibited observations with values ~0, at TT 1 and 2 (B). The survivor-only pattern remained at all later testing times (C). Personalized discrimination could be conducted even when the number of observations was n = 1: any one data point located with the rectangle shown in (C) could be predicted to survive. Validation of these patterns was based on a series of analyses of increasing complexity, which included biologically interpretable indicators (D–H). While neither the neutrophil (N) nor the lymphocyte (L) percentages exhibited different intervals between the BAL and non-BAL data subsets (D,E), some differences emerged whern the monocyte (M) percentage was assessed: a horizontal line, shows that most survivors captured by the BAL pattern displayed a higher M percentage, although a substantial data overlapping remained (F). Because the sum of L % and N % is 100– M%, when both the L and N% are included in the numerator of a ratio that measures M% in the denominator, opposite relationships are expected in the two subsets analyzed, which were documented, although some data overlapping was still observed (G). Replacing the M% with a relationship that includes two cell types (the M/L ratio), and also considering the ratio previously demonstrated to partially inform, totally discriminated the two (BAL and non-BAL) subsets (H). Therefore, the subset that only included survivors–and was detectable since the second temporal test– was explained by a triple interaction, which included (i) the M/L and (ii) the [L+N]/M ratios, and (iii) the overall interaction that considered the two previous relationships.
When all the longitudinal data were examined, six data structures predicted 87.5% of all survivors (Figures 3A-L). Outcomes were not randomly distributed: several data structures showed spatially distinct subsets –e.g., orthogonal inflections of data points–, which were only composed of survivors (Figures 3A,C,E,G,I,K). Therefore, discrimination was data-, not hypothesis-driven. While human patients may experience different disease stages at the time they are hospitalized, two additional data structures that only included data available at the first temporal test identified 75% of all survivors (Figures 4A–D). When eight data structures were considered –two that measured the first temporal test and six data structures that considered all temporal data points– 96.9% (31/32) of all survivors were identified (Figures 3, 4, and ST3).
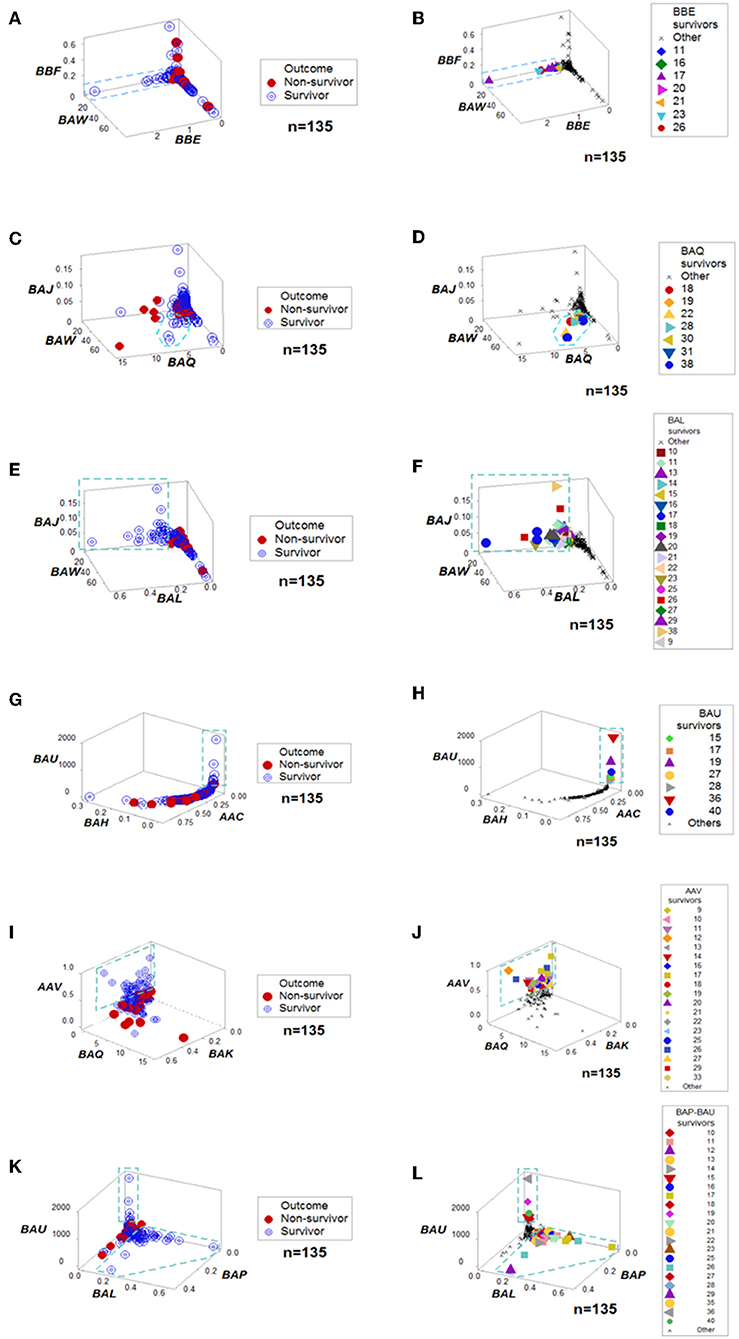
Figure 3. Outcome-specific discrimination. Six data structures revealed distinct patterns among surviving hantavirus-infected humans (A–L). Redundancy (detection of a similar finding, when a different data structure is considered) was demonstrated. For instance, patient #11 was identified as a “survivor” by four data structures (B,F,J,L). Numbers refer to patient identifiers. “Other” refers to both other survivors and all non-survivors.
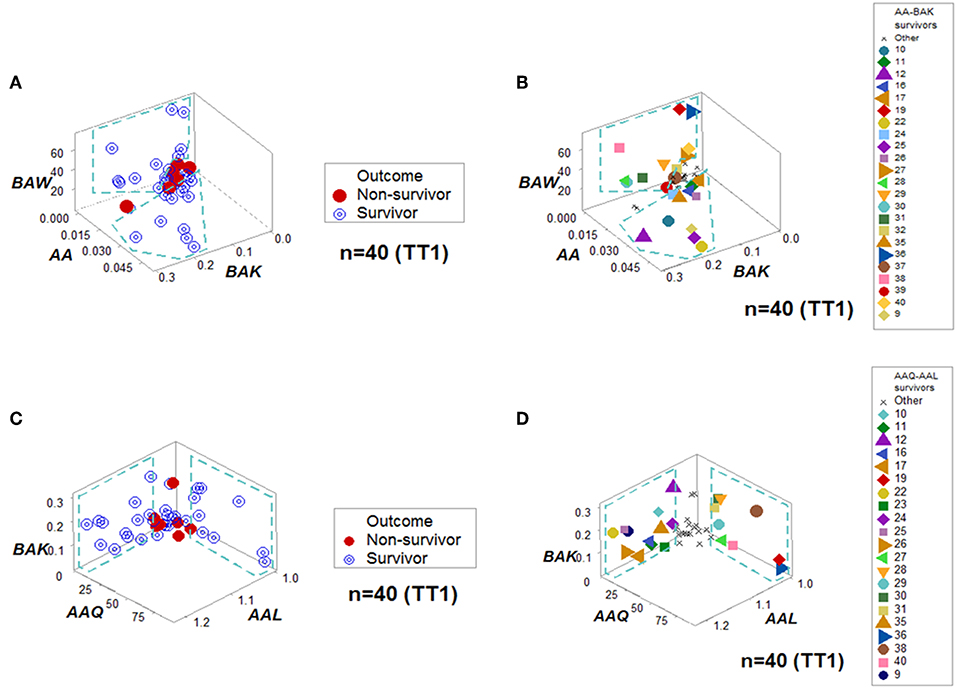
Figure 4. Personalized prediction for survival at admission. Two data structures clustered, at the first temporal test (TT1), 75% (24/32) of all survivors within data ranges that did not include non-survivors. (A,B) denote the patterns and patient identifiers of the first data structure, while (C,D) display those of the second data structure. Twenty of the twenty-four survivors (83.3%) were redundantly predicted.
Dynamics differentiated outcomes. Temporal data inflections (directionalities revealed by arrows that connected temporal points) demonstrated, in survivors, at least four data patterns that non-survivors did not reveal (Figures 5A–H). Spatial dynamics also identified one non-survivor subset that, later, expressed chronic inflammation (higher [L/M]/[N/L] values; Figures 6A–H). Spatial-temporal data patterns also revealed immunological differences. For instance, the high BAL subset displayed a lower and non-overlapping interval of L percentages compared to the high BAK subset (Figure 7A). Validations also informed on pathogenesis: data ranges of immune functions found in survivors were not observed in non-survivors (rectangles, Figures 7A,B). These differences were not due to the 4 times larger number of survivors (n = 32) than non-survivors (n = 8): several data ranges expressed by survivors included more than 4 observations (Figure 7A). In contrast, PCA did not separate hantavirus-related outcomes (Figures 7C,D).
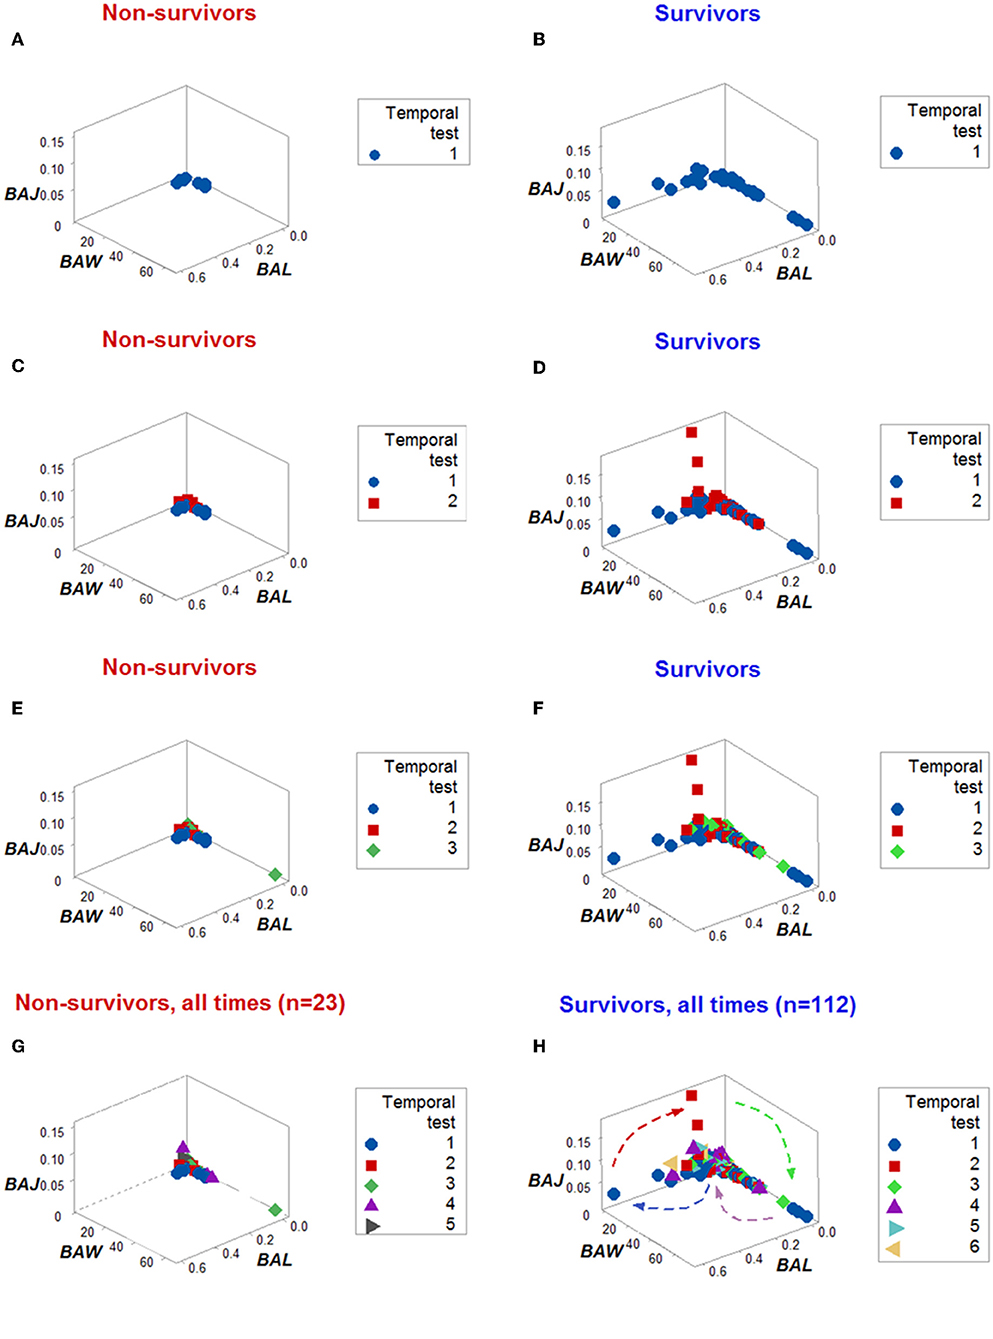
Figure 5. Dynamic pattern-related prognostics (I): survivors. When only the temporal order –not the actual dates– in which patients were tested was plotted, the spatial-temporal patterns created by the directionality of the data distinguished non-survivors (A,C,E,G) from survivors (B,D,F,H).
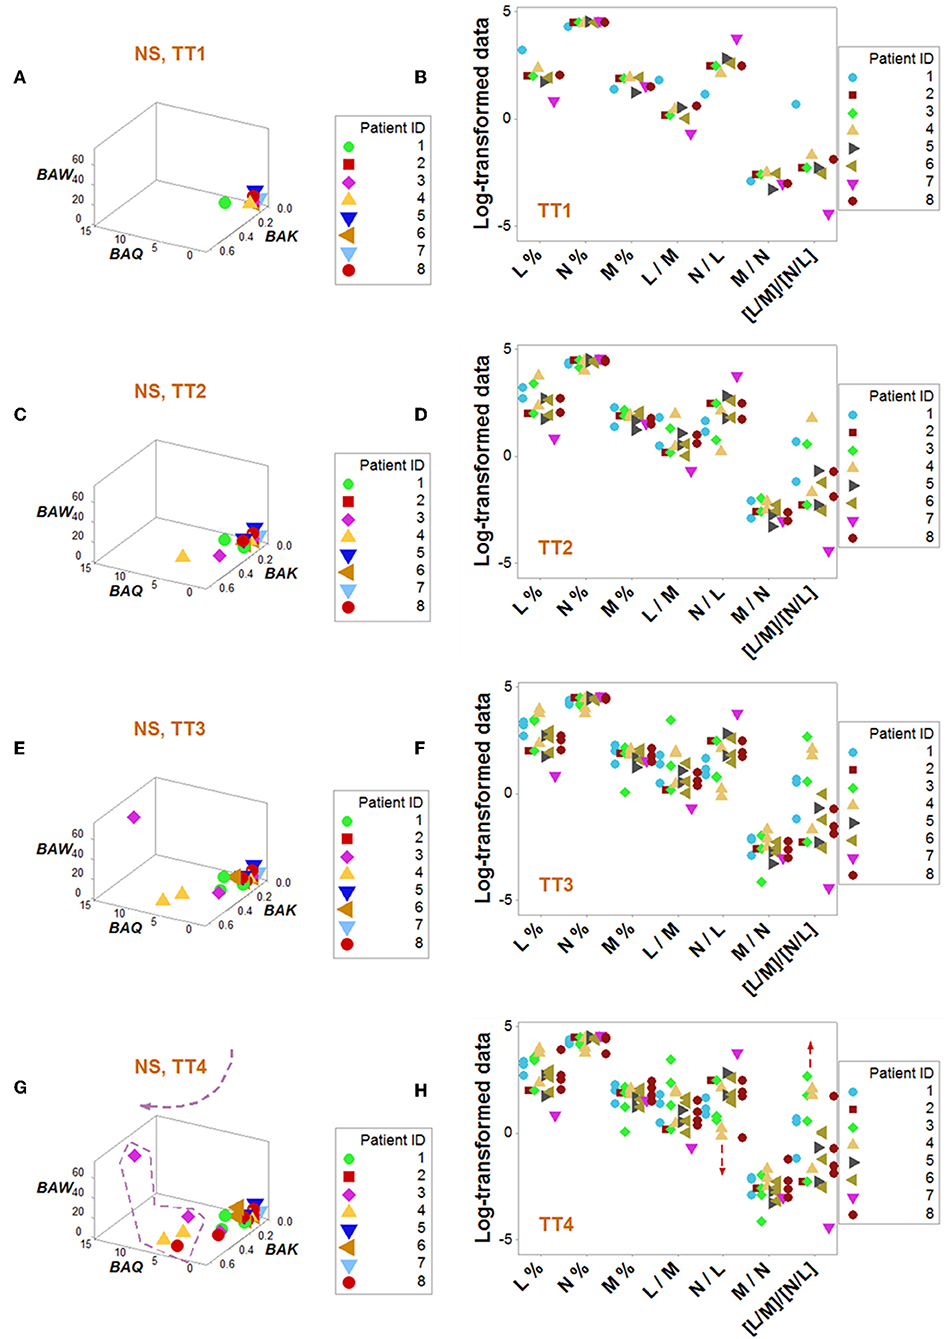
Figure 6. Dynamic pattern-related prognostics (II): non-survivors. Spatial-temporal patterns of non-survivors revealed two subsets (A–H): a subset detected at later times showed lower N/L and higher [L/M]/[N/L] values, i.e., a chronic inflammation (G,H).
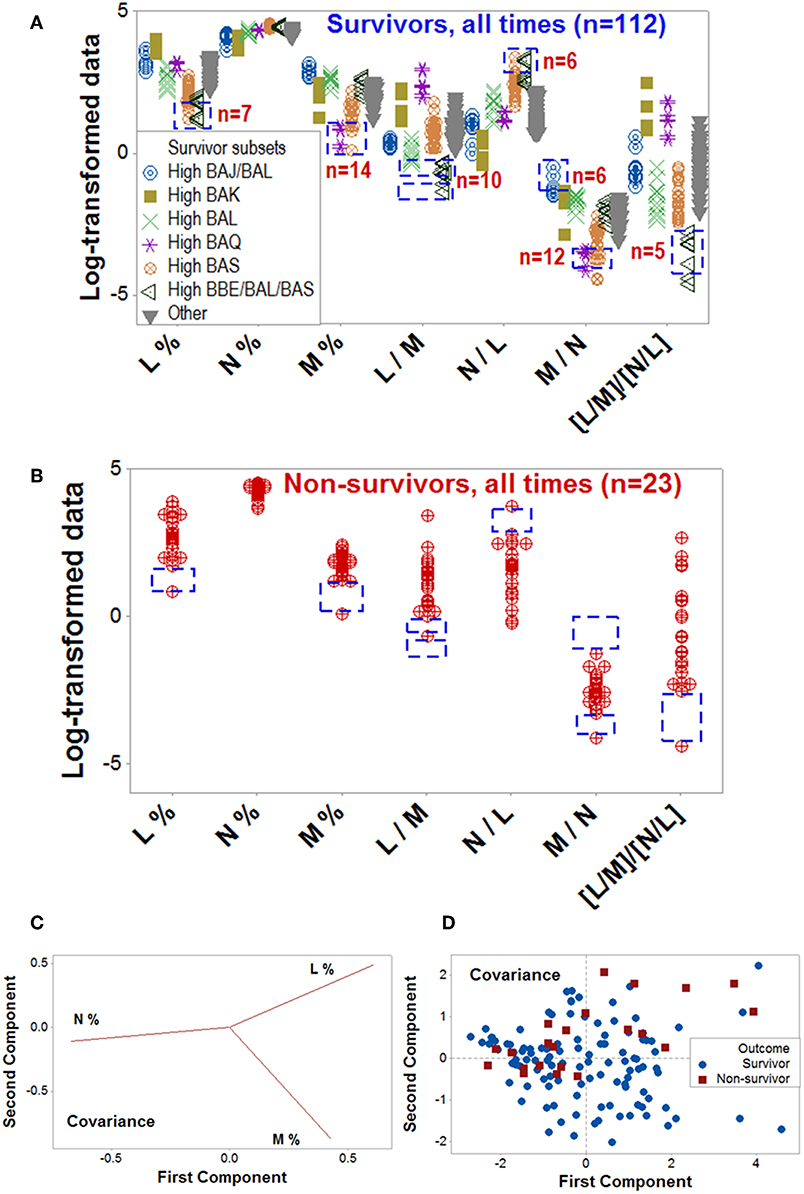
Figure 7. Validation of data patterns and assessment of pathogenesis. The data ranges of some biologically interpretable variables or relationships were explored with data collected at all time points, from all patients (n = 135). Supplementary Video 1 shows a temporal assessment of pathogenesis. Rectangles show some data ranges contributed by survivors (A), which were not displayed by non-survivors (B). While the number of survivors (n = 32) was 4 times higher than non-survivors (n = 8), some differences exceeded the 4:1 ratio, e.g., survivors reported 10 observations within a monocyte percentage interval within which no non-survivor contributed any data point (rectangles, A,B). Unlike the PRM, PCA did not discriminate hantavirus-related outcomes: while the loading plots displayed distinct differences between the three input variables (C), such differences did not result in pattern recognition (D). Because the PCA conducted with the covariance alternative yielded similar results, it is not shown. Initials are defined in Figure 1.
Cross-sectional avian data revealed similar information: classic analyses did not distinguish patterns, even when avian species and geographical location were controlled for (Figures 8A,B). Yet, four data patterns were differentiated when complex indicators were explored in 3D space, which showed non-overlapping intervals of immunologically interpretable variables (Figures 8C–E). While the PRM identified immune profiles compatible with no, early, or late inflammation (Figure 8F), PCA did not reveal patterns (Figures 8G,H).
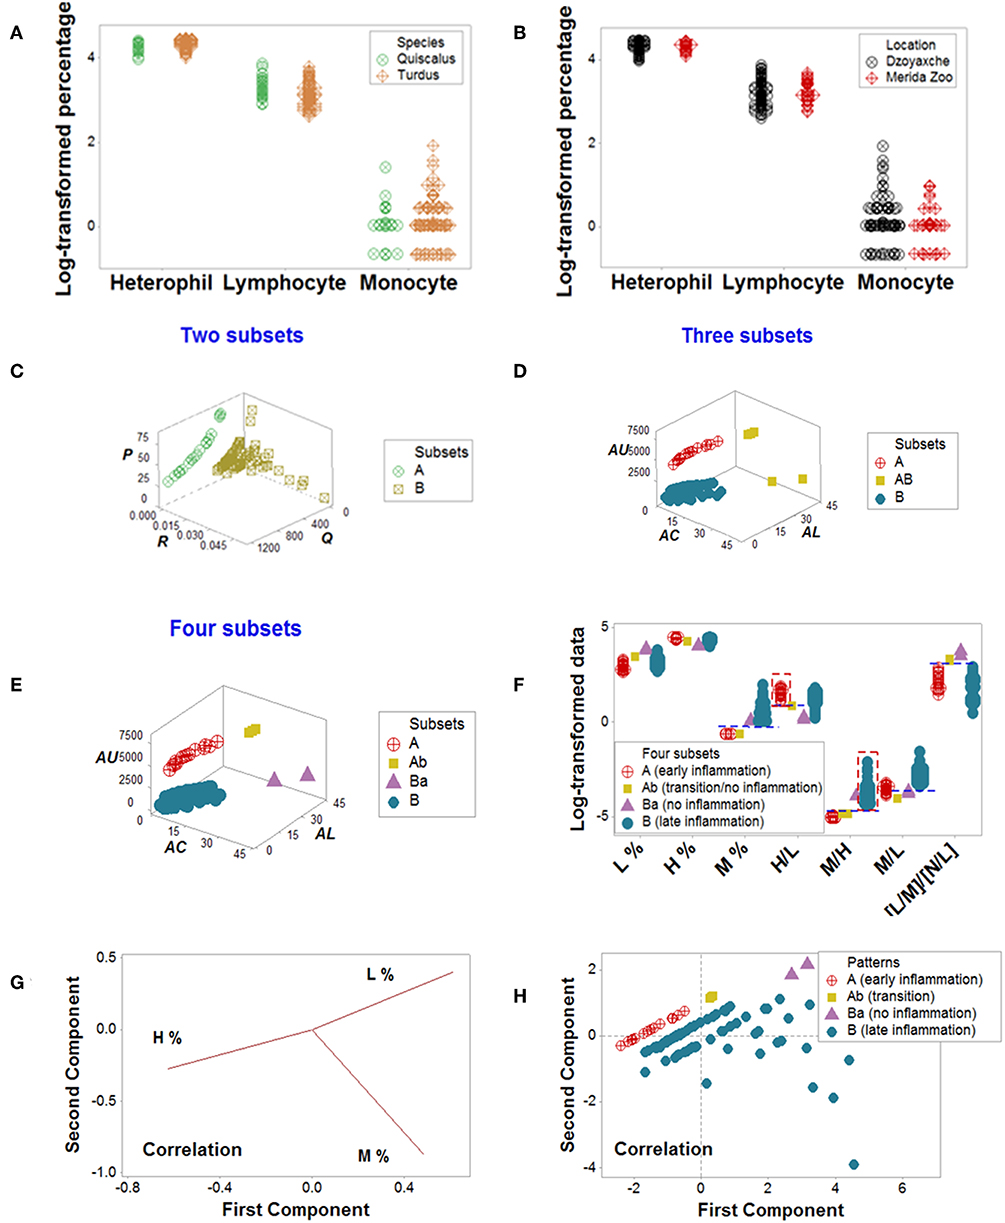
Figure 8. Avian data—PRM and PCA assessments. Simple blood leukocyte indicators did not distinguish geographical sites or avian species (A,B). Several complex data structures revealed the presence of up to four subsets (C–E). When analyzed with biologically interpretable indicators, the data subsets displayed patterns consistent with no, early, or late inflammation (F). The late inflammation group (subset B) showed a significantly higher median M% than the early inflammation group (subset A, P < 0.01). Subset B exhibited a significantly higher median M/H than subset A (P<0.01, F). In contrast, PCA did not discriminate (G, H). Initials: lymphocytes (L), monocytes (M), and heterophils (H, the avian counterpart of mammalian neutrophils).
Discussion
Overview
While the ability to predict mortality in other disease states has been as high as 86% (38–41), the PRM identified 96.9% of survivors. The similar ranges of neutrophil data found in survivors and non-survivors (Figures 5A,B), together with the mononuclear cell-related data differences displayed across outcomes are compatible with a monocyte-mediated increased endothelial permeability previously reported in hantavirus-infected patients (42, 43). As expected, more information was extracted from structured than non-structured data (9, 44–47). A deterministic process was suggested by the fact that eight data structures were enough to prognosticate all but one of the infected survivors. Such a low number of data structures ruled out the hypothesis of random interactions –which would result in a quasi-infinite number of combinations (28)– and also facilitated a rapid analysis.
Emergent immunological patterns were both informative and explanatory. In humans and birds, the PRM identified chronic inflammation. In agreement with reports that describe human persistent inflammation is associated with late (≥14 days) in-hospital death (48), a subset of non-survivors exhibited higher [L/M]/[N/L] values at or after the third temporal test (Figures 6A–H). Birds also displayed a subset characterized by statistically significantly higher median blood monocyte percentages than those characterized by no or early inflammation (Figure 8F). While the mere detection of late inflammation is not a cause of concern, it should be explained when it persists, i.e., when late inflammation becomes chronic (34, 35).
While only cellular variables were investigated in this proof-of-concept, earlier studies have shown that other biological scales –e.g., cell surface molecules– can also be assessed with this method (45, 46). Thus, this multi-scale method can both reveal “one-to-many” and “many-to-one” interactions (“inventions”) and perform validations that unmask (“discover”) complexity (2).
Discoveries
To both visualize underlying patterns and prevent false results, complexity was artificially created and, then, validated. Following established computational approaches (49), the data were artificially augmented with complex indicators. The temporary use of artifacts is a strategy reported in the History of Science: Euclid developed Geometry using a definition (a line is a length or distance lacking thickness) known to be false, although operationally useful (50). To reveal functions that operate over different temporal scales, complex dynamics were not measured with chronological scales, but with biological concepts (e.g., individualized history, complex interactions, and discrete outcomes). To prevent errors, three strategies were applied: (i) pattern recognition, (ii) noise reduction, and (iii) redundancy.
Recognition of immunological patterns occurs when indicators are designed to show some features, such as those of ‘anchors’ and/or ‘amplifiers’ (11). Pattern recognition is further fostered when large numbers of data combinations are derived from the primary (directly measurable) data (45, 47). Noise reduction is one special case of pattern recognition, in which one data point-wide lines of observations are created (44). Because no data variability exists in one data point-wide lines (except along the line), noise is reduced, discrimination is enhanced, temporal changes will be detected because they can only occur along the line, and –when ratios are used– they will be noticed earlier than when counts or percentages are evaluated (44).
“Discoveries” were induced when outcomes were measured and redundancy was practiced (28). To “discover”, neither conceptualizations were essential nor hypothesis-driven research was required. Instead, inferences were based on perception-centered learning, such as data visualizations (51–53). Findings supported the view that evolution is not a random process (54): eight data combinations sufficed to identify all but one of the hantavirus-infected survivors.
The Invention/Discovery Connection
To promote “discoveries” that change over time, two “inventions” were needed. The first “invention” was the artificial complexity introduced in the first step of the analysis. Yet, the PRM construct, alone, did not foster “discoveries” (Figure 1B). Pre-existing but previously unknown phenomena –e.g., information on pathogenesis– were only released when >1000 data combinations were plotted with a spatial and temporal (4D) format. The second “invention” was a movie–like presentation. Only the composite (double invention- and discovery-oriented) method provided a combinatorial and yet, concise operation, which solved numerous problems, including the need for rapid analyses. The combination of hundreds of dynamic plots and a few static figures exposed cloistered patterns, providing a visual process that uses blood leukocytes and concludes within minutes (Supplementary Video 1).
Similarities, Differences, and Complementation With Alternative Approaches
While both PRM and PCA aim at discovering occult patterns, their strategy differs: while PCA emphasizes dimension reduction, the PRM increases the number of data structures available for analysis (2). The inability of PCA to discriminate was not unexpected: PCA is sensitive to linearity and sample size and, in addition, is not well-suited to capture dynamics (36, 55, 56).
It is suggested that the invention- and discovery-oriented method could facilitate the first step (“unsupervised” learning) of machine learning (57). The movie-like features of the PRM could also circumvent the central limitation of printed formats: static information (58).
A Three-In-One Approach
The expanded assessment of biological systems could start a new testing paradigm. If, in addition to the few variables analyzed here, the geo-referenced location of the host and genomic information on the pathogen were also recorded, the three dimensions that involve infections could be simultaneously assessed: the host, the pathogen, and the environment. By capturing many environmental scales –ranging from multi-cellularity (as shown here) to biogeography (59)–, such a method could (i) prognosticate outcomes; (ii) explore pathogenesis; (iii) detect super-spreading pathogens; and (iv) control epidemics (60–62).
Future Steps
Inverse problems were examined with several (although not too many) data structures, which assessed well-conserved properties of biological systems (28, 63, 64). While direct or forward problems have historically predominated in Biomedicine, when the goal is to “discover” what, usually, is not observable, inverse problem-oriented methods may yield more information even when the size of the data analyzed is small–as demonstrated here. Thus, “discovery”-oriented methods may offer an alternative to approaches that require very large datasets, such as “deep learning” (65). It is suggested that, to fully validate, prospective data and interdisciplinary collaborations that include clinicians and methodologists are required.
Author Contributions
AR, GT, and MvR conceived the study. AA, AH, FF, MT, and TB contributed materials, reagents, and data. AR, DP, MvR, JF, and RD wrote the paper.
Funding
This study was partially funded by Conacyt of Mexico (Consejo Nacional de Ciencia y Tecnología, Project No. 133090). No fund was received from any agency in the commercial or non-for-profit sectors.
Conflict of Interest Statement
AR and AH are co-inventors of the temporary guides used to recognize patterns (European Patent Office 2959295). AA and MT were employed by company Stremble Ventures LTD. GT was employed by company GAMA LLC.
The remaining authors declare that the research was conducted in the absence of any commercial or financial relationships that could be construed as a potential conflict of interest.
Acknowledgments
The video production generated by José L. Febles is highly appreciated.
Supplementary Material
The Supplementary Material for this article can be found online at: https://www.frontiersin.org/articles/10.3389/fimmu.2019.01258/full#supplementary-material
References
1. Lee J, Smith KGC. Prognosis in autoimmune and infectious disease: new insights from genetics. Clin Translat Immunol. (2014) 3:e15. doi: 10.1038/cti.2014.8
2. Rivas AL, Leitner G, Jankowski MD, Hoogesteijn AL, Iandiorio MJ, Chatzipanagiotou S, et al. Nature and consequences of biological reductionism for the immunological study of infectious diseases. Front Immunol. (2017)8:612. doi: 10.3389/fimmu.2017.00612
3. Rosslenbroich B. Outline of a concept for organismic systems biology. Sem Cancer Biol. (2011) 21:156–64. doi: 10.1016/j.semcancer.2011.06.001
4. McGee LW, Sackman AM, Morrison AJ, Pierce J, Anisman J, Rokyta DR. Synergistic pleiotropy overrides the costs of complexity in viral adaptation. Genetics. (2016) 202:285–95. doi: 10.1534/genetics.115.181628
5. Csete M, Doyle J. Bow ties, metabolism and disease. Trends Biotechnol. (2004) 22:446–50. doi: 10.1016/j.tibtech.2004.07.007
6. Macklem PT, Seely A. Towards a definition of life. Persp Biol Med. (2010) 53:330–40. doi: 10.1353/pbm.0.0167
7. Earm K, Earm YE. Integrative approach in the era of failing drug discovery and development. Integr Med Res. (2014) 3:211–6. doi: 10.1016/j.imr.2014.09.002
8. Iandiorio MJ, Fair JM, Chatzipanagiotou S, Ioannidis A, Trikka-Graphakos E, Charalampaki N, et al. Preventing data ambiguity in infectious diseases with four-dimensional, earlier, personalized, in vivo evaluations. PLoS ONE. (2016) 11:e0159001. doi: 10.1371/journal.pone.0159001
9. Arango Duque G, Descoteaux A. Macrophage cytokines: involvement in immunity and infectious diseases. Front Immunol. (2014)5:491. doi: 10.3389/fimmu.2014.00491
10. Knowlton ER, Lepone LM, Li J, Rappocciolo G, Jenkins FJ, Rinaldo CR. Professional antigen presenting cells in human herpesvirus 8 infection. Front Immunol. (2013) 3:427. doi: 10.3389/fimmu.2012.00427
11. Rivas AL, Jankowski MD, Piccinini R, Leitner G, Schwarz D, Anderson KL, et al. Feedback-based, system-level properties of vertebrate-microbial interactions. PLoS ONE. (2013) 8:e53984. doi: 10.1371/journal.pone.0053984
12. Hemingway H, Croft P, Perel P, Hayden JA, Abrams K, Timmis A, et al. Prognosis research strategy (PROGRESS) 1: A framework for researching clinical outcomes. BMJ. (2013) 2346:e5595. doi: 10.1136/bmj.e5595
13. Croft P, Altman DG, Deeks JJ, Dunn KM, Hay AD, Hemingway H, et al. The science of clinical practice: disease diagnosis or patient prognosis? evidence about “what is likely to happen” should shape clinical practice. BMC Med. (2015) 13:20. doi: 10.1186/s12916-014-0265-4
14. Dietert R, Piepenbrink MS. Lead and immune function. Crit Rev Toxicol. (2006) 36:359–85. doi: 10.1080/10408440500534297
15. Greenhalgh T, Howick J, Maskrey N. Evidence based medicine: a movement in crisis? BMJ. (2014) 348:g3725. doi: 10.1136/bmj
16. Rivas AL, Quimby FW, Coksaygan O, Alba A, Arina A, Arrobas J, et al. Expression of CD3 and CD11b antigens on blood and mammary gland leukocytes and bacterial survival in milk of cows with experimentally induced Staphylococcus aureus mastitis. Am J Vet Res. (2001) 62:1840–1851. doi: 10.2460/ajvr.2001.62.1840
17. Schittenhelm L, Hilkens CM, Morrison VL. β2 Integrins as regulators of dendritic cell, monocyte, and macrophage function. Front Immunol. (2017) 8:1866. doi: 10.3389/fimmu.2017.01866
18. Emmert-Streib F, Dehmer M. A machine learning perspective on Personalized Medicine: an automized, comprehensive knowledge base with ontology for pattern recognition. Mach Learn Knowl Extr. (2019) 1:149–56. doi: 10.3390/make1010009
19. Krakauer D, Collins JP, Erwin D, Flack JC, Fontana W, Laubichler MD, et al. The challenges and scope of theoretical biology. J Theor Biol. (2011) 276:269–76. doi: 10.1016/j.jtbi.2011.01.051
20. Van Regenmortel MHV. Development of a preventive HIV vaccine requires solving inverse problems which is unattainable by rational vaccine design. Front Immunol. (2018) 8:2009. doi: 10.3389/fimmu.2017.02009
22. Van Regenmortel MHV, Andrieu JM, Dimitrov DS, Ensoli B, Hioe CE, Moog C, et al. Paradigm changes and the future of HIV vaccine research: a summary of a workshop held in Baltimore on 20 November 2013. J AIDS Clin Res. (2014) 5:3. doi: 10.4172/2155-6113.1000281
23. Lu W, Mehraj V, Vyboh K, Cao W, Li T, Routy JP. CD4:CD8 ratio as a frontier marker for clinical outcome, immune dysfunction and viral reservoir size in virologically suppressed HIV-positive patients. J Int AIDS Soc. (2015)18:20052. doi: 10.7448/IAS.18.1.20052
25. Shameer K, Badgeley MA, Miotto R, Glicksberg BS, Morgan JW, Dudley JT. Translational bioinformatics in the era of real-time biomedical, health care and wellness data streams. Brief Bioinf. (2017) 18:105–124. doi: 10.1093/bib/bbv118
26. Depeursinge A, Foncubierta-Rodriguez A, Van De Ville D, Müller H. Three-dimensional solid texture analysis in biomedical imaging: review and opportunities. Med Image Anal. (2014) 18:176–96. doi: 10.1016/j.media.2013.10.005
27. Yan Q. From pharmacogenomics and systems biology to personalized care: a framework of systems and dynamical medicine. Methods Mol Biol. (2014) 1175:3–17. doi: 10.1007/978-1-4939-0956-8_1
28. Seely A, Christou NV. Multiple organ dysfunction syndrome: exploring the paradigm of complex nonlinear systems. Crit Care Med. (2000) 28:2193–200. doi: 10.1097/00003246-200007000-00003
29. Abdi H, Williams LJ. Principal component analysis. WIREs Comp Stat. (2010) 2:433–59. doi: 10.1002/wics.101
30. Safronetz D, Prescott J, Feldmann F, Haddock E, Rosenke R, Okumura A, et al. Pathophysiology of hantavirus pulmonary syndrome in rhesus macaques. Proc Natl Acad Sci USA. (2014) 111:7114–9. doi: 10.1073/pnas.1401998111
31. Bunz H, Weyrich P, Peter A, Baumann D, Tschritter O, Guthoff M, et al. Urinary neutrophil gelatinase-associated lipocalin (NGAL) and proteinuria predict severity of acute kidney injury in Puumala virus infection. BMC Inf Dis. (2015) 15:464. doi: 10.1186/s12879-015-1180-9
32. Pirofski LA, Casadevall A. The damage–response framework as a tool for the physician-scientist to understand the pathogenesis of infectious diseases. J Inf Dis. (2018) 218:S7–11. doi: 10.1093/infdis/jiy083
33. Adly A, Ismail EA, Andrawes NG, El-Saadany MA. Circulating soluble triggering receptor expressed on myeloid cells-1 (sTREM-1) as diagnostic and prognostic marker in neonatal sepsis. Cytokine. (2014) 65:184–191. doi: 10.1016/j.cyto.2013.11.004
34. Franceschi C, Campisi J. Chronic inflammation (inflammaging) and its potential contribution to age-associated diseases. J Gerontol A Biol Sci Med Sci. (2014) 69:S4–S9. doi: 10.1093/gerona/glu057
35. Coussens LM, Werb Z. Inflammation and cancer. Nature. (2002) 420:860–7. doi: 10.1038/nature01322
36. Lenz M, Müller F-J, Zenke M, Schuppert A. Principal components analysis and the reported low intrinsic dimensionality of gene expression microarray data. Sci Rep. (2016) 6:25696. doi: 10.1038/srep25696
37. Ringnér M. What is principal component analysis? Nature Biotechnol. (2008) 26:303–4. doi: 10.1038/nbt0308-303
38. Zhou Y, Dong Y, Zhong Y, Huang J, Lv J, Li J. The cold-inducible RNA-binding protein (CIRP) level in peripheral blood predicts sepsis outcome. PLoS ONE. (2015)10:e0137721. doi: 10.1371/journal.pone.0137721
39. Lam S, Leenen LPH, van Solinge WW, Hietbrink F, Huisman A. Evaluation of hematological parameters on admission for the prediction of 7-day in-hospital mortality in a large trauma cohort. Clin Chem Lab Med. (2011) 49:493–9. doi: 10.1515/CCLM.2011.069
40. Gijsberts C, den Ruijter HM, de Kleijn DPV, Huisman A, ten Berg M, de Groot M, et al. Hematological parameters outperform plasma markers in predicting long-term mortality after coronary angiography. Angiology. (2018) 69:600–8. doi: 10.1177/0003319717743679
41. Ding Y, Wang Y, Zhou D. Mortality prediction for ICU patients combining just-in-time learning and extreme learning machine. Neurocomputing. (2018) 281:12–9. doi: 10.1016/j.neucom.2017.10.044
42. Marsac D, Garcia S, Fournet A, Aguirre A, Pino K, Ferres M, et al. Infection of human monocyte-derived dendritic cells by ANDES Hantavirus enhances proinflammatory state, the secretion of active MMP-9 and indirectly enhances endothelial permeability. Virol J. (2011) 8:223. doi: 10.1186/1743-422X-8-223
43. Bondu V, Bitting C, Poland VL, Hanson JA, Harkins MS, Lathrop S, et al. Upregulation of P2Y2R, active uPA, and PAI-1 are essential components of hantavirus cardiopulmonary syndrome. Front Cell Infect Microbiol. (2018) 8:169. doi: 10.3389/fcimb.2018.00169
44. Fair JM, Rivas AL. Systems biology and ratio-based, real-time disease surveillance. Transb Emerg Dis. (2015) 62:437–45. doi: 10.1111/tbed.12162
45. Leitner G, Blum S, Rivas AL. Visualizing the indefinable: three-dimensional complexity of 'infectious diseases. PLoS ONE. (2015) 10:e0123674. doi: 10.1371/journal.pone.01236742015
46. Rivas AL, Hoogesteijn AL, Piccinini R. Beyond numbers: the informative patterns of staphylococcal dynamics. Curr Pharm Des. (2015) 21:2122–30. doi: 10.2174/1381612821666150310104053
47. Chatzipanagiotou S, Ioannidis A, Trikka-Graphakos E, Charalampaki N, Sereti C, Piccinini R, et al. Detecting the hidden properties of immunological data and predicting the mortality risks of infectious syndromes. Front Immunol. (2016) 7:217. doi: 10.3389/fimmu.2016.00217
48. Horiguchi H, Loftus TJ, Hawkins RB, Raymond SL, Stortz JA, Hollen MK, et al. Innate immunity in the persistent inflammation, immunosuppression, and catabolism syndrome and its implications for therapy. Front Immunol. (2018) 9:595. doi: 10.3389/fimmu.2018.00595
49. Wong SC, Gatt A, Stamatescu V, McDonnell MD. Understanding data augmentation for classification: when to warp? In: Liew AWC, Lovell B, Fookes C, Zhou J, Gao Y, Blumenstein M, Wang Z, editors. Proceedings of the 2016 International Conference on Digital Image Computing: Techniques and Applications, Gold Coast, QLD, p. 1–6.
50. Longo G. A review-essay on reductionism: some reasons for reading In: Chibbaro S, Rondoni L, Vulpiani A, editors Reductionism, Emergence and Levels of Reality. The Importance of Being Borderline. London: Urbanomic (2017) p. 1–5.
51. Zhang M, Gable G, Rai A. Toward principles of construct clarity: exploring the usefulness of Facet Theory in conceptualization. Australas J Inf Syst. (2016) 20:1–16. doi: 10.3127/ajis.v20i0.1123
52. Allen J. Bioinformatics and discovery: induction beckons again. BioEssays. (2001) 23:104–7. doi: 10.1002/1521-1878(200101)23:1<104::AID-BIES1013>3.3.CO;2-U
53. Miwa T, Sakai Y, Hashimoto S. Learning 4-D spatial representations through perceptual experience with hypercubes. IEEE Trans Cogn Dev Sys. (2018)10:250–66. doi: 10.1109/TCDS.2017.2710420
54. Garvin M, Gharrett AJ. Evolution: are the monkeys' typewriters rigged? R Soc Open Sci. (2014) 1:140172. doi: 10.1098/rsos.140172
55. Smilde AK, Westerhuis JA, Hoefsloot HCJ, Bijlsma S, Rubingh CM, Vis DJ, et al. Dynamic metabolomic data analysis: a tutorial review. Metabolomics. (2010) 6:3–17. doi: 10.1007/s11306-009-0191-1
56. Cardot H, Degras D. Online principal component analysis in high dimension: which algorithm to choose? Int Stat Rev. (2018) 86:29–50. doi: 10.1111/insr.12220
57. Kohli M, Prevedello LM, Filice RW, Geis JR. Implementing machine learning in radiology practice and research. AJR. (2017) 208:754–60. doi: 10.2214/AJR.16.17224
58. Mackenzie Owen J. The Scientific Article in the Age of Digitization. Dordrecht: Springer (2007).
59. Hittner JB, Hoogesteijn AL, Fair JM, van Regenmortel MHV, Rivas AL. The third cognitive revolution. EMBO Rep. (2019) 20:e47647. doi: 10.15252/embr.201847647
60. Rivas AL, Anderson KL, Lyman R, Smith SD, Schwager SJ. Proof of concept of a method that assesses the spread of microbial infections with spatially explicit and non-spatially explicit data. Int J Health Geogr. (2008) 7:58. doi: 10.1186/1476-072X-7-58
61. Rivas AL, Chowell G, Schwager SJ, Fasina FO, Hoogesteijn AL, Smith SD, et al. Lessons from Nigeria: the role of roads in the geo-temporal progression of the avian influenza (H5N1). Epid & Inf. (2010) 138:192–198. doi: 10.1017/S0950268809990495
62. Rivas AL, Fasina FO, Hoogesteyn AL, Konah SN, Febles JL, Perkins DJ, et al. Connecting network properties of rapidly disseminating epizoonotics. PLoS ONE. (2012) 7:e39778. doi: 10.1371/journal.pone.0039778
63. Lu J, August E, Koeppl H. Inverse problems from biomedicine. J Mat Biol. (2013) 67:143–68. doi: 10.1007/s00285-012-0523-z
64. Saetzler K, Sonnenschein C, Soto AM. Systems biology beyond networks: generating order from disorder through self-organization. Sem Cancer Biol. (2011) 21:165–74. doi: 10.1016/j.semcancer.2011.04.004
Keywords: personalized prognostics, pathogenesis, infection, inflammation, pattern recognition-based visualization
Citation: Rivas AL, Hoogesteijn AL, Antoniades A, Tomazou M, Buranda T, Perkins DJ, Fair JM, Durvasula R, Fasina FO, Tegos GP and van Regenmortel MHV (2019) Assessing the Dynamics and Complexity of Disease Pathogenicity Using 4-Dimensional Immunological Data. Front. Immunol. 10:1258. doi: 10.3389/fimmu.2019.01258
Received: 19 January 2019; Accepted: 17 May 2019;
Published: 12 June 2019.
Edited by:
José Roberto Mineo, Federal University of Uberlandia, BrazilReviewed by:
Carlo José Freire Oliveira, Universidade Federal do Triângulo Mineiro, BrazilHelioswilton Sales-Campos, Universidade Federal de Goiás, Brazil
Copyright © 2019 Rivas, Hoogesteijn, Antoniades, Tomazou, Buranda, Perkins, Fair, Durvasula, Fasina, Tegos and van Regenmortel. This is an open-access article distributed under the terms of the Creative Commons Attribution License (CC BY). The use, distribution or reproduction in other forums is permitted, provided the original author(s) and the copyright owner(s) are credited and that the original publication in this journal is cited, in accordance with accepted academic practice. No use, distribution or reproduction is permitted which does not comply with these terms.
*Correspondence: Ariel L. Rivas, YWxyaXZhc0B1bm0uZWR1
 Ariel L. Rivas
 Almira L. Hoogesteijn
 Athos Antoniades
 Marios Tomazou
 Tione Buranda
 Douglas J. Perkins1
 Jeanne M. Fair
 Folorunso O. Fasina
 Marc H. V. van Regenmortel