 Anne Troldborg1,2*
 Lisbeth Jensen3
 Bent Deleuran1,3
 Kristian Stengaard-Pedersen1,2
 Steffen Thiel3Jens Christian Jensenius3
- 1Department of Rheumatology, Aarhus University Hospital, Aarhus, Denmark
- 2Institute of Clinical Medicine, Aarhus University, Aarhus, Denmark
- 3Department of Biomedicine, Aarhus University, Aarhus, Denmark
Introduction/objectives: In 2012, hypocomplementemia was included in the classification criteria of systemic lupus erythematosus (SLE). The suggested measurement of C3 or C4 often reflect disease activity poorly. Our objective was to establish an assay measuring C3dg, which is generated following complement activation, and to evaluate the assay in a cross-sectional SLE cohort.
Method: We included SLE patients (n = 169) and controls (n = 170) and developed a modified C3dg assay where C3dg fragments were separated from the large plasma proteins by polyethylene glycol (PEG), and the supernatant containing the C3dg fragment was used for analysis in an antibody-based sandwich-type assay. Gel permeation chromatography and western blotting were used to establish the optimal conditions for PEG precipitation.
Results: 16% PEG was optimal for separating C3dg from C3 and the larger protein fragments. The assay showed a high degree of stability when using EDTA plasma, and measurements correlated well with commercially available complement activation assays. SLE patients had higher concentrations in plasma of C3dg than controls (p < 0.05). ROC analysis showed that the C3dg activation fragment of C3 with an AUC of 0.96 (CI 0.94–0.98) was superior to C3 (AUC 0.52) in differentiating between patients and controls.
Conclusion: Our results present a modified assay for the measurement of C3dg. We demonstrate that C3dg was superior to conventional C3 measurements in discriminating SLE patients from controls. We suggest that C3dg should be considered as a complement activation measurement in the SLE classification criteria.
Introduction
Systemic lupus erythematosus (SLE) is an autoimmune disease involving loss of tolerance to self-antigens, which is manifested in the production of autoantibodies and deposition of complement-fixing immune complexes in injured tissue (1). Activation of the complement system has for decades been known as a significant contributor to SLE pathogenesis (2). However, not all mechanisms leading to complement activation are understood.
In 2012, new classification criteria of SLE were published by the SLICC group (Systemic Lupus International Collaborating Clinics) (3), and expert consensus included low complement protein 3 and 4 (C3 and C4) or low CH50 [complement hemolytic activity (4)] in the classification criteria. There is no explanation for this choice, but it reflects what has been done in the clinic for years. No suggestions of type of assays were given for the measurements of C3, C4, and CH50 in relation to the classification criteria.
The complement system, comprising more than 40 soluble and membrane bound proteins, is activated through three pathways: the classical, the alternative, and the lectin pathway (5). The classical and the lectin pathways are activated through pattern recognition. Serine proteases bound to a pattern-recognition molecule are activated upon recognition of a fitting pattern and through several enzymatic reactions this lead to the activation of the classical and lectin pathway C3-convertase (C4b2a) (6). The alternative pathway is in a state of constant activation, but is at the same time inhibited. There is a continuous hydrolyzes of C3 in the circulation, which potentially can lead to complement activation via the alternative pathway of complement activation. Under normal circumstances, this process is inhibited both in the circulation and at the cell surface (7, 8).
There are several ways to measure complement activation. One way is quantification of C3 and C4 protein (9) or fragments of the cleaved complement factors, e.g., C5a or C3a (10). Other assays estimate capacity of erythrocyte lysis (11) or estimate the level of soluble membrane attack complex (12, 13).
The central component in complement activation is C3 (14). When activated, C3 is cleaved into two fragments: C3a and C3b (14). C3b is further cleaved by factor I into iC3b and finally to C3dg and C3c (14). The smallest fragments C3a has a short half-live (15), while the larger fragment C3dg (37 kDa) has a longer plasma half-life of 4 h (16). C3c showed a shorter half-life than C3dg. Because of its size, C3dg can relatively easy be separated by size from the larger C3 molecules that also comprise the C3dg part [C3, C3(H2O), C3b, and iC3b]. These molecules will collectively here be termed C3′. A method for measuring the C3 split product C3dg was previously introduced using precipitation with 11% polyethylene glycol (PEG) to separate C3dg from C3′ (17). It has, however, not gained routine use. The same is the case for the modified rocket immuno-electrophoresis (18). The so-called double-decker rocket immuno-electrophoresis is used in a few clinical laboratories despite its technical challenges (19).
Our objective was to optimize an assay for the measurement of C3dg using precipitation with PEG followed by C3dg determination in the supernatant by immune assays. Furthermore, to evaluate if C3dg was superior to conventional C3 in discriminating between SLE patients and healthy controls in a cross-sectional cohort of SLE patients.
Materials and Methods
Patients
A cross-sectional cohort of 169 SLE patients were included consecutively at the out-patient clinic at the Department of Rheumatology, Aarhus University Hospital (November, 2015 to August, 2016). Inclusion criteria were fulfilment of the 1997 American College of Rheumatology (ACR) classification criteria for SLE (20), age 18 or above, understanding and speaking Danish. Exclusion criteria were infection, ongoing cancer treatment, and incapacitation. After written consent, clinical data including disease activity, SLE disease activity index (SLEDAI) (21), accumulated organ damage, SLICC/ACR (22), and treatment information were collected. Serum and plasma samples for research purposes were drawn at the same time as samples for routine biochemical assessments. Control samples (n = 170) were collected from blood donors at the blood bank of Aarhus University Hospital, Denmark (December, 2014 to January, 2015) as previously described (23).
Blood collected in EDTA plasma tubes (8 ml) and polystyrene serum tubes (10 ml) (Alere #367525 and #367896) were centrifuged at 2,000 g for 10 min. Plasma and serum were collected and frozen immediately at −80°C. Maximum time from blood drawing until freezing was 2 h.
Assays for C3dg
Time-Resolved Immuno Fluorometric Assay (TRIFMA)
A standard for the assay was generated by activation of serum according to the recommendations of the study group for the manufacture of the International Complement Standard #2 (24). Ten milliliters of serum were incubated for 4 h at 37°C after the admixture of 1 ml heat aggregated human IgG (#007815; CSL Behring GmbH, Germany, 10 mg/ml TBS, aggregated at 63°C for 1 h) and 0.1 g zymosan (Sigma #Z4250). The activation was stopped by adding 550 µl 0.4 M EDTA and 200 µl Futhan (Sigma, 10 mg/ml H2O). Following precipitation with 11% PEG 6000 (w/v), the sample was centrifuged at 10,000 g 4°C for 30 min. The supernatant was collected and used as standard for the assay.
The standard curve was made by dilution of the activated serum standard 1/300 in Tris-buffered saline [0.14 M NaCl, 10 mM Tris, 14 mM sodium azide, with 0.05% (v/v) Tween 20 (TBS/Tween)], and further seven threefold dilutions.
Test samples (EDTA plasma) were pre-diluted 1/4 in TBS, and 40 µl was added to 60 µl TBS, 10 mM EDTA. Samples were kept on ice throughout mixing and dilution to inhibit complement activation. One hundred microliters of 32% PEG in H2O (w/v) were admixed and samples incubated for 1 h followed by centrifugation at 4,000 g 4°C for 15 min. The supernatants were withdrawn and diluted 1/200 in TBS/Tween, reaching a 2,000-fold dilution of the starting plasma sample. Duplicates of 100 µl were added to Fluoro Nunc MaxiSorb microtiter plates (Nunc, #437958 or #43791) previously coated by incubation overnight at room temperature (RT) with 100 µl rabbit anti-human C3dg (DAKO cat. no. A0063), mistakenly termed “anti-human C3d” (confirmed by correspondence with DAKO), at 5 µg/ml PBS and blocked by incubation with HSA at 1 mg HSA/ml TBS followed by wash with TBS-Tween. After each step, the wells were washed three times with TBS/Tween. Development after incubation overnight at 4°C was with the same anti-C3dg antibody as used for coating only now the antibody was biotinylated as previously described (25). One hundred microliters of biotin-anti-C3dg, 1 µg/ml TBS/Tween, were added to the wells and incubated 2 h at RT. After washing, 25 ng of Eu3+-streptavidin (Perkin Elmer #1244-360) in 100 µl TBS/Tween, 25 µM EDTA was added and incubated for 1 h at RT. After washing, 200 µl enhancement buffer (Ampliqon laboratory reagents #Q99800) was added to each well. Plates were read by time-resolved fluorometry using a DELFIA-reader Victor5 + (Perkin Elmer®) full TRIFMA protocol can be found Data Sheet 2 in Supplementary Material.
Enzyme-Linked Immune Sorbent Assay (ELISA)
The assay was also tested in an ELISA format identical to the above, except after incubation with biotinylated antibody and wash, 100 µl horseradish peroxidase (HRP)–streptavidin (DAKO #PO397) diluted 1/500 in TBS/Tween was added and incubated 1 h at RT. After washing, 100 µl substrate (Sigma #P4922-capsules and #A9941-tablets) was added and incubated for 30 min at 37°C. Plates were read at 405 nm on Victor5+ full ELISA protocol can be found Data Sheet 1 in Supplementary Material.
Assay for C3′
The assay was performed analogous to the C3dg TRIFMA (excluding PEG precipitation). Wells were coated with rabbit anti-human C3c (DAKO #Q0368, 1 µg/ml TBS), and the development was with the same antibody biotinylated in-house at 1 µg/ml. The standard curve was constructed with dilutions of the serum pool assigned a value of 1 AU C3/ml. The test plasma samples were diluted 750,000-fold in TBS/Tw, 5 mM EDTA.
Optimizing the PEG Precipitation
Plasma proteins were precipitated with increasing concentrations of PEG from 10 to 19% (w/v). Precipitations were done as in the assay described above with PEG being added at 20–38% (w/v). C3dg in the supernatants was estimated as described above.
Gel Permeation Chromatography (GPC)
Samples of serum, supernatant of PEG precipitated activated serum and EDTA-plasma supernatant after precipitation with either 11 or 16% PEG (w/v), were subjected to GPC on a Superose 6 10/300 GL column (GE Healthcare). The running buffer was TBS/Tween, 5 mM EDTA. Samples were diluted 1:1 in buffer and 200 µl was loaded on the column. Fractions of 0.25 ml were collected in pure polystyrene microtiter plates (Nunc #249570), which were pre-blocked by incubation with TBS-Tween. C3dg in the fractions was quantified as described above.
Western Blots
Samples of supernatants and precipitates after admixture of PEG were added to 1/4 volume sodium dodecyl sulfate-polyacrylamide gel electrophoresis (SDS-PAGE) sample buffer [30 mM Tris–HCl, 10% (v/v) glycerol, 8 M urea, 3% (w/v) SDS, 0.1% (w/v) bromophenol blue, pH 8.9]. TBS/Tween was added to reach the desired sample volume (30–45 µl). One-tenth volume of dithiothreitol (DDT), 0.6 M, was added to the samples to be reduced, and iodoacetic acid, 1.4 M, 1/10 vol, was added to all samples applied to gels containing both reduced and non-reduced samples. Samples were denatured at 100°C for 3 min. Proteins were separated on 4–15% gradient gels (Bio-Rad, Criterion TGX gels #567-1083). Following electrophoresis, the proteins were blotted onto nitrocellulose membranes (Bio-Rad #170-4159). The membranes were then blocked by incubation for 30 min at RT in TBS with 0.1% Tween (v/v), washed, and developed with polyclonal rabbit anti-human-C3dg (DAKO #0063) at 1 µg/ml or polyclonal rabbit anti-human-C3c (DAKO #0368) in primary buffer [Tris-buffered saline, 1 mM EDTA, pH 7.4, with 1 mg human serum albumin (CSL Behring #109697) and 100 µg human IgG (CSL Behring #007815) per ml]. Membranes were subsequently washed and incubated with HRP-conjugated goat anti-rabbit IgG antibody (DAKO #P0448) diluted 1/3,000 in secondary buffer (TBS/Tween, 100 µg human IgG/ml, 1 mM EDTA, pH 7.4). After washing, the blots were developed with SuperSignal West Dura extended-duration substrate (Pierce), and emission recorded by a charge-coupled device camera.
Storage, Freeze/Thaw, and Diurnal Variation
To test the stability of the assay, regarding handling of samples, we initially tested both serum and EDTA plasma. Samples were tested after 0, 1 h, and 5 h at RT, and at 1 and 5 h at 37°C. Blood collected in EDTA was left for 5 h at RT or 5 h at 37°C before centrifugation and collection of plasma.
To test the stability of the samples to freezing/thawing cycles, a pool of EDTA plasma was aliquoted in 500 µl samples, frozen at −80°C, and thawed 1–9 times. Each thaw cycle was 1 h at RT.
Influence of diurnal variation on complement activation was investigated on six healthy individuals with samples taken at 4 h intervals through 24 h.
Comparison With Commercial Assays
Immunoassays were bought from Hycult Biotech, estimating a C3c neo determinant (# HK368-02), Nordic Biosite, estimating a C3d neo determinant (#KSP-305) and Quidel, estimating C4d (#A008). Seventeen SLE samples and seventeen controls were randomly picked and run on all assays according to the manufacture’s description.
Twelve SLE patients were randomly picked to have C3d measured at the hospital of Vejle, Denmark, using a double-decker rocket immuno-electrophoresis method (19).
Statistics
Checking the data for normality by Q–Q plots and histograms revealed that Gaussian distribution could not be assumed. Log-transformation did not improve normality significantly. Therefore, non-parametric tests were used for the statistical analysis. The Mann–Whitney U-test was used for comparison of plasma levels of the proteins in patients and controls and correlation analysis was performed calculating Spearman’s rank correlation coefficient. For comparison of repeated measurements, the Kruskal–Wallis test was used. p-Values <0.05 were considered statistically significant. Stata version 12 and GraphPad Prism software package (version 6.0) were used for data management and statistical calculations.
Ethics
Clinical investigations were conducted according to the Declaration of Helsinki. The Danish Data Protection Agency and The Regional Committee on Health Research Ethics approved the study (case #1-10-72-214-13).
Results
Patients and Controls
The cohort of SLE patients (Table 1) was comparable to other Caucasian cohorts. Controls had a mean age of 45 (SD 15) at inclusion and 90% were female making them comparable to our SLE cohort with respect to age and gender.
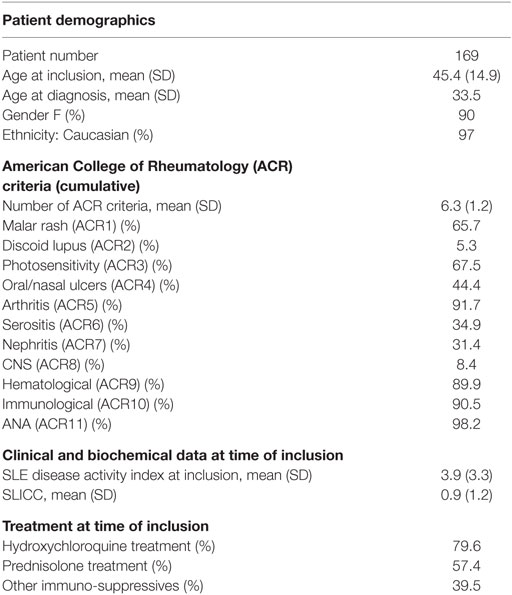
Table 1. Systemic lupus erythematosus patient demographics.
Assay
To test whether the activation of our standard was successful, we ran GPC of non-activated serum and supernatant of PEG-precipitated serum (Figure 1A). Before activation (red) most C3dg is found in the large fragments (C3′), whereas after activation and precipitation of the activated serum, the supernatant (blue) contained only the smaller C3dg fragment. We further PEG-precipitated EDTA plasma to find out which PEG% would be the best to separate C3dg from C3′ (Figure 1B) and found a plateau at 16% PEG, suggesting this would be the optimal concentration.
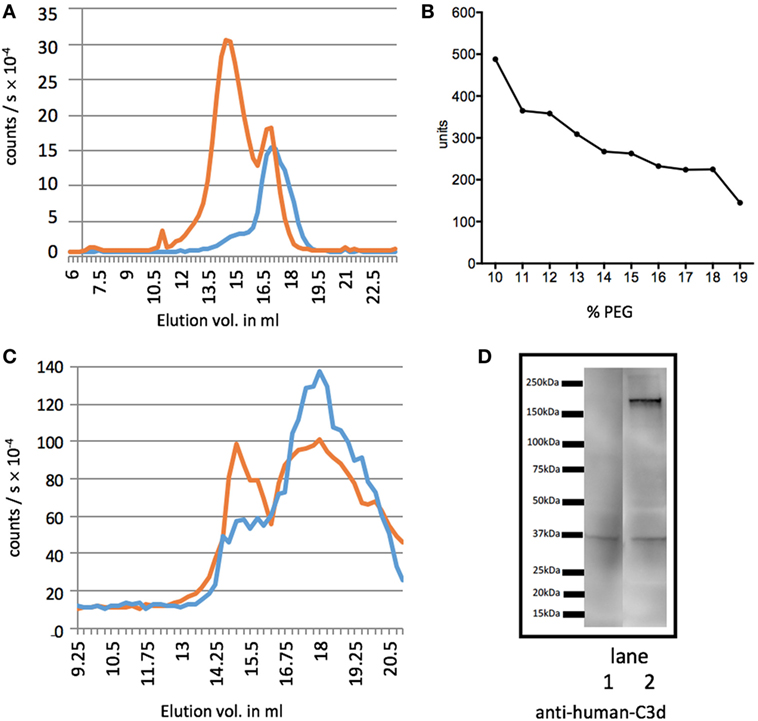
Figure 1. Separation of C3dg from the larger C3 fragments. Measurements of C3 molecules encompassing the determinants of the segment C3dg, i.e., C3 and all degradation molecules containing this part of C3. (A) The figure illustrates C3dg measurement on gel permeation chromatography (GPC) fractions of serum before activation (red line) and supernatant of polyethylene glycol (PEG)-precipitated activated serum (blue line). (B) Test for the optimal concentration of PEG for precipitation. Increasing concentrations of PEG were added to EDTA plasma and C3dg was estimated in the supernatants. (C) GPC of supernatant after precipitation of EDTA plasma with 11% (red) and 16% (blue) PEG. C3dg in the fractions was measured. The 11% supernatant shows two major peaks, the first corresponding to C3 and larger C3 components, and the second corresponding to free C3dg. After precipitation with 16% PEG the first was significantly reduced. Panel (D) shows the results of western blotting of supernatants of EDTA-plasma precipitated with 16% (lane 1) or 11% (lane 2) PEG. The samples (corresponding to 0.1 µl plasma) were run non-reduced on the SDS-PAGE. The blot was developed with anti-C3d antibody. It can be seen that the 11% PEG supernatant still contains appreciable amounts of larger C3dg-encompassing molecules. This was repeated three times with similar results.
To compare the previously suggested PEG concentration of 11% (w/v) to our choice of 16% (w/v), we ran GPCs of samples after precipitation with both PEG concentrations (Figure 1C) (17). Using 16% PEG-precipitation reduced the C3′ peak (blue Figure 1C) and showed the supernatant predominantly contained C3dg.
We then investigated the efficiency of precipitation with 11 and 16% PEG by western blotting. The result shown in Figure 1D illustrate that 16% PEG is superior to 11% in precipitating all fragments larger than C3dg. We observed that both free C3dg and larger C3dg-containing components, C3′, were present in the supernatant after PEG-precipitation with 11% (lane 2), whereas precipitation with 16% PEG (lane 1) yielded a much cleaner separation of free C3dg from the other components, supporting the results illustrated in Figures 1B,C. A more detailed analysis by western blot is presented in Figure S1 in Supplementary Material in which fragments of C3 is visualized in different samples developed with either anti-C3c or anti-C3d antibodies.
We observed that the concentration of C3dg in serum increased with both the time and the temperature to which the samples were exposed (Figure 2A). By contrast, no significant increase in C3dg was seen in EDTA plasma (Figure 2B). Freeze–thaw cycles of EDTA-plasma showed an increase in C3dg concentration in samples after four freeze–thaw cycles (p < 0.05) (Figure 2C). The concentration of C3dg in plasma did not display significant diurnal variation (p = 0.19) (Figure 2D).
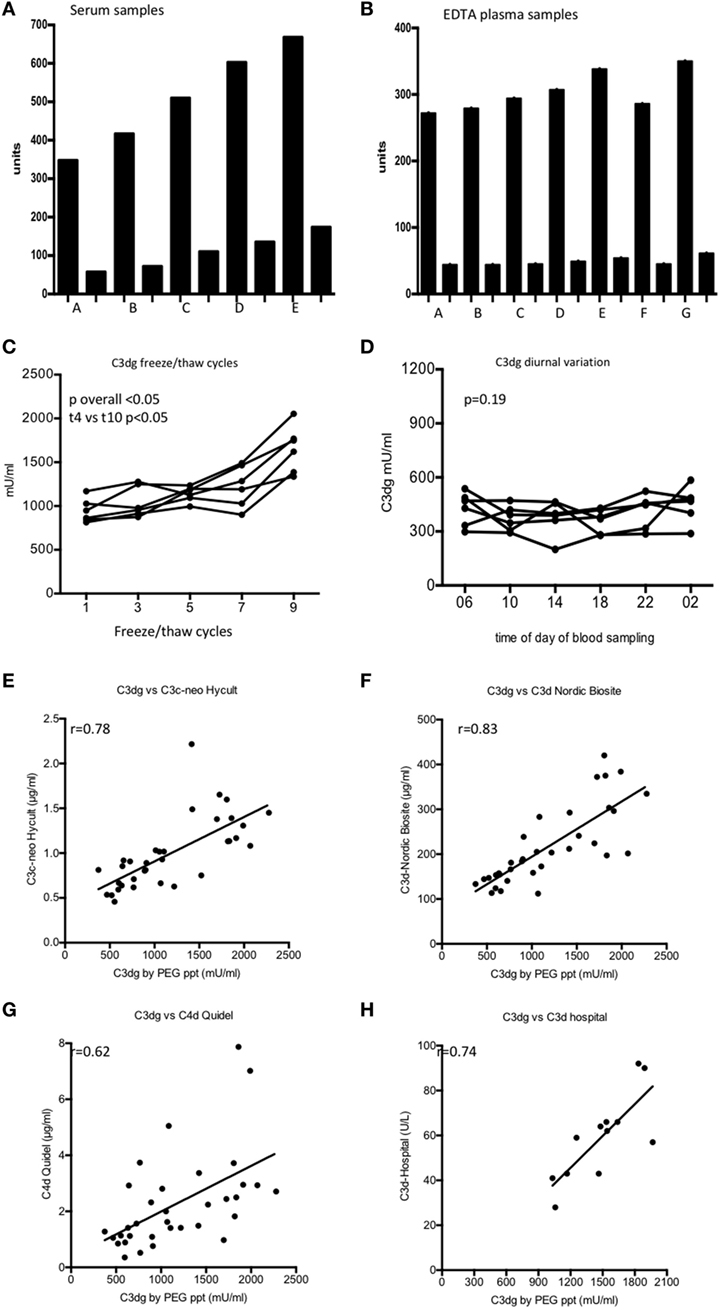
Figure 2. C3dg measured on samples handled in different ways from the time of blood withdrawal until measurement. (A) shows the result using serum and (B) shows the results using EDTA plasma. Each sample was diluted 100 (tall columns) and 1,000-fold (short columns). (A) Samples frozen t = 0, (B) samples frozen after 60 min at room temperature (RT), (C) samples frozen after 60 min at 37°C, (D) samples frozen t = 5 h at RT, (E) samples frozen t = 5 h 37°C, (F) EDTA plasma left 1 h at RT before centrifugation, (G) EDTA plasma left 5 h at RT before centrifugation. (C) The samples were tested for sensitivity to freeze/thaw cycles using six EDTA plasma samples. Samples were frozen up to 10 times each followed by thawing at RT for 1 h. C3dg was measured after 2nd, 4th, 6th, 8th, and 10th thawing. (D) C3dg diurnal variation. Six controls had blood drawn at six time points during 24 h, and C3dg was estimated. For comparison of the repeated measurements, the Kruskal–Wallis test was used. (E) Comparison between our assay and enzyme-linked immune sorbent assay (ELISA) kit from Hycult Biotech (C3c-neo determinants). (F) Comparison with ELISA kit from Nordic Biocite (C3d). (G) Comparison to ELISA kit from Quidel (C4d). 34 samples [17 systemic lupus erythematosus (SLE) and 17 controls] were analyzed in all kits. (H) Twelve randomly chosen SLE samples had C3d measured using the double rocket immuno-electrophoresis (19). The same samples were measured in our C3dg assay. To assess the correlation between the assays, Spearman correlation was used.
The performance of our assay was compared to three commercially available assays for complement activation products (Figures 2E–G). Significant correlations (p < 0.05) were observed with all assays. Furthermore, our C3dg results were compared with the results obtained by double-decker rocket immuno-electrophoresis on plasma from 12 randomly picked patients (Figure 2H) (r = 0.74, p < 0.05).
As ELISA is used more frequently than TRIFMA, it was considered expedient to subject the analysis of the PEG supernatants to assay by ELISA. The results were similar when comparing the two assays (r = 0.91, p < 0.0001) (Figure 3).
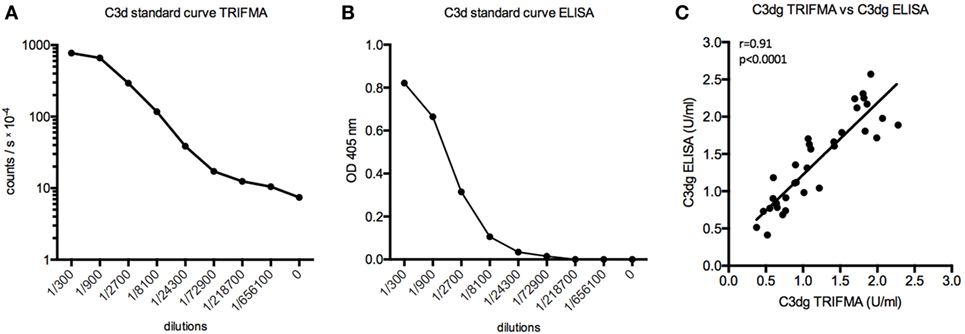
Figure 3. Time-resolved immuno fluorometric assay (TRIFMA) and enzyme-linked immune sorbent assay (ELISA) C3dg assays compared. (A) shows the standard curve of the assay carried out using europium-label (TRIFMA) and (B) as ELISA. (C) Correlation (Spearman) between measurements of C3dg on EDTA plasma samples using our assay as TRIFMA and as ELISA.
Complement Activation in SLE Patients and Controls
No significant difference was observed between SLE patients and controls for C3′, the value routinely determined as the C3 concentration (p = 0.211, Figure 4A). SLE patients showed higher C3dg concentrations in plasma compared with controls (p < 0.0001, Figure 4B). The C3dg/C3′ ratio was calculated for SLE patients and controls and showed a clear difference (p < 0.0001, Figure 4C).
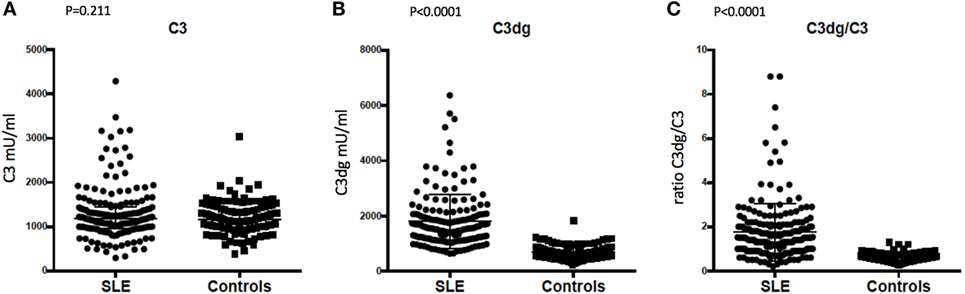
Figure 4. Comparison of concentrations in plasma of (A) C3, (B) C3dg, and (C) C3dg/C3 ratio in systemic lupus erythematosus (SLE) patients and healthy controls (measured by time-resolved immuno fluorometric assay). The Mann–Whitney U test was used for the comparison.
C3dg and SLEDAI did not show any correlation (r = 0.03, p = 0.71). C3dg/C3′ correlated to SLEDAI (r = 0.28, p < 0.001) as did C3 (r = −0.49, p < 0.001), which was no surprise, since C3 is part of the SLEDAI score.
ROC-curves were made based on the measurements of C3, C3dg, and C3dg/C3 (Figure 5). C3dg was superior in separating patients from controls with an area under the curve of 0.96 (CI 0.94–0.98) (Figures 5A,B). When estimating sensitivity and specificity based on different cutoffs, C3dg yielded the best combination of both high sensitivity and high specificity (Figure 5C), revealing a much larger complement turnover in SLE patients than reflected by the C3 measurements.
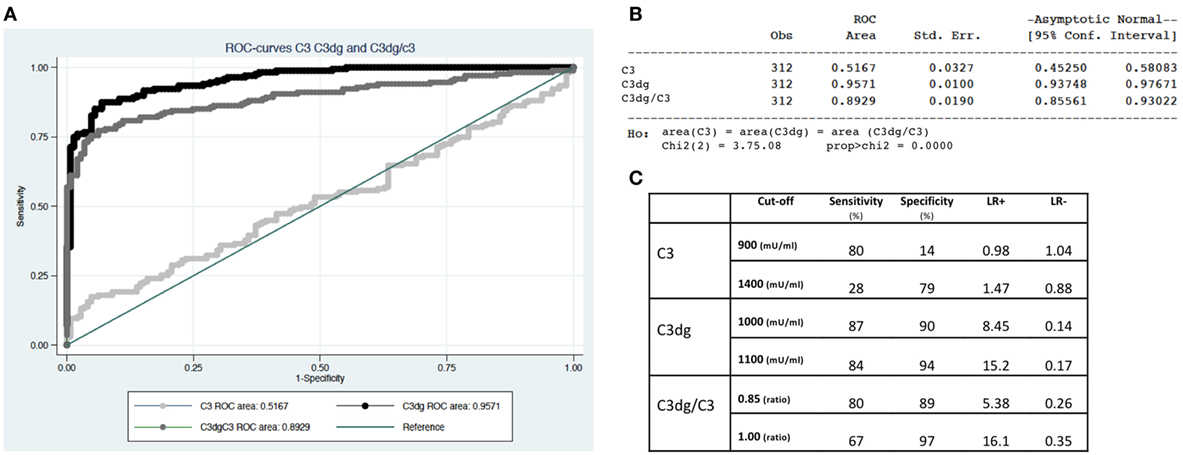
Figure 5. Separation of systemic lupus erythematosus patients from controls using C3, C3dg, and C3dg/C3. (A) demonstrates ROC-curves for C3 (light gray), C3dg (black), and C3dg/C3 (dark gray). (B) represents calculations of area under the curve with 95% confidence intervals for each of the curves in Figure 1B. (C) shows calculations of sensitivity, specificity, and likelihood ratios for C3, C3dg, and C3dg/C3 using two different cutoffs for each measurement.
Discussion
Low complement C3, C4, and CH50 were introduced into the classification criteria of SLE in 2012 (3), reflecting an international acceptance of the importance of complement in the diagnosis. However, in many cases of SLE, low C3 or C4 poorly reflect disease activity, as patients often present with low levels irrespectively of disease activity (26, 27). Our newly developed C3dg assay was clearly superior to the conventional C3 measurement in discriminating SLE patients from controls both with regards to specificity and sensitivity. Thus, C3dg may be a valuable diagnostic biomarker in SLE.
Instead of simply estimating C3 or C4 and interpreting low levels as evidence for complement activation or consumption, it seems more relevant to directly evaluate ongoing complement activation. Several assays have been published for estimating complement activation products without being widely implemented. With a half-life of 4 h, C3dg is an ideal candidate for evaluating ongoing complement activation. As mentioned in the Section “Introduction,” some procedures for estimating C3dg use precipitation of large proteins with PEG, followed by various assays for measurement of C3dg in the supernatant, have been published. The PEG concentration suggested in the first paper describing this idea (17), i.e., 11%, has been used in all the subsequent reports. We here re-addressed this issue and as illustrated with both GPC and western blot (Figures 1B–D), it appears expedient to increase the PEG concentrations to separate the large C3 components, here termed C3′, from C3dg (Figure 1). The PEG-C3dg assay has also been applied to samples from SLE patients. Significantly higher levels of C3dg have consistently been reported in patients compared with controls (11, 17, 19, 26, 28, 29). Also, the improvement gained using the C3dg/C3 ratio have been reported (11). Considering the sizable literature on this subject, it seems surprising that C3dg assays have received little clinical attention.
The C3dg estimation proved stable using EDTA-plasma. It is clear, however, that even with the addition of EDTA, complement activation is not completely inhibited unless samples are kept cold and not thawed multiple times. This underlines the necessity of handling samples similarly when comparing cohorts (30). Control samples were stored for approximately a year longer than patient samples, and at least for EDTA plasma, storage at minus 80°C seemed to stop complement activation, as controls displayed considerable lower C3dg than patients. Another concern, when using blood for measurements is whether or not the component of interest displays diurnal variation. This is the case for several proteins and hormones (31, 32). We, however, observed no significant diurnal variation in complement activation reflected by C3dg.
The plasma concentration of C3 and C4 show inter-individual variation (33). Concentrations depend to a large extend on synthesis; however, SLE patients often show low levels of C4 due to a partial genetic defect (34, 35). Low C4, therefore, does not necessarily reflect consumption. Thus, it is dubious to use a single complement measurement for diagnostic/clinical purposes. Intuitively, therefore, it makes sense to use the C3dg/C3′ ratio, as previously suggested by Röther et al. (29). If initial concentration of intact complement components influences the concentration upon activation, it is reasonable to correct for this by calculating the C3dg/C3 ratio. Whether this measurement can be used for clinical purposes, e.g., to rule out a flare, remains to be tested on a prospective cohort. We demonstrated that the use of C3, as suggested in the SLE classification criteria, was not optimal for the SLE diagnosis. We found that C3dg was significantly higher in SLE patients than in healthy controls, whereas this was not the case for C3. C3dg showed superiority with regard to both sensitivity and specificity compared with C3. The performance of C3dg as a criterion for classification of SLE should be further evaluated by comparing SLE with other diseases.
The study raises the question of why most SLE patients have higher C3dg concentrations in plasma than controls (Figure 4). It likely indicates that in most patients there is complement turnover, even under conditions where patients are regarded as having inactive disease (36). The alternative pathway is an essential amplification loop in the activation of the complement system (37, 38). We know that lack of control of the alternative pathway potentially leads to devastating disease (39, 40). A possible explanation for higher C3dg in patients could be a relative lack of inhibition of the alternative pathway, making it easier to tip the balance to non-inhibition in cases of infection, cancer, sun exposure, and trauma, all known causes of SLE flares. Studies on lupus-prone mice have demonstrated exacerbation of disease with inadequate cell level complement inhibition (41). In line with this, low factor H has been associated with lupus nephritis (42). Another possible explanation could be anti-C3-antibodies. As reported by Vasilev et al., anti-C3-antibodies bind to the C3c part of C3 and thus bind C3, iC3b, C3b, and C3c (43). The antibodies likely compete for the same binding site as factor H, thereby hindering inhibition at the cell surface (43). Thus, one would expect patients with anti-C3-antibodies to have higher levels of C3dg because of more complement activation. Future studies are warranted to elucidate this in SLE patients.
We present a modified assay for measuring C3dg. The assay is simple, inexpensive, and stable. The estimation of C3dg directly reflects complement turnover independently of activation pathway. The assay differentiated excellently between SLE patients and healthy controls. We propose that C3dg measurements should be evaluated as a standard complement activation measurement in patients with SLE particularly with respect to classification.
Ethics Statement
Clinical investigations were conducted according to the Declaration of Helsinki. The Danish Data Protection Agency and The Regional Committee on Health Research Ethics approved the study (case #1-10-72-214-13).
Author Contributions
AT and LJ performed the laboratory experiments. AT was in charge of collecting blood samples and handling the blood samples after they were drawn. AT, BD, and KS-P handled patient inclusion and clinical assessments. ST and JJ developed the assays used in the project and supervised laboratory procedures. AT, ST, JJ, and KS-P wrote the manuscript. All authors participated in the editing of the article.
Conflict of Interest Statement
The authors declare that the research was conducted in the absence of any commercial or financial relationships that could be construed as a potential conflict of interest.
Acknowledgments
The authors would like to acknowledge all patients participating in the project. We thank Kristina Nilsson-Ekdahl for generous advice and help comparing C3dg assays.
Funding
The Danish Rheumatism Association (Grant nr: R122-A3031) and Aase and Ejnar Danielsens Fond supported the project.
Supplementary Material
The Supplementary Material for this article can be found online at https://www.frontiersin.org/articles/10.3389/fimmu.2018.00581/full#supplementary-material.
References
1. Bao L, Cunningham PN, Quigg RJ. Complement in lupus nephritis: new perspectives. Kidney Dis (Basel) (2015) 1:91–9. doi:10.1159/000431278
2. Sturfelt G, Truedsson L. Complement and its breakdown products in SLE. Rheumatology (Oxford) (2005) 44:1227–32. doi:10.1093/rheumatology/keh719
3. Petri M, Orbai A-M, Alarcón GS, Gordon C, Merrill JT, Fortin PR, et al. Derivation and validation of the systemic lupus international collaborating clinics classification criteria for systemic lupus erythematosus. Arthritis Rheum (2012) 64:2677–86. doi:10.1002/art.34473
4. Costabile M. Measuring the 50% haemolytic complement (CH50) activity of serum. J Vis Exp (2010) 37:1923. doi:10.3791/1923
5. Bajic G, Degn SE, Thiel S, Andersen GR. Complement activation, regulation, and molecular basis for complement-related diseases. EMBO J (2015) 34:2735–57. doi:10.15252/embj.201591881
6. Kjaer TR, Le LTM, Pedersen JS, Sander B, Golas MM, Jensenius JC, et al. Structural insights into the initiating complex of the lectin pathway of complement activation. Structure (2015) 23:342–51. doi:10.1016/j.str.2014.10.024
7. Meri S, Pangburn MK. Discrimination between activators and nonactivators of the alternative pathway of complement: regulation via a sialic acid/polyanion binding site on factor H. Proc Natl Acad Sci U S A (1990) 87:3982–6. doi:10.1073/pnas.87.10.3982
8. Zewde N, Gorham RD, Dorado A, Morikis D. Quantitative modeling of the alternative pathway of the complement system. PLoS One (2016) 11:e0152337. doi:10.1371/journal.pone.0152337
9. Nived O, Sturfelt G. ACR classification criteria for systemic lupus erythematosus: complement components. Lupus (2004) 13:877–9. doi:10.1191/0961203304lu2027oa
10. Mollnes TE, Kirschfink M. Complement analysis in clinic and research. Adv Exp Med Biol (2006) 586:361–80. doi:10.1007/0-387-34134-X_24
11. Ekdahl KN, Norberg D, Bengtsson AA, Sturfelt G, Nilsson UR, Nilsson B. Use of serum or buffer-changed EDTA-plasma in a rapid, inexpensive, and easy-to-perform hemolytic complement assay for differential diagnosis of systemic lupus erythematosus and monitoring of patients with the disease. Clin Vaccine Immunol (2007) 14:549–55. doi:10.1128/CVI.00486-06
12. Mollnes TE, Lea T, Frøland SS, Harboe M. Quantification of the terminal complement complex in human plasma by an enzyme-linked immunosorbent assay based on monoclonal antibodies against a neoantigen of the complex. Scand J Immunol (1985) 22:197–202. doi:10.1111/j.1365-3083.1985.tb01871.x
13. Morgan BP. The membrane attack complex as an inflammatory trigger. Immunobiology (2016) 221:747–51. doi:10.1016/j.imbio.2015.04.006
14. Merle NS, Church SE, Fremeaux-Bacchi V, Roumenina LT. Complement system part I – molecular mechanisms of activation and regulation. Front Immunol (2015) 6:262. doi:10.3389/fimmu.2015.00262
15. Norda R, Schött U, Berséus O, Akerblom O, Nilsson B, Ekdahl KN, et al. Complement activation products in liquid stored plasma and C3a kinetics after transfusion of autologous plasma. Vox Sang (2012) 102:125–33. doi:10.1111/j.1423-0410.2011.01522.x
16. Teisner B, Brandslund I, Grunnet N, Hansen LK, Thellesen J, Svehag SE. Acute complement activation during an anaphylactoid reaction to blood transfusion and the disappearance rate of C3c and C3d from the circulation. J Clin Lab Immunol (1983) 12:63–7.
17. Perrin LH, Lambert PH, Miescher PA. Complement breakdown products in plasma from patients with systemic lupus erythematosus and patients with membranoproliferative or other glomerulonephritis. J Clin Invest (1975) 56:165–76. doi:10.1172/JCI108065
18. Bourke BE, Moss IK, Maini RN. Measurement of the complement C3 breakdown product C3d by rocket immunoelectrophoresis. J Immunol Methods (1982) 48:97–108. doi:10.1016/0022-1759(82)90214-9
19. Brandslund I, Siersted HC, Svehag SE, Teisner B. Double-decker rocket immunoelectrophoresis for direct quantitation of complement C3 split products with C3d specificities in plasma. J Immunol Methods (1981) 44:63–71. doi:10.1016/0022-1759(81)90107-1
20. Hochberg MC. Updating the American College of Rheumatology revised criteria for the classification of systemic lupus erythematosus. Arthritis Rheum (1997) 40:1725. doi:10.1002/art.1780400928
21. Bombardier C, Gladman DD, Urowitz MB, Caron D, Chang CH. Derivation of the SLEDAI. A disease activity index for lupus patients. The committee on prognosis studies in SLE. Arthritis Rheum (1992) 35:630–40. doi:10.1002/art.1780350606
22. Gladman DD, Goldsmith CH, Urowitz MB, Bacon P, Fortin P, Ginzler E, et al. The Systemic Lupus International Collaborating Clinics/American College of Rheumatology (SLICC/ACR) damage index for systemic lupus erythematosus international comparison. J Rheumatol (2000) 27:373–6.
23. Troldborg A, Hansen A, Hansen SWK, Jensenius JC, Stengaard-Pedersen K, Thiel S. Lectin complement pathway proteins in healthy individuals. Clin Exp Immunol (2017) 188(1):138–47. doi:10.1111/cei.12909
24. Bergseth G, Ludviksen JK, Kirschfink M, Giclas PC, Nilsson B, Mollnes TE. An international serum standard for application in assays to detect human complement activation products. Mol Immunol (2013) 56:232–9. doi:10.1016/j.molimm.2013.05.221
25. Mao S-Y. Biotinylation of antibodies. Methods Mol Biol (2010) 588:49–52. doi:10.1007/978-1-59745-324-0_7
26. Charlesworth JA, Peake PW, Golding J, Mackie JD, Pussell BA, Timmermans V, et al. Hypercatabolism of C3 and C4 in active and inactive systemic lupus erythematosus. Ann Rheum Dis (1989) 48:153–9. doi:10.1136/ard.48.2.153
27. Birmingham DJ, Irshaid F, Nagaraja HN, Zou X, Tsao BP, Wu H, et al. The complex nature of serum C3 and C4 as biomarkers of lupus renal flare. Lupus (2010) 19:1272–80. doi:10.1177/0961203310371154
28. Manzi S, Rairie JE, Carpenter AB, Kelly RH, Jagarlapudi SP, Sereika SM, et al. Sensitivity and specificity of plasma and urine complement split products as indicators of lupus disease activity. Arthritis Rheum (1996) 39:1178–88. doi:10.1002/art.1780390716
29. Röther E, Lang B, Coldewey R, Hartung K, Peter HH. Complement split product C3d as an indicator of disease activity in systemic lupus erythematosus. Clin Rheumatol (1993) 12:31–5. doi:10.1007/BF02231555
30. Pfeifer PH, Kawahara MS, Hugli TE. Possible mechanism for in vitro complement activation in blood and plasma samples: futhan/EDTA controls in vitro complement activation. Clin Chem (1999) 45:1190–9.
31. Thompson DK, Sloane R, Bain JR, Stevens RD, Newgard CB, Pieper CF, et al. Daily variation of serum acylcarnitines and amino acids. Metabolomics (2012) 8:556–65. doi:10.1007/s11306-011-0345-9
32. Kage A, Fenner A, Weber B, Schöneshöfer M. Diurnal and ultradian variations of plasma concentrations of eleven adrenal steroid hormones in human males. Klin Wochenschr (1982) 60:659–66. doi:10.1007/BF01716798
33. Sebastián-Gámbaro MA, Lirón-Hernández FJ, Fuentes-Arderiu X. Intra- and inter-individual biological variability data bank. Eur J Clin Chem Clin Biochem (1997) 35:845–52.
34. Lintner KE, Wu YL, Yang Y, Spencer CH, Hauptmann G, Hebert LA, et al. Early components of the complement classical activation pathway in human systemic autoimmune diseases. Front Immunol (2016) 7:36. doi:10.3389/fimmu.2016.00036
35. Yih Chen J, Ling Wu Y, Yin Mok M, Jan Wu Y-J, Lintner KE, Wang C-M, et al. Effects of complement C4 gene copy number variations, size dichotomy, and C4A deficiency on genetic risk and clinical presentation of systemic lupus erythematosus in east Asian populations. Arthritis Rheumatol (2016) 68:1442–53. doi:10.1002/art.39589
36. Swaak AJ, Hannema A, Vogelaar C, Boom FA, van Es L, van Aalst R, et al. Determination of the half-life of C3 in patients and its relation to the presence of C3-breakdown products and/or circulating immune complexes. Rheumatol Int (1982) 2:161–6. doi:10.1007/BF00286138
37. Harboe M, Ulvund G, Vien L, Fung M, Mollnes TE. The quantitative role of alternative pathway amplification in classical pathway induced terminal complement activation. Clin Exp Immunol (2004) 138:439–46. doi:10.1111/j.1365-2249.2004.02627.x
38. Harboe M, Garred P, Karlstrøm E, Lindstad JK, Stahl GL, Mollnes TE. The down-stream effects of mannan-induced lectin complement pathway activation depend quantitatively on alternative pathway amplification. Mol Immunol (2009) 47:373–80. doi:10.1016/j.molimm.2009.09.005
39. Tan PL, Bowes Rickman C, Katsanis N. AMD and the alternative complement pathway: genetics and functional implications. Hum Genomics (2016) 10:23. doi:10.1186/s40246-016-0079-x
40. DeZern AE, Brodsky RA. Paroxysmal nocturnal hemoglobinuria: a complement-mediated hemolytic anemia. Hematol Oncol Clin North Am (2015) 29:479–94. doi:10.1016/j.hoc.2015.01.005
41. Miwa T, Zhou L, Maldonado MA, Madaio MP, Eisenberg RA, Song W-C. Absence of CD59 exacerbates systemic autoimmunity in MRL/lpr mice. J Immunol (2012) 189:5434–41. doi:10.4049/jimmunol.1201621
42. Wang F, Yu F, Tan Y, Song D, Zhao M. Serum complement factor H is associated with clinical and pathological activities of patients with lupus nephritis. Rheumatology (Oxford) (2012) 51:2269–77. doi:10.1093/rheumatology/kes218
Keywords: complement system, complement activation, systemic lupus erythematosus, biomarker, diagnostics
Citation: Troldborg A, Jensen L, Deleuran B, Stengaard-Pedersen K, Thiel S and Jensenius JC (2018) The C3dg Fragment of Complement Is Superior to Conventional C3 as a Diagnostic Biomarker in Systemic Lupus Erythematosus. Front. Immunol. 9:581. doi: 10.3389/fimmu.2018.00581
Received: 14 December 2017; Accepted: 07 March 2018;
Published: 26 March 2018
Edited by:
Robert Braidwood Sim, University of Oxford, United KingdomReviewed by:
Brian Reilly, Texas Tech University, United StatesLubka T. Roumenina, INSERM UMRS 1138, France
Copyright: © 2018 Troldborg, Jensen, Deleuran, Stengaard-Pedersen, Thiel and Jensenius. This is an open-access article distributed under the terms of the Creative Commons Attribution License (CC BY). The use, distribution or reproduction in other forums is permitted, provided the original author(s) and the copyright owner are credited and that the original publication in this journal is cited, in accordance with accepted academic practice. No use, distribution or reproduction is permitted which does not comply with these terms.
*Correspondence: Anne Troldborg, YW5uZXRyb2xAcm0uZGs=