
94% of researchers rate our articles as excellent or good
Learn more about the work of our research integrity team to safeguard the quality of each article we publish.
Find out more
ORIGINAL RESEARCH article
Front. Imaging, 24 February 2025
Sec. Imaging Applications
Volume 4 - 2025 | https://doi.org/10.3389/fimag.2025.1502613
 Giacomo Talevi1†
 Luigi Pannone1†
 Domenico Giovanni Della Rocca1Antonio Sorgente1Rani Kronenberger2Ingrid Overeinder1
 Gezim Bala1
 Alexandre Almorad1Erwin Ströker1Juan Sieira1Mark La Meir2Andrea Sarkozy1Pedro Brugada1Gian Battista Chierchia1
 Ali Gharaviri1
 Carlo de Asmundis1*
Background: Automatic digital photogrammetry produces digital reproductions of objects using photographs. The aim of this study is to analyze feasibility of photogrammetry for electroanatomic map (EAM) reconstruction from different mapping systems. Furthermore, the possibility to import the reconstructed EAMs in a common working space is evaluated.
Methods: All consecutive patients undergoing EAM with one of the following EAM systems were screened for the study: (1) CARTO™; (2) Ensite™ X; (3) Rhythmia™; (4) Affera™ PRISM-3. All patient geometries were reconstructed from a video acquisition within the source EAM software. The video obtained was processed with Zephyr software and a dense point cloud was obtained. An image or sequence of images was selected to build a 3D mesh. At the end, the mesh was imported in the 3D graphics software Blender.
Result: A total of 24 EAMs from 24 patients were included in the study. All EAMs were reconstructed with success using photogrammetry from all 4 mapping systems assessed. The process time was ≈ 25 min. In particular, EAMs were as follows: left atrium (2 Carto; 2 Ensite; 5 Rhythmia; 2 Affera), right atrium (1 Carto; 6 Ensite; 3 Affera) and left ventricles (1 Carto; 2 Ensite). All the reconstructed EAMs were imported in Blender with success. They could be visualized in Blender and all the operations were allowed including moving EAMs in a common working space and EAMs overlap.
Conclusion: This study demonstrated for the first time the possibility of realizing 3-D objects from digital video formats of different EAMs.
• Photogrammetry is feasible for electroanatomic mapping (EAM) reconstruction from different EAM systems and different cardiac chambers.
• The workflow described allows to import the reconstructed EAMs in a 3D working space.
• This study demonstrates for the first time the possibility of realizing three-dimensional objects from digital object video formats of different EAMs.
• It also describes the possibility to perform operations on reconstructed EAMs, such as translations and overlapping, in a common working space.
In the last decades, advances in medical technology have revolutionized the field of cardiac electrophysiology, offering new diagnostic and therapeutic tools for the management of cardiac rhythm disorders (Sy et al., 2012). Among these, electroanatomic mapping (EAM) systems are vital for accurately assessing heart electrical activity and are indispensable in diagnosing and guiding ablation procedures (de Groot et al., 2003). The CARTO system (Biosense Webster Inc., Diamond Bar, California, USA), developed by Biosense Webster, has continued to represent a milestone in three-dimensional cardiac mapping. Through the use of a catheter equipped with magnetic sensors, the Carto system offers detailed visualization of cardiac anatomy, with an average distance error < 1 mm, and electrical activity in real time (Gepstein et al., 1997). Boston Scientific's Rhythmia system (Rhythmia™, Boston Scientific Corporation, Cambridge, MA) introduced an innovative approach to high-density mapping. Leveraging advanced technology, this system stands out for its ability to acquire a large number of electrical data points, enabling detailed mapping and a better understanding of the heart's electrical dynamics (Viswanathan et al., 2017). Ensite system (St. Jude Medical Inc., St. Paul, Minnesota, USA), developed by Abbott, has established its position as a reliable and versatile EAM system. Its ability to integrate electrophysiological data without using fluoroscopy with anatomical images offers clinicians precise guidance during ablation procedures (Eitel et al., 2010).
EAM allows to project cardiac signals onto an anatomical shell. The result is an image integrating anatomical and electrical data. Three main mapping methods have developed over time (Koutalas et al., 2015). Contact- based electroanatomical mapping, where the 3D mesh is representative of the electrical activity acquired by the catheters through direct contact with the anatomical structure (Gepstein et al., 1997; Jiang et al., 2009; Wittkampf et al., 1999; Marchlinski et al., 2000; Sanders et al., 2005). Non-contact and Multi-electrode Mapping, which involves using an inverse mathematical solution of Laplace's law to project onto an already constructed 3D mesh, virtual unipolar far-field EGMs (Thiagalingam et al., 2004; Kumagai and Nakashima, 2009; Hindricks and Kottkamp, 2001). Non-invasive cardiac mapping where epicardial surface potentials of the heart derived from torso potentials and projected onto the cardiac mesh processed from images derived from the patient's CT scan (Rudy, 2010). However, different EAM systems have been developed by different companies. This implies a limited possibility of manipulation for the relevant clinical images and of cross correlation on a common platform.
Photogrammetry enables the creation of precise three-dimensional models of photographed objects. It utilizes several mathematical formulations as well as acquisition tools (Fritsch et al., 2021). Meshes are generated through SfM (structure of motion) methods through algorithms such as SIFT (scale-invariant features trans-form) that allow the identification of shared characteristics between images (Westoby et al., 2012). Nowadays, due to its evolution, Automatic Digital Photogrammetry is a science used in various fields (Donato et al., 2020; Reinoso et al., 2018; Bemis et al., 2014; Hampel and Maas, 2003; Talevi et al., 2023; Kucukkaya, 2004). In the medical field, our group was the first to describe the use of Photogrammetry for mapping reconstruction. We employed Photogrammetry to reconstruct and manipulate electroanatomic maps generated from non-invasive ECGs in Brugada syndrome, highlighting its diagnostic implications (Talevi et al., 2023; Kucukkaya, 2004; Talevi et al., 2022). This integration of advanced techniques offers unprecedented opportunities for comparative diagnostic and educational applications, bridging the gap between electrophysiological maps and detailed three-dimensional EAM models.
The aim of this study is to analyze feasibility of photogrammetry for EAM reconstruction from different mapping systems using video media material acquired consistently between the different systems. Furthermore, the possibility to import the reconstructed EAM in a common working space for the purpose of creating educational tools and for research purpose is evaluated.
All consecutive patients undergoing EAM with one of the following EAM systems were screened for the study: (1) CARTO™ system (Biosense Webster Inc., Diamond Bar, California, USA); (2) Ensite™ X system (St. Jude Medical Inc., St. Paul, Minnesota, USA); (3) Rhythmia™ system (Boston Scientific Corporation, Cambridge, MA); (4) Affera™ PRISM-3 system (Medtronic Inc, Minneapolis, MN). They were included if the following inclusion criteria were fulfilled: (1) Complete EAM of the cardiac chamber of interest; (2) High-density catheter mapping (Pentaray or Octaray for CARTO, HD-Grid for Ensite X, IntellaMap Orion for Rhythmia or Sphere-9 for Affera).
In this study, all different patient geometries were reconstructed from a video acquisition of the EAM within the source EAM software. Maps from both atria and ventricles were considered. The study complied with the Declaration of Helsinki as revised in 2013; the ethic committee approved the study.
The methodology used in this study is the extraction of multimedia information through the photogrammetric reconstruction of digital objects. The video format “.mp4” was chosen as the input data acquisition process to simplify and speed up the acquisition process. Videos were taken by making a 360-degree horizontal turn, around the EAM, starting from the Postero-anterior (or PA) view. If a geometric abnormality was seen, a map was also acquired vertically at 360 degrees after returning to the initial position at the end of the horizontal turn. The videos duration was according to the possibilities offered by the source software. The information obtained was processed with 3DF Zephyr 7.507 (3DFlow©) software. The data were loaded into the software in video format, from which the frames for 3D reconstruction were extracted in.jpg format.
Images were processed with Zephyr 7.507(3DFlow©). The final 3D volume can be created with this software that extracts a dense point cloud and then selects an image or sequence of images to build a 3D mesh (Figure 1). In addition, the software allows new calibrations to be added and previously performed automatic calibrations to be modified. Interactions are then created through an interface that offers selection based on camera orientation, category and preset. The program works semi-automatically. After loading the image, the Masquerade tool on Zephyr is used if necessary and the reconstruction parameters are set. Masquerade software is used if an error, like including the background in the geometry, occurs. The predefined categories are divided into Generic Objects, Aerial Photos, Urban Environment, Human Body, Superficial Scans and Vertical Structures. The most appropriate category can be selected according to the type of object to be processed. Presets are divided into Fast Scan, Basic Scan and Deep Scan. For the purposes of our study, reconstructions were carried out using the Deep Superficial scan option. When this did not produce satisfactory results or the software presented an error in the reconstruction preventing the procedure from being completed, the images were processed manually. The advanced parameters were used consistently for all map reconstruction as follows: Keypoint sensibility: low; matching type: default; Matching stage depth: high; Tie-points quantity: very high; Reconstruction engine: Incremental; Bounding box method: Discard outliers. At the end of the process, the software allows users to export the mesh in formats compatible with the 3D graphics software Blender 3.5 (Blender Foundation). Within Blender, different maps can be imported and managed simultaneously in a shared workspace, serving primarily as a visualization tool to enhance the presentation and interpretation of the data.
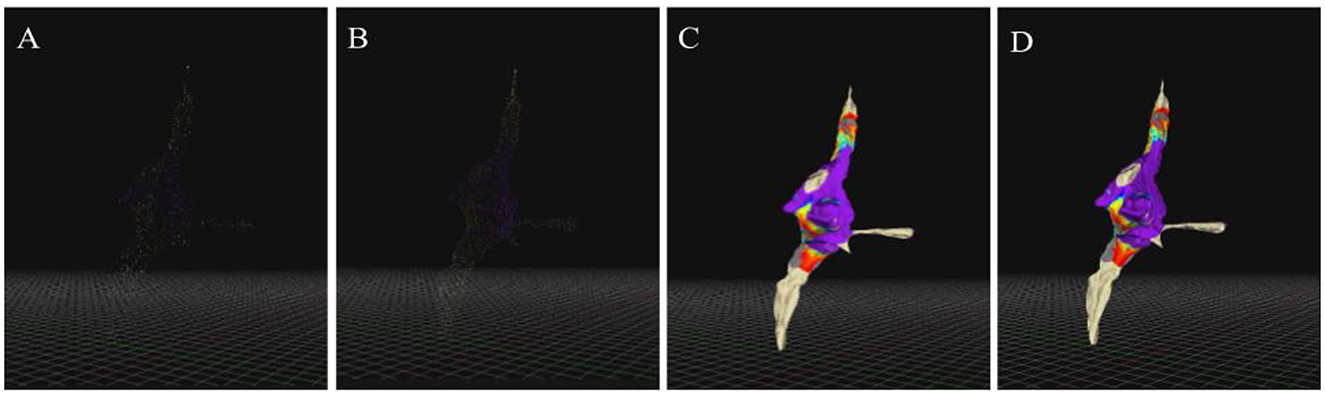
Figure 1. Photogrammetry reconstruction workflow with Zephyr software. Phases of photogrammetric reconstruction through the use of Zephyr, (A) scatter point, (B) dense cloud, (C) mesh, (D) mesh with texture.
Statistical analysis was performed using JASP 0.14.1. 0 software (GNU Affero GPL). The statistical analysis conducted on the data focused on understanding the differences between the parameters of the various cardiac mapping systems under study. Shapiro-Wilk test was carried out for normality. Correlation analysis was applied to investigate whether linear parameter relationships existed between video length in seconds and the number of points in the scattered cloud under the condition of reconstruction type (Preset or manual use). The correlation analysis was performed using Spearman's coefficient. Finally, the use of the analysis of variance (ANOVA) was crucial to examine how the control variables could influence the relationships between the type of mapping system and the final number of points. Before performing the ANOVA, normality was assessed using Levene's test and to confirm normality, the Q-Q plot was also performed. Subsequently, post hoc tests were performed with Tukey's test.
A total of 24 EAMs from 24 patients were included in the study. All EAMs were reconstructed with success using photogrammetry from all 4 mapping systems assessed. The whole process time was 25 min ± 15 min.
In particular, EAMs were as follows: left atrium, 11 EAMs (2 Carto; 2 Ensite; 5 Rhythmia; 2 Affera), right atrium, 10 EAMs (1 Carto; 6 Ensite; 3 Affera) and left ventricle, 3 EAMs (1 Carto; 2 Ensite), Figures 2–5.
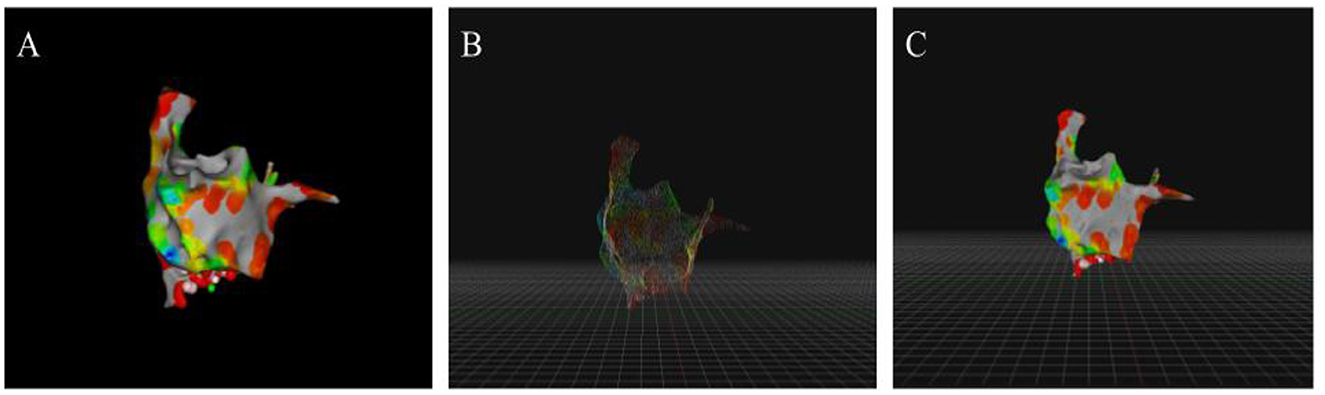
Figure 2. Reconstructions performed from data collected by the Carto software. Simultaneous display from Zephyr and original Carto software of a map reconstructed from the data extracted from the Carto electroanatomic mapping system (EAM). (A) View of the original model in antero-posterior view. (B) View of the dense cloud in Zephyr from antero-posterior view. (C) View of the mesh with texture in Zephyr from antero-posterior view.
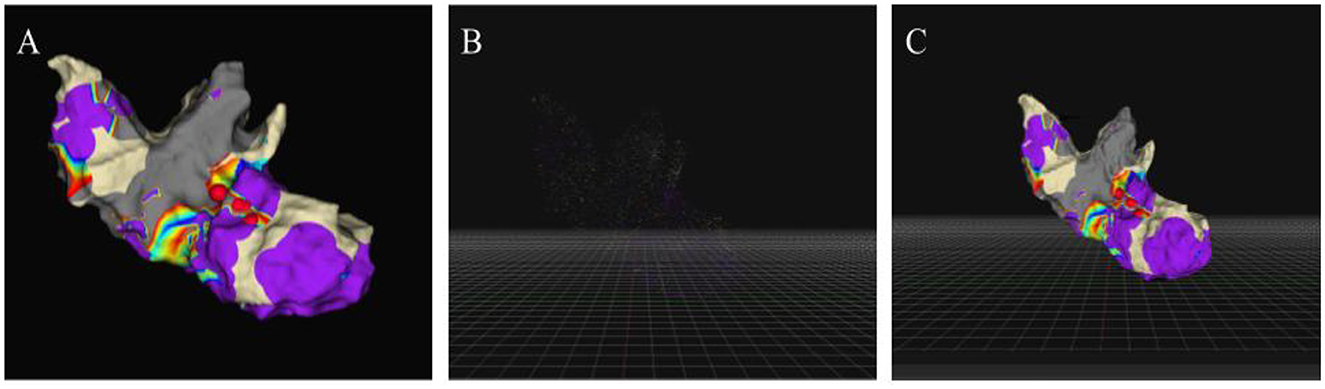
Figure 3. Reconstructions performed from data collected by the Ensite software. Simultaneous display from Zephyr and original Ensite software of a map reconstructed from the data extracted from the Ensite electroanatomic mapping system (EAM). (A) View of the original model in right anterior oblique view. (B) View of the dense cloud in Zephyr from the right anterior oblique view. (C) View of the mesh with texture in Zephyr from the right anterior oblique view.
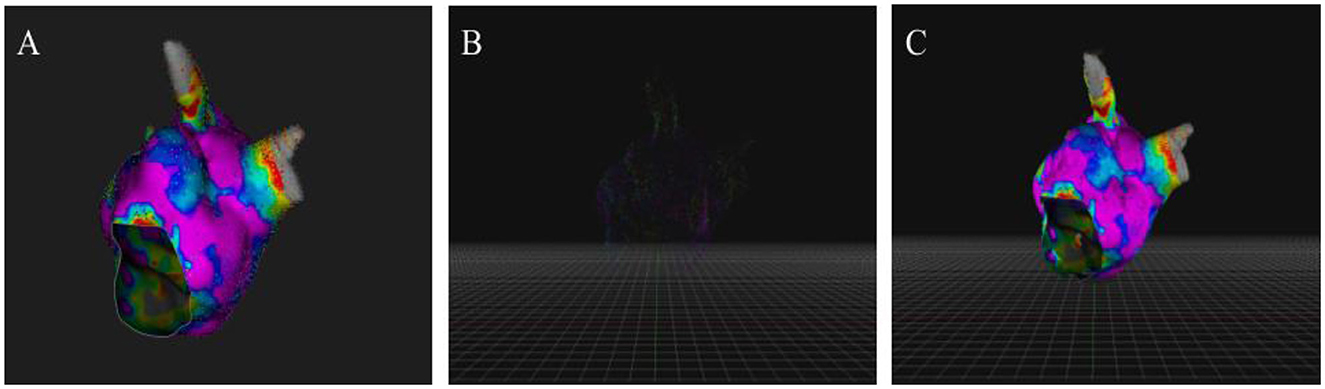
Figure 4. Reconstructions performed from data collected by the Rhythmia software. Simultaneous display from Zephyr and original Rhythmia software of a map reconstructed from the data extracted from the Ensite electroanatomic mapping system (EAM). (A) View of the original model in left lateral view. (B) View of the dense cloud in Zephyr from the left lateral view. (C) View of the mesh with texture in Zephyr from the left lateral view.
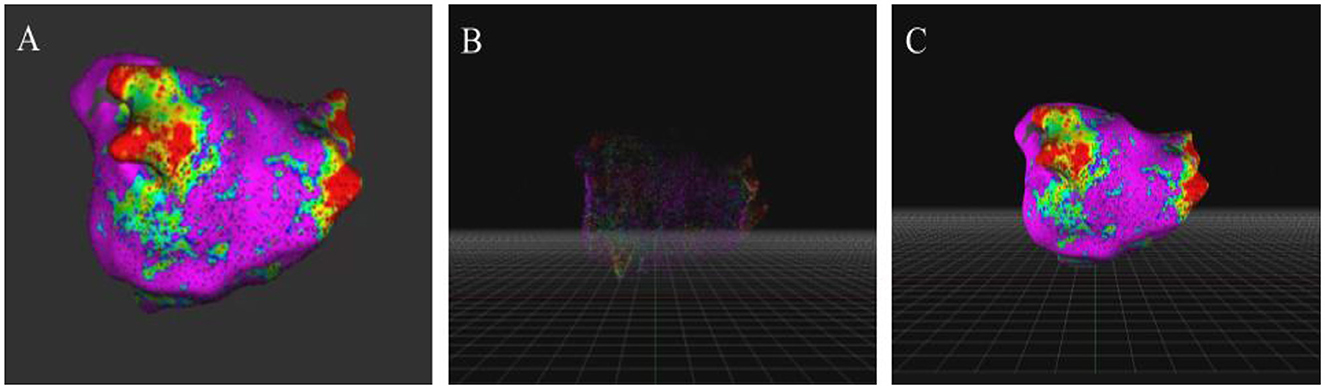
Figure 5. Reconstructions performed from data collected by the Affera software. Simultaneous display from Zephyr and original Affera software of a map reconstructed from the data extracted from the Ensite electroanatomic mapping system (EAM). (A) View of the original model in postero-anterior view. (B) View of the dense cloud in Zephyr from the postero-anterior view. (C) View of the mesh with texture in Zephyr from the postero-anterior view.
The data of video and photogrammetric reconstruction are summarized in Table 1. The overall mean length of the video used was 16.70 s. The video used was shorter for Ensite system (10 s ±3.4) compared with Carto, Rhythmia and Affera (22 s ± 6.6, 22 s ± 1.7, 20.6 s ± 4.8, respectively, p < 0.001). However, after reconstruction, there was no difference between different systems in the number of scattered cloud points (p = 0.16), Table 1. The frame extraction operation was carried out within the Zephyr software, which allowed the extraction of a mean of 132.2 number of frames. In particular, the number of frames used was higher for Rhythmia system (203.6 ± 59.7) compared with Carto, Ensite and Affera (99.75 ± 40.2, 124.0 ± 40.3, 103.4 ± 5.2, respectively, p = 0.002), Table 1. Correlation analysis showed no significant correlation between video length and scattered cloud points (Spearman's rho = -0.022, p = 0.38).
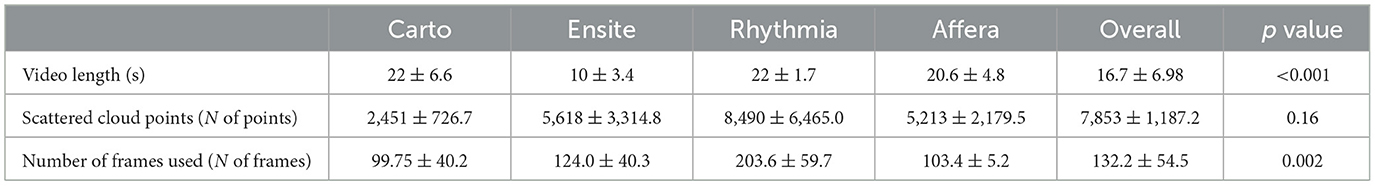
Table 1. Video extraction and number of end points obtained from photogrammetric reconstruction.
All 24 EAMs were reconstructed with success. Out of 24 EAMs, 12 were reconstructed using the semi-automatic procedure with the presets offered by the Zephyr software. In particular, all 5 EAMs (100%) derived from the Rhythmia system, 2 out of 10 (20%) EAMs extracted from the Ensite system (2 right atria) and all the 5 EAMs (100%) derived from Affera system were reconstructed using the “surface scan” and “high detail” selection. For the remaining 12 electrophysiological maps, the reconstruction approach using presets proved to be ineffective as the results were not satisfactory in three-dimensional reconstruction as the software was unable to position the cameras used for the images correctly, causing a geometric distortion of the subjects. Therefore, the scattered clouds of the remaining eight electrophysiological maps derived from the Ensite system and the four derived from the Carto were reconstructed by manual selection of the reconstruction parameters. Three reconstructions of the electrophysiological maps derived from the Ensite software presented deformations due to background integrations within the mesh (Figure 6). While one mesh derived from Carto showed geometric deformations (Figure 7). In order to solve the problem, two approaches were applied: one using Masquerade and the other using a video with two acquisition directions, (horizontal and then vertical). In both cases, the error present in the reconstructions was corrected (Figures 6, 7).
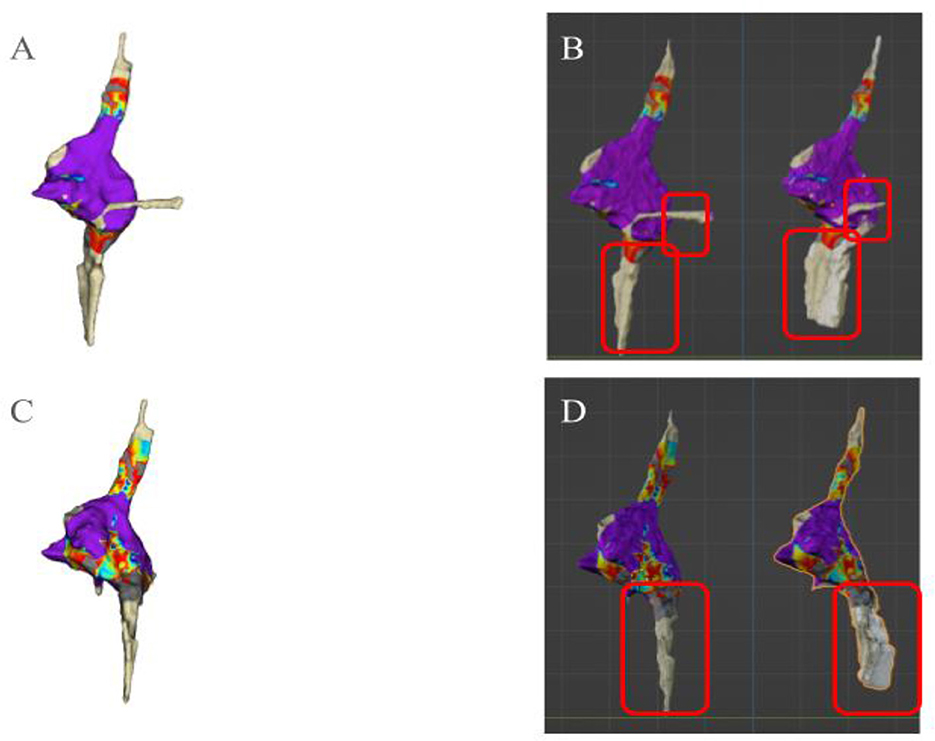
Figure 6. Error visualization and correction with Ensite system. View of the reconstructed electroanatomic maps (EAMs), (B, D) and of the original EAM in source software (A, C). (A) Antero-posterior view of the original source software EAM. (B) Antero-posterior view. On the left the correct reconstruction using Masquerade and on the right the reconstruction without correction. (C) Postero-anterior view of the original source software EAM. (D) Postero-anterior view. On the left the correct reconstruction using Masquerade and on the right the reconstruction without correction.
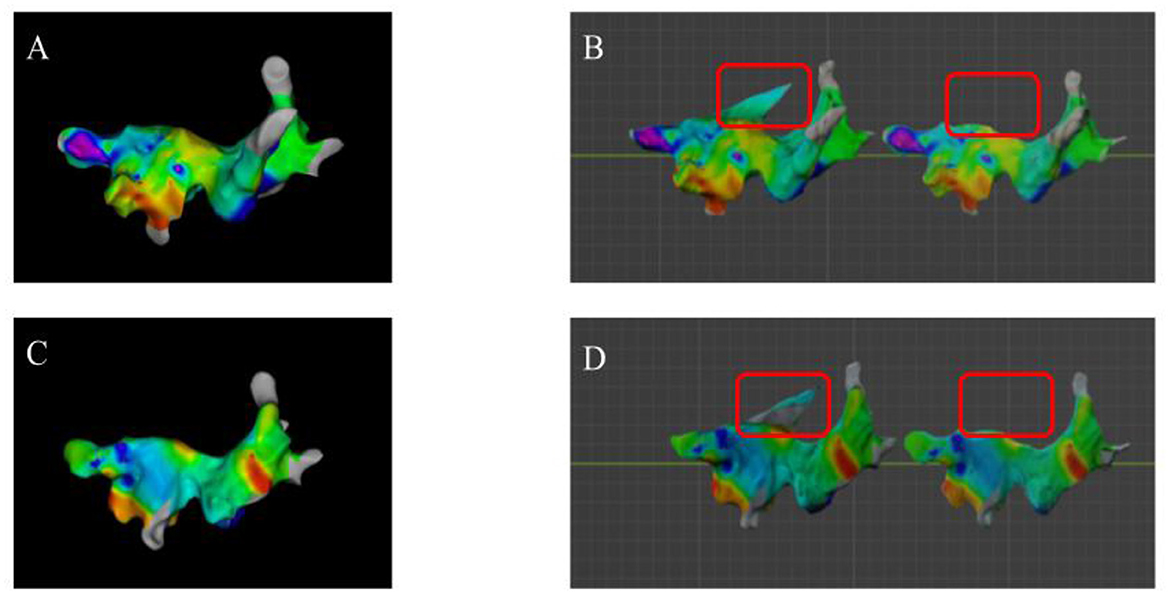
Figure 7. Error visualization and correction with Carto system. View of the reconstructed electroanatomic maps (EAMs), (B, D) and of the original EAM in source software (A, C). (A) Antero-posterior view of the original source software EAM. (B) Antero-posterior view. On the left the reconstruction without correction and on the right the reconstruction performed with a two-direction video correction. (C) Postero-anterior view of the original source software EAM. (D) Postero-anterior view. On the left the reconstruction without correction and on the right the reconstruction performed with a two-direction video correction.
All the reconstructed EAMs were imported in the Blender software with success, Figure 8. They could be visualized correctly on the Blender software and all the operations were allowed including moving the EAMs in the common working space and EAMs overlap, Figure 9.
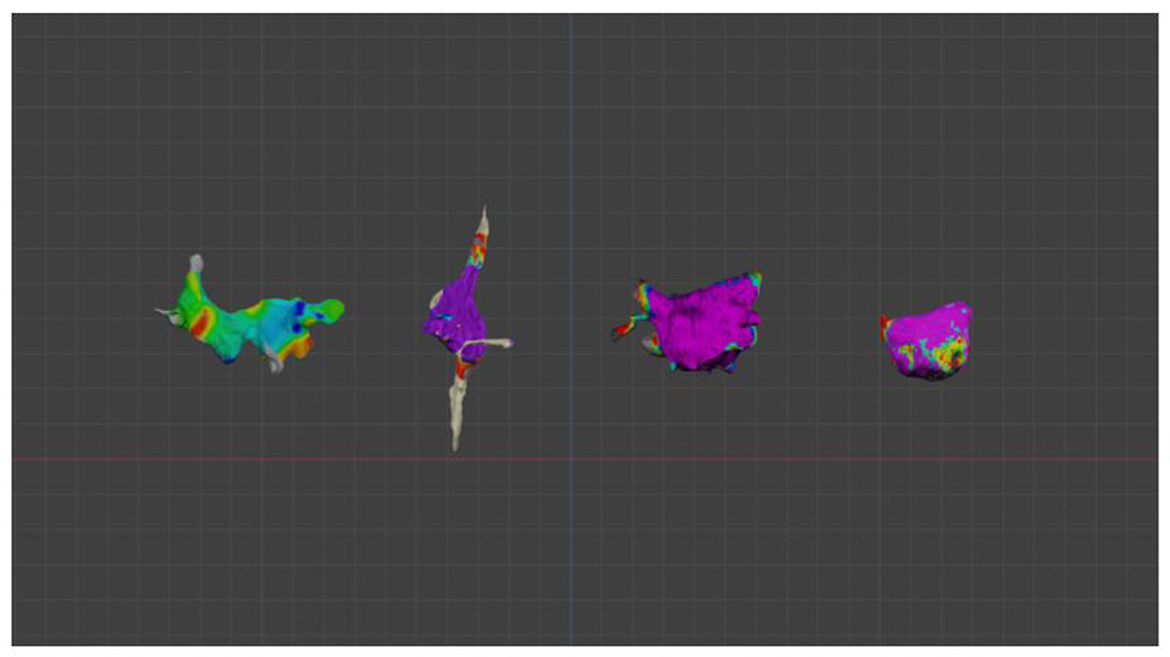
Figure 8. Simultaneous visualization in Blender 3.5 of the reconstructed electroanatomic maps derived from all analyzed systems. From left to right reconstruction of electroanatomic maps derived from Carto, Ensite, Rhythmia, and Affera, respectively.
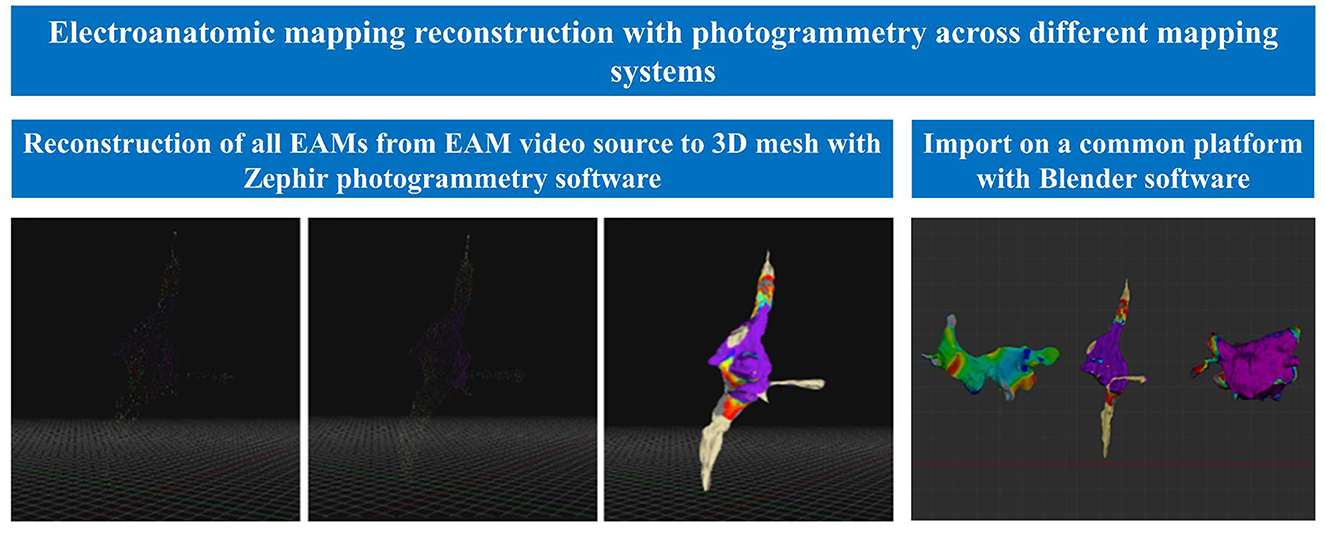
Figure 9. Central illustration: electroanatomic mapping reconstruction with photogrammetry across different mapping systems. This study demonstrated for the first time the possibility of realizing 3-D objects from digital video formats of different EAMs.
The results of the current study can be summarized as follows: (1) Photogrammetry is feasible for EAM reconstruction from different EAM systems and different cardiac chambers using video media material and (2) The workflow described allows to import the reconstructed EAMs in a common working space.
Cardiac EAM systems are crucial tools in the diagnosis and treatment of cardiac arrhythmias (Earley et al., 2006). Three-dimensional mapping systems combine electrophysiological data with anatomical information, allowing detailed visualization of cardiac electrical activity in a three-dimensional space. These systems provide physicians with a detailed map of the heart's electrical activity, aiding in diagnosis and guidance during therapeutic procedures such as ablation (de Groot et al., 2003) thus improving treatment strategies for cardiac arrhythmias. This study demonstrated the feasibility of EAM reconstruction with photogrammetry. All 24 maps analyzed, from different cardiac chambers, were correctly reconstructed. The results obtained with the methodology used in this study showed that it is possible to achieve significant results in 3D reconstruction using simple video media material. The input video was obtained from the source proprietary EAM software. In particular, EAMs from different systems could be reconstructed with success and also imported in a common working space. In this study, the four main cardiac mapping systems currently in use were assessed: Carto, Ensite, Rhythmia and Affera.
All these mapping systems can be used singularly in a patient. However, there is no software for cross evaluation between different maps from different companies. The current study is the first to describe an optimized workflow that allows to build a reproducible and easy platform for EAMs analysis, merging and comparison. To visualize and compare different EAMs, there are several 3D modeling software options that can effectively meet these needs. Autodesk 3ds Max is a prominent choice, renowned for its advanced toolset that is ideally suited for professional productions. However, its high cost can pose a significant barrier. Blender proved to be the optimal solution, due to its open-source nature and cost-free availability. Additionally, Blender's Cycles rendering engine efficiently leverages GPU acceleration to enhance the rendering process, which is crucial for visualizing complex meshes an essential aspect of EAM analysis.
The software, Zephyr 7.507 (3DFlow©), was used to create 3D volumes. The use of Zephyr, allowed to create a three-dimensional mesh from videos and to extract frames. Due to technological advances, it is now possible to model objects of high precision and geometric complexity in 3D (Hess et al., 2014). The image-based photogrammetric approach (Remondino and El-Hakim, 2006) has advanced considerably with the development of computer vision techniques (Furukawa et al., 2010; Pollefeys et al., 2008), which are now recognized as automated methods for image orientation (Remondino et al., 2012) and three-dimensional reconstruction at various scales (Haala, 2013; Lafarge and Mallet, 2012). Although the feasibility of reproducing digital objects for medical applications by means of photogrammetry has been described (Hampel and Maas, 2003), this study is the first to achieve the results using video as input data for frame extraction and subsequent reconstruction of electrophysiological maps. In the previous study from our group, photogrammetry accuracy was evaluated using CT scan reconstruction as gold standard. The measurements of the photogrammetric reconstruction closely matched those of the CT-based reconstructions. The measurements obtained for the photogrammetric reconstruction and the CT scans showed a strong correlation, according to the data analysis with correlation coefficients of 1 for the dimensional evaluation of the aorta and 0.988 for the dimensional evaluation of the vena cava. The results showed for the Wilcoxon signed-rank test a p > 0.05, which indicates that the differences between the photogrammetric and CT-derived images were not statistically significant. In the current study, although the acquired data showed a difference between the materials collected by the different mapping systems, the analysis did not show any significant differences and it was possible to achieve reconstruction of all maps. It was found that the position identified by the camera software used to capture the multimedia information is a determining factor in the success of the three-dimensional reconstruction. Indeed, almost half of the maps were reconstructed by means of a consistent, but manual approach through the use of the advanced parameters offered by the software, as the use of presets did not allow the correct identification of the camera position.
Using specialized software such as Zephyr simplifies and accelerates the process of obtaining and processing multimedia information. Zephyr's 3DF photogrammetry software leverages advanced 3D reconstruction technology through a fully automated process. This feature is driven by a proprietary algorithm that effectively combines cutting-edge computer vision and photogrammetry techniques. The software's technical core consists of two primary components: SfM and “Multi-View Stereo” (MVS). During the SfM phase, Zephyr automatically determines the position and orientation of the cameras based on the uploaded images. Subsequently, in the MVS phase, it constructs a dense point cloud from the data gathered in SfM. Additionally, one of Zephyr's standout features is its use of photoconsistency-based optimization, a technique that enhances mesh details by extracting additional information from images. The study found that average image coverage for object reconstruction ranges from 65% to 87%, with optimal results between 80% and 90%. The current study achieved an average coverage of 76%, slightly below the optimal range, while a previous study had about 10% lower coverage but similar results. Masquerade software and topology optimization were used in both studies, proving an indirect impact on improving data utilization and point cloud accuracy. However, it is crucial to choose the correct process for processing multimedia material so that the software can correctly process the information received and process the data efficiently. Furthermore, the configuration of the software settings for the sparse cloud used to process the data is a critical factor for the success of the three-dimensional reconstruction. The analysis conducted showed a denser creation of a sparse cloud for the Rhythmia software, whereas for the Carto software the average of the points of the sparse cloud showed the lowest values among the systems analyzed. This occurrence may be due to the type of reconstruction performed. In fact, the reconstruction by preset identified on average a greater number of points for the four systems compared to the points identified by manual reconstruction.
The direct use of frames extracted from videos may not be sufficient for successful reconstruction. The absence of a real background that can provide reference points and taking video footage of the object too closely may lead to photocoherence errors that can lead to incorrect reconstruction of the geometry or inclusion of the background within the mesh. Tools such as Masquerade or the use of videos with different starting directions proved to be crucial for a successful reconstruction with the elimination of all geometric deformations. Special attention must therefore be paid to the reconstruction workflow to avoid geometric reconstruction errors or loss of electrophysiological information with the inclusion of the background in the reconstructed object.
The number of patients included is relatively small. Limitations include referral bias due to the inclusion of study patients from a tertiary center specialized in cardiac EAM and ablation. The study was retrospective. Cardiac arrhythmia mapping (activation time) and EAM voltage analysis was out of the scope of the manuscript and will be evaluated in future studies.
This study demonstrated for the first time the possibility of realizing three-dimensional objects from digital object video formats of different EAMs. It also highlighted the importance of adequate subject coverage, the use of a sufficient number of frames and the choice of input data format for successful 3D reconstruction. Therefore, the successful integration of these technologies can significantly improve the accessibility and usability of electroanatomical maps in clinical settings. Future studies should be conducted with more EAMs and in particular with different mapped cardiac arrhythmias.
The raw data supporting the conclusions of this article will be made available by the authors, without undue reservation.
The studies involving humans were approved by Commissie Medische Ethiek UZ Brussel. The studies were conducted in accordance with the local legislation and institutional requirements. The participants provided their written informed consent to participate in this study.
GT: Conceptualization, Data curation, Formal analysis, Funding acquisition, Investigation, Methodology, Project administration, Resources, Software, Supervision, Validation, Visualization, Writing – original draft, Writing – review & editing. LP: Conceptualization, Data curation, Formal analysis, Project administration, Supervision, Validation, Visualization, Writing – original draft, Writing – review & editing. DD: Writing – review & editing. ASo: Writing – review & editing. RK: Writing – review & editing. IO: Writing – review & editing. GB: Writing – review & editing. AA: Writing – review & editing. ES: Writing – review & editing. JS: Writing – review & editing. ML: Writing – review & editing. ASa: Writing – review & editing. PB: Writing – review & editing. GC: Writing – review & editing. AG: Writing – review & editing. CA: Writing – review & editing.
The author(s) declare that no financial support was received for the research, authorship, and/or publication of this article.
ASo received research grants from Daiichi-Sankyo and Bayer; he has received speaker fees from Menarini and Bayer. ML is consultant for Atricure. PB received compensation for teaching purposes from Biotronik. GC received compensation for teaching purposes and proctoring from Medtronic, Abbott, Biotronik, Boston Scientific, Acutus Medical. CA receives research grants on behalf of the center from Biotronik, Medtronic, Abbott, LivaNova, Boston Scientific, AtriCure, Philips, and Acutus, and received compensation for teaching purposes and proctoring from Medtronic, Abbott, Biotronik, Livanova, Boston Scientific, Atricure, Acutus Medical Daiichi Sankyo.
The remaining authors declare that the research was conducted in the absence of any commercial or financial relationships that could be construed as a potential conflict of interest.
The author(s) declare that no Gen AI was used in the creation of this manuscript.
All claims expressed in this article are solely those of the authors and do not necessarily represent those of their affiliated organizations, or those of the publisher, the editors and the reviewers. Any product that may be evaluated in this article, or claim that may be made by its manufacturer, is not guaranteed or endorsed by the publisher.
Bemis, S. P., Micklethwaite, S., Turner, D., James, M. R., Akciz, S., Thiele, S. T., et al. (2014). Ground-based and UAV-Based photogrammetry: a multi-scale, high-resolution mapping tool for structural geology and paleoseismology. J. Struct. Geol. 69, 163–178. doi: 10.1016/j.jsg.2014.10.007
de Groot, N. M., Schalij, M. J., Zeppenfeld, K., Blom, N. A., Van der Velde, E. T., and Van der Wall, E. E. (2003). Voltage and activation mapping: how the recording technique affects the outcome of catheter ablation procedures in patients with congenital heart disease. Circulation 108, 2099–2106. doi: 10.1161/01.CIR.0000092893.11893.38
Donato, L., Cecchini, R., Goldoni, M., and Ubelaker, D. H. (2020). Photogram metry vs CT scan: Evaluation of accuracy of a low-cost three-dimensional acquisition method for forensic facial approximation. Am. Acad. Forens. Sci. 65, 1260–1265. doi: 10.1111/1556-4029.14319
Earley, M. J., Showkathali, R., Alzetani, M., Kistler, P. M., Gupta, D., Abrams, D. J., et al. (2006). Radiofrequency ablation of arrhythmias guided by nonfluoroscopic catheter location: a prospective randomized trial. Eur. Heart J. 27, 1223–1229. doi: 10.1093/eurheartj/ehi834
Eitel, C., Hindricks, G., Dagres, N., Sommer, P., and Piorkowski, C. (2010). EnSite Velocity™ cardiac mapping system: a new platform for 3D mapping of cardiac arrhythmias. Expert Rev. Med. Dev. 7, 185–192. doi: 10.1586/erd.10.1
Fritsch, D., Wagner, J. F., Ceranski, B., Simon, S., Niklaus, M., Zhan, K., et al. (2021). Making historical gyroscopes alive-2D and 3D preservations by sensor fusion and open data access. Sensors 21:957. doi: 10.3390/s21030957
Furukawa, Y., Curless, B., Seitz, S. M., and Szeliski, R. (2010). “Towards internet-scale multi-view stereo,” in IEEE Conference on Computer Vision and Pattern Recognition (CVPR) (San Francisco, CA: IEEE), 1434–1441.
Gepstein, L., Hayam, G., and Ben-Haim, S. A. (1997). A novel method for nonfluoroscopic catheter-based electroanatomical mapping of the heart in vitro and in vivo accuracy results. Circulation 95, 1611–1622. doi: 10.1161/01.CIR.95.6.1611
Haala, N. (2013). The Landscape of Dense Image Matching Algorithms. Photogrammetric Week '13. Stuttgart, 271–284
Hampel, U., and Maas, H. G. (2003). Application of digital photogrammetry for measuring deformation and cracks during load tests in civil engineering material testing. Optical 3-D Measurem. Techniq. 6, 80−88.
Hess, M., Robson, S., and Hosseininaveh, A. A. (2014). A contest of sensors in close range 3D imaging: performance evaluation with a new metric test object. ISPRS-Int. Arch. Photogramm. Remote Sens. Spatial Inform. Sci. 1, 277–284. doi: 10.5194/isprsarchives-XL-5-277-2014
Hindricks, G., and Kottkamp, H. (2001). Simultaneous noncontact mapping of left atrium in patients with paroxysmal atrial fibrillation. Circulation 104, 297–303. doi: 10.1161/01.CIR.104.3.297
Jiang, Y., Farina, D., Bar-Tal, M., and Dössel, O. (2009). An impedance based catheter positioning system for cardiac mapping and navigation. IEEE Trans. Biomed. Eng. 56, 1963–1970. doi: 10.1109/TBME.2009.2021659
Koutalas, E., Rolf, S., Dinov, B., Richter, S., Arya, A., Bollmann, A., et al. (2015). Contemporary mapping techniques of complex cardiac arrhythmias - identifying and modifying the arrhythmogenic substrate. Arrhythm Electrophysiol. Rev. 4, 19–27. doi: 10.15420/aer.2015.4.1.19
Kucukkaya, A. G. (2004). Photogrammetry and remote sensing in archeology. J. Quant. Spectrosc. Radiat. Transf. 88, 83–88. doi: 10.1016/j.jqsrt.2003.12.030
Kumagai, K., and Nakashima, H. (2009). Noncontact mapping-guided catheter ablation of atrial fibrillation. Circ J. 73, 233–241 doi: 10.1253/circj.CJ-08-0700
Lafarge, F., and Mallet, C. (2012). Creating large-scale city models from 3D-point clouds: a robust approach with hybrid representation, Int. J. Comput. Vis. 99, 69–85. doi: 10.1007/s11263-012-0517-8
Marchlinski, F. E., Callans, D. J., Gottlieb, C. D., and Zado, E. (2000). Linear ablation lesions for control of unmappable ventricular tachycardia in patients with ischemic and nonischemic cardiomyopathy. Circulation 101, 1288–1296. doi: 10.1161/01.CIR.101.11.1288
Pollefeys, M., Nistér, D., Frahm, J. M., Akbarzadeh, A., Mordohai, P., Clipp, B., et al. (2008). Detailed real-time urban 3D reconstruction from video. Int. J. Comput. Vision 78, 143–167. doi: 10.1007/s11263-007-0086-4
Reinoso, J. F., Gonçalves, J. E., Pereira, C., and Bleninger, T. (2018). Cartography for civil engineering projects: photogrammetry supported by unmanned aerial vehicles. Iran. J. Sci. Technol. Trans. Civil Eng. 42, 91–96. doi: 10.1007/s40996-017-0076-x
Remondino, F., Del Pizzo, S., Kersten, T. P., and Troisi, S. (2012). “Low-cost and open-source solutions for automated image orientation – a critical overview,” in Progress in Cultural Heritage Preservation (Cham: Springer), 40–54.
Remondino, F., and El-Hakim, S. (2006). Image-based 3D modelling: a review. Photogram. Rec. 21, 269–291. doi: 10.1111/j.1477-9730.2006.00383.x
Rudy, U. (2010). Noninvasive imaging of cardiac electrophysiology and arrhythmia. Ann. NY Acad. Sci. 1188, 214–221. doi: 10.1111/j.1749-6632.2009.05103.x
Sanders, P., Berenfeld, O., Hocini, M., Jaïs, P., Vaidyanathan, R., Hsu, L. F., et al. (2005). Spectral analysis identifies sites of high frequency activity maintaining atrial fibrillation in humans. Circulation 112, 789–797. doi: 10.1161/CIRCULATIONAHA.104.517011
Sy, R. W., Thiagalingam, A., and Stiles, M. K. (2012). Modern electrophysiology mapping techniques. Heart Lung Circulat. 21, 364–375. doi: 10.1016/j.hlc.2012.04.007
Talevi, G., Pannone, L., Monaco, C., Bori, E., Cappello, I. A., Candelari, M., et al. (2022). Development of a 3D printed surgical guide for brugada syndrome substrate ablation. Front. Cardiovasc. Med. 9:1029685 doi: 10.3389/fcvm.2022.1029685
Talevi, G., Pannone, L., Monaco, C., Bori, E., Cappello, I. A., Candelari, M., et al. (2023). Evaluation of photogrammetry for medical application in cardiology. Front. Bioeng. Biotechnol. 11:1044647. doi: 10.3389/fbioe.2023.1044647
Thiagalingam, A., Wallace, E. M., Boyd, A. C., Eipper, V. E., Campbell, C. R., Byth, K., et al. (2004). Noncontact mapping of the left ventricle: insights from validation with transmural contact mapping. Pacing Clin. Electrophysiol. 27, 570–578. doi: 10.1111/j.1540-8159.2004.00489.x
Viswanathan, K., Mantziari, L., Butcher, C., Hodkinson, E., Lim, E., Khan, H., et al. (2017). Evaluation of a novel high-resolution mapping-system for catheter ablation of ventricular arrhythmias. Heart Rhythm. 14, 176–183. doi: 10.1016/j.hrthm.2016.11.018
Westoby, M. J., Brasington, J., Glasser, N. F., Hambrey, M. J., and Reynolds, J. M. (2012). ‘Structure-from-Motion' photogrammetry: a low-cost, effective tool for geoscience applications. Geomorphology 179, 300–314. doi: 10.1016/j.geomorph.2012.08.021
Keywords: electroanatomic mapping, photogrammetry, mapping systems, 3D modeling and 3D models, cardiac electrophysiology
Citation: Talevi G, Pannone L, Della Rocca DG, Sorgente A, Kronenberger R, Overeinder I, Bala G, Almorad A, Ströker E, Sieira J, La Meir M, Sarkozy A, Brugada P, Chierchia GB, Gharaviri A and de Asmundis C (2025) Electroanatomic mapping reconstruction with photogrammetry across different mapping systems. Front. Imaging 4:1502613. doi: 10.3389/fimag.2025.1502613
Received: 12 October 2024; Accepted: 10 February 2025;
Published: 24 February 2025.
Edited by:
Nicola Conci, University of Trento, ItalyReviewed by:
A. Ryad Soobhany, Heriot-Watt University Dubai, United Arab EmiratesCopyright © 2025 Talevi, Pannone, Della Rocca, Sorgente, Kronenberger, Overeinder, Bala, Almorad, Ströker, Sieira, La Meir, Sarkozy, Brugada, Chierchia, Gharaviri and de Asmundis. This is an open-access article distributed under the terms of the Creative Commons Attribution License (CC BY). The use, distribution or reproduction in other forums is permitted, provided the original author(s) and the copyright owner(s) are credited and that the original publication in this journal is cited, in accordance with accepted academic practice. No use, distribution or reproduction is permitted which does not comply with these terms.
*Correspondence: Carlo de Asmundis, Y2FybG8uZGVhc211bmRpc0B1emJydXNzZWwuYmU=; Y2FybG9kZWFzbXVuZGlzQG1lLmNvbQ==
†These authors share first authorship
Disclaimer: All claims expressed in this article are solely those of the authors and do not necessarily represent those of their affiliated organizations, or those of the publisher, the editors and the reviewers. Any product that may be evaluated in this article or claim that may be made by its manufacturer is not guaranteed or endorsed by the publisher.
Research integrity at Frontiers
Learn more about the work of our research integrity team to safeguard the quality of each article we publish.