 German Sergei
 David Unnersjö-Jess3,4,5
 Linus Butt
 Thomas Benzing
 Katarzyna Bozek
- 1Center for Molecular Medicine Cologne (CMMC), Faculty of Medicine and University Hospital Cologne, University of Cologne, Cologne, North Rhine-Westphalia, Germany
- 2Institute for Biomedical Informatics, Faculty of Medicine and University Hospital Cologne, University of Cologne, Cologne, North Rhine-Westphalia, Germany
- 3MedTechLabs, Karolinska University Hospital, Solna, Sweden
- 4Division of Renal Medicine, Department of Clinical Sciences, Intervention and Technology, Karolinska Institute, Stockholm, Sweden
- 5Science for Life Laboratory, Department of Applied Physics, Royal Institute of Technology, Solna, Sweden
- 6Cologne Excellence Cluster on Cellular Stress Responses in Aging- Associated Diseases (CECAD), University of Cologne, Cologne, North Rhine-Westphalia, Germany
- 7Department II of Internal Medicine, Faculty of Medicine and University Hospital Cologne, University of Cologne, Cologne, Germany
While the advance of deep learning has allowed to automate many tasks in bioimage analysis, quantifying key visual features of biological objects in an image, such as cells, organs, or tissues, is still a multi-step and laborious task. It requires image segmentation and definition of features of interest, which often might be image- and problem-specific. This approach requires image labeling and training of the segmentation method as well as manual feature design and implementation of dedicated procedures for their quantification. Here we propose a self-supervised learning (SSL) approach to encoding in microscopy images morphological features of molecular structures that play role in disease phenotype and patient clinical diagnosis. We encode super-resolution images of slit diaphragm (SD)—a specialized membrane between podocyte cells in kidney—in a high-dimensional embedding space in an unsupervised manner, without the need of image segmentation and feature quantification. We inspect the embedding space and demonstrate its relationship to the morphometric parameters of the SD estimated with a previously published method. The SSL-derived image representations additionally reflect the level of albuminuria—a key marker of advancement of kidney disease in a cohort of chronic kidney disease patients. Finally, the embeddings allow for distinguishing mouse model of kidney disease from the healthy subjects with a comparable accuracy to classification based on SD morphometric features. In a one step and label-free manner the SSL approach offers possibility to encode meaningful details in biomedical images and allow for their exploratory, unsupervised analysis as well as further fine-tuning for specialized supervised tasks.
1 Introduction
Biological image analysis typically consists of extracting from images visual features of interest, such as size, density, positioning, or shapes of cells or other molecular structures. This approach requires defining these features and implementing computational methods for image segmentation and feature quantification. While it allows for hypothesis testing and provides interpretable insights into the image data, this approach carries several limitations. Firstly, across a range of biomedical domains and imaging modalities, image segmentation methods often times need to be retrained or redesigned for the specific problem, carrying an important work burden of image labeling for the method training. Secondly, given the broad visual variability of biological structures, quantifying their visual properties might require feature definition and implementation of dedicated methods for their quantification. However, not all useful and potentially important features can be explicitly formulated or easily quantified. Unconstrained and complex structures, such as biological membranes, nerves, or blood vessels are difficult to capture with a set of hand-designed features (Shamir et al., 2010; Zhao et al., 2022).
Recent advances in self-supervised learning (SSL) offer opportunities to analyze image data in a label- and feature-free manner (Hu et al., 2021). These methods can be used to produce image representations that capture their key visual attributes without the need of image segmentation and engineering of features. Data augmentation during model training defines the invariances in the image representations. Manipulating image aspects such as imaging artifacts, brightness, blur, or unimportant features, such as object orientation angle in data augmentation allows to exclude them from the image representations. Ultimately the representations encode only the semantically meaningful visual features.
First methods in self-supervised learning include Siamese networks (Bromley et al., 1993) and autoencoders (Vincent et al., 2008). Without the use of labels these approaches generate compact representations of input data while discarding noise and spurious details. More recently, several SSL methods emerged based on contrastive learning (Bromley et al., 1993; Grill et al., 2020; He et al., 2020; Zbontar et al., 2021). These methods are trained with the objective of maximizing agreement between differently augmented views of the same data either with or without using another data point as a negative reference. Resulting image representations are compact while capturing key semantic elements contained in an image.
While power of the self-supervised methods has been widely demonstrated in biomedical images (Shurrab and Duwairi, 2022), their applications to biological images are still scarce. SSL in the biomedical domain is most often used for pre-training of methods that are further fine-tuned for a supervised task, hence reducing the problem of the cost and limited availability of labeled images. SSL-based image representations are however seldom used as an end tool for data exploration and discovery. This is potentially due to the difficulty of quantitative validation of the SSL-derived image representations (Huang et al., 2023).
Here we present a self-supervised approach to the analysis of super-resolution microscopy images of a specialized molecular structure—the slit diaphragm (SD) in the kidney. SD is formed by membranes of neighboring podocyte cells, which form interdigitating patterns between the cells (Figure 1). Previous studies, based on segmentation of foot processes (FPs)—individual protrusions in the SD, have demonstrated the relationship of SD morphology to the kidney's filtration capacity (Deegens et al., 2008). Dense and elongated FPs were shown as characteristic to healthy tissue, whereas less dense and more circular shapes typically occur in diseased kidney (Butt et al., 2020).
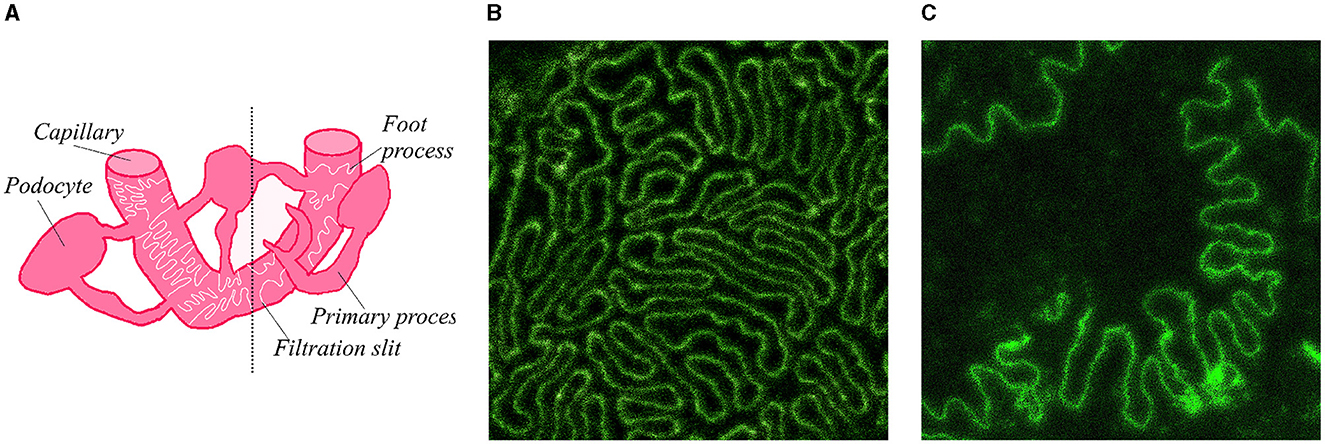
Figure 1. Diagram of SD and example microscopy images of SD in mouse kidney. (A) Sketch of SD and its location on capillary in kidney. Diagram on the left side of the dotted line contains a regular SD pattern of a healthy kidney, right side contains a less regular and more sparse pattern typical of a podocyte kidney disease. (B) Example microscopy image of SD in a healthy mouse tissue. (C) Example microscopy image of a diseased mouse tissue.
Though FPs are distinguishable within the SD, in particular in the diseased tissue, its definition is imprecise (Deegens et al., 2008). FPs are protrusions or bends of the podocyte membranes. However, determining the initiation and termination of a bend, as well as the critical angle at which a membrane bend qualifies as an FP, is largely subjective. Furthermore, parameters describing individual FPs do not take into account their spatial configurations, positions, and orientations relative to one another. In a nutshell, quantification of SD morphology is an example of a problem where finding the right set of morphometric features to comprehensively describe it, might prove challenging (Ichimura et al., 2018).
To address this problem, we explore the potential of SSL methods to describe the complex morphological structures in microscopy images of the SD. We quantitatively validate the derived image representations using previously published method for FP morphometric parameter estimation (David Unnersjö-Jess et al., 2021). We next demonstrate the capacity of the SSL-based image representations to reflect type of kidney disease as well as disease advancement.
2 Materials and methods
2.1 Dataset and imaging
For method development we used a dataset comprising 288 images of mouse kidney tissue samples. 70% of images were used as the training set, and another 30% for validation and testing. The samples were collected from four different mouse models: healthy controls (76 images), models of focal and segmental glomerulosclerosis (FSGS, 77 images), nephrotoxic nephritis (NTN) mice (121 images), and mice with Adriamycin-induced nephropathy (14) (Brähler et al., 2018). All phenotypes were proportionately present in training, validation, and test sets. Kidney tissue was collected from individuals with ages from 0 to 20 weeks old and imaged with a super-resolution stimulated emission depletion (STED) microscopy using a previously published protocol (David Unnersjö-Jess et al., 2021). Our model was also tested on a dataset comprised of 151 images of FPs in 19 human minimal change disease (MCD) and steroid-dependent nephrotic syndrome (SDNS) patients. We fine-tuned the model with 105 images in this dataset and tested on 46.
For imaging, the tissue was cleared and nephrin - protein present between podocyte cells along the SD - was marked with a fluorescent stain resulting in images in which only the SD is visible (Figures 1B, C). To eliminate noise in the images, we binarized them into background and the foreground SD signal. All images were scaled to the size of 1024 x 1024 pixels. The resolution of each image is 22 nm per pixel.
In order to inspect and interpret the SSL image representations, we quantified morphometric parameters of the FPs using a previously published method (Butt et al., 2021). The morphometric parameters that we quantified include: FP area, FP perimeter, FP circularity, SD length, and grid crossing count. Grid crossing count is measured as the number of intersections of the SD with a grid of horizontal and vertical lines spaced by 32.5 nm and divided by the size of the region of interest (ROI)—foreground area in each image comprising the entire SD signal. Similarly, SD length is measured relative to the ROI size. FP parameters were averaged for all the FPs in each image. As a result, each image was described by these five morphometric measures.
2.2 Model choice
Out of a set of SSL methods: Bootstrap Your Own Latents (BYOL) (Grill et al., 2020), Simple Contrastive Learning Framework (SimCLR) (Chen et al., 2020), Barlow Twins (BT) (Zbontar et al., 2021), and Momentum Contrast (MoCo) (He et al., 2020), we selected BYOL based on its ability to learn invariant and informative image features from unlabeled dataset without the need of defining pairs of negative data points. We used ResNet-34 as the network backbone. The backbone in this model acts as the encoder transforming images into their numeric representations. We chose 8 as the representation size after trying out the representations of higher dimensionalities. The loss function in our implementation of BYOL is pseudo Huber loss (Equation 1) (Huber, 1964) between the embeddings produced for the two augmented views of original images:
where r is the difference between embeddings of two augmented versions of an image and δ is the scaling factor which we computed as follows. We measured discrete Fourier transform (DFT) across the whole dataset. Next, we computed mean Fourier transform for every image separately. Then, we calculated the difference between DFT and the mean value Fourier transform of each image. We took the real parts of inverted differences and averaged their absolute values to obtain δ. We chose Huber loss due to its ability to balance between L2 and L1 loss. For small values of r compared to δ it is well approximated by quadratic function r2/2, while for big values of r it behaves like linear function. Consider the asymptotic formula:
where x → 0.
Using Equation 2, we can simplify the pseudo Huber loss function to a quadratic form. This is because, in our context, x is equivalent to r2. Hence the loss resembles L2: On the other hand, if r2 is much larger than δ, then:
Consequently, the expression: can be approximated as , so Huber loss will behave like L1 in the case described by Equation 3.
2.3 Data augmentations
BYOL learns image representations via maximizing the agreement between two randomly augmented views of an input image. Due to the specificity of the images in our study, as image augmentations in network training we selected and implemented following operations: random flips along x- and y-axis, random image rotations, and random relocations of patches of foreground regions.
Random relocations were implemented taking into account the location of the tissue blobs in input images. In this augmentation we find separate blobs of foreground image areas, crop these regions and insert them in new, randomly chosen positions such that the cropped boxes do not overlap. The ROIs were found using classic computer vision methods provided by opencv library: contour finding, filling polygons, dilution, and convex hull (Bradski, 2000).
2.4 Model training
We used Stochastic Gradient Descent optimizer with the momentum of 0.9 and the weight decay of 1e-4, batch size of 4, and learning rate 1e-3. Training was continued for up to 500 epochs, until the loss stopped decreasing, due to the early stopping mechanism with the patience equal to 30 steps. The values of hyperparameters were chosen based on the recommendations of the original paper as well as based on qualitative assessment using visualization methods described below (Grill et al., 2020).
Validation loss was calculated every 4 epochs. To prevent overfitting we used gradient clipping procedure with the norm of 1.0 and loss L2 regularization with the coefficient 1e-3.
2.5 Visualisations
As a part of our analysis we visualised the generated image embeddings in 2D. We used t-distributed stochastic neighbor embedding (t-SNE) algorithm (Van der Maaten and Hinton and Hinton, 2008) with the perplexity of 15 to project the 8-dimensional representations on two-dimensional space. T-SNE contains a stochastic mechanism of a random walk in the graph of data representations during computation of data affinities. To improve reproducibility of t-SNE-based visualizations independent of its stochastic step, we used principal component analysis (PCA) to reduce the dimensionality of latent embeddings prior to t-SNE. This initial PCA transformation helps to reduce computational complexity and to limit correlated elements in the data resulting in more stable t-SNE results.
2.6 Classification model
We trained a Support Vector Machine (SVM) to distinguish between healthy and diseased conditions. To select the best settings for this model, we tested different combinations using 10-fold cross-validation. We used radial basis function as SVM kernel with margin parameter C = 1.0. We adjusted parameter γ based on the number and variability of our data points.
In a similar manner we trained an additional SVM classifier for distinguishing between diseased (FSGS and NTN) vs. control groups. Adriamycin-treated mice which show intermediate phenotype between the healthy and diseases were excluded from this part of the analysis. The function kernel was set to third degree polynomial, with the margin parameter C = 1.0. The parameter γ was scaled as the reverse of the product of number of features and variance in the dataset. Number of training iterations was limited by the tolerance equal to 0.001.
In order to test the capacity of representations to capture morphology of the respective images we also trained a regression model predicting various morphometric parameters from the embeddings. We used CatBoost model, which builds an ensemble of decision trees sequentially while minimising the residual error of existing ensemble.
3 Results
3.1 SSL representations reflect disease phenotypes
We first inspected the capacity of the SSL embeddings to distinguish healthy from diseased as well as various types of kidney disease. The embeddings appear to correctly capture differences in morphology between the FSGS and healthy mice across their ages (Figure 2A). Two phenotypes are separate in their latent space with a limited overlap. FSGS is advancing with age and we could observe slight pattern of age distribution in the latent space.
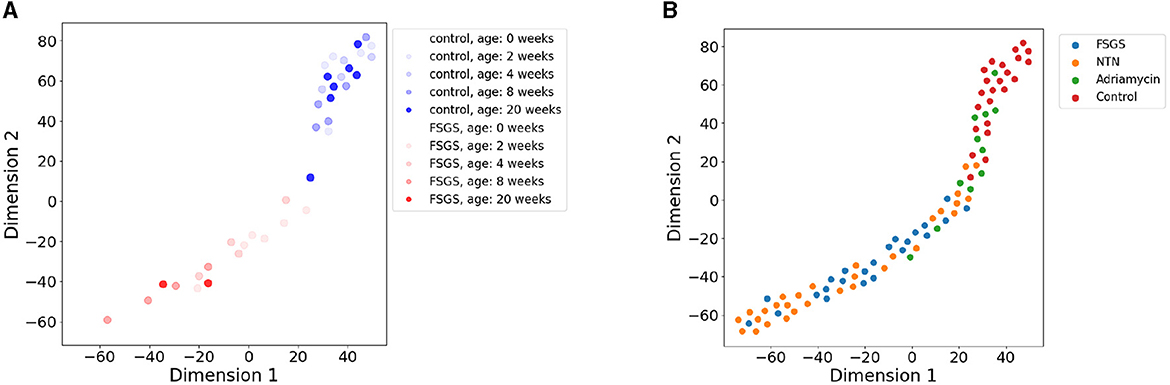
Figure 2. t-SNE visualization (perplexity = 15) of 8-dimensional embeddings of images of SD across several kidney disease phenotypes. Each image is represented by a dot and colored according to the age and phenotype. (A) SSL-derived embeddings that represent FSGS and control phenotypes at different ages indicated by the color brightness. (B) Projection of embeddings of four disease phenotypes: Adriamycin induced nephropathy, NTN, control, and FSGS.
The different mouse models of kidney disease, including FSGS, NTN, and Adriamycin-induced nephropathy mice are similarly separated in the SSL-derived image representation space (Figure 2B) with the healthy phenotypes on the one and diseased phenotypes on the other edge of the data point cloud in the latent space. Adriamycin-induced disease shows less severe clinical effects as well as pathological changes in the SD compared to the NTN and FSGS models which is reflected by their grouping in between the healthy and the NTN, FSGS phenotypes (Figure 2B).
3.2 SSL representations reflect SD morphometry
It has been previously shown that morphometry of podocyte FPs significantly differs between control and disease model mice (Butt et al., 2020). We next inspected to what extent the SSL embeddings capture relevant aspects of the morphometry of the FPs.
Across all images we quantified morphometric parameters such as SD length, grid crossings, FP area, perimeter, and circularity (see Materials and Methods for their detailed description). We next colored the points in their SSL-derived latent space according to the value of morphometric parameters in the respective microscopy image (Figure 3). We observed a visible gradient of parameter values along the projection of data points. Higher SD length and FP area as well as lower FP circularity characterize healthy control samples located in the upper right part of the 2D projection of the embedding space (Figure 3). These healthy samples have a dense structure of elongated FPs which is reflected by the parameters (Butt et al., 2020). The diseased tissue samples located in the bottom-left part of the plot have more sparse and round-shaped FPs which is reflected by higher circularity and lower SD length of the data points in this part of the plot. While not used in the embedding space construction, the morphometric parameters of FPs are visibly captured by the SSL model.
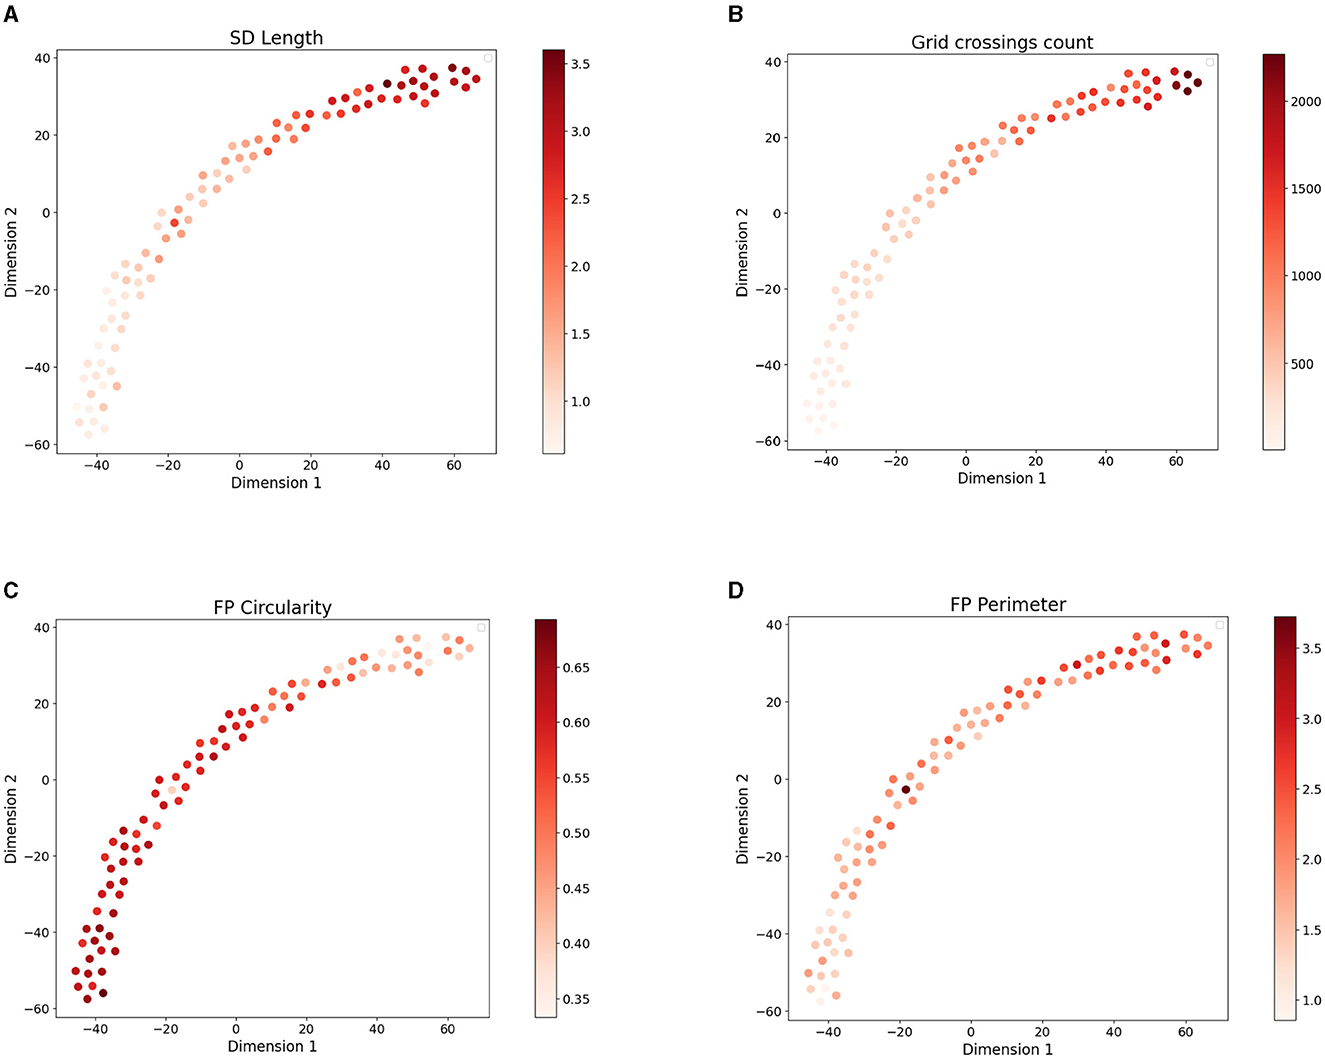
Figure 3. 2D t-SNE projection (with perplexity = 15) of 8-dimensional embedding space of the four disease models colored based on the values of four morphometric parameters: (A) SD length per area , (B) grid crossings count [μm−2], (C) mean FP circularity (from 0 to 1), and (D) FP perimeter [μm].
3.3 SSL representations and disease advancement
We next inspected to what extent the SSL representations reflect the advancement of kidney disease. We used a previously published cohort of pediatric patients diagnosed with SDNS and MCD to inspect whether the SSL-derived image representations reflect clinical parameters of these patients (Unnersjö-Jess et al., 2023). The morphometric parameters were previously shown to change in agreement with the levels of albuminuria in this cohort (Butt et al., 2021).
The variability of morphometry of FPs in these patients appears lower compared to the mouse models and the embedding space of the human samples does not show a clear gradient of morphometric parameter change at a first glance (Figures 4A, B). However, the level of albuminuria, while differing widely among the patients (Figure 4C) shows a trend of increased values at the bottom-right part of the 2D projection of the embedding space (Figure 4D). These results suggest that the SSL model captures clinically relevant aspects of the SD morphology.
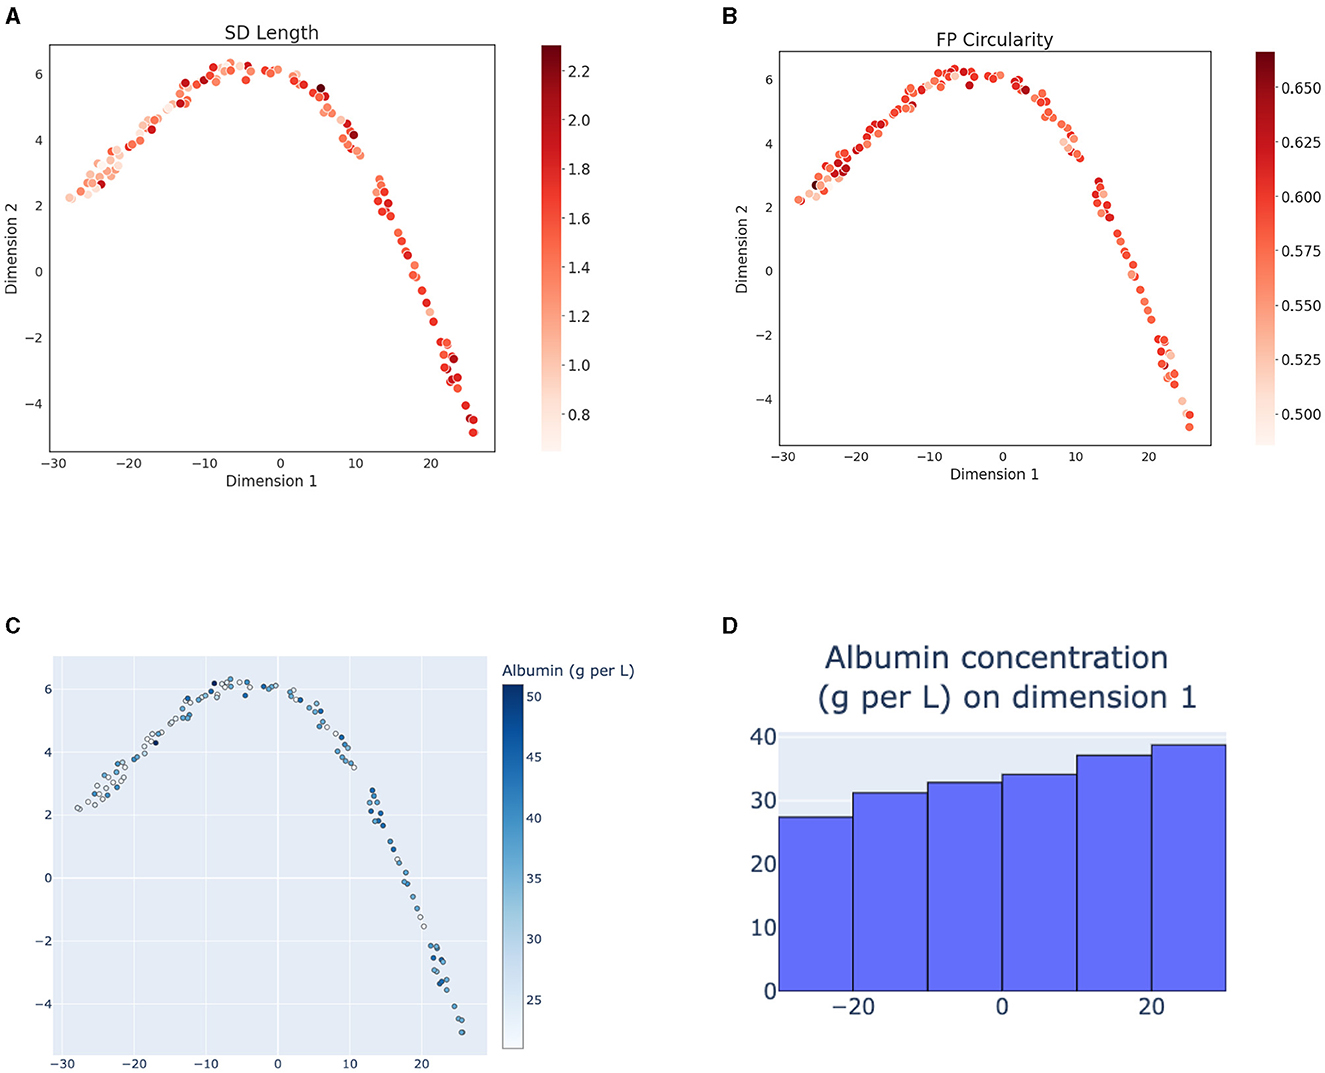
Figure 4. T-SNE projections (with perplexity = 15) of representations of human samples with respect to their morphometry and patient disease advancement. (A) 2D projection of the embeddings of the patient cohort colored according to the SD length and (B) FP circularity. (C) 2D projection colored according to the patient level of albuminuria, measured as amount of albumin in urine [g/L]. (D) Histogram of albumin levels [g/L] along the x-axes. Albumin concentration shows a gradient of increasing values along the 2D latent space projection.
3.4 Predictive power of SSL image representations
To quantitatively compare the SSL representations with image representations based on morphometric parameters, we used both types of representations in a classification task of distinguishing between the control and FSGS tissue samples (Butt et al., 2020). Using the same data split as in the SSL model, we trained two SVM-based classifiers—one on the SSL-derived image representations and one on image representations in a form of vectors of five morphometric parameter values.
Table 1 shows the accuracy of genotype prediction of the two models. While the morphometry offers high prediction accuracy in the test set, using SSL representations as an input the classifier distinguishes correctly the two groups with recall and precision of 96 and 95%, respectively (Table 1). Importantly this performance is achieved without the need of image segmentation and feature engineering.
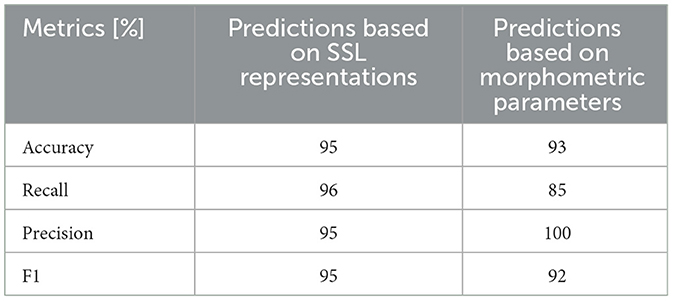
Table 1. The accuracy of binary SVM classifier (control or FSGS) based on either SSL representations (1st column) or morphometric parameters (2nd column).
As NTN and FSGS share similar morphological changes in the SD (Tesch et al., 2021), we merged these two conditions into one class and tested whether it is possible to find a separating decision boundary between control and the FSGS-NTN group. The precision and overall performance of the SVM demonstrate the sufficient separation (Table 2), though it is lower by 4% compared to FSGS-control classification shown in Table 1.
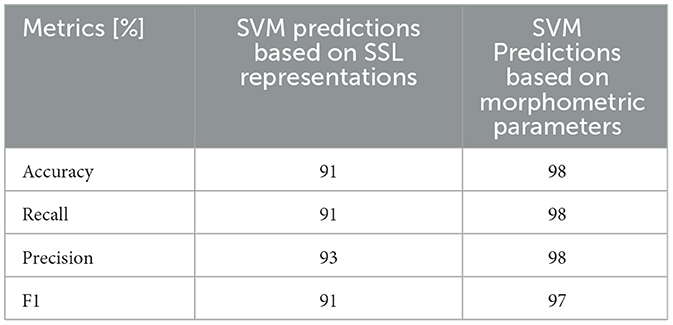
Table 2. The accuracy of SVM prediction of 2 classes FSGS & NTN vs. control based on either SSL representations (1st column) or morphometric parameters (2nd column).
To test whether the SSL-derived image representations reflect the structure of objects they contain, we trained a regression model inferring values of morphological parameters of FPs from the SSL-derived image representations. Results of inference of FP circularity and perimeter are shown in Table 3. Mean squared error is below 1 % of the circularity and below 10% of the perimeter value. These results corroborate our claim that the SSL embeddings indeed capture relevant clinical as well as morphological information about the SD.
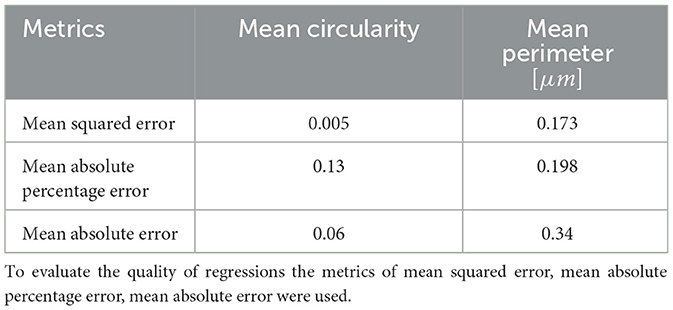
Table 3. The accuracy of CatBoost prediction of morphometric parameters based on SSL representations.
4 Discussion
With the advance of deep learning methods, segmentation of biomedical image data is increasing in accuracy. Segmenting objects of interest in an image enables the quantification of their key morphological features, such as area or circularity. While accurate, segmenting highly specific structures or images with particular characteristics often requires considerable effort in image labeling and training of the segmentation method (Wang et al., 2018). Additionally, defining morphometric features that best describe unconstrained and complex structures such as membranes, nerves, or blood vessels is challenging both in design and implementation.
Here we propose an end-to-end, unsupervised solution for capturing in biomedical images their meaningful visual features. We present an SSL model that encodes images in form of their latent representations and we generate such latent vectors of super-resolution images of SD—a specialized membrane in kidney. The resulting latent representations reflect not only morphology of the SD, quantified via several morphometric parameters, but also the clinical aspects of the disease advancement. The representations additionally allow for distinguishing between the healthy and diseased samples as well as to infer their morphological parameters.
As segmentation and quantification of visual features of biomedical image data often requires dedicated, problem-specific images, segmentation masks, and feature design, feature-based image analysis carries an important work burden (Isensee et al., 2021; Savjani, 2021). This task becomes even more difficult if annotation and feature definition requires expertise in a given branch of biomedical science. Our study showcases SSL methods as a powerful approach to mining of large image datasets in an annotation- and segmentation-free manner and provide insights without the need of their labeling and feature analysis.
Data availability statement
The datasets presented in this study can be found in online repositories. The names of the repository/repositories and accession number(s) can be found in the article/supplementary material.
Ethics statement
The studies involving humans were approved by Scientific-Ethical Committee of the University Hospital of Cologne. The studies were conducted in accordance with the local legislation and institutional requirements. The human samples used in this study were acquired from primarily isolated as part of your previous study for which ethical approval was obtained. Written informed consent for participation was not required from the participants or the participants' legal guardians/next of kin in accordance with the national legislation and institutional requirements. The animal study was approved by Scientific-Ethical Committee of the University Hospital of Cologne. The study was conducted in accordance with the local legislation and institutional requirements.
Author contributions
GS: Data curation, Investigation, Methodology, Validation, Visualization, Writing – original draft, Writing – review & editing. DU-J: Investigation, Resources, Writing – review & editing. LB: Writing – review & editing. TB: Writing – review & editing. KB: Writing – review & editing.
Funding
The author(s) declare financial support was received for the research, authorship, and/or publication of this article. GS and KB were supported by the North Rhine-Westphalia return program (311-8.03.03.02-147635), BMBF program Junior Group Consortia in Systems Medicine (01ZX1917B), and hosted by the Center for Molecular Medicine Cologne.
Acknowledgments
We thank the Regional Computing Center of the University of Cologne (RRZK) for providing computing time on the High Performance Cluster (HPC) Cheops as well as for the support.
Conflict of interest
The authors declare that the research was conducted in the absence of any commercial or financial relationships that could be construed as a potential conflict of interest.
Publisher's note
All claims expressed in this article are solely those of the authors and do not necessarily represent those of their affiliated organizations, or those of the publisher, the editors and the reviewers. Any product that may be evaluated in this article, or claim that may be made by its manufacturer, is not guaranteed or endorsed by the publisher.
Abbreviations
AMAP, Automatic Morphological Analysis of Podocytes; BT, Barlow Twins; BYOL, Bootstrap Your Own Latents; FP, Foot process; FSGS, Focal segmental glomerulosclerosis; MCD, Minimal Change Disease; MoCo, Momentum Contrast; NTN, Murine Nephrotoxic Nephritis; PCA, Principal Component Analysis; RF, Random Forest; ROI, Region of interest; SD, Slit Diaphragm; SDNS, Steroid-dependent Nephrotic Syndrome; SimCLR, Simple Framework for Contrastive Learning; SSL, Self-Supervised Learning; STED, Stimulated Emission Depletion Microscopy; t-SNE, t-Distributed Stochastic Neighbour Embedding.
References
Brähler, S., Zinselmeyer, B. H., Raju, S., Nitschke, M., Suleiman, H., Saunders, B. T., et al. (2018). Opposing roles of dendritic cell subsets in experimental gn. J. Am. Soc. Nephrol. 29, 138–154. doi: 10.1681/ASN.2017030270
Bromley, J., Guyon, I., LeCun, Y., Säckinger, E., and Shah, R. (1993). “Signature verification using a "siamese" time delay neural network,” in Advances in Neural Information Processing Systems, eds. J. Cowan, G. Tesauro, and J. Alspector (London: Morgan-Kaufmann). doi: 10.1142/9789812797926_0003
Butt, L., Unnersjö-Jess, D., Höhne, M., Binz-Lotter, J., Reilly, D., Hahnfeldt, R., et al. (2020). A molecular mechanism explaining albuminuria in kidney disease. Nat. Metabol. 2, 461–474. doi: 10.1038/s42255-020-0204-y
Butt, L., Unnersjö-Jess, D., Höhne, M., Sergei, G., Witasp, A., Wernerson, A., et al. (2021). Deep learning-based segmentation and quantification of podocyte foot process morphology. bioRxiv. doi: 10.1101/2021.06.14.448284
Chen, T., Kornblith, S., Norouzi, M., and Hinton, G. (2020). A simple framework for contrastive learning of visual representations. arXiv preprint arXiv:2002.05709.
David Unnersjö-Jess, B.utt, L., Höhne, M., Witasp, A., Kühne, L., Hoyer, P. F., Patrakka, J., et al. (2021). A fast and simple clearing and swelling protocol for 3D in-situ imaging of the kidney across scales. Kidney Int. 99, 1010–1020. doi: 10.1016/j.kint.2020.10.039
Deegens, J., Dijkman, H., Borm, G., Steenbergen, E., van den Berg, J. G., Weening, J., et al. (2008). Podocyte foot process effacement as a diagnostic tool in focal segmental glomerulosclerosis. Kidney Int. 74, 1568–1576. doi: 10.1038/ki.2008.413
Grill, J.-B., Strub, F., Altché, F., Tallec, C., Richemond, P. H., Buchatskaya, E., et al. (2020). Bootstrap your own latent: a new approach to self-supervised learning. arXiv preprint arXiv:2006.07733.
He, K., Fan, H., Wu, Y., Xie, S., and Girshick, R. (2020). Momentum contrast for unsupervised visual representation learning. arXiv preprint arXiv:1911.05722.
Hu, X., Zeng, D., Xu, X., and Shi, Y. (2021). Semi-supervised contrastive learning for label-efficient medical image segmentation. ArXiv preprint ArXiv:2109.07407.
Huang, S.-C., Pareek, A., Jensen, M., Lungren, M., Yeung, S., and Chaudhari, A. (2023). Self-supervised learning for medical image classification: a systematic review and implementation guidelines. Nature 6:74. doi: 10.1038/s41746-023-00811-0
Huber, P. J. (1964). Robust estimation of a location parameter. Ann. Mathem. Stat. 35, 73–101. doi: 10.1214/aoms/1177703732
Ichimura, K., Miyaki, T., Kawasaki, Y., Kinoshita, M., Kakuta, S., and Sakai, T. (2018). Morphological processes of foot process effacement in puromycin aminonucleoside nephrosis revealed by fib/sem tomography. JASN 30, 96–108. doi: 10.1681/ASN.2018020139
Isensee, F., Jaeger, P., Kohl, S., et al. (2021). nnU-Net: a self-configuring method for deep learning-based biomedical image segmentation. Nat. Methods 18, 203–211. doi: 10.1038/s41592-020-01008-z
Savjani, R. (2021). nnU-Net: further automating biomedical image autosegmentation. Radiol. Imag. Cancer 3:e209039. doi: 10.1148/rycan.2021209039
Shamir, L., Delaney, J., Orlov, N., and Eckley, D. (2010). Pattern recognition software and techniques for biological image analysis. PLoS Comput. Biol. 6:e1000974. doi: 10.1371/journal.pcbi.1000974
Shurrab, S., and Duwairi, R. (2022). Self-supervised learning methods and applications in medical imaging analysis: a survey. PeerJ Comput. Sci. 8:e1045. doi: 10.7717/peerj-cs.1045
Tesch, F., Siegerist, F., Hay, E., Artelt, N., et al. (2021). Super-resolved local recruitment of cldn5 to filtration slits implicates a direct relationship with podocyte foot process effacement. J. Cell. Molec. Med. 25, 7631–7641. doi: 10.1111/jcmm.16519
Unnersjö-Jess, D., Butt, L., Höhne, M., Sergei, G., Fatehi, A., Witasp, A., et al. (2023). Deep learning-based segmentation and quantification of podocyte foot process morphology suggests differential patterns of foot process effacement across kidney pathologies. Kidney Int. 103, 1120–1130. doi: 10.1016/j.kint.2023.03.013
Van der Maaten, L., and Hinton, G. E. (2008). Visualizing data using t-SNE. J. Mach. Learn. Res. 9, 2579–2605.
Vincent, P., Larochelle, H., Bengio, Y., and Manzagol, P.-A. (2008). “Extracting and composing robust features with denoising autoencoders,” in Proceedings of the 25th International Conference on Machine Learning, 1096–1103. doi: 10.1145/1390156.1390294
Wang, H., Shang, S., Long, L., Hu, R., Wu, Y., Chen, N., et al. (2018). Biological image analysis using deep learning-based methods: literature review. Dig. Med. 4, 157–165. doi: 10.4103/digm.digm_16_18
Zbontar, J., Jing, L., Misra, I., LeCun, Y., and Deny, S. (2021). Barlow twins: Self-supervised learning via redundancy reduction. arXiv preprint arXiv:2103.03230.
Keywords: self-supervised learning, bioimages, deep learning, image representations, classification
Citation: Sergei G, Unnersjö-Jess D, Butt L, Benzing T and Bozek K (2024) Self-supervised representation learning of filtration barrier in kidney. Front. Imaging. 3:1339770. doi: 10.3389/fimag.2024.1339770
Received: 16 November 2023; Accepted: 06 February 2024;
Published: 01 March 2024.
Edited by:
Lydia Bouzar-Benlabiod, Ecole Nationale Supérieure d'Informatique, AlgeriaReviewed by:
Andrew McIntyre, Acadia University, CanadaLeila Hamdad, Ecole Nationale Supérieure d'Informatique, Algeria
Copyright © 2024 Sergei, Unnersjö-Jess, Butt, Benzing and Bozek. This is an open-access article distributed under the terms of the Creative Commons Attribution License (CC BY). The use, distribution or reproduction in other forums is permitted, provided the original author(s) and the copyright owner(s) are credited and that the original publication in this journal is cited, in accordance with accepted academic practice. No use, distribution or reproduction is permitted which does not comply with these terms.
*Correspondence: German Sergei, Z2VybWFuLnNlcmdlaUB1ay1rb2Vsbi5kZQ==