 Fei Tang
 Ryan P. McMahan
- 1Department of Computer Science, University of Texas at Dallas, Richardson, TX, United States
- 2Department of Computer Science, University of Central Florida, Orlando, FL, United States
In this paper, we present a novel vibrotactile rendering algorithm for producing real-time tactile interactions suitable for virtual reality applications. The algorithm uses an energy model to produce smooth tactile sensations by continuously recalculating the location of a phantom actuator that represents a virtual touch point. It also employs syncopations in its rendered amplitude to produce artificial perceptual anchors that make the rendered vibrotactile patterns more recognizable. We conducted two studies to compare this Syncopated Energy algorithm to a standard real-time Grid Region algorithm for rendering touch patterns at different vibration amplitudes and frequencies. We found that the Grid Region algorithm afforded better recognition, but that the Syncopated Energy algorithm was perceived to produce smoother patterns at higher amplitudes. Additionally, we found that higher amplitudes afforded better recognition while a moderate amplitude yielded more perceived continuity. We also found that a higher frequency resulted in better recognition for fine-grained tactile sensations and that frequency can affect perceived continuity.
Introduction
The visual and auditory fidelity of virtual reality (VR) systems have dramatically increased with modern consumer technologies, such as the Oculus Rift and the HTC Vive. However, many VR systems lack a high degree of tactile fidelity (McMahan, 2018). Some VR applications employ vibrotactile feedback via the handheld controllers, but these tactile stimuli are often rudimentary due to the limitations of employing a single vibration motor or actuator. Researchers have begun investigating the use of peripheral devices with multiple actuators, such as grid-based sleeves (Huisman et al., 2013) and vests with rows of motors (García-Valle et al., 2016), in attempts to increase the tactile fidelity of real-time interactions.
However, current vibrotactile rendering algorithms are limited in producing high-fidelity tactile sensations. Region-based algorithms offer low-latency tactile fidelity through real-time interactions by simply rendering to the actuator that represents the touched region (Huisman et al., 2013; García-Valle et al., 2016). However, prior research has demonstrated that the resolution of the mapped regions has a significant effect on the quality of the tactile stimuli perceived (Tang et al., 2017). Hence, region-based algorithms require greater tactile resolution to afford high-fidelity tactile stimuli. On the other hand, researchers have demonstrated that apparent tactile motions can be effective with low-resolution tactile displays (Yanagida et al., 2004). Israr and Poupyrev (2011b) specifically developed the Tactile Brush algorithm to provide smooth, high-fidelity tactile stimuli with grid-based tactile displays. However, the Tactile Brush algorithm cannot be used to render real-time interactions because it requires a complete input pattern before it can compute its four-step process.
In this paper, we discuss the development of a new real-time vibrotactile rendering algorithm designed to produce smooth, high-fidelity tactile stimuli. The first iteration of the algorithm was based on the same energy model that Israr and Poupyrev (2011b) used to calculate the locations of their phantom actuators. However, in a preliminary study, we found that users struggled to accurately recognize tactile patterns rendered by this Energy algorithm, in comparison to the original Tactile Brush. In the second iteration of the algorithm, we used syncopations in the rendered amplitude to produce artificial perceptual anchors, similar to those created by Cholewiak and Collins (2003). We found that these syncopations dramatically improved the recognition quality of the Energy algorithm.
To evaluate the efficacy of our new real-time algorithm, we conducted two user studies to compare the recognition accuracy and perceived continuity of our Syncopated Energy algorithm to a Grid Region algorithm. We evaluated the two real-time algorithms at three rendered amplitudes for ten tactile patterns representing five single-finger and five whole-hand touch interactions on the user's upper arm. In our first study, we evaluated amplitudes of 1.40 and 1.74 G at a constant frequency of 175 Hz. The results of this study indicated that the Grid Region algorithm afforded significantly better recognition accuracy than our new Syncopated Energy algorithm. However, a significant interaction effect of algorithm and amplitude indicated that the Syncopated Energy algorithm may afford greater perceived continuity at higher amplitudes. Hence, in our second study, we evaluated the amplitudes of 1.74 and 2.35 G at a constant frequency of 225 Hz. Again, the Grid Region algorithm afforded significantly better recognition accuracy, but our Syncopated Energy algorithm afforded significantly more perceived continuity. From the two studies, we also found that increasing amplitude generally improved recognition accuracies and that increasing frequency improved recognition accuracies for the single-finger touch gestures.
Related Work
We review several aspects of prior tactile research below. First, we discuss the temporal and spatial aspects of tactile stimuli. We then discuss characteristics specific to vibrotactile stimuli, which are generated by vibration motors such as linear resonate actuators (LRAs) and eccentric rotating mass (ERM) motors. Finally, we discuss prior vibrotactile rendering algorithms that have been used to convey the sensation of being touched in VR applications.
Temporal Aspects of Tactile Stimuli
Prior researchers have investigated the temporal aspects of tactile stimuli, including the durations of individual stimuli, the intervals between the onsets of stimuli, and the synchronization of tactile and non-tactile stimuli.
The duration of an individual tactile stimulus has been found to influence perceived intensity, despite controlling the amplitude of the stimulus. Bochereau et al. (2014) found that tactile stimuli are perceived to have greater intensities as their durations are lengthened. This result is similar to visual (Baumgardt and Hillmann, 1961; Ekman, 1966) and auditory (Kryter and Pearsons, 1963; Stévens and Hall, 1966) stimuli being perceived as having greater intensities with lengthier durations.
The durations of stimuli and the intervals between the onsets of consecutive stimuli have been found to be the most important rendering parameters for producing the sensation of apparent tactile motion (van Erp, 2002). Early research by Sherrick and Rogers (1966) indicated that acceptable intervals between the onset of stimuli varied with the durations of the stimuli. If the intervals were much shorter than the durations, users would perceive the stimuli to be simultaneous. If the intervals were approximately equal to the durations, users would perceive the stimuli to be in succession, as opposed to perceiving motion between them. Kirman (1974) and Israr and Poupyrev (2011a) have similarly found that the optimal interval for apparent tactile motion is dependent upon the durations of the stimuli.
The durations and intervals between stimuli have also been shown to affect recognition of tactile patterns. Shimizu (1982) found that increasing the duration of stimuli improved recognition of characters rendered via a tactile display. While he did not find an effect of the interval on recognition accuracy, Shimizu did find that increasing the interval afforded faster responses for the task. In a similar study focused on recognizing single-axis directions, Niwa et al. (2009) found that increasing the durations and intervals between the onset of stimuli improved recognition.
Another perceptual phenomenon has been successfully produced by modifying the temporal relationships among tactile stimuli and spatial gaps between them in order to produce a perceived single continuous stimulus (Seizova-Cajic and Taylor, 2014; Kaneko et al., 2018). Seizova-Cajic and Taylor (2014) used two brushes fixed 9 cm apart, moving back and forth along the forearm, and a 10 cm occluder to demonstrate that the temporal aspects of two disjoint tactile stimuli can yield a single continuous percept, overriding the spatial aspects of the stimuli and the gap between them. Kaneko et al. (2018) have conducted a similar study using virtual edges on the fingertip. Their research indicates that the speed with which the gap is traversed between the two tactile stimuli determines whether the gap is perceived or not. If the gap is traversed faster than 0.2 s, users perceive the first stimulus as continuing across the gap, as opposed to the second stimulus starting at the end of the gap. If the gap is traversed at the same speed as the stimuli, users clearly perceive the second stimulus starting at the end of the gap, as opposed to the first stimulus continuing across the gap.
Another temporal aspect of tactile stimuli that has been investigated are synchronization effects with non-tactile stimuli. Kokkinara and Slater (2014) found synchronous visuotactile stimulations allowed body ownership illusions (i.e., perception of owning and controlling a virtual body) while asynchronous visuotactile stimulations broke the illusion. Bekrater-Bodmann et al. (2014) conducted a similar study on the effects of visuotactile synchronicity on body ownership of a virtual limb. They found that asynchronies of ±300 ms did not significantly diminish the illusion while asynchronies of ±600 ms did.
Spatial Aspects of Tactile Stimuli
Researchers have also investigated the spatial aspects of tactile stimuli, including the spacing between stimuli and where stimuli are placed on the body.
Greater spacing between stimuli has been shown to improve users' ability to localize where a tactile stimulus is being felt. In an early research study, Rogers (1970) provided evidence that tactile stimuli spaced 2 mm apart on the fingertips were significantly more difficult to distinguish than stimuli spaced 6 mm apart. Cholewiak and Collins (2003) found similar results in another localization study. They found that a spacing of 50.8 mm afforded significantly better localization accuracy than a smaller spacing of 25.4 mm on the forearm.
Spacing between tactile stimuli has also been shown to affect the perception of apparent tactile motion. Cha et al. (2008) found that users were unable to distinguish apparent motion at 20 mm spacing. Users could perceive motion at 40 and 60 mm. However, at 80 and 100 mm, users felt that the perceived motion was becoming faint. Niwa et al. (2009) found that users were more accurate at recognizing single-axis directions with smaller spacing (four or five tactors spaced evenly around the arm) than with a larger spacing (three evenly spaced tactors). Similarly, Tang et al. (2017) found that users preferred touch gestures rendered at a tactile resolution of one actuation per 12 cm2 over a lower resolution of one actuation per 36 cm2.
The placement of tactile stimuli on the body has also been shown to affect perception. Research by Craig and Lyle (2002) indicates that the highest acuity for spatial tactile stimuli exists at body sites that are highly innervated and have dense spacing among receptors. This is not surprising given the early work of Penfield and Rasmussen (1950), which yielded the somatosensory homunculus that indicates some areas of the skin correlate to disproportionately large areas within the brain. As a result of these differences in body sites, Israr and Poupyrev (2011a) found that spacing between stimuli was a significant factor on the forearm, but not on the user's back. Even more interestingly, Cholewiak and Collins (2003) found that users were more accurate at localizing stimuli at the elbow and wrist than stimuli presented between the two sites. However, they also demonstrated that artificial perceptual anchors (e.g., a high-frequency stimulus among an array of low-frequency stimuli) could be used to improve localization at ambiguous sites (e.g., middle of the elbow and wrist).
Vibration Aspects of Vibrotactile Stimuli
There are many types of tactile stimuli: vibrotactile, mechanical displacement, electrocutaneous, electrovibration, surface friction, thermoelectric, and pressurized air (LaViola et al., 2017). However, vibrotactile stimuli are perhaps the most common considering mobile phones and tablets. Three key aspects of vibrotactile stimuli are the frequency, amplitude, and timbre of the vibrations generated. Frequency and amplitude are known to directly affect the perceived intensity of vibrations (Cha et al., 2008). Timbre, or the spectral content of the vibrotactile signal (Rovan and Hayward, 2000), has been shown to affect the perceived roughness of vibrations (Hoggan et al., 2007; Strohmeier and Hornbæk, 2017).
Researchers have found mixed effects due to changing the frequency of vibrotactile stimuli. Over a series of studies, Cholewiak and Collins (2003) found minimal to no effect of varying frequency between 100 and 250 Hz on localizing tactile stimuli. Similarly, Israr and Poupyrev (2011a) found that changing frequency between 200 and 270 Hz had no significant effect on the acceptable intervals of onsets to perceive tactile motion. However, in another study, Israr and Poupyrev (2011b) found that a larger range of frequency (150–270 Hz) significantly affected onset thresholds and recommended using lower frequency vibrations to generate apparent tactile motions. Hwang et al. (2013) have also found frequency to have a significant effect on the perceived intensity of vibrotactile stimuli in a mobile device. For other types of tactile stimuli, frequency has also been found to significantly affect the recognition of characters (Rogers, 1970) and heights (Lim et al., 2011).
Researchers have also found the amplitude of vibrotactile stimuli to have effects on perception. In particular, for perceiving the apparent tactile motion illusion, Seo and Choi (2010) found that the perceived intensity of a motion was much more consistent when the amplitudes of the two neighboring vibration motors were logarithmically scaled instead of linearly scaled. Israr and Poupyrev (2011b) used an energy summation model to control the amplitude of vibrotactile stimuli in their Tactile Brush algorithm. However, in another study (Israr and Poupyrev, 2011a), they did not find a significant effect of amplitude on the acceptable intervals of onsets to perceive tactile motions.
Outside of affecting apparent tactile motion, amplitude has been shown to affect other perceptions. Toda et al. (2013) found that changing the amplitude of vibrotactile stimuli relative to the angle of interaction yielded the best ratings for using a virtual knife device. Hwang et al. (2013) found that increasing amplitude significantly increases the perceived intensity of the vibrotactile stimuli. Similarly, increasing amplitude has been shown to improve localization for mechanical-displacement tactile stimuli (Rogers, 1970).
Timbre, the quality and waveform of a vibrotactile signal (Strohmeier and Hornbæk, 2017), has been used to create tactons, or tactile icons (Brewster and Brown, 2004), and tactile musical devices (Jack et al., 2015). Early research on timbre by Rovan and Hayward (2000) found that the range of pure sine spectrum to a frequency-rich spectrum to a noisy spectrum is characterized as a continuous transition from smoothness to roughness. Strohmeier and Hornbæk (2017) found similar results recently with perceived roughness being associated with lower timbre than perceived bumpiness. However, with regard to recognition, Gunther (2001) found that users were able to differentiate between sine waves and square waves, but were unable to perceive subtle variations in timbre.
For our research, we chose to investigate frequency and amplitude, but not timbre, as we focused solely on vibrotactile stimuli produced by sine wave signals.
Vibrotactile Rendering Algorithms for VR
As previously discussed, providing tactile sensations for being touched in VR applications has been historically limited. In turn, researchers have developed potential solutions like the Tactile Sleeve for Social Touch (TaSST) (Huisman et al., 2013). However, how vibrotactile stimuli should be rendered to such tactile devices is not clear.
For the TaSST, Huisman et al. (2013) used a simple grid region algorithm, in which the compressions detected by each Lycra pad of the sleeve's input grid were directly rendered to the corresponding region and vibration motor. Yanagida et al. (2004) used a similar one-to-one approach for rendering alphanumeric characters to a 3-by-3 grid-based tactile display. However, they did not use a simple grid for partitioning input regions. They specifically used an octagon shape for the center region to allow diagonal strokes to only affect the diagonal motors of the grid-based tactile display. While both grid region algorithms allow for real-time rendering of vibrotactile stimuli, neither affords continuous apparent tactile motion.
On the other hand, the Tactile Brush algorithm, developed by Israr and Poupyrev (2011b), provides smooth, two-dimensional apparent tactile motions. The Tactile Brush algorithm uses a four-step process to produce the apparent tactile motions. First, phantom actuators are computed along the gridlines based on the trajectory of the touch input. Second, the timestamps for each actuator, physical or phantom, are calculated based on the speed of the input stroke. Third, the durations and intervals for onsets are calculated to produce apparent tactile motion. Finally, the logarithmic energy summation model is used to set the amplitude of each physical actuator for simulating the phantom actuators. While these steps yield realistic apparent tactile motions, the Tactile Brush algorithm cannot be used to render real-time sensations, as the touch input must be complete before the steps are computed.
New Vibrotactile Rendering Algorithms
Our research goal was to address the lack of a real-time vibrotactile rendering algorithm capable of producing smooth tactile motions.
Energy Algorithm
Our initial attempt to create a vibrotactile rendering algorithm capable of real-time, smooth tactile motion was the “Energy” algorithm. It was inspired by the energy summation model used by Israr and Poupyrev (2011b) to create phantom actuators along the gesture path. In the model, the intensity and position of a phantom actuator P is determined by setting the amplitudes of its neighboring physical actuators, AN and AN+1, where β is the distance between AN and P divided by the distance between AN and AN+1:
Using this same energy model, we developed a real-time vibrotactile rendering algorithm by applying the model horizontally and then vertically for any touch point within a grid-based display. Given a phantom touch point PT, the Energy algorithm first computes two horizontal phantom actuators on the grid, PH and PH+1, using (1). Then, for each horizontal phantom actuator, the Energy algorithm employs (1) again to calculate how the two neighboring physical actuators on the same vertical gridline contribute to the horizontal phantom actuator. Calculated amplitudes are then rendered by modulating the voltage to the physical vibrotactile actuators. Figure 1 depicts these horizontal and vertical computations. Note, for touch points occurring on a vertical gridline, a single horizontal phantom actuator is calculated.
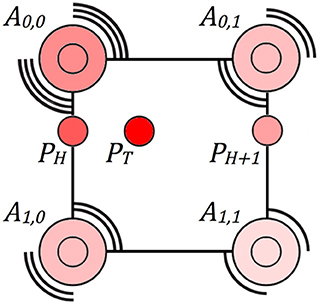
Figure 1. For a given touch point PT, the Energy algorithm first computes two horizontal phantom actuators, PH and PH+1. The Energy algorithm then computes how the physical actuators A0,0 and A1,0 contribute to PH and how A0,1 and A1,1 contribute to PH+1. The color saturation of each actuator represents its relative amplitude.
In a preliminary study, we compared our new Energy algorithm to the original Tactile Brush algorithm for a tactile pattern recognition task. In general, participants perceived smooth motions with both rendering algorithms. However, we found that participants were significantly better at recognizing patterns with the Tactile Brush than the Energy algorithm. Additionally, many participants commented on needing stronger vibrations with the Energy algorithm to effectively distinguish patterns. This lack of perceived intensity was likely because the Energy algorithm gradually increases the amplitude of a given actuator, as defined by the energy summation model. However, the Tactile Brush algorithm rapidly changes actuator amplitudes based on durations and intervals to produce apparent tactile motions.
While our Energy algorithm can produce real-time, smooth tactile motions, we considered its lower recognition accuracy and overall intensity to be major shortcomings. Hence, we set out to improve upon it.
Syncopated Energy Algorithm
To improve user recognition of tactile patterns rendered with our Energy algorithm, we further investigated the concept of perceptual anchors. In early research, Braida et al. (1984) demonstrated that listeners will better identify acoustic stimuli associated with the upper and lower extremes of the relevant range of stimuli. They referred to these extremities as perceptual anchors. More recently, Cholewiak and Collins (2003) demonstrated the feasibility of artificial perceptual anchors by using a high-frequency stimulus presented among an array of lower-frequency stimuli to improve localization at ambiguous sites, such as the middle of the forearm. Considering this, we decided to investigate artificial perceptual anchors.
Though Cholewiak and Collins (2003) used frequency to create artificial perceptual anchors, we decided to investigate amplitude-based perceptual anchors instead. As discussed in section Vibration aspects of vibrotactile stimuli, previous research studies have demonstrated mixed effects for frequency (Cholewiak and Collins, 2003; Israr and Poupyrev, 2011a,b; Hwang et al., 2013). However, several researchers have demonstrated the significant effects of amplitude on vibrotactile perceptions (Seo and Choi, 2010; Israr and Poupyrev, 2011b; Hwang et al., 2013; Toda et al., 2013). In particular, increasing amplitude has been shown to increase perceived intensity (Hwang et al., 2013), which was noticeably lacking in our preliminary study of the Energy algorithm.
One approach to creating artificial perceptual anchors would be to simply increase the amplitude of a tactile motion at predefined points or intersections. But, increasing amplitude is not feasible with low-amplitude vibration motors, like the LRAs found in most mobile devices. To afford a perceivable increase in amplitude, these low-amplitude actuators would need to be used at even lower amplitudes, which would degrade the overall quality of the tactile patterns rendered. However, if near-maximum amplitudes were generally used to render tactile patterns, then decreases in amplitude could be used to create artificial perceptual anchors. This was the insight of our “Syncopated Energy” algorithm.
Our Syncopated Energy algorithm essentially creates artificial perceptual anchors at the gridlines of a grid-based vibrotactile display. When a tactile pattern crosses a new gridline, the Syncopated Energy algorithm reduces the amplitude of the contributing vibrotactile actuators to zero for 30 ms. Before and after this 30 ms syncopation, the Syncopated Energy algorithm uses the same logarithmic amplitudes as the Energy algorithm for rendering tactile patterns using (1). Figure 2 shows how the Syncopated Energy algorithm differs from the original Energy algorithm.
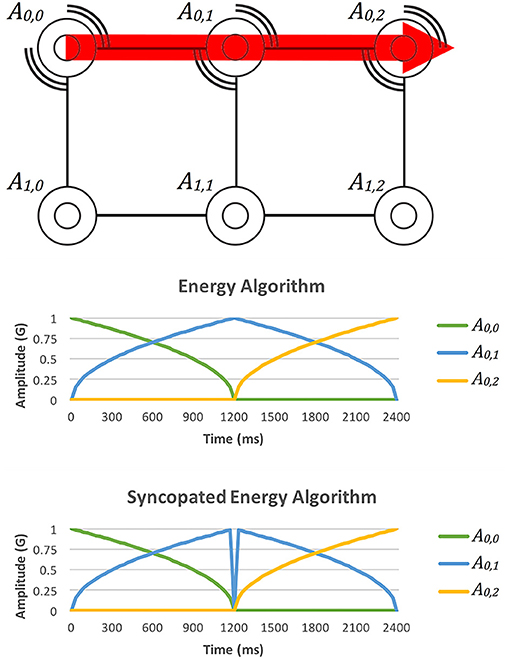
Figure 2. A comparison of the Energy and Syncopated Energy algorithms for a tactile motion moving from A0,0 through A0,1 and to A0,2. As the motion passes over the vertical AX,1 gridline, the original Energy algorithm renders a maximum amplitude stimulus at A0,1. On the other hand, the Syncopated Energy algorithm drops the amplitude to zero for 30 ms and then continues rendering as normal.
We chose to use 30 ms for the syncopation window based on empirical results from a small pilot study involving three participants. It was the minimal temporal delay that all of the participants could distinguish the Syncopated Energy algorithm from the Energy algorithm. We chose to use this minimal delay to best conserve the tactile motion aspects of the Energy algorithm.
We also incorporated a render history into the Syncopated Energy algorithm to avoid creating too many syncopations. When the Syncopated Energy algorithm renders a syncopation for a gridline, that gridline is added to the render history. After 300 ms in the history, the gridline is removed. Whenever a tactile pattern crosses a gridline, the Syncopated Energy algorithm will not render the syncopation if the gridline is already in the render history. Instead, it renews the 300 ms lifetime of the gridline to remain in the history. This is why syncopations are not continuously rendered as the tactile pattern depicted in Figure 2 moves along the A0,X gridline. Furthermore, to avoid back-to-back syncopations when a tactile pattern crosses near the intersection of two gridlines, the Syncopated Energy algorithm does not render a syncopation if one has been rendered in the last 300 ms. Instead, it renews or adds the encountered gridline to the render history.
Experiment I
Having created the Syncopated Energy algorithm, which can render smooth tactile motions, we decided to evaluate the efficacy of our new real-time algorithm by comparing it to the common grid region algorithms used in prior real-time vibrotactile rendering applications (Yanagida et al., 2004; Huisman et al., 2013). To assess the efficacy of the Syncopated Energy algorithm's smooth tactile motions, we investigated the recognition accuracy and perceived continuity afforded by both algorithms for ten tactile patterns. Because we designed the Syncopated Energy algorithm to leverage amplitude, we also investigated whether the amplitude that the algorithms were rendered at affected their recognition accuracies and perceived continuities.
Grid Region Algorithm
For comparison purposes, we implemented a Grid Region algorithm. Like prior region algorithms (Yanagida et al., 2004; Huisman et al., 2013), our Grid Region algorithm is capable of real-time vibrotactile rendering. When an input touch point is detected within a region of the grid-based vibrotactile display, the algorithm activates the vibration motor within that region (see Figure 3A). This algorithm is seemingly simple, however, we had to decide how to handle ambiguities caused by the input touch point residing within multiple regions at once. This is particularly relevant for tactile patterns with diagonal motions. Yanagida et al. (2004) used an octagon shape for the center region to resolve these diagonal ambiguities. However, such an octagon shape results in the center region representing a larger area compared to the other regions, and in turn, the center vibration motor is activated more often. To maintain equal representation of each region, but to address the issue of ambiguous input at region boundaries, we opted to continue activating the vibration motor rendered to in the previous input frame when multiple regions receive touch input, even if the previously rendered region is not included (see Figure 3B). Once the touch input is clearly identified within a new region, our Grid Region algorithm begins rendering to the new vibration motor (see Figure 3C).
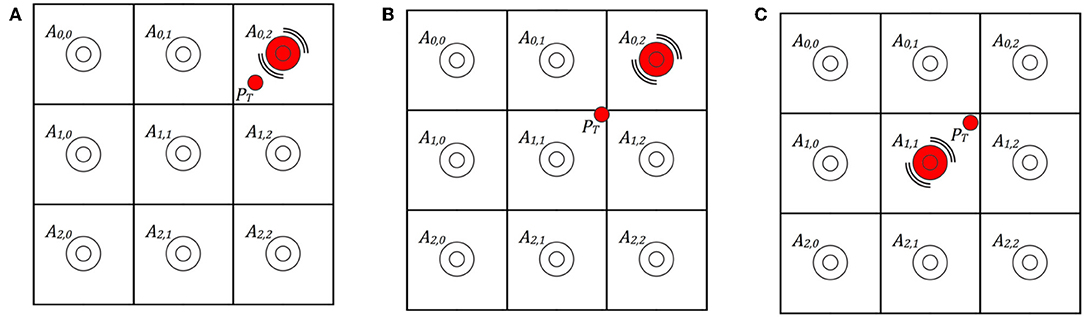
Figure 3. The Grid Region algorithm used in our experiments. (A) For a given touch point PT, the algorithm renders to the actuator representing PT's region, which is A0,2. (B) Our Grid Region algorithm implementation solves ambiguities by rendering to the previous frame's actuator, which again is A0,2. (C) Our Grid Region algorithm begins rendering to a new actuator, A1,1 in this case, when the touch input is no longer ambiguous.
Tactile Pattern Recognition Task
For our experiment, we used a tactile pattern recognition task similar to prior tactile studies (Rogers, 1970; Shimizu, 1982; Yanagida et al., 2004; Niwa et al., 2009; Lim et al., 2011). For each task trial, a spatiotemporal tactile pattern was rendered to a tactile sleeve display worn on the participant's upper left arm. We selected a total of ten spatiotemporal tactile patterns for the experiment from previous studies (Yanagida et al., 2004; Niwa et al., 2009; Tang et al., 2017). We chose five single-finger touch gestures to assess fine-grained tactile sensations and five whole-hand touch gestures to assess broad-stroked tactile sensations.
The five single-finger touch gestures were: (a) a downward stroke from the shoulder to the elbow, (b) a stroke drawing a circle on the upper arm, (c) a stroke drawing the letter “Z,” (d) two strokes drawing the letter “X,” and (e) two strokes drawing the symbol “+.” Figure 4 depicts how each of these single-finger touch gestures were rendered differently by the Grid Region and Syncopated Energy algorithms. However, both algorithms rendered the gestures within the same period: (a) 1,600 ms, (b) 4,800 ms, (c) 3,600 ms, (d) 3,000 ms, and 3,000 ms, relatively. For the last three gestures, the new strokes immediately followed the previous stroke (i.e., an interval of 0 ms between strokes).
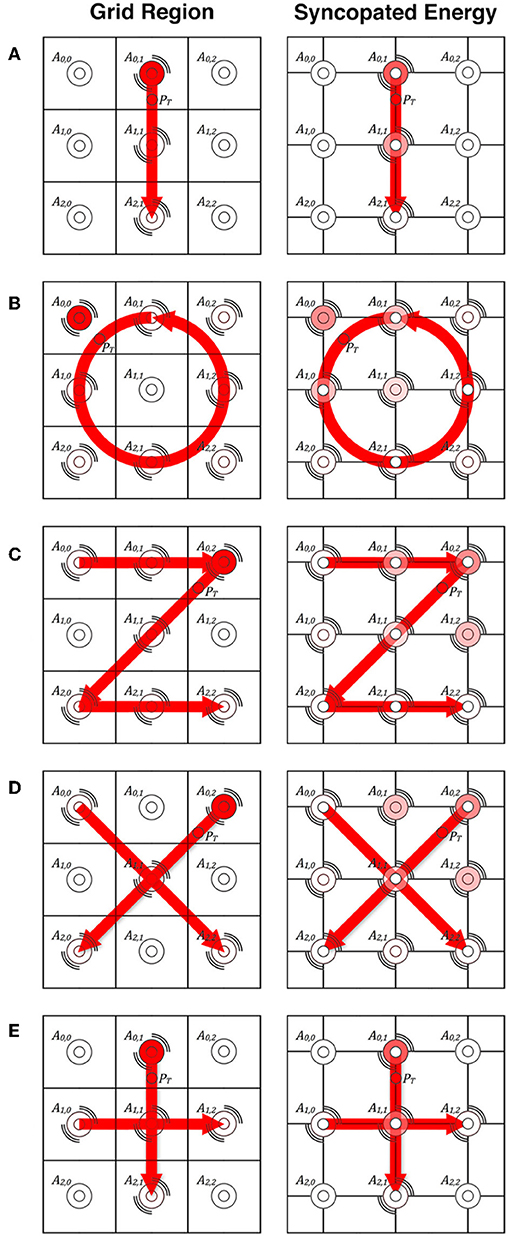
Figure 4. The single-finger touch gestures rendered in our first experiment by the Grid Region and Syncopated Energy algorithms. Resonating lines indicate actuators that will be activated at some point during the gesture. The color saturation of each actuator represents its relative amplitude for the given touch point PT along the gesture path. Small white circles, usually centered over actuators, represent syncopation points. (A) The downward single-finger gesture. (B) The circle gesture. (C) The “Z” gesture. (D) The “X” gesture. (E) The “+” gesture.
The five whole-hand touch gestures were: (a) a downward stroke from the shoulder to the elbow, (b) a repetitive stroking between the shoulder and elbow, (c) a backward stroke across the middle of the upper arm, (d) a repetitive stroking across the middle between front and back, and (e) three pats on the middle of the upper arm. Figure 5 depicts how each of these whole-hand touch gestures were rendered differently by the two algorithms. However, again, both algorithms rendered the gestures within the same period: (a) 1,600 ms, (b) 4,800 ms, (c) 1,600 ms, (d) 4,800 ms, and 1,200 ms, respectively.
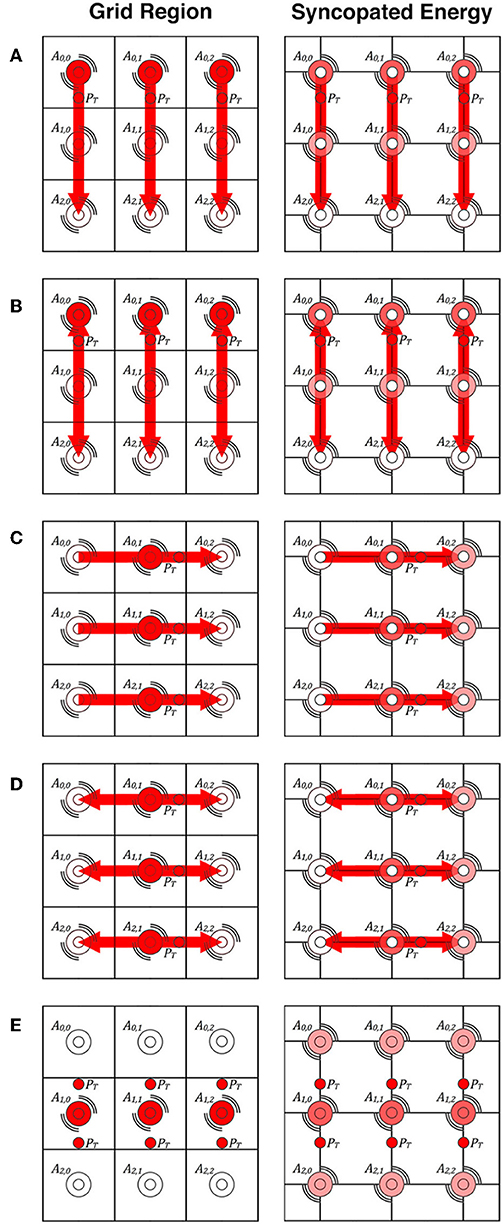
Figure 5. The whole-hand touch gestures rendered in our first experiment by the Grid Region and Syncopated Energy algorithms. Resonating lines indicate actuators that will be activated at some point during the gesture. The color saturation of each actuator represents its relative amplitude for the closest given touch point PT. Small white circles, usually centered over actuators, represent syncopation points. (A) The downward whole-hand gesture. (B) The repetitive downward-upward gesture. (C) The backward hand gesture. (D) The repetitive backward-forward hand gesture. (E) The repetitive whole-hand pat.
Vibrotactile Sleeve Displays
To render our tactile patterns, we developed arm-based vibrotactile sleeve displays similar to the one created by Tang et al. (2014). Each of our vibrotactile displays consisted of a 3-by-3 grid of actuators sewn onto an elastic McDavid compression arm sleeve. We created small, medium, and large versions of the sleeve display to accommodate users with different-sized arms. The vertical spacing of the actuators was 6 cm for all three sizes while the horizontal spacing was 4 cm for the small, 5 cm for the medium, and 6 cm for the large sleeve. However, when worn, the horizontal spacing changes relative to the user's arm size. For example, the medium sleeve would expand to 6 cm on average, which yielded one actuation per 36 cm2, in terms of spatial resolution (Pasquero and Hayward, 2003). Finally, because McDavid sleeves are designed to cover the forearm and upper arm, we cut off the forearm portion to increase comfortability (see Figure 6).
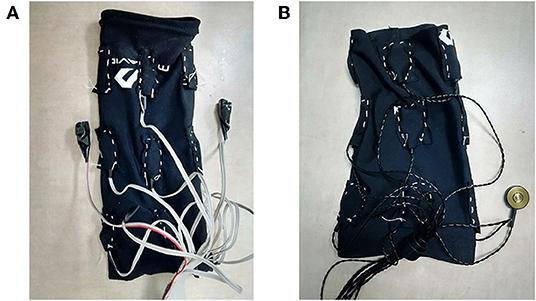
Figure 6. The vibrotactile sleeve displays used in our experiments. Small, medium, and large versions were created to accommodate users with different-sized arms. (A) One of the C10-100 sleeves used in our first experiment. (B) One of the C-3 sleeves used in our second experiment.
We used an Arduino Mega 2560 microcontroller to render the vibrotactile patterns to each display. The Mega 2560 interfaces with a computer via a serial port with a USB cable and can be controlled from most applications. We used nine of the Mega 2560's PWM outputs and nine FAH4830 haptic drivers from Fairchild Semiconductor International to drive the vibrotactile actuators. We also had to use an external battery with an output of 5V and 2A, distributed via a bus, to power the drivers, because the Mega 2560 could not provide the required power.
For each actuator, we stacked and glued together two C10-100 LRAs manufactured by Precision Microdrives. We split the signal coming from each haptic driver to ensure that both LRAs would vibrate at the exact same time. We used two LRAs to investigate higher amplitudes for our experiment. Per Precision Microdrives, a single C10-100 affords an amplitude of 1.40 G and a resonant frequency of 175 Hz. Using an accelerometer and the vibration measurement method described by Precision Microdrives (2014), we determined that sending an intensity signal of 0.67 to both LRAs produced the same amplitude of 1.40 G. We chose to use this amplitude to represent using a single LRA instead of our stacked dual LRAs. Using the same method, we also determined that sending a maximum intensity signal of 1.00 to both LRAs produced a maximum amplitude of 1.74 G.
Independent and Dependent Variables
For our experiment, we had three independent variables: the real-time tactile rendering algorithm (Grid Region or Syncopated Energy), the rendered amplitude (1.40 or 1.74 G), and the vibrotactile pattern rendered (one of the five single-finger or five whole-hand touch gestures). We varied all these independent variables with subject. We also used two trials for each condition. Hence, each participant evaluated a total of 80 vibrotactile patterns (2 algorithms × 2 amplitudes × 10 gestures × 2 trials).
For our experiment, we had two dependent variables: the tactile pattern recognition accuracy and a continuity rating. Recognition accuracy was calculated as the percentage of the correctly recognized patterns compared to the total evaluated patterns, similar to Yanagida et al. (2004). Continuity ratings were collected for each evaluated pattern, similar to the subjective measures used by Israr and Poupyrev (2011a). For each pattern, participants had to rate the perceived continuity of the pattern from “1 (Not continuous)” to “5 (Very continuous).”
Research Questions and Hypotheses
For our experiment, we had four research questions.
IQ1. Which real-time rendering algorithm affords the greater recognition accuracy? IH1a. Due to its smooth motions but distinguishing syncopations, we hypothesized that our new Syncopated Energy algorithm would yield better recognition accuracy than the Grid Region algorithm for single-finger tactile gestures. IH1b. However, we hypothesized that there would not be a significant difference between the two for the whole-hand gestures, due to the gestures' large distinguishing motions.
IQ2. Which rendered amplitude affords the greater recognition accuracy? IH2. Given prior research results indicating that increased amplitude improves perception (Rogers, 1970; Seo and Choi, 2010; Israr and Poupyrev, 2011b; Hwang et al., 2013; Toda et al., 2013), we hypothesized that the higher amplitude of 1.74G would afford significantly better recognition accuracies than the lower 1.40 G amplitude, for both single-finger and whole-hand tactile gestures.
IQ3. Which real-time rendering algorithm produces tactile gestures with the greater perceived continuity? IH3. We hypothesized that our Syncopated Energy algorithm would produce the more continuous tactile gestures due to its smooth motions and underlying energy model.
IQ4. Which rendered amplitude produces tactile gestures with the greater perceived continuity? IH4. Again, given prior research results indicating that increased amplitude improves perception, we hypothesized that the higher amplitude of 1.74G would afford significantly greater perceived continuity than the lower amplitude.
Procedure
The following procedure was approved by the University of Texas at Dallas Institutional Review Board (IRB).
After giving informed consent, participants were given a background survey to collect general demographic information (e.g., gender, dominant hand, arm size, etc.). Each participant was then presented with a graphical user interface that displayed a video and an icon for each of the ten touch gestures, to train the participant on what touch gesture each tactile pattern icon represented. The participant was then presented with a second user interface that played the ten touch gesture videos in a random order, and for each video, the participant had to select which of the ten icons represented that video. An incorrect response would result in the video being played again at the end of the queue until the participant had chosen the correct icon for each gesture video.
After being trained and tested on understanding what touch gesture each tactile pattern icon represented, each participant was provided the tactile sleeve display that best matched their arm size measured during the background survey. At this time, the experimenter would verify that the center column of actuators (AX,1) was aligned with the center of the exterior of the left upper arm to ensure proper placement. Note, we chose the left arm, as opposed to the non-dominant or dominant arm, to avoid ambiguities between the tactile pattern icons and the rendered vibrotactile patterns. Additionally, we chose the left arm over the right to allow easier control of the mouse for most participants, as most users are right handed.
With the tactile sleeve display properly donned, the participant was then presented with another graphical user interface for the tactile pattern recognition task. For each trial, the participant could have the vibrotactile pattern rendered to the sleeve display one time by pressing the “Play Gesture” icon. Each pattern could only be played once. Once played, the participant would choose which of the ten icons best represented the perceived vibrotactile pattern. If the participant was unsure, the participant could choose a “?” icon. After completing the recognition task, the user interface would ask the participant to “Please rate the continuity of the tactile feedback from 1 to 5:” with the anchors “1 (Not continuous)” and “5 (Very continuous).” The 80 tactile patterns were randomly presented for each participant to avoid potential effects of presentation order.
After completing the 80 recognition trials, the participants were given an exit questionnaire regarding the tactile sleeve display. The questionnaire addressed potential issues relating to discomfort, device weight, excessive pressure, and slippage. Finally, the questionnaire asked participants to provide any additional comments.
Participants
We recruited 29 unpaid participants (27 males, 2 females) through university listservs for our experiment. The age range of the participants was 18–41 years old with a mean age of 23.2 years. Only one of the participants was left handed. Hence, most of the participants wore the tactile sleeve display on his or her non-dominant arm. Two of the participants reported discomfort on their exit questionnaires. However, these participants had above-average recognition accuracies, indicating that they most likely did not suffer any form of numbness due to discomfort.
Results
Recognition Accuracy
For recognition accuracy, we conducted a three-way (algorithm, amplitude, gesture) repeated-measures analysis of variance (ANOVA) at a 95% confidence level. Mauchly's Test of Sphericity indicated that the assumption of sphericity was not violated and the data set passed the Shapiro-Wilk normality test. We did not find a significant three-way interaction effect for algorithm, amplitude, and gesture on recognition accuracy, F(9, 252) = 0.762, p = 0.652. Similarly, we did not find a significant two-way interaction for algorithm and amplitude, F(1, 28) = 1.787, p = 0.192. However, we did find a significant two-way interaction effect for algorithm and gesture, F(9, 252) = 2.257, p = 0.019. The Grid Region algorithm afforded significantly better recognition accuracy than the Syncopated Energy algorithm for the downward single-finger stroke and “Z” gestures (see Figure 7). Additionally, the Grid Region algorithm afforded significantly better recognition accuracy for the downward, backward, and repetitive backward-forward whole-hand gestures (see Figure 8).
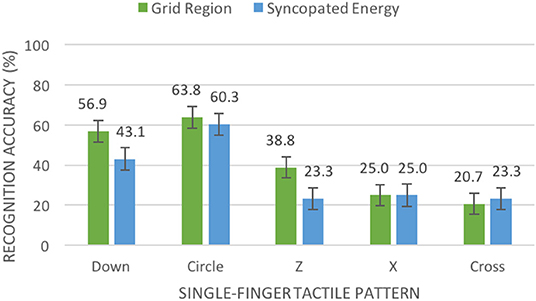
Figure 7. Mean percentage of accurate recognitions (with standard error bars) in our first experiment by algorithm and single-finger tactile pattern.
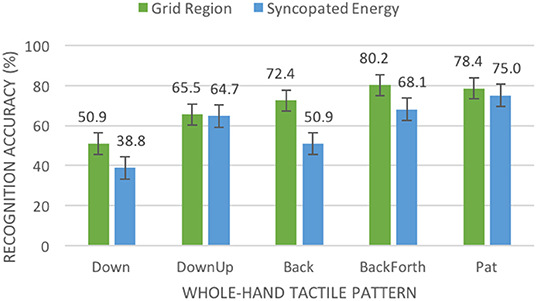
Figure 8. Mean percentage of accurate recognitions (with standard error bars) in our first experiment by algorithm and whole-hand tactile pattern.
We also found a significant two-way interaction effect for amplitude and gesture, F(9, 252) = 3.927, p < 0.001. The higher amplitude of 1.74 G yielded significantly better recognition accuracy for all single-finger gestures (see Figure 9) and all whole-hand gestures except for the repetitive pat (see Figure 10).
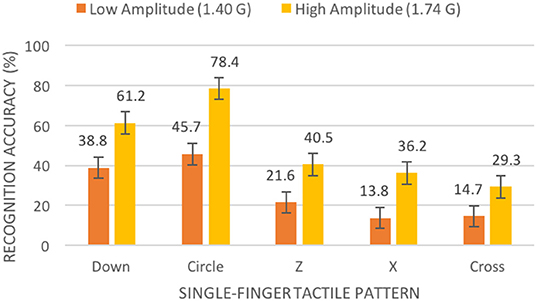
Figure 9. Mean percentage of accurate recognitions (with standard error bars) in our first experiment by amplitude and single-finger tactile pattern.
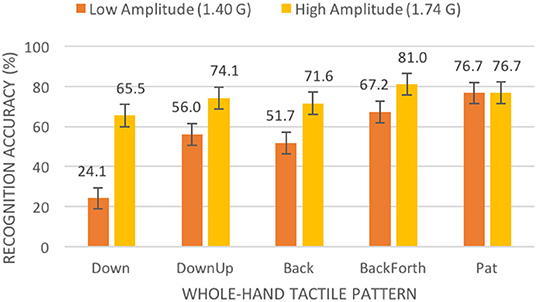
Figure 10. Mean percentage of accurate recognitions (with standard error bars) in our first experiment by amplitude and whole-hand tactile pattern.
We also found a significant main effect for algorithm on recognition accuracy, F(1, 28) = 19.297, p < 0.001. Overall, the Grid Region algorithm (M = 55.3%, SE = 3.0%) afforded significantly better recognition accuracy than the Syncopated Energy algorithm (M = 47.2%, SE = 2.6%). We also found a significant main effect for amplitude, F(1, 28) = 82.402, p < 0.001. Overall, the higher amplitude (M = 61.5%, SE = 3.1%) afforded significantly better accuracy than the lower amplitude (M = 41.0%, SE = 2.7%).
Perceived Continuity
For perceived continuity, we conducted a three-way (algorithm, amplitude, gesture) repeated-measures analysis of variance (ANOVA) at a 95% confidence level. Degrees of freedom were corrected using Greenhouse-Geisser estimates of sphericity because Mauchly's Test of Sphericity indicated that sphericity had been violated. We did find a significant three-way interaction effect for algorithm, amplitude, and gesture on continuity ratings, F(6.094, 170.637) = 2.327, p = 0.034. Tukey's post hoc tests were used to determine which pairs of conditions were significantly different. At the lower amplitude, the Grid Region and Syncopated Energy algorithms were not significantly different for any of the tactile patterns. However, the Grid Region had the higher mean continuity rating for seven of the ten gestures. At the higher amplitude, the Grid Region algorithm (M = 4.034, SE = 0.213) received significantly higher continuity ratings than the Syncopated Energy (M = 3.707, SE = 0.214) algorithm for the repetitive backward-forward whole-hand gesture, but the Syncopated Energy algorithm (M = 3.448, SE = 0.139) received significantly higher continuity ratings for the “Z” gesture than the Grid Region algorithm (M = 3.052, SE = 0.143) did. Also at the higher amplitude, the Syncopated Energy algorithm had the higher mean continuity for six of the ten gestures.
We found a significant two-way interaction effect for algorithm and amplitude on perceived continuity, F(1, 28) = 6.991, p = 0.013. At the low amplitude, the Syncopated Energy algorithm (M = 2.991, SE = 0.092) received lower continuity ratings than the Grid Region algorithm (M = 3.091, SE = 0.100). At the higher amplitude, the Syncopated Energy algorithm (M = 3.460, SE = 0.108) received higher continuity ratings than the Grid Region algorithm (M = 3.403, SE = 0.134), which were also significantly higher than either algorithm at the lower amplitude.
We did not find a significant two-way interaction effect for algorithm and gesture for perceived continuity, F(5.349, 149.772) = 0.727, p = 0.614. However, we did find a significant two-way interaction for amplitude and gesture, F(6.172, 172.816) = 3.494, p = 0.002. For all the single-finger gestures, the higher amplitude resulted in significantly higher continuity ratings than the lower amplitude (see Figure 11). Similarly, the higher amplitude resulted in significantly higher continuity ratings for the downward, repetitive downward-upward, and repetitive backward-forward whole-hand gestures (see Figure 12).
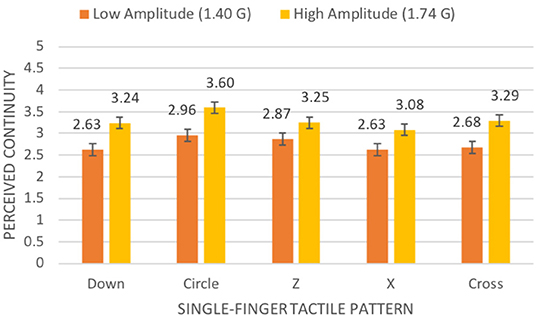
Figure 11. Mean continuity rating on a 5-point scale (with standard error bars) in our first experiment by amplitude and single-finger tactile pattern.
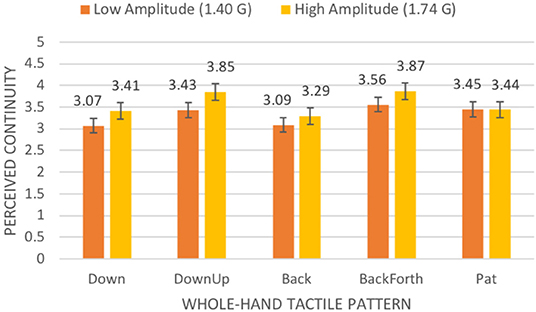
Figure 12. Mean continuity rating on a 5-point scale (with standard error bars) in our first experiment by amplitude and whole-hand tactile pattern.
We did not find a significant main effect for algorithm on perceived continuity, F(1, 28) = 0.075, p = 0.787. We did find a significant main effect for amplitude, F(1, 28) = 27.811, p < 0.001. Overall, the higher amplitude (M = 3.432, SE = 0.117) afforded significantly better continuity than the lower amplitude (M = 3.036, SE = 0.091).
Experiment II
The results of our first experiment indicated that the Grid Region algorithm afforded better recognition than the Syncopated Energy algorithm, but that at higher amplitudes, the Syncopated Energy algorithm may afford better perceived continuity. Additionally, our results indicated that higher amplitude is better overall for both recognition accuracy and perceived continuity.
To investigate whether the Syncopated Energy algorithm affords better perceived continuity at higher amplitudes, and to assess whether increasing amplitude at higher values continues to yield better accuracy and continuity, we decided to reconduct our first experiment using a higher maximum amplitude (2.35 G instead of 1.74 G) by utilizing a higher-amplitude actuator (a C-3 tactor by Engineering Acoustics instead of the C10-100 by Precision Microdrives).
In order to make comparisons between the two studies, we kept 1.74 G as the second experiment's lower-amplitude condition. To produce both amplitudes (1.74 and 2.35 G) with the new C-3 tactor, we used a frequency of 225 Hz (as opposed to the previous 175 Hz). This also allowed us to investigate the effects of frequency between the two experiments.
Finally, because we found no significant differences for the pat gesture, for either recognition accuracy or perceived continuity, we decided to replace the whole-hand touch gesture with an “A” gesture, a single-finger gesture similar in complexity to the “Z” gesture.
Vibrotactile Sleeve Displays
For our second experiment, we used vibrotactile sleeve displays very similar to those used in the first experiment (e.g., compression arm sleeve, same tactile resolution, Arduino Mega 2560 microcontroller with FAH4830 haptic drivers, and the same battery power). The only difference between the experiments was our vibrotactile actuators. For the second experiment, we used a single C-3 tactor by Engineering Acoustics for each actuator. Using the same vibration measurement method as the first experiment, we achieved a 1.74 G amplitude with the C-3 tactor using a frequency of 225 Hz. Maintaining the same frequency, we were able to achieve a maximum amplitude of 2.35 G using the C-3 tactor. Figure 6B depicts one of the C-3 vibrotactile sleeve displays.
Independent and Dependent Variables
For our second experiment, we again had three independent variables: the real-time tactile rendering algorithm (Grid Region or Syncopated Energy), the rendered amplitude (1.74 or 2.35 G), and the vibrotactile pattern rendered (one of the six single-finger or four whole-hand touch gestures). We varied all these independent variables with subject. We also used two trials for each condition. Hence, each participant evaluated a total of 80 vibrotactile patterns (2 algorithms × 2 amplitudes × 10 gestures × 2 trials). Again, we had two dependent variables: the tactile pattern recognition accuracy and a continuity rating.
Research Questions and Hypotheses
For our experiment, we had six research questions.
IIQ1. Which real-time rendering algorithm affords the greater recognition accuracy? IIH1. Given our previous results, we hypothesized that the Grid Region algorithm would yield better recognition accuracy than the Syncopated Energy algorithm at both amplitudes.
IIQ2. Which rendered amplitude affords the greater recognition accuracy? IIH2. Given the results of our first experiment, we hypothesized that the higher amplitude of 2.35 G would afford significantly better recognition accuracies than the lower 1.74 G amplitude, for both single-finger and whole-hand touch gestures.
IIQ3. Which real-time rendering algorithm produces tactile gestures with the greater perceived continuity? IIH3. Given the previous interaction effect, we hypothesized that the Syncopated Energy algorithm would produce the more continuous tactile gestures at the higher amplitude of 2.35 G.
IIQ4. Which rendered amplitude produces tactile gestures with the greater perceived continuity? IIH4. Given our first results, we hypothesized that the higher amplitude of 2.35 G would afford significantly greater perceived continuity than the lower amplitude.
IIQ5. Which rendered frequency affords the greater recognition accuracy? IIH5. Given prior research (Cholewiak and Collins, 2003; Israr and Poupyrev, 2011a), we hypothesized that the small change in frequency between our first and second experiment (175 and 225 Hz) would not yield significant changes in recognition accuracy.
IIQ6. Which rendered frequency produces tactile gestures with the greater perceived continuity? IIH6. Again, given prior research, we hypothesized that the small change in frequency would not yield significant changes in perceived continuity.
Procedure
For our second experiment, we followed the same procedure as our first experiment with icons for the new single-finger “A” gesture (see section Procedure).
Participants
We recruited 30 unpaid participants (23 males, 7 females) through university listservs for our second experiment. The age range of the participants was 18–60 years old with a mean age of 21.9 years. All of the participants were right handed. Hence, all of the participants wore the tactile sleeve on his or her non-dominant arm. Five of the participants reported discomfort on their exit questionnaires. However, all of these participants had above-average recognition accuracies, indicating that they most likely did not suffer any form of numbness due to discomfort.
Results
Recognition Accuracy
For recognition accuracy, we conducted a three-way (algorithm, amplitude, gesture) repeated-measures analysis of variance (ANOVA) at a 95% confidence level. Mauchly's Test of Sphericity indicated that the assumption of sphericity was not violated and the data set passed the Shapiro-Wilk normality test. We did not find a significant three-way interaction effect for algorithm, amplitude, and gesture on recognition accuracy, F(9, 261) = 1.323, p = 0.225. Similarly, we did not find a significant two-way interaction for algorithm and amplitude, F(1, 29) = 0.931, p = 0.343. Unlike the previous experiment, we did not find a significant two-way interaction effect for algorithm and gesture, F(9, 261) = 1.109, p = 0.356. We also did not find a significant two-way interaction effect for amplitude and gesture, F(9, 261) = 1.198, p = 0.297.
We did find a significant main effect for algorithm on recognition accuracy, F(1, 29) = 32.826, p < 0.001. Overall, the Grid Region algorithm (M = 81.1%, SE = 2.7%) afforded significantly better recognition accuracy than the Syncopated Energy algorithm (M = 73.3%, SE = 2.8%). We also found a significant main effect for amplitude, F(1, 29) = 11.903, p = 0.002. Overall, the higher amplitude of 2.35 G afforded significantly better accuracy (M = 80.8%, SE = 2.4%) than the lower amplitude of 1.74 G (M = 73.6%, SE = 3.3%).
Perceived Continuity
For perceived continuity, we conducted a three-way (algorithm, amplitude, gesture) repeated-measures analysis of variance (ANOVA) at a 95% confidence level. Mauchly's Test of Sphericity indicated that the assumption of sphericity was not violated. We did not find a significant three-way interaction effect for algorithm, amplitude, and gesture on continuity ratings, F(9, 261) = 0.754, p = 0.659. We did find a significant two-way interaction effect for algorithm and amplitude, F(1, 29) = 6.999, p = 0.013. Tukey's post hoc tests revealed that the Syncopated Energy algorithm (M = 3.498, SE = 0.139) received significantly higher continuity ratings than the Grid Region algorithm (M = 2.991, SE = 0.137) for the 1.74 G amplitude condition. Additionally, the Syncopated Energy algorithm (M = 3.340, SE = 0.126) was significantly better than the Grid Region algorithm (M = 3.003, SE = 0.170) for the 2.35 G amplitude condition. The interaction effect is due to the Grid Region's perceived continuity slightly improving in the higher amplitude condition while the Syncopated Energy algorithm received lower continuity ratings at the higher amplitude.
We did not find a significant two-way interaction effect for algorithm and gesture for perceived continuity, F(9, 261) = 1.268, p = 0.254. However, we did find a significant interaction effect for amplitude and gesture, F(9, 261) = 2.660, p = 0.006. For the circle gesture, the higher amplitude of 2.35 G resulted in less perceived continuity than the lower amplitude of 1.74 G (see Figure 13). For all other single-finger gestures and all whole-hand gestures, there were no significant differences between the two amplitudes for perceived continuity.
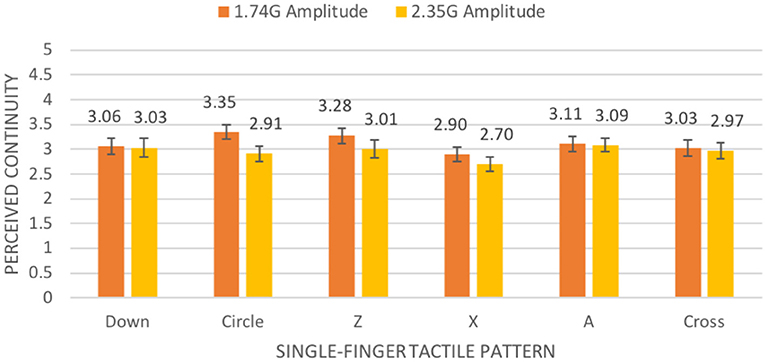
Figure 13. Mean continuity rating on a 5-point scale (with standard error bars) in our second experiment by amplitude and single-finger tactile pattern.
Cross-Study Results
Both of our experiments included 1.74 G as an amplitude condition, but at two different frequencies (175 Hz in the first experiment and 225 Hz in the second experiment). Using these conditions, we were able to conduct a cross-study analysis to determine the effects and potential interactions of frequency.
Cross-Study Recognition Accuracy
To determine the effects of frequency on recognition accuracy, independent of amplitude, we conducted a three-way (algorithm, frequency, gesture) ANOVA at a 95% confidence level, using the same-amplitude data from our first experiment and this experiment. Mauchly's Test of Sphericity indicated that the assumption of sphericity was not violated. We did not find a significant three-way interaction effect for algorithm, frequency, and gesture, though there was a trend, F(8, 224) = 1.923, p = 0.058. We did not find a significant two-way interaction effect for algorithm and frequency, F(1, 28) = 0.009, p = 0.925. We also did not find a significant two-way interaction effect for algorithm and gesture, F(8, 224) = 0.765, p = 0.634.
We did find a significant two-way interaction effect for frequency and gesture, F(8, 224) = 4.741, p < 0.001. The higher 225 Hz frequency of the C-3 tactor afforded significantly better recognition accuracy than the lower 175 Hz frequency of the C10–100 motors for all single-finger tactile patterns, except for the circle gesture (see Figure 14). Additionally, the 225 Hz frequency afforded significantly better recognition accuracy for the repetitive downward-upward gesture (see Figure 15).
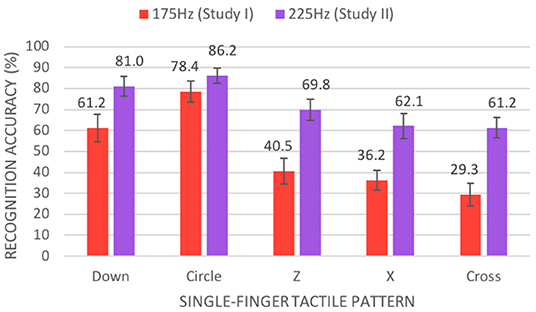
Figure 14. Mean percentage of accurate recognitions (with standard error bars) between our experiments by frequency and single-finger tactile pattern.
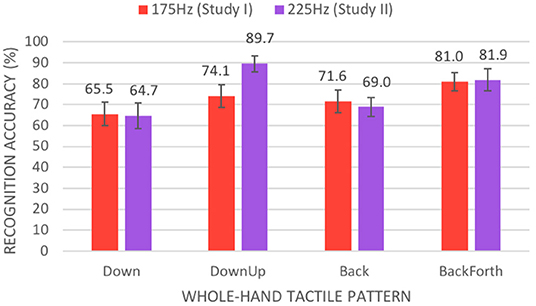
Figure 15. Mean percentage of accurate recognitions (with standard error bars) between our experiments by frequency and whole-hand tactile pattern.
We again found a significant main effect for algorithm on the cross-study recognition accuracy, F(1, 28) = 10.790, p = 0.003. Again, the Grid Region algorithm (M = 70.0%, SE = 2.1%) afforded significantly better recognition accuracy than the Syncopated Energy algorithm (M = 63.7%, SE = 2.2%).
Cross-Study Perceived Continuity
To determine the effects of frequency on perceived continuity, we conducted a three-way (algorithm, frequency, gesture) ANOVA at a 95% confidence level, using the same-amplitude data from our previous experiment and this experiment. Degrees of freedom were corrected using Greenhouse-Geisser estimates of sphericity because Mauchly's Test of Sphericity indicated that sphericity had been violated. We did find a significant three-way interaction effect for algorithm, frequency, and gesture on continuity ratings, F(5.960, 166.868) = 2.376, p = 0.032. Tukey's post hoc tests identified 11 pairs of conditions that were significantly different for specific gestures. Six of the pairs differed in algorithm only. At 225 Hz, the Syncopated Energy algorithm yielded significantly higher continuity ratings for the “Z” gesture, the repetitive downward-upward gesture, the backward hand gesture, and the repetitive backward-forward hand gesture. It also yielded significantly more continuity for the “Z” gesture at 175 Hz. The Grid Region algorithm yielded significantly better continuity for only the repetitive backward-forward hand gesture at 175 Hz.
Two of the 11 pairs differed in frequency only. The lower frequency of 175 Hz yielded significantly better continuity ratings for the Grid Region algorithm for the circle and repetitive backward-forward hand gestures. Three of the 11 pairs differed in both algorithm and frequency. The Syncopated Energy algorithm received significantly better continuity scores for the “Z” gesture at 225 Hz than the Grid Region algorithm at 175 Hz and for the “X” and cross gestures at 175 Hz than the Grid Region at 225 Hz.
Discussion
Grid Region Affords Better Recognition
Based on the results of both our experiments, we have found that the Grid Region algorithm afforded significantly better recognition of the rendered tactile patterns than our Syncopated Energy algorithm. In our first experiment, we found that the Grid Region algorithm yielded significantly better recognition for two of the five single-finger gestures and three of the five whole-hand gestures, which disproved our IH1a and IH1b hypotheses. In our second experiment, we found the significant main effect that the Grid Region algorithm afforded significantly better recognition accuracy than the Syncopated Energy algorithm, which supported our IIH1 hypothesis. In general, we recommend using our variant of the Grid Region algorithm (see section Grid Region Algorithm) when recognition accuracy is most important for real-time tactile interactions.
Syncopated Energy Affords More Continuity at Higher Amplitudes
We have found that the Syncopated Energy algorithm afforded significantly better perceived continuity than the Grid Region algorithm, especially at higher rendered amplitudes. In our first experiment, we found a significant two-way interaction effect for algorithm and amplitude with the Syncopated Energy algorithm receiving the lowest continuity ratings at the lower amplitude of 1.40 G and the highest continuity ratings at the higher amplitude of 1.74 G. This result neither supported nor disproved our IH3 hypothesis that the Syncopated Energy algorithm would produce the more continuous tactile gestures. However, in our second experiment, we found that the Syncopated Energy algorithm afforded significantly more continuity than the Grid Region algorithm for both amplitude conditions. This result supported our IIH3 hypothesis. Hence, we recommend using our Syncopated Energy algorithm when perceived continuity is most important and higher amplitude and frequency can be used.
Higher Amplitude Affords Better Recognition
In both experiments, we found that the higher amplitude afforded significantly better recognition accuracy. In our first experiment, the higher amplitude of 1.74 G afforded significantly better recognition accuracies than the lower amplitude of 1.40 G for all gestures except the repetitive pat. This result supported our IH2 hypothesis that the higher amplitude would afford significantly better recognition accuracies. In our second experiment, we found a significant main effect for amplitude, with the higher amplitude of 2.35 G yielding significantly better accuracies than the lower amplitude of 1.74 G, which supported our IIH2 hypothesis. Therefore, we recommend using higher amplitudes when possible to improve tactile pattern recognition.
Moderate Amplitude Affords More Continuity
As for recognition accuracies, we found that the moderate amplitude of 1.74 G afforded significantly more perceived continuity in both experiments. In our first experiment, the amplitude of 1.74 G afforded significantly more continuity than the lower amplitude of 1.40 G for all the single-finger touch gestures and three of the five whole-hand gestures. This result supported our IH4 hypothesis that increased amplitude would afford significantly greater perceived continuity. However, in our second experiment, the highest amplitude of 2.35 G resulted in less perceived continuity for the circle gesture than the moderate amplitude of 1.74 G. For all other gestures, the two amplitudes were not significantly different. This result disproved our IIH4 hypothesis that the highest amplitude would afford significantly greater perceived continuity. Hence, we believe that, while low amplitude can result in lower perceived continuity, a high amplitude can have diminishing or even negative returns, in terms of continuity.
Higher Frequency Affords Better Recognition for Single-Finger Touch Gestures
Based on our analysis of the 1.74 G at 175 Hz conditions from our first experiment and the 1.74 G at 225 Hz conditions from our second experiment, we found that the higher frequency afforded significantly better recognition accuracies for all of the single-finger touch gestures except for the circle gesture. The higher frequency also afforded significantly better recognitions for the repetitive downward-upward gesture. These results disprove our IIH5 hypothesis that the small change in frequency between our experiments would not yield significant differences. While more research needs to be conducted to investigate the effects of frequency and its interactions with amplitude, we recommend using higher frequencies when recognition of fine tactile patterns is important.
Frequency Can Affect Perceived Continuity
Based on our cross-study analysis, we found that frequency can significantly affect the perceived continuity of a tactile pattern. Specifically, we found that the lower frequency of 175 Hz yielded significantly better continuity ratings than the higher frequency of 225 Hz for the circle and repetitive backward-forward gestures when employing the Grid Region algorithm. Frequency also interacted with the Syncopated Energy algorithm at 225 Hz to produce more continuity than the Grid Region algorithm at 175 Hz for the “Z” gesture and with the Syncopated Energy algorithm at 175 Hz to produce more continuity than the Grid Region algorithm at 225 Hz for the “X” and cross gestures. These results disprove our IIH6 hypothesis that the small change in frequency would not yield significant differences in perceived continuity. While the current experiments provide evidence that frequency can affect perceived continuity, it is unclear whether higher frequency will result in less or more perceived continuity.
Conclusion and Future Work
In this paper, we have presented the Syncopated Energy algorithm, a novel vibrotactile rendering approach for producing real-time tactile interactions suitable for VR applications. The Syncopated Energy algorithm employs syncopations in its rendered amplitude to create artificial perceptual anchors and an energy model to simultaneously produce smooth tactile sensations. To evaluate the efficacy of our new algorithm, we conducted two studies comparing the recognition accuracy and perceived continuity of the Syncopated Energy algorithm to a traditional Grid Region algorithm for ten tactile patterns. The results of our studies indicate that the Grid Region algorithm affords significantly better recognition than our new Syncopated Energy algorithm. However, the Syncopated Energy algorithm was perceived to produce more-continuous tactile motions at higher amplitudes.
Another major result of our study was that tactile patterns are better recognized at a higher rendered amplitude though a moderate amplitude resulted in the best perceived continuity. Additionally, we found a significant interaction between the amplitude and the rendering algorithms for perceived continuity. These results have raised several research questions regarding whether higher amplitude is always better, if the benefits of amplitude have a plateau, and if rendering at very high amplitudes may have negative consequences.
Finally, our studies have also indicated that a higher frequency yielded better recognition accuracies for single-finger touch gestures. We also found that frequency can affect perceived continuity, based on the results of our two studies.
Ethics Statement
This study was carried out in accordance with the recommendations of the University of Texas at Dallas Institutional Review Board with written informed consent from all subjects. All subjects gave written informed consent in accordance with the Declaration of Helsinki. The protocol was approved by the University of Texas at Dallas Institutional Review Board.
Author Contributions
FT and RM jointly designed the Syncopated Energy algorithm and the experimental designs. FT developed the study materials and conducted participants through both studies. FT and RM both wrote and revised the paper.
Conflict of Interest
The authors declare that the research was conducted in the absence of any commercial or financial relationships that could be construed as a potential conflict of interest.
References
Baumgardt, E., and Hillmann, B. (1961). Duration and size as determinants of peripheral retinal response*. J. Opt. Soc. Am. 51, 340–344. doi: 10.1364/JOSA.51.000340
Bekrater-Bodmann, R., Foell, J., Diers, M., Kamping, S., Rance, M., Kirsch, P., et al. (2014). The importance of synchrony and temporal order of visual and tactile input for illusory limb ownership experiences – An fMRI study applying virtual reality. PLoS ONE 9:e87013. doi: 10.1371/journal.pone.0087013
Bochereau, S., Terekhov, A., and Hayward, V. (2014). “Amplitude and Duration Interdependence.” in Perceived Intensity of Complex Tactile Signals BT - Haptics: Neuroscience, Devices, Modeling, and Applications, eds M. Auvray and C. Duriez (Berlin; Heidelberg: Springer Berlin Heidelberg), 93–100. doi: 10.1007/978-3-662-44193-0_13
Braida, L. D., Lim, J. S., Berliner, J. E., Durlach, N. I., Rabinowitz, W. M., and Purks, S. R. (1984). Intensity perception. XIII. Perceptual anchor model of context-coding. J. Acoust. Soc. Am. 76, 722–731. doi: 10.1121/1.391258
Brewster, S., and Brown, L. M. (2004). “Tactons: Structured Tactile Messages for Non-visual Information Display,” in Proceedings of the Fifth Conference on Australasian User Interface – Vol. 28 AUIC'04. (Darlinghurst, NSW: Australian Computer Society, Inc.), 15–23. Available at: http://dl.acm.org/citation.cfm?id=976310.976313. doi: 10.1145/985921.985936
Cha, J., Rahal, L., and Saddik, A. (2008). “A pilot study on simulating continuous sensation with two vibrating motors,” in 2008 IEEE International Workshop on Haptic Audio visual Environments and Games (Ottawa, ON), 143–147. doi: 10.1109/HAVE.2008.4685314
Cholewiak, R. W., and Collins, A. A. (2003). Vibrotactile localization on the arm: effects of place, space, and age. Percep. Psychophys. 65, 1058–1077. doi: 10.3758/BF03194834
Craig, J. C., and Lyle, K. B. (2002). A correction and a comment on Craig and Lyle (2001). Perc. Psychophys. 64, 504–506. doi: 10.3758/BF03194721
Ekman, G. (1966). Temporal integration of brightness. Vision Res. 6, 683–688. doi: 10.1016/0042-6989(66)90079-4
García-Valle, G., Ferre, M., Breñosa, J., Aracil, R., Sebastian, J. M., and Giachritsis, C. (2016). “Design and Development of a Multimodal Vest for Virtual Immersion and Guidance BT,” in Haptics: Perception, Devices, Control, and Applications, eds F. Bello, H. Kajimoto, and Y. Visell (Cham: Springer International Publishing), 251–262. doi: 10.1007/978-3-319-42324-1_25
Hoggan, E., Brewster, S., and Brewster, S. (2007). “New Parameters for Tacton Design,” in CHI'07 Extended Abstracts on Human Factors in Computing Systems CHI EA'07 (New York, NY: ACM), 2417–2422. doi: 10.1145/1240866.1241017
Huisman, G., Frederiks, A. D., Dijk, B., Van, H. D., and Kröse, B. (2013). “The TaSSt: tactile sleeve for social touch,” in 2013 World Haptics Conference (WHC) (Daejeon), 211–216. doi: 10.1109/WHC.2013.6548410
Hwang, I., Seo, J., Kim, M., and Choi, S. (2013). Vibrotactile Perceived Intensity for Mobile Devices as a Function of Direction, Amplitude, and Frequency. IEEE Transact. Haptics 6, 352–362. doi: 10.1109/TOH.2013.2
Israr, A., and Poupyrev, I. (2011a). “Control space of apparent haptic motion,” in 2011 IEEE World Haptics Conference (Istanbul), 457–462. doi: 10.1109/WHC.2011.5945529
Israr, A., and Poupyrev, I. (2011b). “Tactile Brush: Drawing on Skin with a Tactile Grid Display,” in Proceedings of the SIGCHI Conference on Human Factors in Computing Systems CHI'11 (Vancouver, BC: ACM), 2019–2028. doi: 10.1145/1978942.1979235
Jack, R., McPherson, A., and Stockman, T. (2015). “Designing tactile musical devices with and for deaf users: a case study,” in Proceedings of the International Conference on the Multimodal Experience of Music (Sheffield).
Kaneko, S., Kajimoto, H., and Hayward, V. (2018). “A case of perceptual completion in spatio-temporal tactile space BT,” in Haptics: Science, Technology, and Applications, eds D. Prattichizzo, H. Shinoda, H. Z. Tan, E. Ruffaldi, and A. Frisoli (Cham: Springer International Publishing), 49–57. doi: 10.1007/978-3-319-93445-7_5
Kirman, J. H. (1974). Tactile apparent movement: the effects of interstimulus onset interval and stimulus duration. Perc. Psychophys. 15, 1–6. doi: 10.3758/BF03205819
Kokkinara, E., and Slater, M. (2014). Measuring the effects through time of the influence of visuomotor and visuotactile synchronous stimulation on a virtual body ownership illusion. Perception 43, 43–58. doi: 10.1068/p7545
Kryter, K. D., and Pearsons, K. S. (1963). Some effects of spectral content and duration on perceived noise level. J. Acoust. Soc. Am. 35, 866–883. doi: 10.1121/1.1918620
LaViola, J. J., Kruijff, E., McMahan, R. P., Bowman, D. A., and Poupyrev, I. (2017). 3D User Interfaces: Theory and Practice, Second Edition. Boston: Addison-Wesley.
Lim, S.-C., Kyung, K.-U., and Kwon, D.-S. (2011). Presentation of surface height profiles based on frequency modulation at constant amplitude using vibrotactile elements. Adv. Robot. 25, 2065–2081. doi: 10.1163/016918611X590292
McMahan, R. P. (2018). “Virtual Reality System Fidelity,” in Encyclopedia of Computer Graphics and Games, ed N. Lee (Cham: Springer), 1–8. doi: 10.1007/978-3-319-08234-9_251-1
Niwa, M., Lindeman, R. W., Itoh, Y., and Kishino, F. (2009). “Determining appropriate parameters to elicit linear and circular apparent motion using vibrotactile cues,” in World Haptics 2009 - Third Joint EuroHaptics conference and Symposium on Haptic Interfaces for Virtual Environment and Teleoperator Systems (Salt Lake City, UT), 75–78. doi: 10.1109/WHC.2009.4810856
Pasquero, J., and Hayward, V. (2003). “STReSS: a practical tactile display system with one millimeter spatial resolution and 700 Hz refresh rate,” in Proc. Eurohaptics (Dublin), 94–110.
Penfield, W., and Rasmussen, T. (1950). The Cerebral Cortex of Man: A Clinical Study of Localization of Function. Oxford: Macmillan.
Rogers, C. H. (1970). Choice of stimulator frequency for tactile arrays. IEEE Transact. Man-Machine Syst. 11, 5–11. doi: 10.1109/TMMS.1970.299954
Rovan, J., and Hayward, V. (2000). “Typology of tactile sounds and their synthesis in gesture-driven computer music performance,” Trends in Gestural Control of music, 297–320.
Seizova-Cajic, T., and Taylor, J. L. (2014). Somatosensory space abridged: rapid change in tactile localization using a motion stimulus. PLoS ONE 9:e90892. doi: 10.1371/journal.pone.0090892
Seo, J., and Choi, S. (2010). “Initial study for creating linearly moving vibrotactile sensation on mobile device,” in 2010 IEEE Haptics Symposium (Waltham, MA), 67–70.
Sherrick, C. E., and Rogers, R. (1966). Apparent haptic movement. Perc. Psychophys. 1, 175–180. doi: 10.3758/BF03215780
Shimizu, Y. (1982). Temporal effect on tactile letter recognition by a tracing mode. Percept. Motor Skills 55, 343–349. doi: 10.2466/pms.1982.55.2.343
Stévens, J. C., and Hall, J. W. (1966). Brightness and loudness as functions of stimulus duration. Percept. Psychophys. 1, 319–327. doi: 10.3758/BF03215796
Strohmeier, P., and Hornbæk, K. (2017). “Generating Haptic Textures with a Vibrotactile Actuator,” in Proceedings of the 2017 CHI Conference on Human Factors in Computing Systems CHI'17 (New York, NY: ACM), 4994–5005. doi: 10.1145/3025453.3025812
Tang, F., McMahan, R. P., and Allen, T. T. (2014). “Development of a Low-Cost Tactile Sleeve for Autism Intervention,” in IEEE International Symposium on Haptic, Audio and Visual Environments and Games (HAVE 2014) (Richardson, TX: IEEE), 35–40. doi: 10.1109/HAVE.2014.6954328
Tang, F., McMahan, R. P., Ragan, E. D., and Allen, T. T. (2017). “Subjective Evaluation of Tactile Fidelity for Single-Finger and Whole-Hand Touch Gestures,” in International Conference on Virtual, Augmented and Mixed Reality (VAMR 2017) (Vancouver, BC: Springer), 185–200. doi: 10.1007/978-3-319-57987-0_15
Toda, A., Tanaka, K., Kimura, A., Shibata, F., and Tamura, H. (2013). “Development of Knife-Shaped Interaction Device Providing Virtual Tactile Sensation BT - Virtual Augmented and Mixed Reality,” in Designing and Developing Augmented and Virtual Environments, ed R. Shumaker (Berlin; Heidelberg: Springer Berlin Heidelberg), 221–230. doi: 10.1007/978-3-642-39405-8_26
van Erp, J. B. F. (2002). “Guidelines for the use of vibro-tactile displays in human computer interaction,” in Proceedings of Eurohaptics (Edingburgh), 18–22.
Yanagida, Y., Kakita, M., Lindeman, R. W., Kume, Y., and Tetsutani, N. (2004). “Vibrotactile letter reading using a low-resolution tactor array,” in 12th International Symposium on Haptic Interfaces for Virtual Environment and Teleoperator Systems, 2004. HAPTICS'04. Proceedings (Chicago, IL), 400–406. doi: 10.1109/HAPTIC.2004.1287227
Keywords: perceptual anchors, rendering algorithms, vibrotactile feedback, recognition accuracy, virtual reality
Citation: Tang F and McMahan RP (2019) The Syncopated Energy Algorithm for Rendering Real-Time Tactile Interactions. Front. ICT 6:19. doi: 10.3389/fict.2019.00019
Received: 05 August 2018; Accepted: 07 October 2019;
Published: 30 October 2019.
Edited by:
David Swapp, University College London, United KingdomReviewed by:
Stefania Serafin, Aalborg University Copenhagen, DenmarkDorian Gorgan, Technical University of Cluj-Napoca, Romania
Copyright © 2019 Tang and McMahan. This is an open-access article distributed under the terms of the Creative Commons Attribution License (CC BY). The use, distribution or reproduction in other forums is permitted, provided the original author(s) and the copyright owner(s) are credited and that the original publication in this journal is cited, in accordance with accepted academic practice. No use, distribution or reproduction is permitted which does not comply with these terms.
*Correspondence: Ryan P. McMahan, cnBtQHVjZi5lZHU=