 Amir E. Sarabadani Tafreshi
 Andrea Soro
 Gerhard Tröster
95% of researchers rate our articles as excellent or good
Learn more about the work of our research integrity team to safeguard the quality of each article we publish.
Find out more
ORIGINAL RESEARCH article
Front. ICT , 03 September 2018
Sec. Human-Media Interaction
Volume 5 - 2018 | https://doi.org/10.3389/fict.2018.00020
Most public and semi-public displays show content that is not related to people passing by. As a result, most passersby completely ignore the displays. One solution to this problem is to give viewers the means to interact explicitly with such displays to convey their interests and thus receive content relevant to them. However, which method of interaction is most appropriate for gathering information on viewers' interests is still an open question. To identify methods appropriate for indicating topics of interest to public displays, we identified a range of dimensions to be considered when setting up public displays. We report a single-user and a multi-user study that use these dimensions to measure the effects of automatic, gestural, voice, positional, and cross-device interest indication methods. Our results enable us to establish guidelines for practitioners and researchers for selecting the most suitable interest indication method for a given scenario. Our results showed that cross-device and automatic methods strongly retain users' privacy. Gestural and positional methods were reported to be a fun experience. However, the gestural method performed better in the single-user study than in the multi-user study in all dimensions.
Most existing pervasive display systems (PDSs) act as a simple broadcast medium; content is pushed to passersby with no regard to their interests. Therefore, the vast majority of such displays effectively disappear, as people have become so accustomed to their low utility that they are highly skilled at ignoring them (Memarovic et al., 2015).
One potential solution for attracting viewers' engagement (Müller et al., 2009; Memarovic et al., 2015), is to customize a PDS to their interests. To achieve this, viewers must be provided with interaction methods that entice them to engage with displays and indicate their interests. However, PDSs involve various challenges and issues that can limit users' acceptance and thus the applicability of such interaction methods.
Based on a review of the literature and our own experience with various interaction techniques, we identified a number of challenges to be considered when selecting interest indication methods for PDSs. Specifically, we encountered seven main challenges:
(1) Multiple viewers: Several viewers may want to interact with a display at the same time (Sarabadani Tafreshi and Norrie, 2017). Concurrent interaction requires more complex methods and can affect the viewers' experience (Carter et al., 2016).
(2) Viewers' shortage of time: Simple shortage of time can impact viewers' motivation to interact with the displays. The short time frame available to engage passersby (Müller et al., 2010) may mean that no interaction takes place.
(3) Social impact: Using some interaction methods in public settings can cause social awkwardness and embarrassment, which might discourage or prevent viewers from using such methods (Brignull and Rogers, 2003).
(4) High expectations of usability: Unlike personal devices (Sarabadani Tafreshi et al., 2017b), viewers of public displays use the displays from different perspectives (e.g., different distances), which poses additional challenges for interaction (Sarabadani Tafreshi et al., 2017a, 2018c). However, users' experience with personal devices has led them to develop high expectations of interactions with PDSs (Müller et al., 2010; Sarabadani Tafreshi et al., 2018b).
(5) Privacy exposure: People's interests can concern anything, including some they would prefer remained private. However, the interaction method can publicly expose viewers' interests (Davies et al., 2014).
(6) Uncertainty about users' devices: It is possible that people do not own or always carry mobile devices or sensors (Ichikawa et al., 2005).
(7) Frequent use of the displays: Public displays are widespread and each can be encountered by the same viewers many times (Davies et al., 2012). Frequent viewers of a PDS need to remind the system about their interests; this requires extra effort and can be frustrating.
There is no unanimous agreement on which interaction method is appropriate for gathering viewers' interests. Despite extensive discussion on the advantages and disadvantages of various interaction methods (Boring et al., 2009; Baldauf et al., 2016; Carter et al., 2016), to our knowledge, no comparison has been made of such methods. Research in other domains has so far focused on specific scenarios, settings, and target users, making it difficult to generalize the findings to other cases.
In this paper, we use a diverse range of dimensions to explore which interaction methods are most suitable for customizing PDSs. Such dimensions include ease of use and learning and the maintenance of users' privacy. The methods explicitly communicate viewers' interests to PDSs but are not related to a specific scenario. We abstract interactions from specific scenarios and evaluate them to provide insights for both researchers and the designers of PDSs. These insights facilitate the selection of interaction methods for particular situations (e.g., where low privacy exposure is paramount).
The next section provides an overview of existing interaction techniques before detailing our studies' designs and results.
Mobile phones have been widely used in researching interaction with public displays (Boring et al., 2009; Alt et al., 2013; Baldauf et al., 2016). Cheung et al. (2014) suggested that users' lower social inhibition with smartphones could entice them to use mobile devices to exchange information with public displays. Other recent work (Weißker et al., 2016) suggests mobile-device interaction is to be preferred over gesture and touch interactions for simultaneous interaction of multiple people with public displays. The authors argue that gestures usually offer limited sets of actions, and touch interaction cannot be scaled to various display sizes (Weißker et al., 2016). Kurdyukova et al. (2012) compared users' preferences for three interaction techniques: direct (touch), bodily (gestures), and mobile-based (cross-device). Preferences were compared at different phases of the interaction, including identification, navigation, and collecting information on viewers' interests. Their findings show that mobile devices are more promising methods for protecting users' privacy in the initial identification phase. However, a prior survey (Ichikawa et al., 2005) shows that a significant proportion of people, in particular women, do not carry their phones in their local work area. Therefore, mobile-dependent methods of interaction with displays can limit the number of users.
Di Rienzo et al. (2015) propose a model for showing user-personalized product information on public displays through interaction of mobile devices with proximity sensors such as Bluetooth Low Energy (BLE) beacons and Kinect. Alt et al. (2013) compare touch and mobile-device interaction to develop a digital bulletin board. The authors argue that touch interaction feels more natural but that mobile devices better retain users' privacy when interacting with a bulletin board. However, the study did not consider multi-user scenarios; these could make touch interaction impractical, as Weißker et al. (2016) discuss. In Davies et al. (2009) and Sharifi et al. (2006), the authors propose automatically customizing the display of adverts by detecting the Bluetooth signals of mobile devices in the vicinity. A disadvantage of this approach is that most people do not leave their mobile Bluetooth on due to concerns about battery consumption and privacy.
Voice command can also be used to interact with displays. Hakulinen et al. (2013) compare gesture and voice interactions with public displays. Despite users' difficulties in grasping how the gestures worked, the findings show a strong bias toward gestures over voice commands.
Müller et al. (2010) mention speech recognition as a possible method of interaction with public display but do not provide any example of such a use. Scholl et al. (2014) compared voice and touch interactions in a study unrelated to public displays. They found that people still prefer touch interaction to input information. Another work (Mónica Faria et al., 2013) aimed at controlling a wheelchair shows lower satisfaction for voice commands than for joystick commands.
Interaction methods for public displays must also support several users simultaneously (Carter et al., 2016). Multi-user interaction with public displays may promote social interaction between people, which is considered beneficial in certain cases (Steinberger et al., 2014). Prior research (Nutsi, 2015; Nutsi and Koch, 2015) has established usability guidelines for multi-user shared-screen applications. Elhart et al. (2015) propose overlaying applications in viewer's on-screen silhouettes (i.e., their shadows). Although the method's testing score was satisfactory, the effectiveness of the method declined as the number of users increased.
Advances in processing, sensing, and display technologies have enabled the development of rich and powerful computational platforms in tracking body and gestures. Prior work (Ackad et al., 2015; James, 2015; Yoo et al., 2015) has investigated which gestures are the most usable and efficient. Yoo et al. (2015) evaluated point-and-dwell and grab-and-pull gestures for interaction with large displays. While their findings show people's preference for the grab-and-pull gesture, accuracy was better with the point-and-dwell gesture. James (2015) compared the usability of two gestures grab-and-pull and grab-and-drop. The user case study shows that grab-and-pull is easier to use and requires less effort than grab-and-drop. A field study (Hardy et al., 2011) comparing push-pull gestures and waving suggested using push-pull rather than waving. Ackad et al. (2015) used Kinect to develop four gestures for navigation: swipe left, swipe right, left arm up, and left arm down to the side. The authors found that these gestures are easy to learn and sufficient for browsing hierarchical information and voting. Another research (Chan and Mirfakhraei, 2013) showed that Kinect can detect single-hand gestures accurately, depending on the distance of the user from the sensor.
Although the advantages and drawbacks of various interaction methods have been widely discussed before, to our knowledge the methods have never been directly compared in interaction scenarios in which their purpose is to gather viewers' interests.
We evaluated a range of interaction methods in two studies in a controlled lab setting. One study involved individual users and the other multiple users. Our experiments had two primary goals. First, we aimed to evaluate the benefits and deficits of the methods using the interaction quality dimensions that we had identified as important for public display settings. Second, we wanted to compare the methods with each other.
The dimension-based comparison of the methods and their abstraction from a specific application enables generalizations to be made about their applicability and validity, and these in turn will enable researchers and practitioners to decide which method is more appropriate for certain types of applications, display installation locations, and target viewers.
We chose five interaction methods to explore: automatic, cross-device, voice command, gestural, and positional interaction. We abstracted these methods from scenarios and use cases in the works discussed in Section 2. The methods were developed to support viewers in indicating their interests to public displays.
We did not include touch interaction in our experiments due to the major touch issues for public display use. Such issues include (1) low scalability to multiple users (Weißker et al., 2016), (2) hygiene reasons (users reluctance to touch) (Kray et al., 2010), (3)need for short distance between users and screens, which might lead to blocking of other viewers' view, and (4)the fact that some screens are deliberately fixed above user height (not within reach of users) (Huang et al., 2008).
To implement and test the methods, we extended ScreenPress, which is a platform developed for the rapid prototyping of PDSs (Sarabadani Tafreshi and Norrie, 2017). Our goal was to support the main features that public display viewers need to indicate their interests. The methods should not only support multi-selection and modification of the interests, but also support multiple concurrent users. Having several viewers interacting with the display could allow a PDS to collate the viewers' interests and show content potentially matching the interests of all viewers.
In this method, users' interests are transmitted automatically whenever they come within a certain distance from the display (see Figure 1A). To detect the users, we followed the options presented in Di Rienzo et al. (2015) and used a BLE Beacon Card. This is a Kontak.io1 product that comes as a thin card and can easily be accommodated in a wallet or pocket. The card is associated with a user account, which stores the user's interests and the preferences that the user is willing to share with public displays. Users can select and modify their interests by registering and logging into the account. The card then signals its unique ID to neighboring devices, and if the user passes a screen, the card's signal will match the ID to an existing account, fetch the stored interests, and customize the PDS's content to the user's interests.
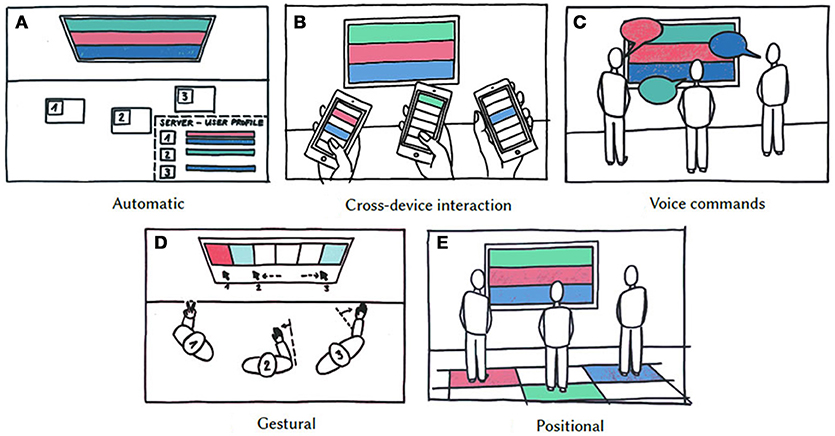
Figure 1. Interaction methods: (A) Automatic: viewers can indicate their interests by registering in the system. Then the system can recognize the presence of registered viewers and customize the display content accordingly. (B) Cross-device: viewers can go to a specific URL and indicate their interests remotely. (C) Voice commands: viewers can state their interests using voice commands. (D) Gestural: viewers can indicate their interests by mid-air gestures. (E) Positional: viewers can walk to the zones that match their interests.
Cross-device interaction allows users to interact with public displays from personal devices. Accordingly, each user can select content they would like shown on a large display from a menu on the mobile device (see Figure 1B).
We followed the proposal in Baldauf et al. (2016) that users can initiate the interaction and indicate their interests to a display through a URL address mapped to the display. Once a user connects to the page, the server sends back a unique ID to the user's mobile device. The ID is then used to identify the user and map the user's interests. The user can select and deselect an item of interest on the mobile device, and this sends a socket message to the server in real time. The message contains display ID and the user's updated interest. The server receives the message, maps the IDs, and sends a content update to the display.
We use Google speech recognition application program interface (API)2 to identify voice commands. This system sends recorded data to Google cloud, which sends back the results.
The experiment provided two options. Users could name either the interest or its number in a list (See Figure 1C). Interests could be deselected in two ways. Saying the word “remove,” deleted the most recent interest; “clear” deleted all the interests from the screen. We excluded using the name of an interest for deselection to reduce accidental deletion and potential confusion. Visual feedback was provided by displaying the recognized words.
We used the Kinect 2 to provide interaction using users' body gestures. This sensor can track the skeletons of up to six users simultaneously (Chan and Mirfakhraei, 2013).
As no gesture sets are yet standard or commonly accepted for interacting with displays, we chose the promising gestures explored by Ackad et al. (2015).
The user could start the interaction by lifting their right forearm above the waistline to form a 90° angle between upper arm and torso. At this point, each user was assigned a color on the screen and could navigate a correspondingly colored box to select items of interest by moving the arm to left and right (see Figure 1D). Items were selected by raising the left arm, performing the V sign gesture, and lowering the arm again. Items were deselected by performing the same action. The V sign is a gesture in which index and middle fingers are raised and parted and the other fingers are clenched. This gesture is one of the few gestures that the Kinect sensor can detect reliably. Once the user left the Kinect viewfield, the user's interests were removed.
Because people do not carry or use their mobile phones in some circumstances (Ichikawa et al., 2005), we developed a novel method, inspired by Sarabadani Tafreshi et al. (2017a), which uses viewers' body positions to gather their interests (see Figure 1E). Viewers can walk to the zones that match their interests. A Kinect sensor was used to detect viewers' positions in zones, the data was sent to the server, and the display' content was updated accordingly.
A total of 36 participants (16 female) ranging in age from 19 to 58 years [median (Mdn) 26.5 years] evaluated the five interest indication methods discussed in Section 3.1. Participants were recruited among work colleagues and our social circle using the snowball sampling method: initial study participants were asked to recruit other participants. Most were non-computer scientists (n = 28). We divided the participants equally between the single-user experiment (n = 18) and the multi-user experiment (n = 18), in which participants were again divided into six groups of three participants each. All the participants had smartphones. None of the participants had previous experience of the methods for indicating their interests. An ethics approval was not required for our study by the ETH Zurich's and national regulations. All participants gave written informed consent.
An application scenario was created in which users could operate much as they would in real life. Picking the scenario presented various challenges, mainly because we wanted to explore various dimensions that all had to be evaluated in the same scenario. One criterion was that it was also something that could be used regularly, not just sporadically. Additionally, the application had to be one in which it made sense to pick one or multiple interests and in which both single users and multiple concurrent users could operate the system. These prerequisites led us to select an application that matched restaurants to the food preferences of the user and showed their locations (see Figure 2). The application included a list of 12 food types.
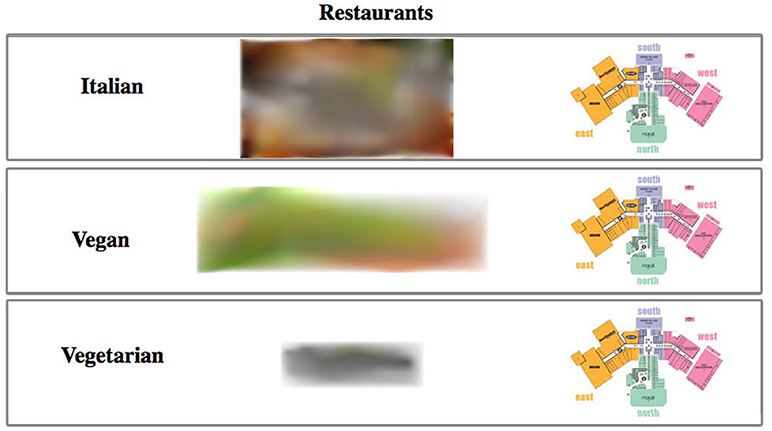
Figure 2. Screenshot of the Restaurant Finder app.
Based on the review in Section 2, and our own experience, we identified 12 quality dimensions that should be considered when selecting methods for interacting with public display settings.
D1) Perceived accuracy. How accurate the selection itself was: whether the user required one or several attempts to make a selection and could do so without mistakes.
D2) Ease of use. The method was not unnecessarily complex, and the users could perform the actions with minimal cognitive and physical effort.
D3) Perceived Speed. Selection and deselection were performed in a manner the user perceived as timely.
D4) Learnability. The method could be learned within a time that was deemed acceptable by the user. This assumed a previous explanation of how to use the method.
D5) Fun. The method caused a sense of enjoyment and/or amusement in the user.
D6) Multiple-interest Selection. The extra effort of communicating multiple interests to a display over that of a single one was zero or at least was deemed acceptable.
D7) Modification of pre-selected interests. Modifying previously selected interests was achieved straightforwardly and did not cause frustration in the user.
D8) Awkwardness. Performing the actions featured in the method to select and deselect interests in a public place caused a sense of unease, self-consciousness, or nervousness.
D9) Screen-switch effort. The effort of reselecting content on a second display was deemed acceptable by the user.
D10) Shared interaction. It remained possible to share the display with other users.
D11) Privacy Exposure. The degree to which the method exposed information about the user's interests was deemed acceptable by the user.
D12) Social engagement. The nature of the method catalyzed social engagement among users.
We designed questions to test for these dimensions and used them to evaluate the interaction methods (see Table 1). The responses were recorded using 5-point Likert scales (1=strongly disagree, 5=strongly agree).
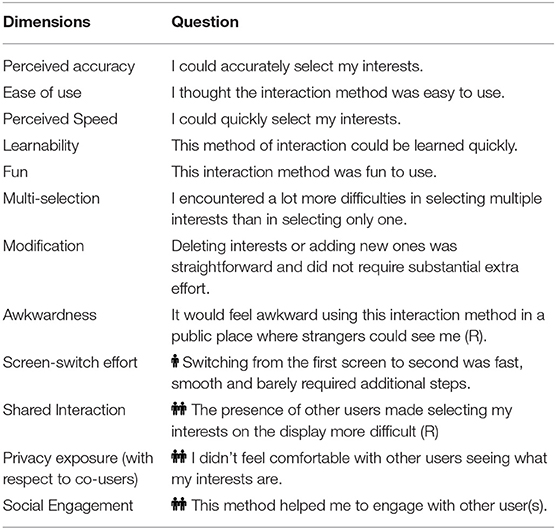
Table 1. Interaction method quality dimensions and their corresponding questions; ( ) only asked in the single-user study; (
 ) only asked in the multi-user study; (R) reverse coded questions.
To compare the methods, we performed a Friedman test to check whether there is a significant difference between the methods in the scores for each dimension. When the outcome of this test was significant, we performed a post hoc analysis using pairwise Wilcoxon Signed Rank Tests to check the differences between the methods and adjusted the p-values based on Bonferroni multiplicity correction as p − valueadjusted = p − valueoriginal × 10 (total number of pairwise comparisons). Accordingly, the p-values reported for these comparisons are adjusted p-values. We set the minimum significance level at 0.05.
During the experiment, we asked participants to perform various tasks on two displays. Each participant in both experiments performed the tasks, which corresponded with the five interest interaction techniques (see Figure 1). Both studies were structured very similarly. However, the tasks differed slightly between single users and multiple users.
In the single-user study, we asked each participant to choose three foods from the list of 12 food types. Then, the participants had to perform the following four tasks for each of the methods: (1) select one of the three food types using the current method on display 1, (2)delete the same interest from the display, (3)add all three food types to display 1, and (4)move to display 2 and add all three food types again.
For the automatic interaction method, each participant was provided with a user account and a BLE beacon card. Participants could use their user accounts to log into a webpage and then indicate and change their interests. As soon as the users were in the vicinity of a display, the participants were identified by their beacon cards and their interests were automatically shown on the display (see tasks covered some of the dimensiection 3.1.1).
In the experiment with multiple users, each participant was assigned two food types, and two users had one common food type. Our goal was to simulate a realistic scenario, increase the complexity for some of the methods, and as a result, test the dimensions under examination. The participants had to perform three tasks for each experiment with each of the interaction methods: (1) Select one of the two food types using the current method on display 1. (2) Delete the same interest from the same display. (3) Add both food types to display 1.
Every step of the tasks covered some of the dimensions (See section 3.4). Adding one individual interest assessed most of the dimensions pertaining to usability for single users. Deleting the interest corresponded to the Deletion and Modification of preselected interest dimensions. Adding multiple interests was to assess the Multiple-interest selection and Modification of preselected interests dimension.
Going from one screen to the other and re-displaying the same content evaluated the Screen-switch effort dimension. The evaluation of Screen-switch effort was motivated by the emergence of pervasive display networks. These are large-scale networks of pervasive public displays and associated sensors that are open to applications and content from many sources (Davies et al., 2012; Sarabadani Tafreshi et al., 2018a). In such a network, users might encounter several displays one after another whose customization requires them to indicate their interests. This task was omitted from the study with multiple users, for two reasons. Firstly, we did not expect to see major differences for this dimension between the single-user and multi-user studies, since we believe switching screen is not dependent on how many participants are using the system at the same time. This cannot be said of the other dimensions. The second reason was to keep the study duration fairly acceptable by the participants.
Before participants started the tasks, we introduced the system, the purpose of the study, asked for their consent to record the experiment using two video cameras, and asked them to complete a questionnaire to gather demographic information.
Following each experiment with each of the methods, we asked participants to complete a questionnaire based on the quality dimensions shown in Table 1. The studies used a within-subjects design, meaning that all participants for each of the studies experienced all the interaction methods. To avoid the potential order effects, the studies used a cross-over design, so the order of the interaction methods for each subject was randomized. For each of the experiments, participants were allowed to walk around freely and complete the tasks with no time limit. The studies lasted about one hour in average.
We told and repeatedly reminded the participants that they should think of a general use of the method, in which the interests could be anything and not only food. When referring to privacy, we specifically emphasized their personal interests. We also asked several semi-structured and optional open-ended questions about participants' experience, to allow them to fully express their opinions. These questions allowed us to collect comments and gave us a better insight into the interaction methods. For example, we asked what the users particularly liked about the methods, what could still be improved or was lacking, and whether the methods over-exposed user's interests, which could be regarded as private information under some circumstances. After experimenting with all the methods, the participants were also asked to give an overall rating to each so that we could gauge the perception of all methods in retrospect. The responses were recorded using 5-point Likert scales (1=strongly disagree, 5=strongly agree).
The study was carried out in the public area of the research group office, which contains two 65 inch high definition displays. The displays were aligned next to each other at eye level at a distance of approximately 2.5 meter. The area (≈ 8 * 7m2) facing the screen is large enough to allow several people to interact with the display concurrently. This setting simulated a possible deployment scenario. Each screen was also connected to a computer running Windows 7, and equipped with a Microsoft Kinect 2 sensor3 placed on top of the two sideboards (see Figure 3). A professional studio microphone (Meteor Mic by SAMSON4) was used for the voice command method, and the automatic methods were achieved with Kontakt.io Beacon cards. We asked all the participants to use their own mobile phones for the cross-device method, because this better approximated a real-world scenario in which viewers are likely to be familiar with their own smartphones.
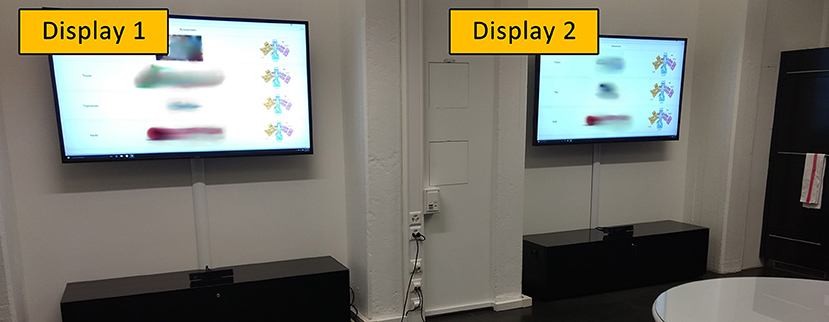
Figure 3. Study setup.
Significant results of the post hoc analysis of the single-user study are summarized in Figure 4 using box-and-whisker plot. Statistical significance is represented by * and ** marks. The significant results for the multi-user study are summarized in Figure 5. For detailed results of the single-user study see Table S1 and for the multi-user study see Table S2. Tables S1, S2 report the medians of each interaction method in each quality dimension as well as significant outcomes together with their corresponding z-values and adjusted p-values.
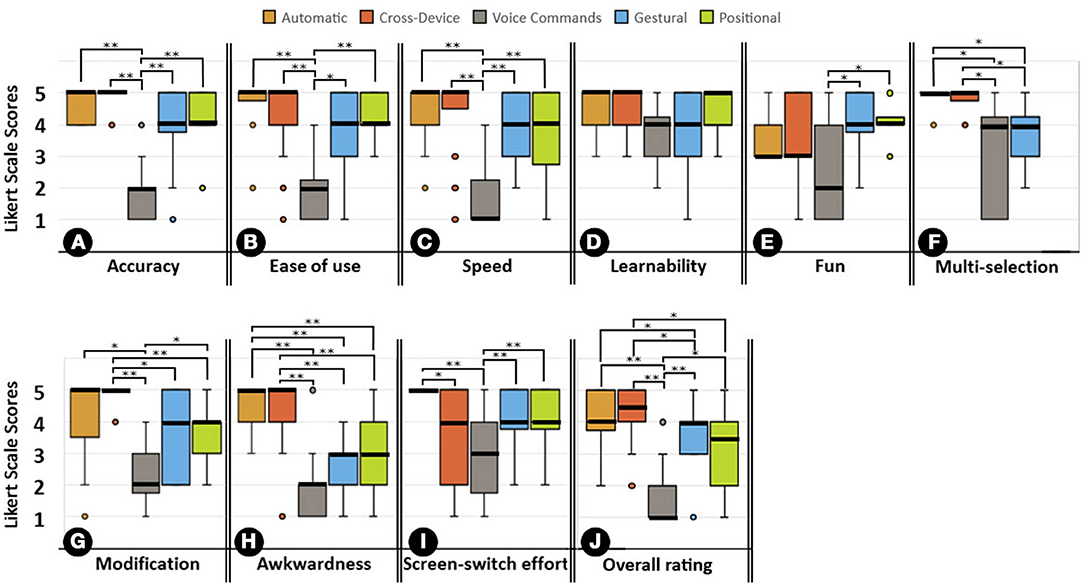
Figure 4. Statistical comparison of the methods on each dimension (single-user study); The signs * and ** mark significant findings with p < 0.05, and 0.01 respectively. The scores for awkwardness and screen-switch effort dimensions are reverse coded. The positional method does not support multiple interest selection and therefore, was excluded from analysis of multi-selection dimension.
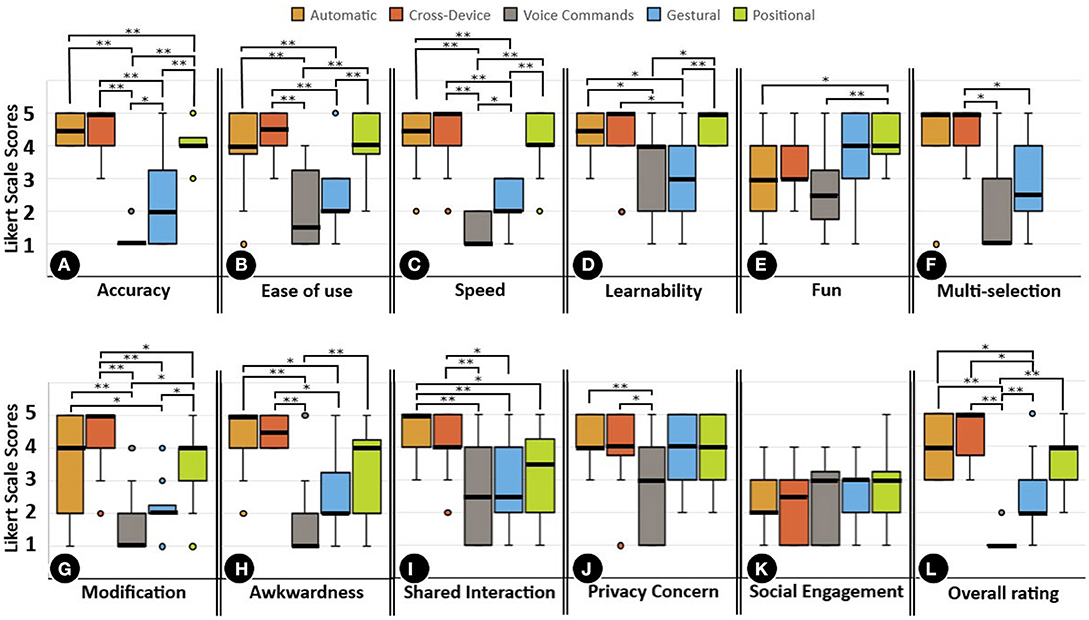
Figure 5. Statistical comparison of the methods on each dimension (multi-user study); The * and ** mark significant differences between methods and corresponding to p < 0.05, and p < 0.01, respectively. The scores for awkwardness, shared interaction difficulty, and privacy concern dimensions are reverse coded. the positional method does not support multi-interest selection and therefore, was excluded from analysis of multi-selection dimension.
The results illustrated in Figure 4A show that, apart from voice command, all the detection methods in the single-user experiment performed satisfactorily for Accuracy. The only statistically significant results can be found between voice command (Mdn = 2) and all the other methods, which all achieved a median score of 4 and above. The multi-user study yielded similar results, as Figure 5A indicates. Except for the gestural method, all the methods scored significantly better than voice command. Gestural scored lower in the multi-user experiment (Mdn = 2) than in the single-user experiment (Mdn = 4). Automatic and cross-device scored highest in both single–user (Mdn = 5) and multi-user experiments (Mdn ≥ 4.5).
In the Ease of use dimension, voice command reached a lower median score (Mdn = 2) than the other detection methods, which all reached a median score of 4 or higher in the single-user experiment, as can be seen in Figure 4B. The median score for gestural detection method dropped from 4 in the single-user experiment to 2 in the multi-user experiment, with all other methods having a statistically significant margin over it, as can be seen in Figure 5B. Automatic and cross-device scored highest in the single-user experiment (Mdn = 5). In the multi-user experiment automatic, cross-device and positional scored highest (Mdn ≥ 4).
As Figure 4C shows, the voice command detection method (Mdn = 1) was outperformed by all other methods in the Speed dimension in the single-user experiment. Following the same pattern as in the previous two dimensions, voice command scored lowest in the multi-user study (Mdn = 1); see Figure 5C. Similarly, the score for the gestural method dropped from a median of 4 in the single- user experiment to a median of two in the multi-user experiment. Similar to the results in the Accuracy dimension, automatic and cross-device methods scored highest in both single-user (Mdn = 5) and multi-user experiments (Mdn ≥ 4.5) for this dimension.
In the single-user experiment, no significant results were observed for Learnability, as can be seen in Figure 4D. Different results were obtained for the multi-user study, as can be seen in Figure 5D. The gestural method dropped from a median of 4 to a median of 3 and the automatic method from a median of 4 to a median of 3.5 between single-user and multi-user experiments. Cross-device, voice command, and positional methods reached the same median scores in both single-user and multi-user experiments.
For the single user study, positional and gestural methods (Mdn = 4) outperformed automatic and cross-device methods (Mdn = 3), and clearly outperformed voice command (Mdn = 2) in the Fun dimension, as indicated by Figure 4E. For the multi-user study, similar results were obtained, as shown in Figure 5E. No change can be seen in the median scores for automatic, cross-device, gestural and positional methods between single-user and multi-user experiments. There was only a slight change in the median score for voice command between single-user (Mdn = 2) and multi-user experiments (Mdn = 2.5).
In the Multi-selection dimension, automatic and cross-device methods yielded the highest scores (Mdn = 5) in both experiments, as can be seen in Figures 4F, 5F. Voice command reached a median score of 4 in the single-user experiment and 1 in the multi-user experiment. Gestural reached a median score of 4 in the single-user experiment and 2.5 in the multi-user experiment.
In the Modification dimension, voice command performed terribly in both single-user (Mdn = 2) and multi-user experiments (Mdn = 1), as shown in Figures 4G, 5G. Positional reached median scores of 4 in both experiments. Cross-device scored significantly better than voice command, gestural and positional methods in both experiments. There was drop in the median score of gestural between single-user (Mdn = 4) and multi-user experiments (Mdn = 2).
The results for the Awkwardness dimension can be seen in Figures 4H, 5H. In the single-user study, automatic (Mdn = 5) and cross-device (Mdn = 5) yielded significantly higher median scores than voice command (Mdn = 2), gestural (Mdn = 3), and positional (Mdn = 3). Similarly, in the multi-user study, automatic (Mdn = 4) and cross-device (Mdn = 5) yielded significantly higher median scores than voice command (Mdn = 1) and gestural (Mdn = 2), but not than positional (Mdn = 4).
In the Screen switch effort dimension, automatic scored best (Mdn = 5), followed by gestural (Mdn = 4) and positional (Mdn = 4), as can be seen in Figures 4I. We found a significant difference between the scores of automatic and cross-device (Mdn = 4). Voice command (Mdn = 3) performed significantly worse than automatic, gestural, and positional.
The results for the Shared interaction dimension are shown in Figure 4I. Automatic (Mdn = 5) and cross-device (Mdn = 4) scored very high and significantly better than voice command (Mdn = 2.5) and gestural (Mdn = 2.5) in the first question about impediment due to physical presence. Automatic detection scored significantly better than positional (Mdn = 3.5).
The results for the Privacy dimension are shown in Figures 5J. Automatic, cross-device, gestural and positional detection methods scored very similarly, and all reached a median score of 4. Automatic and cross-device scored significantly higher than voice command (Mdn = 3) in this dimension.
There are no statistically significant results for the Social engagement dimension as can be seen in Figures 5K. Positional (Mdn = 3), gestural (Mdn = 3), and voice command (Mdn = 3) scored slightly better than cross-device (Mdn = 2.5) and automatic (Mdn = 2).
The results for the overall rating can be found in Figure 4J for the single-user experiment and in Figure 5L for the multi-user study. Cross-device scored best in both single-user (Mdn = 4.5) and multi-user experiments (Mdn = 5). In the single-user experiment, cross-device scored significantly better than voice (Mdn = 1), gestural (Mdn = 4), and positional (Mdn = 3.5). Automatic (Mdn = 4) scored significantly better than voice and gestural in the single-user experiment. Voice scored significantly lower than all other the multi-user experiment, gestural (Mdn = 2) scored significantly lower than cross-device (Mdn = 5) and automatic (Mdn = 4).
The feedback provided as comments was recorded during and after the study and gave us a better insight into the opinions of the participants. Here, the participants are referred to by the abbreviation SX or MX where X is the participant number, S stands for single-user, and M for multi-user.
Participants enjoyed the “seamless detection of interests” (M7) and praised the effortless nature of the interaction method: “It's a bit like magic” (M8). Moreover, they appreciated the fact that they were “not too exposed” (M14), that “you couldn't see who chose what” (M18), and the fact that it was difficult “to trace the source of the choice” (M13). However, one participant (S1) stated that the “information is displayed automatically without my explicit agreement” and another (S13) felt “not that confident in entering my interests into a website.” One participant claimed: “I don't see myself using a card” (M9). The need to log into one's account to modify interests was criticized by two participants: “I would be too lazy to configure lots of stuff” (M8), and “Maybe my interests over time change, and I would not have the motivation anymore to update them” (S13). Lastly, one participant stated that it would be advantageous to turn off the card “in situations where I don't want others to see this specific interest” (S16).
The cross-device detection method was reported to be very “private” (S1, S17, M3), “intuitive” (S5, S10), “reactive,” “precise” (S7), and “immediate” (S3, M7). Some individuals appreciated that it did not require physical movement. On the other hand, some participants found the method redundant “because the information can also be displayed on the phone” (M12) and would (“rather use only my phone for the entire thing” (M11). Several people found typing the URL to be annoying. Related to this shortcoming, several mentioned QR code as a viable alternative.
Participants expressed positive feedback, describing the method as “fun” (S2, S7, S9, S11, S13, M3), “active” (S1, S10), “easy to use” (S8, S14, S15, S18), and “positively unconventional” (S9). One participant reported the use of the detection system to be “too difficult” (S12). In the multi-user setting, one participant stated that it was “funny to look at other people” (M11) engaging with it. Participants enjoyed the lack of equipment required, e.g., “it's just walk up and use” (M8). Participants stated that: “it was a bit hard to understand where I was in the selection” (M9) and proposed (“one new line for each person” (M10)). In the single-user study, 13 of 18 people felt that their information was too exposed, whereas in the multi-user study, 10 out of 18 regarded the exposure as acceptable.
In line with the quantitative results, the voice command method received almost exclusively bad feedback in both single-user and multi-user studies. More than half of the participants mentioned poor voice recognition as the main problem. One participant was “wondering what would happen in a crowded place” (S13), and two participants pointed out that having an accent is an additional limiting factor. Nevertheless, some people highlighted its potential, since it is “easy to use” (S1, S4, S15). Some 15 out of 18 participants felt it lacked privacy, since they “have to speak louder than noise in the area” (S15). One user proposed a hybrid version of cross-device and speech recognition: “The mic of my smartphone could be accessed to make a more accurate and private selection” (M2).
Many participants praised the detection method for being “accurate” (M12), “easy” (M1, M7, M10, M15, M17), “interactive” (M2, M3, M14, M16), and “funny” (M4, M8, M9). There was “no need to learn or to have a device” (S16), “no need of using phone and hands” (S17). Several participants reported that they liked the fact that the transitions over other positions to reach that of interest allowed them to discover new content that might be potentially interesting. Participants mostly complained about “people crossing paths” (M11) which led the Kinect to lose track of their skeleton and would treat them as new users. Being blocked by other users standing in front of them was also regarded as a major weakness.
To provide an overview of the results, the dimensions are here collated in four categories.
1. Usability: accuracy, ease of use, speed, learnability, fun, multiple-interest selection, screen-switch effort, and modification of preselected interests.
2. Social Impact: awkwardness, and social Engagement.
3. Privacy.
4. Shared Interaction.
Figure 4 indicates that the automatic and cross-device methods are most useful in a single-user setup; they score highest across all usability dimensions except for Fun and Screen-switch effort. In the Fun dimension, these two methods were outperformed by the gestural and positional methods. This might be because the novelty of the gestural and positional methods piqued the participants' curiosity, as also indicated by the qualitative feedbacks. In the Screen-switch effort dimension, the automatic method performed statistically significantly better than the cross-device detection method, and the ratings varied widely for the latter. Thus, some participants did not mind entering their selected interests when encountering a new display, whereas others experienced it as a tedious task. Surprisingly, even gestural and positional methods slightly outperformed the cross-device method in the Screen-switch effort dimension.
In line with prior studies (Hakulinen et al., 2013; Scholl et al., 2014), voice commands turned out to be the least useful method. Voice command had a modest performance with respect to all the other methods. Accuracy, Ease of use, and Speed received the lowest overall ratings. This might be due to the poor speech recognition provided by Google Inc., which is in line with results obtained in related work. Apart from voice command, the gestural method received lower ratings than other methods in Learnability and Multi-selection. This finding might be because some participants found it difficult to interact with the system using both hands at the same time. In the Modification dimension, cross-device reached highest rankings, followed by automatic, gestural, positional, and finally voice command detection methods. These results reflect the effort made for the selection of new interests.
Similar results were obtained in the multi-user setup, as shown in Figure 5. Particularly, as suggested by prior research (Weißker et al., 2016), cross-device proved highly useful for simultaneous interaction of several people with public displays. However, cross-device and automatic methods received lower ratings than gestural and positional methods in the Fun dimension. Clearly, the gestural method received lower ratings in all usability dimensions than in the single-user setup. This finding is in line with the qualitative feedback, in which difficulties in keeping track of the cursor in the multi-user setup expressed. It is also reflected when comparing the overall rating of the method between single-user and multi-user setups.
Despite being the most accurate and private detection methods, automatic and cross-device did not catalyze social engagement among participants. Having high privacy and discretion comes at a cost, and since people cannot tell who made which selection, there are few reasons to engage in any kind of social interaction with strangers. Moreover, the anonymous indication of interests can remove the honeypot effect (Müller et al., 2012). The honeypot effect refers to the process where people interacting with a system passively stimulate passers-by to observe, approach and engage in an interaction.
On the upside, these two methods were not experienced as awkward, therefore outperforming voice command and gestural methods. The voice command method scored low in the Awkwardness dimension and was significantly worse than all other methods in the multi-user setup, since participants disliked raising their voices and repeating their words, especially in front of others. The low accuracy of recognition, on the other hand, motivated participants to help each other. Therefore, we cannot draw conclusions whether a better functioning speech recognition system would actually encourage people to talk to each other. The gestural method was considered awkward by the majority of the participants, reflected by the fact that most people stated they would not support the implementation of this method in a real-world setting. However, while anonymous indication of interests can reduce social awkwardness there is a downside: it removes the honey-pot effect (Müller et al., 2012).
Although differences were not statistically significant, gestural and positional methods were top scorers in Social Engagement dimension. The positional method is not only easy to use and quick to learn but is also independent of users' devices. Further, the positional method is more likely than other methods to trigger social interaction among people, since people with the same interest also stand next to each other. The fact that the zones of the positional method allow each participant to choose only one interest at a time encouraged participants to interact with each other to find and choose more common interests. Qualitative feedback showed that some participants enjoyed watching others engaging with the system, which to some extent can also be considered social interaction.
Automatic and cross-device methods turned out to be the most private and discrete methods according to both quantitative results and qualitative feedback. This finding is in line with previous work (Kurdyukova et al., 2012; Alt et al., 2013) showing that automatic and cross-device methods retain users' privacy more effectively. The voice command method is at the other end of the spectrum and received statistically significantly lower ratings than automatic and cross-device detection methods. Gestural and positional methods received slightly lower ratings than automatic and cross-device methods. It would be possible to allocate the choice of interests to individual participants by watching the scene in a setup where gestural or positional are used. Qualitative feedback indicates that participants would likely only choose those interests that they would feel comfortable sharing with others, and thus, the exposure would be at an acceptable level.
Automatic and cross-device methods were shown to be highly scalable, since additional users did not represent an obstacle in the interest selection. The usability of these two methods in a multi-user study was shown to be as high as for single-user study. The voice command received the lowest ratings in the Shared interaction difficulty dimension. This might be because participants were talking simultaneously, which worsened speech recognition. Throughout the study, we witnessed how people would speak over each other, which might have worsened this dimension in the multi-user setting. Apart from voice command, the gestural method also received significantly lower ratings than automatic and cross-device methods. It might be that the gestural method would receive higher ratings if an individual cursor line were implemented for each user; participants suggested that this might decrease confusion. The ratings for the positional method were significantly lower than for the automatic method in the Shared interaction difficulty dimension. Our results indicate that the higher the number of users in the zones of the positional method, the less attractive is participation. In this setting, people are forced to cross with each other and can be blocked by somebody standing in front of them. This problem could be solved by mounting the sensor above the users. Moreover, because of the position of the sensor, simultaneous users could be covered by others standing in front of them. By mounting a sensor above the users this problem could be solved.
Our experimental exploration of these interaction methods for indicating interests to PDSs provides the basis of these design guidelines for practitioners and researchers.
We recommend automatic and cross-device methods for large numbers of concurrent users. Voice commands and gestural methods would be more appropriate in single-user or double-user settings. The positional method could be a compromise for medium-size groups of users. No access is required to previously defined user interests, and the fun factor of positional can be an incentive for people to use it. On the other hand, as the number of users grows, the size of each zone needs to increase.
Automatic and cross-device methods can easily be scaled to many interests, since the selection happens on a website that can provide long lists of options and can easily be scrolled through. In contrast to automatic and cross-device methods, the scalability of positional, gestural and voice command methods is limited. In these three, only one interest can be chosen by a user at any one time. Moreover, the number of interests selected through the gestural method is limited to what can be shown on the screen. In positional interaction, as the number of interests increases, more zones would be needed, hence requiring either a larger total area or smaller zones.
Privacy depends on the mode of interaction. Automatic and cross-device methods turned out to be the most private. In automatic, the interaction is completely concealed, and in cross-device it can easily be dissimulated if users walk among many bystanders. For the positional method, users need to walk in two dimensions, which can attract attention and reveals both interaction and selection. In gestural, no privacy can be guaranteed.
Voice command is the least discrete method since it requires a short distance between user and microphone and a command to be loud enough to cover the background noise.
The display location, its setup, and the characteristics of the location strongly affect the choice of the interaction method. A spacious area in front of the screen that is not too highly frequented allows positional and gestural detection methods to be used. The screen size should be chosen such that the gestural navigation map is visible to multiple users. Public displays are extensively used in transport hubs such as train stations, where people are short on time and their hands busy carrying luggage. Automatic and cross-device methods are better suited to such circumstances. In airports, time is not always constrained, but a web-based cross-device interaction should be avoided since many people lack Internet connection.
Expected frequency is a deciding factor. If users are expected to interact with a display frequently, the automatic method is the best choice, since it requires no effort from the user after an initial set-up. This could be the case in an office where employees are shown content. Cross-device is also a useful option if the URL mapped to the screen can be summoned quickly. In contrast, gestural, voice command, and positional methods require the users to input their interests every time.
Interests can vary over time. The automatic method always uses pre-set interest lists and gives little freedom to users to quickly change their interests on the spot. At the other extreme, the zones of interaction in the positional method allow users to browse options and enable very fast exploration. Indeed, users can peek at content they do not know and discover something they are interested in or something they are willing to try out.
While the lab setting delivered precise results, the results may deviate from the experiences the users would have in real-world settings.
The technologies tested here could also have affected the performance of the methods in the user study. Although we tried to use the most recent and robust technologies in developing the methods, the technologies are not completely accurate, for instance in detecting body gestures or voice commands.
Furthermore, we did not include the touch interaction in the current work due to the major touch issues found in the literature for public display use. Nonetheless, the severity of problems for the touch-interaction seems to be on a similar level as that of voice interaction found in the current study. Future studies need to consider these interaction methods and their limitations to potentially enhance them for public display use.
We explored automatic, gestural, voice command, positional, and cross-device methods of indicating interest to public display systems. We selected and presented multiple dimensions that we considered critical to choosing appropriate methods for gathering the interests of public display viewers. We conducted single-user and multi-user experiments whose design was based on the dimensions we had identified and analyzed our results to gain insights into how the methods perform. The results show that each method has strengths and weaknesses in various dimensions; these should be taken into account when deciding how to customize public display systems for a specific setting. We used our findings and observations to establish guidelines for researchers and practitioners to help select the most suitable method for particular scenarios and settings. In future, we plan to investigate to what extent these methods can engage people in real-world settings. We also want to explore the potential of hybrid interaction methods, such as combining cross-device and voice commands so people may use their mobile phone microphone to indicate their interests to the displays remotely. Such combinations may improve voice recognition, shield out background noises, and decrease privacy exposure.
AEST conceived, designed, and coordinated the study. AEST and AS collected and analyzed the data. AEST, AS, and GT interpreted the data. AEST wrote the manuscript. AEST and GT revised the manuscript.
The authors declare that the research was conducted in the absence of any commercial or financial relationships that could be construed as a potential conflict of interest.
The Supplementary Material for this article can be found online at: https://www.frontiersin.org/articles/10.3389/fict.2018.00020/full#supplementary-material
2. ^https://cloud.google.com/speech/
3. ^http://www.xbox.com/en-US/xbox-one/accessories/Kinect
4. ^http://www.samsontech.com/samson/products/microphones/usb-microphones/meteormic/
Ackad, C., Clayphan, A., Tomitsch, M., and Kay, J. (2015). “An In-the-Wild Study of Learning Mid-air Gestures to Browse Hierarchical Information at a Large Interactive Public Display,” in Proceedings of Joint International Conference on Pervasive and Ubiquitous Computing and the International Symposium on Wearable Computers (UbiComp) (Osaka).
Alt, F., Shirazi, A. S., Kubitza, T., and Schmidt, A. (2013). “Interaction techniques for creating and exchanging content with public displays,” in Proceedings of the SIGCHI Conference on Human Factors in Computing Systems (CHI) (Paris), 1709.
Baldauf, M., Adegeye, F., Alt, F., and Harms, J. (2016). “Your browser is the controller: advanced web-based smartphone remote controls for public screens,” in Proceedings of 5th ACM International Symposium on Pervasive Displays (PerDis) (Oulu: ACM).
Boring, S., Jurmu, M., and Butz, A. (2009). “Scroll, tilt or move it: using mobile phones to continuously control pointers on large public displays,” in Proceedings of 21st Annual Conf. of the Australian Computer-Human Interaction Special Interest Group: Design: Open 24/7 (ACM), 161–168.
Brignull, H., and Rogers, Y. (2003). “Enticing people to interact with large public displays in public spaces,” in Proceedings of INTERACT (Brighton, UK), Vol. 3, 17–24.
Carter, M., Velloso, E., Downs, J., Sellen, A., O'Hara, K., and Vetere, F. (2016). “PathSync: multi-user gestural interaction with touchless rhythmic path mimicry,” in Proceedings of the Conference on Human Factors in Computing Systems (CHI) (San Jose, CA: ACM).
Chan, C., and Mirfakhraei, S. S. (2013). Hand Gesture Recognition Using Kinect. Bachelor Thesis, Boston University, Boston, MA, 196–199.
Cheung, V., Watson, D., Vermeulen, J., Hancock, M., and Scott, S. (2014). “Overcoming interaction barriers in large public displays using personal devices,” in Extended Abtracts of the Ninth ACM International Conference on Interactive Tabletops and Surfaces (ITS) (Dresden).
Davies, N., Friday, A., Newman, P., Rutlidge, S., and Storz, O. (2009). “Using bluetooth device names to support interaction in smart environments,” Proceedings of the 7th International Conference on Mobile Systems, Applications, and Services (MobiSys.) (Kraków).
Davies, N., Langheinrich, M., Clinch, S., Elhart, I., Friday, A., Kubitza, T., and Surajbali, B. (2014). “Personalisation and privacy in future pervasive display networks,” in Proceedings of the SIGCHI Conference on Human Factors in Computing Systems (CHI) (New York, NY: ACM), 2357–2366.
Davies, N., Langheinrich, M., José, R., and Schmidt, A. (2012). Open display networks: a communications medium for the 21st century. Computer 45, 58–64. doi: 10.1109/MC.2012.114
Di Rienzo, A., Garzotto, F., Cremonesi, P., Frà, C., and Valla, M. (2015). “Towards a smart retail environment,” in Adjunct Proceedings of the 2015 ACM International Joint Conference on Pervasive and Ubiquitous Computing and Proceedings of the ACM International Symposium on Wearable Computers (UbiComp) (Osaka).
Elhart, I., Scacchi, F., Niforatos, E., and Langheinrich, M. (2015). “ShadowTouch - a multi-user application selection interface for interactive public displays,” Proceedings of the 4th International Symposium on Pervasive Displays (PerDis) (Saarbruecken), 209–215.
Hakulinen, J., Heimonen, T., Turunen, M., Keskinen, T., and Miettinen, T. (2013). “Gesture and speech-based public display for cultural event exploration,” in Proceedings of the Tilburg Gesture Research Meeting (Tilburg).
Hardy, J., Rukzio, E., and Davies, N. (2011). “Real world responses to interactive gesture based public displays,” in Proceedings of the 10th International Conference on Mobile and Ubiquitous Multimedia (Beijing), 33–39.
Huang, E. M., Koster, A., and Borchers, J. (2008). “Overcoming assumptions and uncovering practices: when does the public really look at public displays?,” in International Conference on Pervasive Computing (Sydney, NSW: Springer), 228–243.
Ichikawa, F., Chipchase, J., and Grignani, R. (2005). “Where's the phone? A study of mobile phone location in public spaces,” in 2nd Asia Pacific Conference on Mobile Technology, Applications and Systems (Guangzhou).
James, J. M. (2015) SimSense-Gestural Interaction Design for Information Exchange between Large Public Displays and Personal Mobile Devices. Master's thesis.
Kray, C., Nesbitt, D., Dawson, J., and Rohs, M. (2010). “User-defined gestures for connecting mobile phones, public displays, and tabletops,” in Proceedings of the 12th International Conference on Human Computer Interaction with Mobile Devices and Services (MobileHCI) (Lisbon: ACM).
Kurdyukova, E., Obaid, M., and André, E. (2012). “Direct, bodily or mobile interaction?: comparing interaction techniques for personalized public displays,” in Proceedings of the 11th International Conference on Mobile and Ubiquitous Multimedia (MUM) (Ulm).
Memarovic, N., Clinch, S., and Alt, F. (2015). “Understanding display blindness in future display deployments,” in Proceedings of the 4th International Symposium on Pervasive Displays (PerDis) (Saarbruecken: ACM).
Mónica Faria, B., Vasconcelos, S., Paulo Reis, L., and Lau, N. (2013). Evaluation of distinct input methods of an intelligent wheelchair in simulated and real environments: a performance and usability study. Assist. Technol. 25, 88–98. doi: 10.1080/10400435.2012.723297
Müller, J., Alt, F., Michelis, D., and Schmidt, A. (2010). “Requirements and design space for interactive public displays,” in Proceedings of the 18th ACM International Conference on Multimedia (MM) (New York, NY: ACM), 1285–1294.
Müller, J., Walter, R., Bailly, G., Nischt, M., and Alt, F. (2012). “Looking glass: a field study on noticing interactivity of a shop window,” in Proceedings SIGCHI Conference on Human Factors in Computing Systems (CHI) (Austin, TX: ACM).
Müller, J., Wilmsmann, D., Exeler, J., Buzeck, M., Schmidt, A., Jay, T., et al. (2009). “Display blindness: the effect of expectations on attention towards digital signage,” in Lecture Notes in Computer Science (including subseries Lecture Notes in Artificial Intelligence and Lecture Notes in Bioinformatics), Vol. 5538, eds H. Tokuda, M. Beigl, A. Friday, A. J. Bernheim Brush, and Y. Tobe (Nara; Berlin; Heidelberg: Springer), 1–8.
Nutsi, A. (2015). “Usability guidelines for co-located multi-user interaction on wall displays,” in ACM International Conference on Interactive Tabletops and Surfaces-Doctoral consortium (ITS) (Madeira), 433–438.
Nutsi, A., and Koch, M. (2015). Multi-user usability guidelines for interactive wall-display applications. Proceedings of the 4th International Symposium on Pervasive Displays (PerDis) (Saarbruecken), 233–234.
Sarabadani Tafreshi, A. E., Bombsch, M., and Tröster, G. (2018a). Chained displays: configuration of multiple co-located public display. Int. J. Comput. Netw. Commun. 10, 27–44. doi: 10.5121/ijcnc.2018.10303
Sarabadani Tafreshi, A. E., Marbach, K., and Norrie, M. C. (2017a). “Proximity-based adaptation of web content on Public displays,” in International Conference on Web Engineering (ICWE) (Rome: Springer), 282–301.
Sarabadani Tafreshi, A. E., Marbach, K., and Troster, G. (2018b). “Proximity-based adaptation of web content to groups of viewers of public displays,” in International Journal of Ubiquitous Computing, Vol. 9, 1–9.
Sarabadani Tafreshi, A. E. and Norrie, M. C. (2017). “ScreenPress: a powerful and flexible platform for networked pervasive display systems,” in Proceedings 6th ACM International Symposium on Pervasive Displays (PerDis) (Lugano: ACM).
Sarabadani Tafreshi, A. E., Sarabadani Tafreshi, S. C., and Sarabadani Tafreshi, A. (2017b). “TiltPass: using device tilts as an authentication method,” in Proceedings of the 2017 ACM International Conference on Interactive Surfaces and Spaces (ISS) (Brighton, UK: ACM), 378–383.
Sarabadani Tafreshi, A. E., Wicki, A., and Tröster, G. (2018c). “RDSpeed: development framework for speed-based adaptation of web content on public displays,” in 26th International Conference in Central Europe on Computer Graphics, Visualization and Computer Vision (WSCG) (Pilsen: WSCG), 164–173.
Scholl, P. M., Borazio, M., Jansch, M., and Van Laerhoven, K. (2014). Diary-like long-term activity recognition: touch or voice interaction? Proceedings of the 11th International Conference on Wearable and Implantable Body Sensor Networks Workshops (BSN) (Zurich), 42–45.
Sharifi, M., Payne, T., and David, E. (2006). Public Display Advertising Based on Bluetooth Device Presence. Proceedings of the 8th International Workshop on Mobile Interaction with the Real World (MIRW) (Espoo), 52–55.
Steinberger, F., Foth, M., and Alt, F. (2014). “Vote with your feet: local community polling on urban screens,” in Proceedings of the International Symposium on Pervasive Displays (PerDis) (ACM).
Weißker, T., Berst, A., Hartmann, J., and Echtler, F. (2016). “The massive mobile multiuser framework: enabling ad-hoc realtime interaction on public displays with mobile devices,” in Proceedings of the 5th ACM International Symposium on Pervasive Displays (PerDis) (New York, NY: ACM), 168–174.
Keywords: interaction techniques, design guidelines, customization, user interest, pervasive displays, public displays
Citation: Sarabadani Tafreshi AE, Soro A and Tröster G (2018) Automatic, Gestural, Voice, Positional, or Cross-Device Interaction? Comparing Interaction Methods to Indicate Topics of Interest to Public Displays. Front. ICT 5:20. doi: 10.3389/fict.2018.00020
Received: 26 January 2018; Accepted: 20 July 2018;
Published: 03 September 2018.
Edited by:
Nadia Bianchi-Berthouze, University College London, United KingdomReviewed by:
Andrea Kleinsmith, University of Maryland, Baltimore County, United StatesCopyright © 2018 Sarabadani Tafreshi, Soro and Tröster. This is an open-access article distributed under the terms of the Creative Commons Attribution License (CC BY). The use, distribution or reproduction in other forums is permitted, provided the original author(s) and the copyright owner(s) are credited and that the original publication in this journal is cited, in accordance with accepted academic practice. No use, distribution or reproduction is permitted which does not comply with these terms.
*Correspondence: Amir E. Sarabadani Tafreshi, dGFmcmVzaGlAaW5mLmV0aHouY2g=
Disclaimer: All claims expressed in this article are solely those of the authors and do not necessarily represent those of their affiliated organizations, or those of the publisher, the editors and the reviewers. Any product that may be evaluated in this article or claim that may be made by its manufacturer is not guaranteed or endorsed by the publisher.
Research integrity at Frontiers
Learn more about the work of our research integrity team to safeguard the quality of each article we publish.