Department of Pathology and Division of Neuropathology, University of Kentucky Medical Center, Sanders-Brown Center on Aging and Alzheimer’s Disease Center, University of Kentucky, Lexington, KY, USA
MicroRNAs (miRNAs) play key roles in gene expression regulation in both healthy and disease brains. To better understand those roles, it is necessary to characterize the miRNAs that are expressed in particular cell types under a range of conditions. In situ hybridization (ISH) can demonstrate cell- and lamina-specific patterns of miRNA expression that would be lost in tissue-level expression profiling. In the present study, ISH was performed with special focus on the human entorhinal cortex (EC) and transentorhinal cortex (TEC). The TEC is the area of the cerebral cortex that first develops neurofibrillary tangles in Alzheimer’s disease (AD). However, the reason for TEC’s special vulnerability to AD-type pathology is unknown. MiRNA ISH was performed on three human brains with well-characterized clinical and pathological parameters. Locked nucleic acid ISH probes were used referent to miR-107, miR-124, miR-125b, and miR-320. In order to correlate the ISH data with AD pathology, the ISH staining was compared with near-adjacent slides processed using Thioflavine stains. Not all neurons or cortical lamina stain with equal intensity for individual miRNAs. As with other areas of brain, the TEC and EC have characteristic miRNA expression patterns. MiRNA ISH is among the first methods to show special staining characteristics of cells and laminae of the human TEC.
Alzheimer’s disease (AD) is a prevalent neurodegenerative disease that culminates in severe deficits in cognition and autonomy. By definition, brains afflicted by AD contain two different neuropathological hallmarks – neurofibrillary tangles (NFTs) and neuritic amyloid plaques (NPs) The National Institute on Aging, and Reagan Institute Working Group on Diagnostic Criteria for the Neuropathological Assessment of Alzheimer’s Disease (1997)
. NFTs are ‘inclusion bodies’, composed of insoluble tau protein polymers that coalesce within neurons. NPs consists a roughly-spherical extracellular component that includes fibrillary polymers of the Aβ peptide, with nearby degenerating cell processes that contain tau polymers indistinguishable from those in NFTs.
Neuroanatomically, AD pathology manifests in a complex but well-characterized spatiotemporal sequence (Braak and Braak, 1991
; Braak et al., 1993
). Most clinico-pathological correlation studies indicate that cortical NFT density, assessed by Braak staging (Braak et al., 1993
) or other means, is the parameter best correlated with the severity of AD cognitive impairment (Arriagada et al., 1992
; Nelson et al., 2007b
, 2008a
,b
, 2009b
; Sonnen et al., 2007
). In the first stages of the disease, NFTs are observed in medial temporal lobe structures (Braak and Braak, 1991
).
The specific cerebral cortical subfield with earliest NFT formation in AD is the transentorhinal cortex (TEC) (Braak and Braak, 1992
). The TEC usually occupies the medial bank of the perirhinal collateral sulcus, comprising ∼2–10 mm of the inexactly defined and phylogenetically variable Brodmann Area 35 (Schmidt et al., 1993
; Taylor and Probst, 2008
). As its name implies, the TEC constitutes a transitional zone between the entorhinal cortex (EC) and the more laterally situated six-layered cerebral isocortex (Braak and Braak, 1985
). The TEC thus “can be considered a periallocortical field bordering a proisocortical field of the adjacent temporal cortex, that corresponds to the perirhinal region”, according to Heiko Braak and colleagues (Schmidt et al., 1993
). NFTs are observed in the TEC long before clinical manifestations of AD: in a large autopsy series, scant numbers of NFTs were detected in the TEC of approximately one-fifth of persons dying in their thirties and over one-third of persons in their forties (Del Tredici and Braak, 2008
).
During the progression toward end-stage AD, NFTs and/or cell death claim the large majority of neurons in some laminae of the TEC and nearby EC (Braak and Braak, 1985
; Gomez-Isla et al., 1996
; Garcia-Sierra et al., 2000
; Hof et al., 2003
). NFTs are also observed in the TEC and EC in neurodegenerative diseases other than AD: Parkinson’s disease, argyrophilic grain disease, and Huntington’s disease, for example (Braak and Braak, 1992
; Ulrich et al., 1992
; Braak et al., 2000
; Nelson et al., 2009a
). Unfortunately, the remarkable predisposition of TEC and EC neurons to develop pathological changes has not been adequately explained. Nor are there many reported markers providing clues about TEC neurochemistry.
In the present study, in situ hybridization (ISH) was performed in order to characterize the distribution of some neuronally-expressed microRNAs (miRNAs) in the human TEC and surrounding brain structures. MiRNAs are short (∼22 nucleotide) RNA molecules that play fundamental roles in gene expression regulation in all known plants and animals. In particular, miRNAs are known to serve key functions in neurodevelopment, synaptic plasticity, and neuroprotection (Kosik and Krichevsky, 2005
; Cuellar et al., 2008
; Smalheiser and Lugli, 2009
). MiRNAs may have potentiated mammalian brain evolution by amplifying the complexity of nervous system gene expression regulation (Nelson and Keller, 2007
; Heimberg et al., 2008
). On the other hand, miRNAs also contribute to human illnesses, particularly in the pathogenesis of human neurodegenerative disease (Nelson et al., 2008b
; Hebert and De Strooper, 2009
). ISH shows important cerebral cortical lamina-specific patterns of miRNA expression that would be lost on most tissue-level expression studies (Mellios et al., 2008
; Nelson and Wilfred, 2009
), and these lamina-specific miRNA expression patterns could be relevant to AD (Wang et al., 2008
).
We chose to study four miRNAs that are expressed in human brain:
(1) miR-107, which we have shown may be relevant to AD pathogenesis and traumatic brain injury, and which may be involved in metabolic regulation (Wilfred et al., 2007
; Wang et al., 2008
; Redell et al., 2009
; Tang et al., 2009
).
(2) miR-124, which is highly enriched in neurons and plays many important roles in neuronal gene expression regulation (Smirnova et al., 2005
; Krichevsky et al., 2006
; Makeyev et al., 2007
; Tang et al., 2007
).
(3) miR-125b, which is expressed in many different cell types including the mammalian brain and which has been proposed to play a number of complex nervous system roles (Smirnova et al., 2005
; Lukiw and Pogue, 2007
; Ferretti et al., 2008
; Le et al., 2009a
,b
).
(4) miR-320, which is highly expressed in neurons and glial cells and which is dysregulated in prion disease (Nelson et al., 2007a
; Saba et al., 2008
).
Brain tissue was obtained from University of Kentucky ADC Brain bank using appropriate IRB protocols. Details of subject recruitment, autopsies, and other analyses using the University of Kentucky ADC autopsy series are described elsewhere (Nelson et al., 2007b
, 2008a
). Criteria for inclusion in this study included post-mortem intervals (PMIs) under 5 h. Brain sections from two individuals without antemortem cognitive decline were included (Cases 1 and 2), and a third person with early AD (Case 3). Demographic and pathological parameters of each of the three cases used for this study are shown in Table 1
.
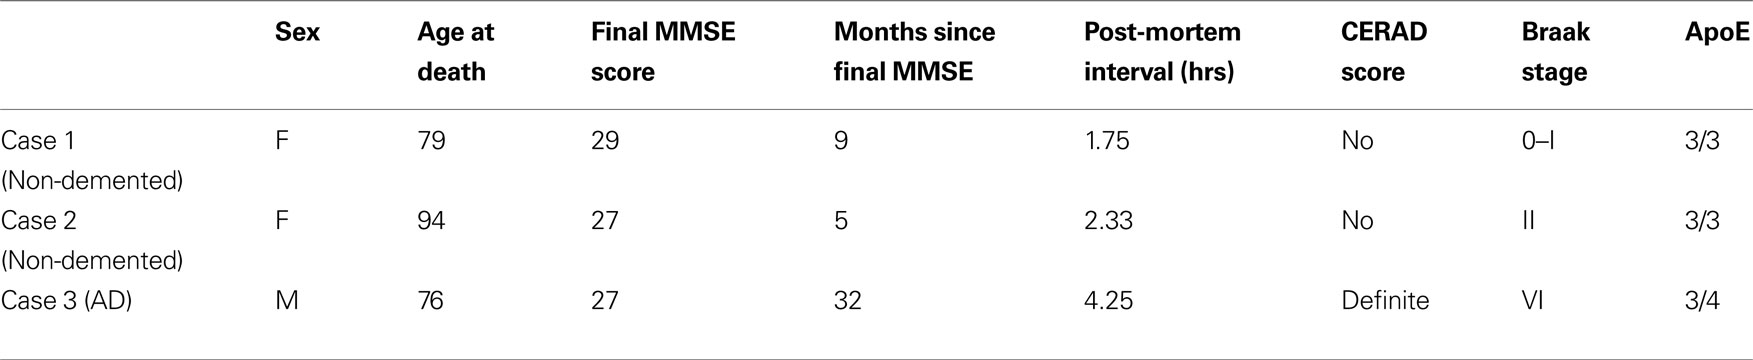
Table 1 Information about cases used in the current study including demographic, cognitive testing, post-mortem interval, Consortium to Establish A Registry for Alzheimer's Disease (CERAD) neuritic plaque, Braak neurofi brillary stages, and apolipoprotein E (ApoE) alleles.
Human brain ISH methods have been published (Nelson et al., 2006
; Wang et al., 2008
; Nelson and Wilfred, 2009
). Very briefly, post-mortem human brain sample was obtained via autopsy within 5 h of death. Tissue portions that included the EC were used. Brain tissues were fixed in 4% paraformaldehyde overnight at 4oC and then immersed in 20% sucrose (4oC) for an additional 24–48 h. Tissue was cut to 25 microns on a freezing microtome and mounted onto premarked Superfrost® Plus slides. Cut tissue sections were allowed to air-dry for 30 min. The slides were then transferred to a −80oC freezer, until subsequent processing as described. Digoxigenin-labeled locked nucleic acid probes (Exiqon, Woburn MA) were used and their presence visualized via anti-digoxigenin immunohistocyhemistry using protocols described in detail previously (Wang et al., 2008
; Nelson and Wilfred, 2009
).
Histological stains were performed on near-serial sections that were fixed, cut, mounted, and frozen along with the sections used for ISH. Thioflavine S (Polysciences, Inc., Warrington, Pennsylvania) was used as a 1% aqueous solution followed by differentiation in two changes of 80% ethanol. Nissl staining was accomplished using 0.1% Cresyl violet solution that was filtered immediately before use. After staining for 5 min, sections were differentiated in 95% ethanol and cleared in xylenes.
Sections of human TEC and EC were evaluated using miRNA ISH and several histological stains. Photomicrographs from each of the three cases are presented in Figures 1
–3
. These show ISH results for miR-107, miR-124, miR-125b, and miR-320 in the TEC and nearby structures in correlation to AD pathology (Thioflavine S stained NFTs and NPs).
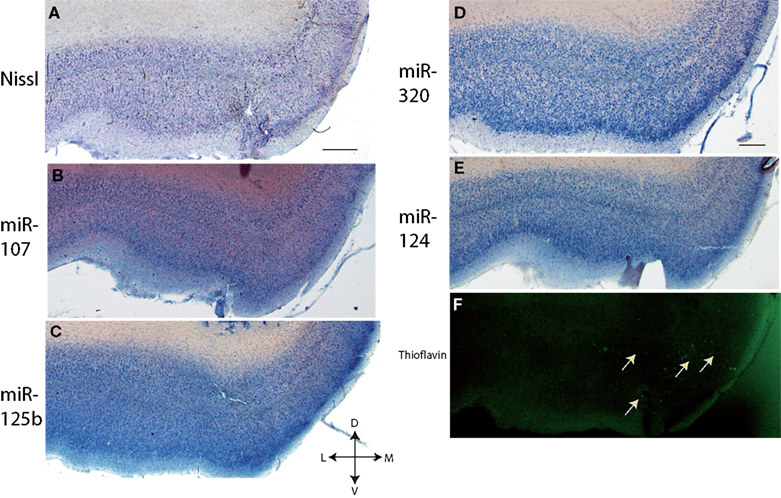
Figure 1. In situ hybridization, Nissl, and Thioflavine S stains for Case 1. (A) Nissl stain (B) miR-107 ISH (C) miR-125b ISH (D) miR-320 ISH (E) miR-124 ISH, and (F) Thioflavine S (amyloid plaques and neurofibrillary tangles are fluorescent.) In this case, there were no amyloid plaques and a few scattered neurofibrillary tangles, which are indicated with arrows in the transentorhinal cortex. Scale bar = 1000 microns. D = dorsal, M = medial, V = ventral, L = lateral.
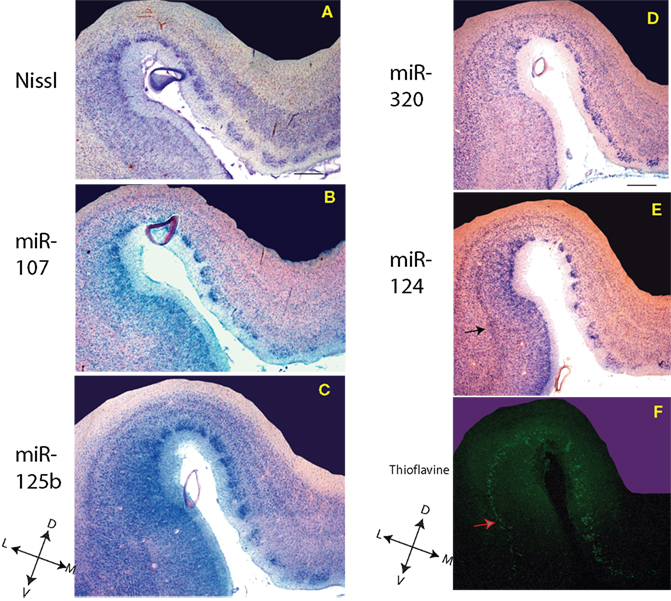
Figure 2. In situ hybridization, Nissl, and Thioflavine S stains for Case 2. (A) Nissl stain (B) miR-107 ISH (C) miR-125b ISH (D) miR-320 ISH (E) miR-124 ISH, and (F) Thioflavine S (amyloid plaques and neurofibrillary tangles are fluorescent.). TEC indicated with arrows. Scale bar = 1200 microns. D = dorsal, M = medial, V = ventral, L = lateral.
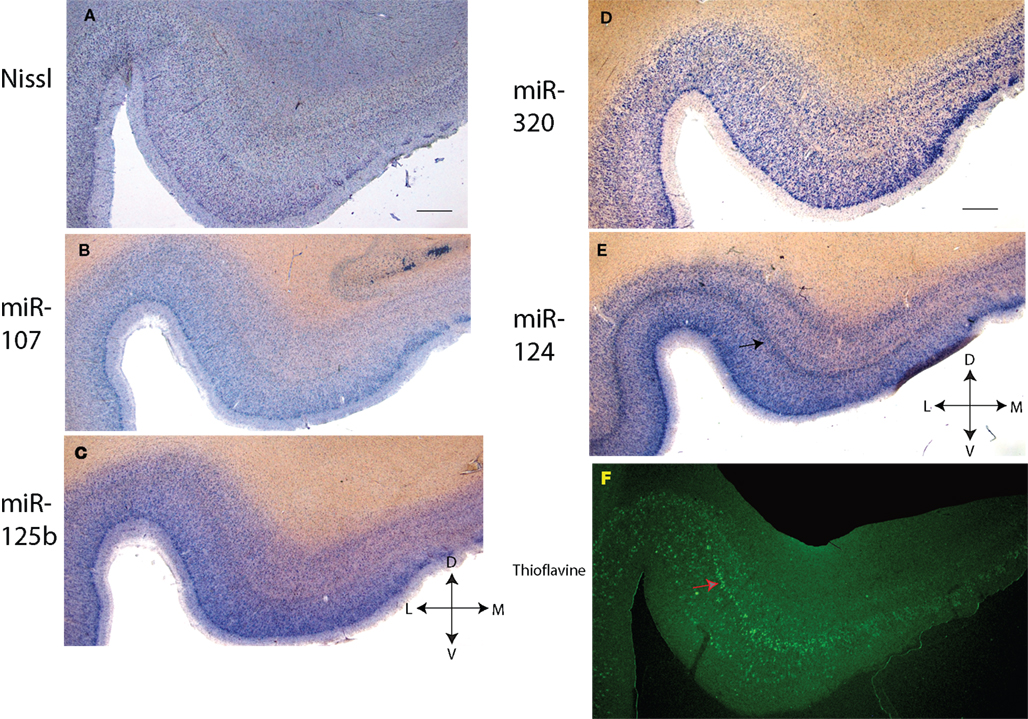
Figure 3. In situ hybridization, Nissl, and Thioflavine S stains for Case 3. (A) Nissl stain (B) miR-107 ISH (C) miR-125b ISH (D) miR-320 ISH (E) miR-124 ISH (band of stained cells indicated with black arrow), and (F) Thioflavine S (amyloid plaques and neurofibrillary tangles are fluorescent.). In this case there was extensive Alzheimer’s-type pathology with both amyloid plaques and neurofibrillary tangles. A band of neurofibrillary tangles, near the miR-124 positive cell band from the nearby section, is indicated with a pink arrow. Scale bar = 1200 microns. D = dorsal, M = medial, V = ventral, L = lateral.
Since miR-320 and miR-124 showed distinctive cortical laminar staining in the TEC, a separate panel (Figure 4
) shows the ISH results for near-serial section using miR-320 and miR-124 ISH and Thioflavine S from Case 3. Note that the Thioflavine S-stained NFT-bearing neurons are present in a band of cells that are relatively lacking in ISH stain for both miR-124 and miR-320. For both miR-124 and miR-320, there is an immediately more superficial band of cells that are labeled. As can be seen in Figures 1
–3
, the staining pattern in and near the TEC is relatively consistent with regard to this staining pattern of cells – the layer of miR-124 cells appears particularly characteristic. MiR-107 stains less strongly than the other probes. As expected, miR-125b, and to a lesser degree miR-107 and miR-320, appear to stain glial cells in addition to neurons. In some of the sections there was artifactual staining in the white matter that was trimmed out of the photomicrographs. To see what the staining in the white matter looks like, please see SupplementaryMaterial.
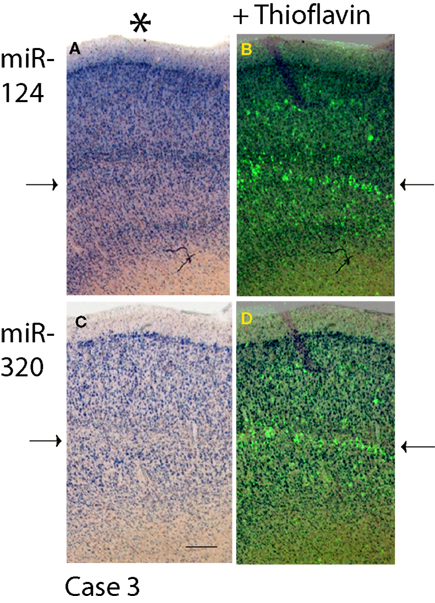
Figure 4. Comparison in staining patterns using ISH with miRNA probes and Thioflavine S on Case 3. Photomicrographs from sections stained with miR-124 (A) and miR-320 (C) were overlaid with near-serial sections stained with Thioflavine S (B and D). Note that for both miR-124 and miR-320, it is layers with a relative paucity of ISH stain (arrows on the left) that are most intensely stained with the Thioflavine S (arrows on the right). Pial surface is indicated in A with an asterisk. Scale bar = 300 microns.
Figure 5
provides a more comprehensive picture of the EC and the nearby subiculum. ISH shows results using probes for miR-320, miR-124, and miR-125b in Case 1. Note that the layer II (“pre-α”) EC “islands” are relatively strongly labeled for miR-124, whereas the the superficial portions of the pre-, para-, and pro-subiculum are somewhat more strongly labeled for miR-125b. This pattern was also seen in other cases (data not shown).
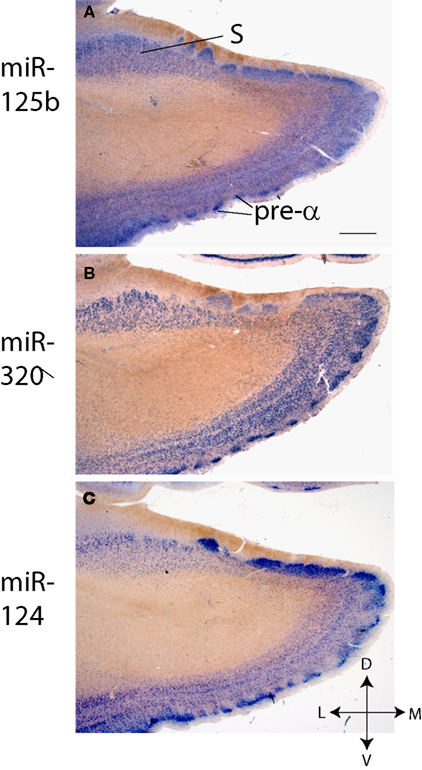
Figure 5. In situ hybridization of entorhinal cortex (layer pre-α is noted) and pre-, para- and pro-subiculum (S) using probes against miRNAs (A) miR-125b (B) miR-320, and (C) miR-124. All stains were performed on Case 1. Scale bar = 1500 microns.
ISH using a set of probes against brain-enriched miRNAs was used to assess cellular miRNA expression in the human TEC and surrounding structures. These data have both technical and theoretical implications. From a technical standpoint, the present study further underscores the importance of ISH as a technique to complement tissue-level miRNA expression profiling. The pattern of miRNA expression also helps to refine the expectations for miRNA functions in the brain, in both normal and disease conditions. The pattern of ISH labeling in the human cerebral cortex affirms that defining individual miRNAs as “neuronal” or “non-neuronal” is overly simplistic, because different populations of neurons – even within a tiny cell layer – can have distinct miRNA expression profiles.
There are some limitations to the current study. ISH is a relatively low-throughput technique and thus we only were able to thoroughly evaluate the results using a handful of miRNA probes, and brain sections from only three individuals’ brains (all of these patients were elderly Caucasians). Although the results were consistent among the cases evaluated, it is possible that study of a larger population would result in greater variability or even completely disparate results. Also, it has been shown that post-mortem degradation of miRNAs in the human brain can be rapid and can affect different miRNAs at different rates (Sethi and Lukiw, 2009
). In the current study we used brains that had relatively short PMIs (less than 5 h). However, using cases with even shorter PMIs may have revealed a different staining pattern. Finally, the technique that we used employs both ISH and immunohistochemistry (anti-digoxigenin antibody is used to detect the digoxigenin-labeled RNA probe). Like the great majority of histochemical staining methods, ISH is not a rigorously quantitative technique for evaluating gene expression. This is because of the many variables in tissue processing that are impossible to control between cases and even between different sections of the same case. As such it is more appropriate to evaluate critically the staining pattern, rather than the more detailed characteristics of staining intensity in any given section. We also are dissatisfied with employing near-serial sections to define correlative staining patterns. Hence we are investigating the use of double-label methods to enable, in the future, more definite determination of human brain miRNA co-expression patterns.
Despite the limitations inherent to this type of study, the ISH technique reveal consistent staining patterns in the human cerebral cortex. The TEC itself is a small (<1 cm) but highly intriguing cortical subfield, being most developed in the human relative even to other primate species (Braak et al., 2000
; Taylor and Probst, 2008
). Perhaps most interesting is the cell population that seems to “dive” from the superficial layer II neurons of the EC, through the entire depth of layer III in the TEC, to approximate layer V neurons in the “temporal proneocortex” (Braak and Braak, 1985
, 1992
). These are apparently the neurons most vulnerable to NFT development in the human cerebral cortex. These particular neurons show an apparent lack of high amounts of both miR-124 and of miR-320. The impact of these expression patterns are currently not understood. They may relate in some way with the remarkable dendritic plasticity shown by TEC and EC neurons (Arendt et al., 1998
). However, neurons in the nearby pre-α (layer II) of the EC proper, which is also affected relatively early in AD, express high amounts of both miR-320 and miR-124. There are of course many other miRNAs with expression patterns overlaid on those of miR-107, miR-125b, miR-124, and miR-320. For all of these, the lamina-specific expression characteristics would not be possible to evaluate using most tissue-level expression profiling platforms.
In conclusion, we have demonstrated novel miRNA expression patterns in the human TEC and EC. Neurodegenerative diseases tend to affect these cell populations for reasons that currently are poorly understood. MiRNAs are important components of a neuron’s gene expression repertoire. Each neuronal subpopulation may express a distinct fraction of the uniquely-human miRNome. Thus, future directions for study of miRNAs should include more human brain ISH. With the help of these “descriptive” studies we can better understand the relevant mechanisms of miRNAs in health and in disease states.
The authors declare that the research was conducted in the absence of any commercial or financial relationships that could be construed as a potential conflict of interest.
We are deeply grateful to patients at the University of Kentucky Alzheimer’s Disease Center longitudinal study. We thank Dr Wang-Xia Wang, Mrs Willa Huang, Mrs Ela Patel, and Mr Kevin Xie for assistance in the project. This study was supported by grants R01 NS061933, K08 NS050110, and P01-NS051220 from NIH, Bethesda, MD, and NIRG-08-89917 from the Alzheimer’s Association.
The Supplementary Material for this article can be found online at http://www.frontiersin.org/humanneuroscience/paper/10.3389/neuro.09/007.2010/
Nelson, P. T., Abner, E. L., Schmitt, F. A., Kryscio, R. J., Jicha, G. A., Smith, C. D., Davis, D. G., Poduska, J. W., Patel, E., Mendiondo, M. S., and Markesbery, W. R. (2008a). Modeling the Association between 43 Different Clinical and Pathological Variables and the Severity of Cognitive Impairment in a Large Autopsy Cohort of Elderly Persons. Brain Pathol. [Epub ahead of print].
Nelson, P. T., Abner, E. L., Schmitt, F. A., Kryscio, R. J., Jicha, G. A., Santacruz, K., Smith, C. D., Patel, E., and Markesbery, W. R. (2009a). Brains with medial temporal lobe neurofibrillary tangles but no neuritic amyloid plaques are a diagnostic dilemma but may have pathogenetic aspects distinct from Alzheimer disease. J. Neuropathol. Exp. Neurol. 68, 774–784.
Nelson, P. T., Jicha, G. A., Schmitt, F. A., Liu, H., Davis, D. G., Mendiondo, M. S., Abner, E. L., and Markesbery, W. R. (2007b). Clinicopathologic correlations in a large Alzheimer disease center autopsy cohort: neuritic plaques and neurofibrillary tangles “do count” when staging disease severity. J. Neuropathol. Exp. Neurol. 66, 1136–1146.
Wang, W. X., Rajeev, B. W., Stromberg, A. J., Ren, N., Tang, G., Huang, Q., Rigoutsos, I., and Nelson, P. T. (2008). The expression of microRNA miR-107 decreases early in Alzheimer’s disease and may accelerate disease progression through regulation of beta-site amyloid precursor protein-cleaving enzyme 1. J. Neurosci. 28, 1213–1223.