1
I.T.A.B. Institute for Advanced Biomedical Technologies, “G. d’Annunzio” University Foundation, Chieti, Italy
2
Department of Clinical Sciences and Bioimages, “G. d’Annunzio” University, Chieti, Italy
3
Department of Neurology, Washington University School of Medicine, St. Louis, MO, USA
We used magneto-encephalography (MEG) to measure visually evoked activity in healthy volunteers performing saccadic eye movements to visual targets. The neuromagnetic activity was analyzed from regions of cortical activation identified in separate functional magnetic resonance imaging (fMRI) studies. The latency of visual responses significantly increased from the Middle Temporal region (MT+) to the Intraparietal Sulcus (IPS) to the Frontal Eye Field (FEF), and their amplitude was greater in the hemisphere contralateral to the visual target. Trial-to-trial variability of oculomotor reaction times correlated with visual response latency across cortical areas. These results support a feedforward recruitment of oculomotor cortical centers by visual information, and a model in which behavioral variability depends on variability at different neural stages of processing.
A simple visually guided saccadic eye movement requires at least two mental processes: target selection and motor preparation. These processes are carried out by a network of cortical and subcortical structures (Krauzlis, 2005
; Milea et al., 2005
; Munoz, 2002
) and exhibit temporal variability, as measured by trial-to-trial variations in Saccadic Reaction Time (SRT) (Carpenter, 2004
; Hanes and Schall, 1996
). In the monkey’s frontal eye field (FEF), classic neurophysiological studies demonstrated that SRT variability is largely accounted for by the time necessary for visuo-motor and motor neurons to reach a specific threshold, whereas variability in visual response contribute to a lesser degree (Schall and Thompson, 1999
; Thompson et al., 1996
, 1997
). However, more recent studies have suggested that sensory stages of processing also contribute to the final response time especially when the discrimination of the visual target is difficult (Sato et al., 2001
) or it takes multiple saccadic eye movements to detect a target as during visual search (Ipata et al., 2006
). The neural bases of SRT variability in humans are unknown.
The goal of the present study was to characterize the latency of visual activity across different regions of the human oculomotor system, and relate temporal variability of neural responses to SRT variability. If SRT variability depends on variability of sensory processes, then a relationship may be found with responses that are time-locked to target onset, especially in occipital areas. On the other hand, if SRT variability is predominantly related to the sensory-motor transformation or motor processes, then the latency of visual responses should not vary as function of SRT, and any positive relationship with SRT may be found at later stages of processing in parietal or frontal regions or relatively late after stimulus presentation.
Prior human electrophysiological studies, measuring either evoked-related scalp potentials (ERPs) or neuromagnetic (MEG) responses, have described characteristic visual and pre-saccadic activity during oculomotor tasks. The presentation of the visual target evokes stimulus-locked potentials around 100–200 ms after stimulus onset (Clementz et al., 2001
; Evdokimidis et al., 1992
; McDowell et al., 2005
). When the EEG recordings are time-locked to the eye movement, different potentials are described depending on the particular experimental conditions. In a visually guided paradigm, Clementz et al. (2001)
highlighted a critical period to discriminate between pro- and anti-saccades within 160–60 ms before movement onset. Richards (2003)
observed a positive potential in the frontal scalp area peaking at about 75 ms before saccade onset, predominantly contralateral to saccade onset. This potential precedes sharp positive spike potential over parietal scalp leads about 10–20 ms prior to saccade onset (Becker et al., 1973
; Kurtzberg and Vaughan, 1982
; Richards, 2003
).
Here, we combined the relatively high spatial resolution of functional magnetic resonance imaging (fMRI) with the high temporal resolution of magneto-encephalography (MEG) to describe the spatial-temporal pattern of activation during a visually guided oculomotor paradigm. We focused on three regions consistently activated in previous saccadic eye movement studies (Astafiev et al., 2003
; Beauchamp et al., 2001
; Berman et al., 1999
; Corbetta et al., 1998
; Darby et al., 1996
): the Frontal Eye Field (FEF), the Parietal Eye Field in the Intraparietal Sulcus (IPS), and the human Middle Temporal complex (MT+). These regions are putatively homologues of macaque regions FEF and LIP, which play a major role in sensory-motor transformation for directing eye movements, while the human MT complex includes the homologue of the monkey’s MT and is frequently activated by the onset of visual stimuli that are targets of eye movements or shifts of attention (Corbetta et al., 1998
; Krauzlis, 2005
; Munoz, 2002
). We used fMRI to identify individual MT+, IPS, and FEF foci of activation, and we used this information to solve the inverse problem for MEG sources in a multiple current dipole model. To measure the latency of visual responses and relate them to SRTs, the time courses of the neuromagnetic responses were time-locked to the onset of the visual target.
Study Participants
Six normal right-handed subjects (4 women; age range 20–31 years, mean 27.5, with normal visual acuity) participated in the study after providing informed consent to procedures approved by the local Ethics Committee. fMRI and MEG recordings were performed on different days in a counterbalanced order across subjects.
Experimental Protocol
fMRI. Stimuli were generated with a PC running Matlab 6.1 software (Mathworks, Natick, MA). They were projected on a screen located behind the scanner bed using an LCD projector (NEC MT830G+) and viewed through a mirror placed above the subject’s head. The experiment was run as a block design that included 7 task periods (each 30 second long) alternating with 8 rest periods (each 30 seconds long) in a single functional run. During the task period, subjects were instructed to quickly move their eyes to follow a white square stimulus presented on a black background. The stimulus was pseudo-randomly presented at a rate of 2 Hz in 5 possible locations along the horizontal axis (–12°, –6°, 0, +6°, +12° visual angles) with the constraint that each movement was 6° of visual angle. During the rest periods, subjects were asked to fixate on a white-cross in the middle of the screen. This task was used to localize the main cortical regions involved in the generation of saccadic eye movements in each subject, separately from the MEG recordings.
MEG. Stimuli were presented on a plexiglass screen positioned in front of the subject through a PC running Matlab 6.1 software and an LCD projector (NEC LT140G). At the beginning of each trial subjects were presented with a central light blue fixation cross and two grey square peripheral stimuli located at ±6° of eccentricity in left and right visual fields on the horizontal meridian. After a random interval (1.5–2 seconds) the fixation cross turned off and simultaneously either the left or the right peripheral stimulus changed color (from grey to red) for 100 ms. Subjects were instructed to quickly move their eyes from the fixation point to the peripheral stimulus and fixate on it. The precise onset of the change in color on the screen was measured with a photocell. One second after the color change of the peripheral stimulus, a default PC beep sound (800 ms duration, ~70 dB intensity) was presented binaurally simultaneously with the re-appearance of the fixation cross, which instructed subjects to move their eyes back to the center. The inter-stimulus interval measured from one color change to the next varied from 3.5 to 4 seconds. Figure 1
A shows the trial structure of the MEG experiment.
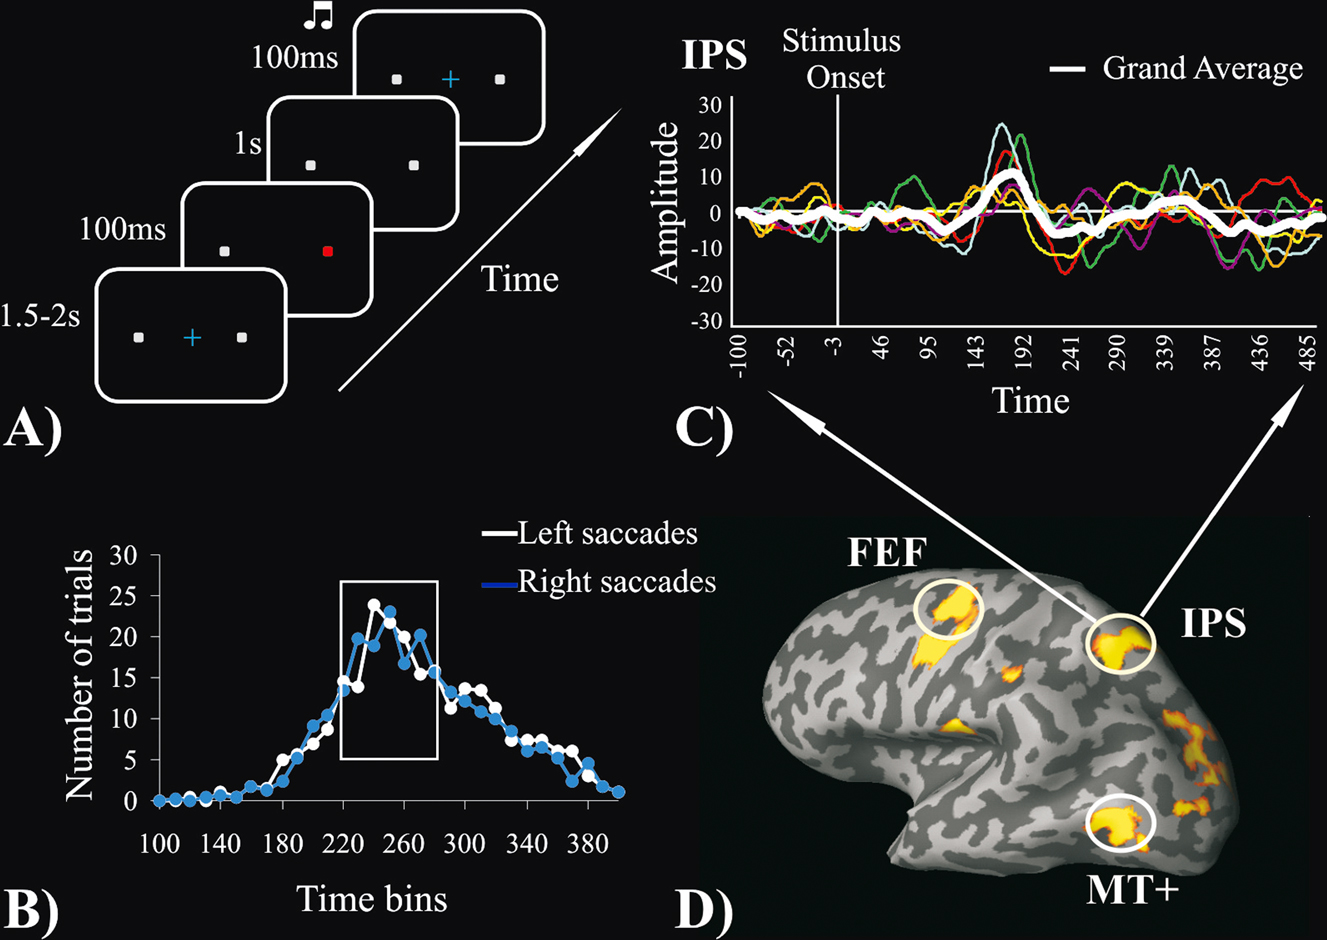
Figure 1. (A) MEG experimental paradigm. (B) Group-average frequency distribution of trials by SRT; white line = leftward saccades; blue line = rightward saccades. The white rectangle indicates the time interval selected for the single interval analysis in 4 out 6 subjects. (C) An example of the MEG source waveforms obtained by fMRI-constrained dipoles corresponding to the left IPS. Colored lines represent different subjects and the white line represents the grand average. (D) The fMRI group map, obtained by contrasting saccadic task periods with rest periods, is superimposed on the inflated cortex of one participant. White circles indicate the three ROIs for the left hemisphere.
The MEG paradigm differed from the fMRI paradigm. In the fMRI session, a blocked design was used to maximize signal-to-noise and identify the oculomotor regions of interest (ROIs) in each subject. The fMRI data were entirely independent from the MEG data and were used as a ‘localizer’ of the regions of interest. In the MEG session, we wanted to clearly separate each trial in order to analyze behavioral performance. Previous studies show that event-related and blocked designs produce similar patterns of activation during eye movement tasks (Astafiev et al., 2003
; Beauchamp et al., 2001
; Connolly et al., 2002
; Corbetta et al., 1998
; Medendorp et al., 2003
; Petit and Haxby, 1999
). Moreover, in the MEG studies we used only two target locations to increase the number of trials that could be averaged together. Finally, the target was indicated by a change in the color of the peripheral stimulus to avoid strong visual transients. None of these differences influence the results or the conclusions that we draw.
Data Acquisition
fMRI. Data were acquired with a Siemens Magnetom Vision 1.5 T scanner and a T2*-weighted echo planar imaging (EPI) free induction decay (FID) sequence with the following parameters: TR 3202 ms, matrix size 64 × 64, FoV 256 mm, in-plane voxel size 4 mm × 4mm, flip angle 90°, slice thickness 4 mm and no gap. A total of 155 functional volumes were acquired, consisting of 24 trans-axial slices, including the ROIs. A high resolution structural volume was acquired at the end of the session via a 3D MPRAGE sequence with the following parameters: axial, matrix 256 × 256, FoV 256 mm, slice thickness 1 mm, no gap, in-plane voxel size 1 mm × 1 mm, flip angle 12°, TR = 9.7 ms, TE = 4 ms.
MEG. Data were continuously recorded using a 165 channel MEG whole head system (Pizzella et al., 2001
) located inside a magnetically shielded room. MEG data were sampled at 1025 Hz with a bandpass filter of 0.16–250 Hz. Head position was assessed at the beginning of the session by recording the magnetic field generated by four coils placed on the scalp. Before the experimental session, fiducial point locations and head shape were digitized (Polhemus Inc, Colchester, Vermont, USA) in order to co-register the fMRI data to the MEG reference frame. Eye movements were recorded using a horizontal electro-oculogram. An electrocardiogram was also recorded for the rejection of heart artifacts. The MEG session lasted about 40 minutes during which subjects performed 600 trials of the saccadic task (300 leftward, 300 rightward, randomly presented). Each task block of 4 minutes was separated by a rest block of 30 seconds.
Data Analysis
fMRI. Pre-processing and statistical analysis of fMRI data were performed using Brain Voyager 4.9 software (Brain Innovation, The Netherlands). The first 4 scans of each run were discarded from the analysis. Pre-processing included motion and slice scan time corrections and the removal of linear trends from the time series. For the purpose of the fMRI-guided MEG source analysis, we performed a single subject analysis. Functional 2-D images were co-registered with the 3-D high-resolution structural images. Functional volumes were resampled at a voxel size of 3 × 3 × 3 mm. Statistical analysis was performed using a general linear model (GLM, Friston et al., 1995
) by convolving the BOLD time series with a standard hemodynamic response function corrected for the duration of the task block. A Statistical Parametric Map was created, and thresholded at p < 0.05 (Bonferroni corrected for multiple comparisons) for each subject. An fMRI group analysis was also performed (fixed effect) and a Statistical Parametric Map for the group data was created, thresholded at p < 0.001 (Bonferroni corrected) and projected onto a T1-weighted anatomical image of one of the subjects. Figure 1
D shows the fMRI group activation map superimposed on the left inflated hemisphere of subject 1. In each subject, we identified the coordinates of the peaks of BOLD signal increase corresponding to six ROIs: frontal eye field (FEF), parietal eye fields in the Intraparietal Sulcus (IPS) and MT+, in the left and right hemisphere respectively.
MEG. SRTs were defined as the time intercurring between the visual stimulus onset (recorded through a photocell) and the onset of the electro-oculogram signal indicating the start of the eye movement. The onset of the electro-oculogram was identified as the moment when the signal reached 10% of the maximal amplitude change due to the saccadic movement. Since the average saccadic latency is typically at least 150 ms (Rayner, 1998
), trials with saccadic latencies shorter than 100 ms were considered ‘anticipations’ and rejected, as observed in similar MEG studies (Herdman and Ryan, 2007
; McDowell et al., 2005
). A few trials with saccadic latencies greater than 400 ms were considered ‘delayed’ and were also disregarded (Klein et al., 2000
; Neggers et al., 2005
). Although one of the goals of the study was to related neuromagnetic responses to variability of SRT, we were not interested in including variability due to distraction or other spurious factors. Data were also scanned for artifact rejection and averaged with in-house software.
Figure 1
B illustrates the frequency distribution of number of trials by SRT, averaged across subjects, respectively for leftward (white line) and rightward (blue line) saccades. Since SRT variability was high and MEG signals at the single trial level were noisy, a straight temporal average would not insure a good estimate of the mean response. Two different approaches to improve temporal averaging were used. First, the shortest time interval (single SRT interval analysis) that contained more than 50% of all trials SRT was identified. This approach allowed us to average a large number of trials with relatively low SRT variability. For all subjects a 60 ms time interval met this criterion. In four subjects the interval was between 220 and 280 ms; in subject 5 the interval was between 200 and 260 ms, and in subjects 6 it was between 240 and 300 ms. Therefore, single subject mean estimates of the signal time course were obtained by averaging trials within this chosen 60 ms interval. Second, in order to study the variability of MEG signals as a function of SRT variability each participant’s trials were divided into quartiles (SRT quartile analysis), and the signal time courses of all trials within each quartile were then averaged. To improve signal-to-noise, time courses for left and right saccades were averaged over each quartiles since no visual field difference was detected in the single interval analysis. However, we preserved the information concerning the direction of the saccade with respect to hemisphere, i.e., contralateral vs. ipsilateral to the hemisphere, to study the lateralization of these signals.
The MEG source analysis was performed using BESA 5.1.4 software (MEGIS Software GmbH, Gräfelfing, Germany). We performed a forward average of MEG signals, aligning the trials to the visual stimulus onset in order to focus on visually evoked activity. The 100 ms prior to the visual stimulus onset were considered the baseline, and the averaging time window was set up to 500 ms after visual stimulus onset. The MEG data were digitally bandpass filtered from 1–50 Hz in the forward direction to avoid distortion of saccade-related motor activity. The post-saccadic artifact was removed using a principle component analysis. A single principal component (usually explaining approx. ninety percent of variance during the artifact period) was obtained, time-locking the trials on the movement onset and considering the post-saccadic 0–50 ms an artifact period. The component was then applied to the forward analysis in order to reduce the movement artifact even if it was not directly visible.
fMRI-Guided Source Analysis of MEG Data
The spatiotemporal distribution of the activity underlying the measured MEG signals was modeled in terms of multiple equivalent current dipoles (ECD) (Scherg, 1990
). The electrical conductivity distribution of the head was assumed spherically symmetric. We performed an fMRI-constrained dipole analysis guided by the BOLD peaks of activation in the ROIs for both the single interval and the quartile analysis. This strategy provided a basis for comparison and averaging of source waveforms across subjects. For each subject, an individual model was derived with six dipoles located at the ROIs identified by fMRI; the dipole orientation was allowed to change to fit measured MEG data. For each subject, measures of peak amplitude and latency of the source waveforms in each region were obtained in two steps. First, the peak of the averaged waveform was identified across subjects. Subsequently, we defined the individual peaks as the maximum amplitude of the waveform within a 100 ms interval centered on the peak of the averaged waveform. For the SRT single time interval analysis two within-3-way ANOVAs, with Hemisphere (left, right), Saccade Direction (contralateral, ipsilateral) and Region (FEF, IPS, MT+) as factors, were performed on the measures of peak latency and amplitude. For the SRT quartile analysis, we carried out two within-3-way ANOVAs with Quartile (Q1–Q4), Saccade Direction (contralateral, ipsilateral) and Region (FEF, IPS, MT+) as factors, on the measures of peak latency and amplitude.
Behavioral Results
SRTs were measured during the MEG recordings. Subjects performed a total of 2931 trials (mean SRT = 265 ms) within the specified SRT limits (100–400 ms after visual cue). The percentage of accepted trials was on average 81% (range 71–89%), reflecting predominantly the exclusion of artifact epochs. At the group level, there was no significant SRT difference between leftward (1480 trials, mean RT = 266 ms) and rightward (1451 trials, mean RT = 263 ms) saccades. A single subject analysis did reveal a significant difference between left and right trials for subject 3 and 6 (p < 0.05), with rightward saccades being faster than leftward saccades. A one-way ANOVA testing for difference among subjects showed a significant effect (F = 97.97; p < 0.001). Post-hoc contrasts (Bonferroni test) found that subjects 1 and 6 had significantly slower and subject 5 had significantly faster SRTs than the other subjects.
fMRI Results
We performed a group analysis to estimate the averaged response across subjects. Figure 1
D shows significant activations superimposed on the left hemisphere of one of the participants (fixed effect, p < 0.001, Bonferroni corrected for multiple comparisons). Consistent with previous studies of saccadic eye movements (Beauchamp et al., 2001
; Berman et al., 1999
; Corbetta et al., 1998
) activation was observed at the intersection of Superior Frontal Sulcus and Precentral Sulcus, along the Precentral Sulcus, the Intraparietal Sulcus, the posterior part of the Middle Temporal Gyrus, and the visual cortex located on the Superior Occipital Gyrus. Additional activated regions were found in the Temporo-Parietal Junction and on the Inferior Parietal Lobule, bilaterally. On the medial surface of the brain, activated regions were found along the primary and secondary visual areas and in the Supplementary Motor Cortex (corresponding to the Supplementary Eye Fields). The regions of activation on the Precentral Sulcus (PreCS) and the Intraparietal Sulcus (IPS) correspond, respectively, to the Frontal Eye Fields (FEF) and the Parietal Eye Field. The foci of activity on the middle temporal gyrus correspond to the human MT complex. A single subject analysis was also performed to localize these three functional regions for the MEG analysis. Robust activations were observed bilaterally for all subjects in the three ROIs (FEF, IPS, MT+); Table 1
provides their atlas coordinates (Talairach and Tournoux, 1988
) and cluster size.
These regions were selected for several reasons: they are among the most consistently reported in studies of eye movements; they are among the most strongly activated in this study; they are localized on the lateral surface, which is the most accessible to MEG recordings; finally, they are far apart from each other so that their neuromagnetic components are easier to separate.
MEG Results
Single SRT interval. The single interval analysis was run to determine the latency and amplitude of responses time-locked to the visual stimulus using a fairly homogenous set of trials with similar SRTs (see Materials and methods section). An example of single subject and mean source waveforms from the fMRI guided source placed on the left IPS is shown in Figure 1
C. Figure 2
A shows the grand averages of MEG signals aligned to the visual stimulus onset for contralateral and ipsilateral targets from the ROIs of the left and the right hemisphere.
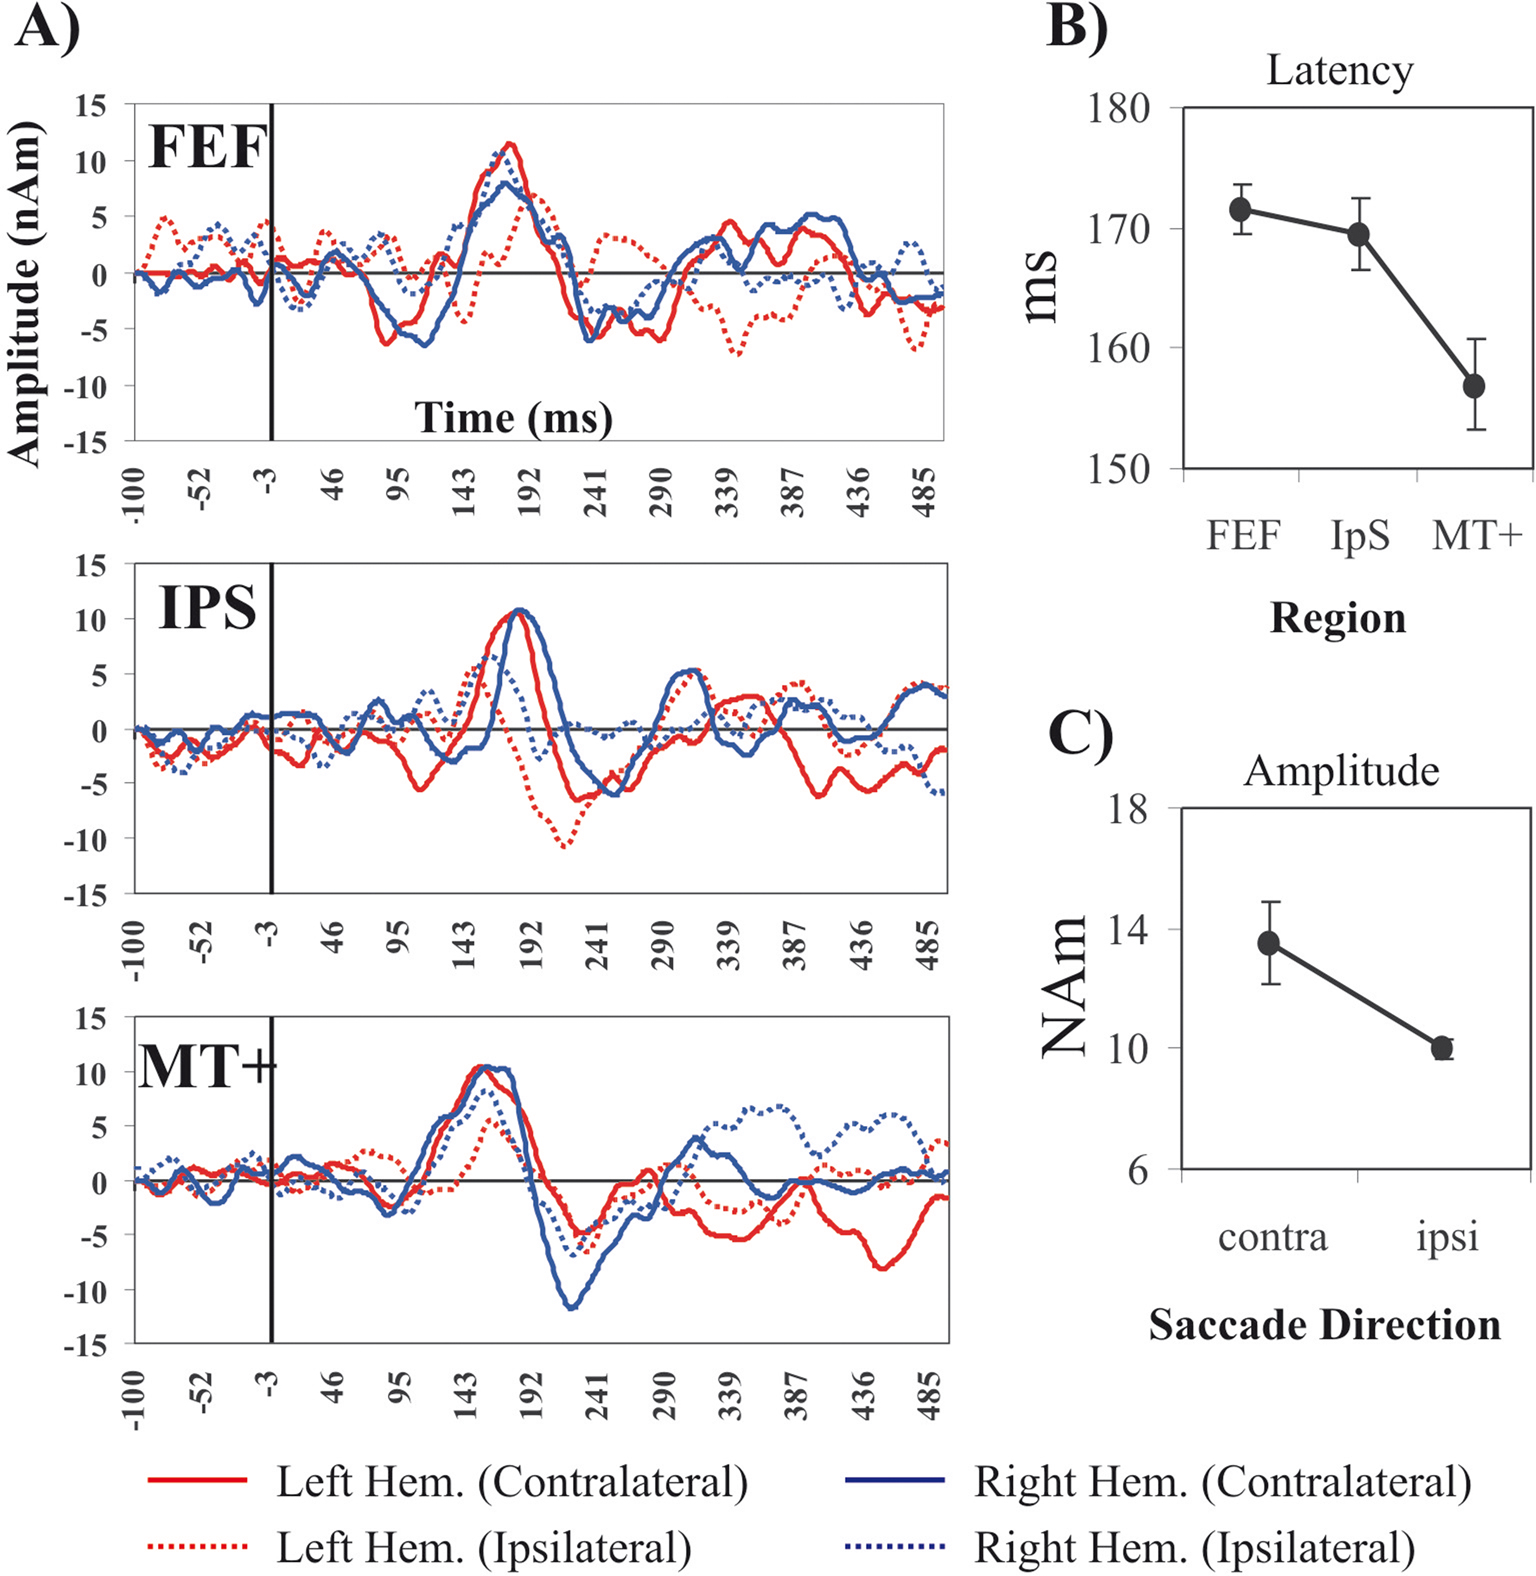
Figure 2. Single SRT interval Analysis of MEG waveforms. (A) Forward grand averages of MEG source waveforms from the three ROIs (FEF, IPS, MT+). Red and blue lines represent respectively time courses for left and right hemisphere ROIs. Continuous and dashed lines indicate contralateral and ipsilateral target/saccade direction. The black vertical line indicates the visual stimulus onset. (B) ANOVA for single interval analysis: latency and main effect of ROIs (MT+, IPS, FEF). Vertical bars indicate standard errors of the mean (s.e.m). (C) Amplitude and main effect of Hemisphere (Contralateral, Ipsilateral).
The peak of activity in MT+ (mean ± s.e.m. = 157 ± 2 ms) preceded the peak in FEF (mean ± s.e.m. = 171 ± 3 ms) and IPS (mean ± s.e.m. = 170 ± 4 ms); contralateral regions (mean ± s.e.m. = 13.5 ± 1.4 nAm) showed stronger activations than ipsilateral ones (mean ± s.e.m. = 10 ± 0.3 nAm). This qualitative impression was quantitatively confirmed by a random-effect within-3-way ANOVA (Hemisphere × Saccade Direction × Region) performed on the measure of peak latency. We found a significant effect of Region (F (2,10) = 9.6; p < 0.005); planned comparisons show that MT+ peaked significantly earlier than FEF (F (1,5) = 11.7, p < 0.05) and IPS (F (1,5) = 35, p < 0.01) (Figure 2
B), while no significant difference was observed between IPS and FEF regions. The analysis of source amplitude revealed only a significant effect of Saccade Direction (F (1,5) = 6.7; p < 0.05) with contralateral regions being more strongly activated than ipsilateral ones (Figure 2
C).
SRT quartiles analysis. The single interval analysis showed an effect of response latency across regions. The next analysis considers how these regional differences in peak latency are related to SRT variability. Figure 3
B shows the forward grand averages of MEG signals from the ROIs plotted in different colors for SRT quartiles. For display contra- and ipsilateral signals were collapsed. Since the previous analysis did not show any significant hemispheric difference, the source waveforms of left and right hemispheres were averaged, but information about saccade direction with respect to region was maintained.
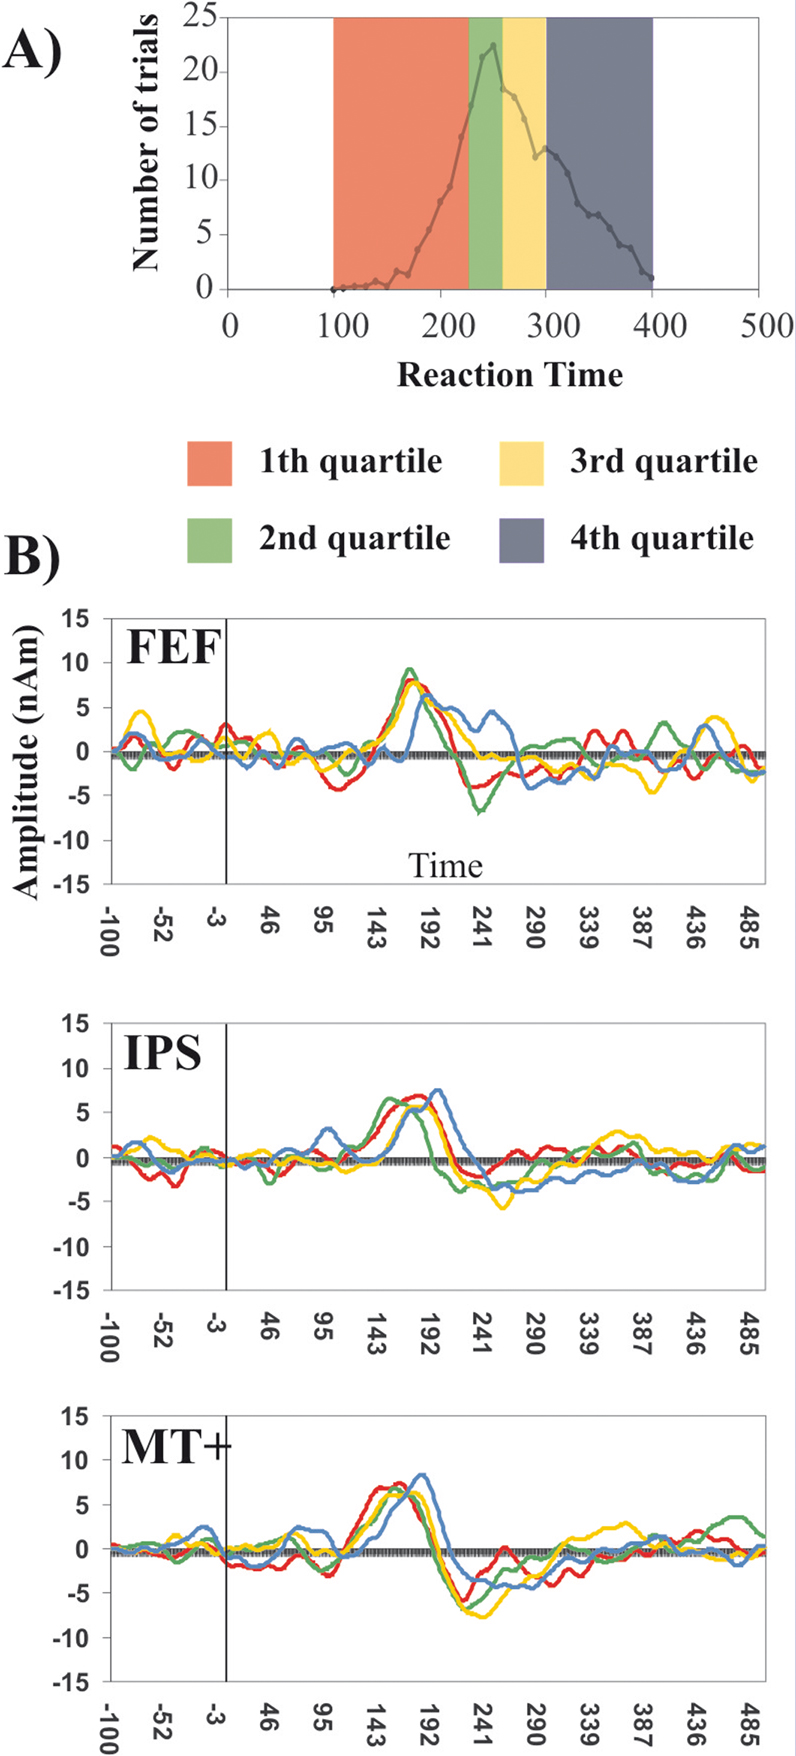
Figure 3. SRT Quartiles Analysis of MEG waveforms. (A) Frequency distribution of trials by SRTs. The different colors show the division of trials by quartiles. (B) Forward grand averages of MEG source waveforms from the three regions of interest: FEF (top row), IPS (central row) and MT+ (bottom row) representing each quartile, collapsed across ipsi and contralateral regions. The black vertical line represents the visual stimulus onset.
With the exception of the first quartile, mean source waveforms for different quartiles appear to be shifted to the right following the order of quartiles; this effect is most evident in the MT+ source waveforms. Two random-effect within-3-way ANOVAs (Quartile × Saccade Direction × Region) were performed respectively on the individual measurements of peak latency and amplitude. The analysis of latency revealed a main effect of Quartile (F (3,15) = 15.65, p < 0.001) and a main effect of Region (F (2,10) = 8.85; p < 0.01) but no interaction effect between these two factors. Also in this case, as for the single SRT interval analysis, planned comparison showed that MT+ peaked significantly earlier than FEF (F (1,5) = 19.1, p < 0.01). This analysis confirms the latency results obtained in the single interval analysis by using all available trials. IPS latency was not significantly different than MT+ or FEF. The effect of quartile indicates that latency increased as SRTs increased; planned comparisons revealed that the fourth quartile was different from the third (F (1,5) = 11.4, p < 0.05), the second (F (1,5) = 52.4, p < 0.001) and the first quartile (F (1,5) = 28.6, p < 0.01). The other significant difference was between the second and the third quartile (F (1,5) = 6.6, p < 0.05).
Next, we calculated the nonparametric rank Spearman correlation coefficient between the signal peak latency and SRT quartiles for each region, in order to identify which region showed the highest correlation between neural and behavioral latency. The repeated measurements used for the correlations were 6 subjects by 4 quartiles by 2 direction (contra-ipsi) resulting in a total of 48 observations for each region. MT+ had the highest correlation coefficient (R = 0.43; p < 0.01), followed by FEF (R = 0.38; p < 0.01). No significant correlation was found in IPS.
Finally, the analysis of peak source amplitude showed only a significant effect of Saccade Direction (F (1,5) = 22.42; p < 0.005), confirming the greater activation of contralateral regions observed in the single SRT interval analysis.
Figure 4
summarizes the results obtained in the quartiles. In all areas there is an increase in response latencies as function of SRT quartiles. However, there appears to be a large difference between mean behavioral variability and mean neural variability. For example, the difference in SRT between first and fourth quartile is about 130 ms, whereas the corresponding latency difference is ~20 ms for FEF and IPS, and ~30 ms for MT+. Therefore, a great deal of behavioral variability must be accounted for by later decision and motor processes.
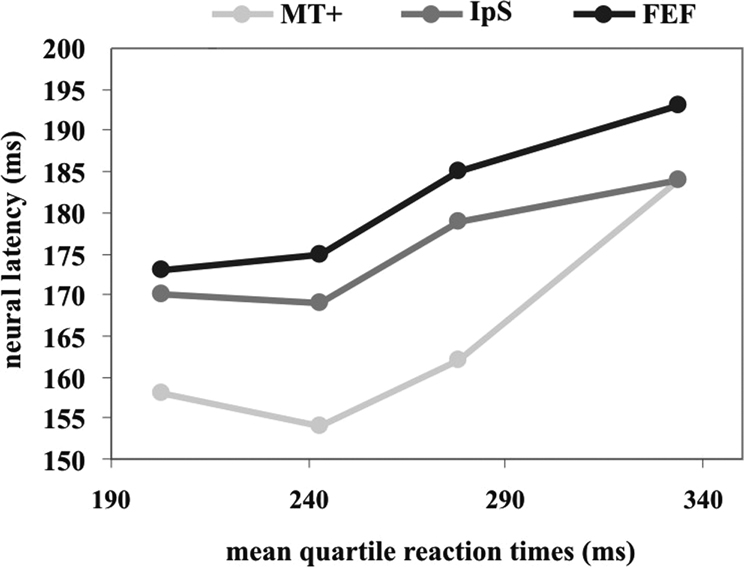
Figure 4. Mean neural latency and SRT quartiles. The x axis represents the mean quartile SRT. The y axis represents the peaks of visual response for MT+ (light grey), IPS (dark grey) and FEF (black) regions, respectively.
This combined fMRI-MEG study investigated the spatiotemporal dynamics of neural activation during visually guided saccades. The analysis focused on three regions that were robustly and bilaterally activated in our task as well as in previous neuroimaging studies (Astafiev et al., 2003
; Beauchamp et al., 2001
; Berman et al., 1999
; Corbetta et al., 1998
; Darby et al., 1996
; Petit and Haxby, 1999
): Frontal Eye Field (FEF) and Intraparietal Sulcus (IPS), both involved in sensorimotor transformation, and area MT+, predominantly sensory. The loci of these fMRI ROIs were used to seed the MEG data set and extract source time courses of neuromagnetic activity time-locked to the visual target. The wide spatial separation of these foci and their predominant activation across subjects (see Figure 1
) makes this approach feasible. The most consistent visual evoked response peaked earlier in lateral occipital (MT+) than in parietal (IPS) and frontal (FEF) regions. We observed stronger neuromagnetic signals from the hemisphere contralateral to the saccade direction. Finally, there was a positive relationship between SRT variability and latency of visual responses both in sensory (MT+) and motor (FEF) regions.
The approach used in the present study had some limitations that need to be clarified before the discussion of the results. The MEG inverse problem is intrinsically ill-posed, i.e., it is not possible to obtain a unique reconstruction of brain activity using only MEG. Most of the uncertainty is due to the fact that the same MEG data may be explained by fewer or more active brain regions. This issue may be overcome by using the Equivalent Current Dipole (ECD) as the source model and fMRI data to number and position these ECDs at the centroid of appropriate ROIs. MEG information is then used to find source strength variability over time. This solution must be validated by checking that the residual variance is low enough, usually less than 20% of the total variance. The lower the residual variance, the better the model derived from fMRI fits the recorded data. In our data the peak of residual variance in the pre-saccadic period ranged from 6% and 20%, supporting the use of the 6- ECD model to account for cortical brain activity during visually-guided eye movements. In this regard, the obtained source waveforms represent the activity of the selected source model (multiple ECDs) derived from the fMRI ROIs. A further issue concerns the lack of manipulations of the properties of the visual stimulus triggering saccades. For example, contrast modulation could have provided the opportunity to closely investigate the variations in the MT+ source waveforms as a function of stimulus detectability. However, this was beyond the scope of the present study. Readers may wish to consider these limitations in the examination of the present results.
Time Course of Visual Activity
Although MEG recordings cannot distinguish signals from different neuronal populations within the same area, as for example target selection or motor planning in IPS or FEF (Andersen et al., 1987
; Barash et al., 1991
; Bruce and Goldberg, 1985
; Gnadt and Andersen, 1988
; Goldberg et al., 2002
; Mazzoni et al., 1996
; Schall et al., 1995
; Thompson et al., 1996
, 1997
), they allow the separation of an ‘averaged’ visual- or motor-related response from different regions by aligning trials to stimulus or movement onset, respectively. The alignment on the stimulus onset that was used in the present study was aimed at investigating the visual rather than the pre-motor activity, which would have been better detected with a backward averaging starting from movement onset. When a backward averaging was performed on the present dataset (data not shown), the signal-to-noise ratio was not as good as the one obtained with the forward procedure. Thus we decided to focus on visual processing, identified as the first peak of activity following stimulus onset.
In the single interval analysis the visual response in MT+ peaked at ~157 ms followed by a response in IPS and FEF at ~170 ms. Similar latencies were observed in the quartile analysis, where MT+, IPS and FEF regions showed a sequential activation following target onset. These latencies are consistent with previous saccadic EEG studies that also aligned trials to the visual target (Clementz et al., 2001
; Evdokimidis et al., 1992
; McDowell et al., 2005
). For example, McDowell et al. (2005)
observed greater stimulus-locked activity in the contralateral occipital cortex at about 130–170 ms after stimulus onset, during both pro- and anti-saccades. This sequence of activation over three cortical regions, which are anatomically connected by both feedforward and feedback connnections (Felleman and Van Essen, 1991
; Ungerleider and Desimone, 1986
) shows a forward sweep of sensory activity that flows from posterior occipital to parietal and frontal areas for the first time in humans. Notwithstanding differences between MEG and single unit recordings, a similar trend was previously observed by Schmolesky and colleagues (1998)
, who reported increased latency of visual responses from MT (~72 ms) to FEF neurons (∼80 ms). The timing of visual responses in awake behaving monkeys also shows this trend. The visual latency in FEF is around 70–80 ms (Schall, 1991
; Thompson et al., 1996
); in IPS it ranges from 40–50 ms (Bisley et al., 2004
) to 110 ms (Barash et al., 1991
); finally, in MT it is around 30–40 ms (Bair et al., 2002
). The relative delay in the measured MEG activity with respect to single unit also reflects differences in the way these two methods sample neural activity. While single unit studies measure when the signal departs from the baseline, in our study we focused on the latency of the peak of the neural activity, since the estimation of the peak of activity was considered more reliable when dealing with low signal-to-noise measurements.
Neural Basis of Saccadic Reaction Times Variability
SRT variability was related to differences in neural latencies of the visual evoked activity across several cortical regions in occipital, parietal, and frontal cortex. The latency of visually evoked activity varied with SRT in frontal and occipital areas, i.e., slower latencies were associated with slower RTs. Prior monkey electrophysiological studies on FEF neurons emphasized the role of response preparation, showing that the time of saccade initiation did not vary as function of the timing of neuronal differences indexing target discrimination, but varied as function of the time FEF movement neurons exceeded a fixed constant threshold (Hanes and Schall, 1996
; Thompson et al., 1996
). However, more recent work suggests that variability in sensory processing contributes substantially to the latency of eye movement responses, especially if the visual task is designed to be demanding (Sato et al., 2001
) or if monkeys locate the target by performing multiple eye movements (Ipata et al., 2006
).
Carpenter (2004)
observed that at least two factors contribute to the latency of response to a visual stimulus: lower level factors, such as the luminance and contrast of the visual stimulus, and higher level factors, such as the pressure to respond or stimulus probability. In this paradigm the onset of the target was indicated by a change in the color of the peripheral stimulus, a low level factor. Accordingly, the strongest relationship between neural activity and behavior was found in MT+ when time-locking trials on visual target onset. This also argues against the possibility that this result was contaminated by motor preparation activity. If that were the case, we should have observed a stronger relationship in the fronto-parietal network rather than in a sensory area. However, the variability in visual responses explained only a small part of the behavioral variability, ~20% based on the correlation analysis on SRT quartiles. Therefore, residual behavioral variability must be dependent on later stages of processing including decision, pre-motor and motor stages (Hanes and Schall, 1996
; Shadlen and Newsome, 2001
; Thompson et al., 1996
).
Overall, when considered in the context of previous studies, our findings suggest a rather interesting insight, namely that reaction time variability derives from the accumulation of delays in the perceptual, decisional and motor preparation stages.
The authors declare that the research was conducted in the absence of any commercial or financial relationships that could be construed as a potential conflict of interest.
We would like to thank Dr. Bernardo Perfetti for helping with data collection. This work was supported by an European Union Marie Curie Chair (MCA-EXC Chair 006783) to M.C.