 Xiaomei Ren1
†
Xiaomei Ren1
† Bowen Dong1
†
Bowen Dong1
†
 Ying Luan2
 Ye Wu3
*
Ye Wu3
* Yunzhi Huang4
*
and the Alzheimer's Disease Neuroimaging Initiative
Yunzhi Huang4
*
and the Alzheimer's Disease Neuroimaging Initiative- 1College of Electrical Engineering, Sichuan University, Chengdu, China
- 2Department of Radiology, Zhongda Hospital, School of Medicine, Southeast University, Nanjing, China
- 3School of Computer Science and Engineering, Nanjing University of Science and Technology, Nanjing, China
- 4Institute for AI in Medicine, School of Artificial Intelligence (School of Future Technology), Nanjing University of Information Science and Technology, Nanjing, China
Disruptions in the inter-regional connective correlation within the brain are believed to contribute to memory impairment. To detect these corresponding correlation networks in Alzheimer’s disease (AD), we conducted three types of inter-regional correlation analysis, including structural covariance, functional connectivity and group-level independent component analysis (group-ICA). The analyzed data were obtained from the Alzheimer’s Disease Neuroimaging Initiative, comprising 52 cognitively normal (CN) participants without subjective memory concerns, 52 individuals with late mild cognitive impairment (LMCI) and 52 patients with AD. We firstly performed vertex-wise cortical thickness analysis to identify brain regions with cortical thinning in AD and LMCI patients using structural MRI data. These regions served as seeds to construct both structural covariance networks and functional connectivity networks for each subject. Additionally, group-ICA was performed on the functional data to identify intrinsic brain networks at the cohort level. Through a comparison of the structural covariance and functional connectivity networks with ICA networks, we identified several inter-regional correlation networks that consistently exhibited abnormal connectivity patterns among AD and LMCI patients. Our findings suggest that reduced inter-regional connectivity is predominantly observed within a subnetwork of the default mode network, which includes the posterior cingulate and precuneus regions, in both AD and LMCI patients. This disruption of connectivity between key nodes within the default mode network provides evidence supporting the hypothesis that impairments in brain networks may contribute to memory deficits in AD and LMCI.
1. Introduction
Alzheimer’s disease (AD), a specific form of dementia, is a neurodegenerative disorder characterized by the presence of tau and β-amyloid deposition as well as neuronal loss. Alterations in inter-regional correlation networks within the brain are believed to contribute to atrophy and neurodegeneration in associated brain regions, ultimately leading to cognitive decline (Vemuri and Jack, 2010; Yu et al., 2021). Mild cognitive impairment (MCI) refers to a mild cognitive decline that does not interfere with daily activities. More than half of MCI cases develop dementia within 5 years (Arbabshirani et al., 2017). Investigating abnormalities in inter-regional covariant and connective correlation in AD and MCI is pivotal for early detection of AD.
Magnetic resonance imaging (MRI) is a promising imaging modality due to its non-invasive detection, accessibility, and non-ionizing radiation. Previous studies using T1-weighted structural MRI (sMRI) have demonstrated reduced cortical thickness (CT) in specific cortical regions across various conditions (Canu et al., 2017; Park et al., 2017; Phillips et al., 2019). However, such measures of cortical atrophy fail to capture inter-regional connectivity within the brain. In contrast, metrics assessing inter-regional correlations have been shown to be superior in detecting Aβ pathology and Alzheimer’s disease progression (Neitzel et al., 2019) compared to measures of brain atrophy. The cortical covariance analysis examines the CT covariant relationship across brain regions, and the functional connectivity (FC) measures inter-regional synchronous correlation using Pearson’s correlation of blood oxygen level dependent (BOLD) sequences from resting-state MRI (rsfMRI). Recent studies have revealed alterations in inter-regional correlation under different conditions, including structural covariance (Tuladhar et al., 2015; Nestor et al., 2017; Valk et al., 2017; Phillips et al., 2019) and FC networks (Canu et al., 2017; Yan et al., 2017; Kuang et al., 2019; Berron et al., 2020; Smith et al., 2021). These studies used pre-selected region of interests (ROIs) based on specific atlases (Nestor et al., 2017; Phillips et al., 2019) or meta-analytical results (Valk et al., 2017) for correlation analysis between brain regions. The ROI-based analysis relies solely on selected ROIs and may be more sensitive to variable atrophied areas (Smitha et al., 2017). The voxel-wise method automatically defines ROIs boundaries based on data, providing more precise anatomical location of brain atrophy (Phillips et al., 2019). In this study, we conducted the vertex-wise CT analysis at the whole brain level to identify the significant different regions in AD and LMCI compared to the cognitively normal (CN). These regions were used as seed ROIs for inter-regional structural covariant and functional connectivity analysis.
Besides FC analysis (Smitha et al., 2017; Delli Pizzi et al., 2019; Neitzel et al., 2019; Zhao et al., 2019; Berron et al., 2020; Smith et al., 2021), rsfMRI has been widely used in group independent component analysis (group-ICA). This data-driven method aggregates all voxels of all subjects by temporally concatenating BOLD sequences to investigate voxel-to-voxel interaction and isolates distinct spatially independent maps known as group-ICA networks (Smitha et al., 2017; Dadi et al., 2019). Group-ICA is advantageous due to its prior independence and noise insensitivity, and has successfully identified default mode network (DMN) in patients with AD (Park et al., 2017; Smitha et al., 2017; Son et al., 2022). This motivates us to employ group-ICA to identify significant differences in ICA networks between patients and CN.
Numerous studies have reported improved brain networks results by jointly using structural and functional MRI, as well as ICA networks (Canu et al., 2017; Park et al., 2017; Smitha et al., 2017; Beheshtian et al., 2021; Caspers et al., 2021; Son et al., 2022). However, the consistency among cortical covariance, functional connectivity and ICA networks in AD has not yet been investigated. We hypothesized that brain regions belonging to subnetworks of typical brain networks would exhibit consistent changes across multiple correlation modalities in AD. Specifically, we sought to identify brain regions that consistently emerged in the three types of networks (cortical covariance, functional connectivity, group-ICA). Regions meeting this consistency criteria were defined as AD-specific inter-regional correlation networks.
2. Materials and methods
Our two-branch analytical pipeline is illustrated in Figure 1, with one branch dedicated to structural covariance analysis using sMRI data and the other for FC analysis using rsfMRI data. After independently constructing the structural and functional correlation networks, we distill the consistent elements between them as distinct inter-regional connectivity for distinguishing AD or MCI from CN.
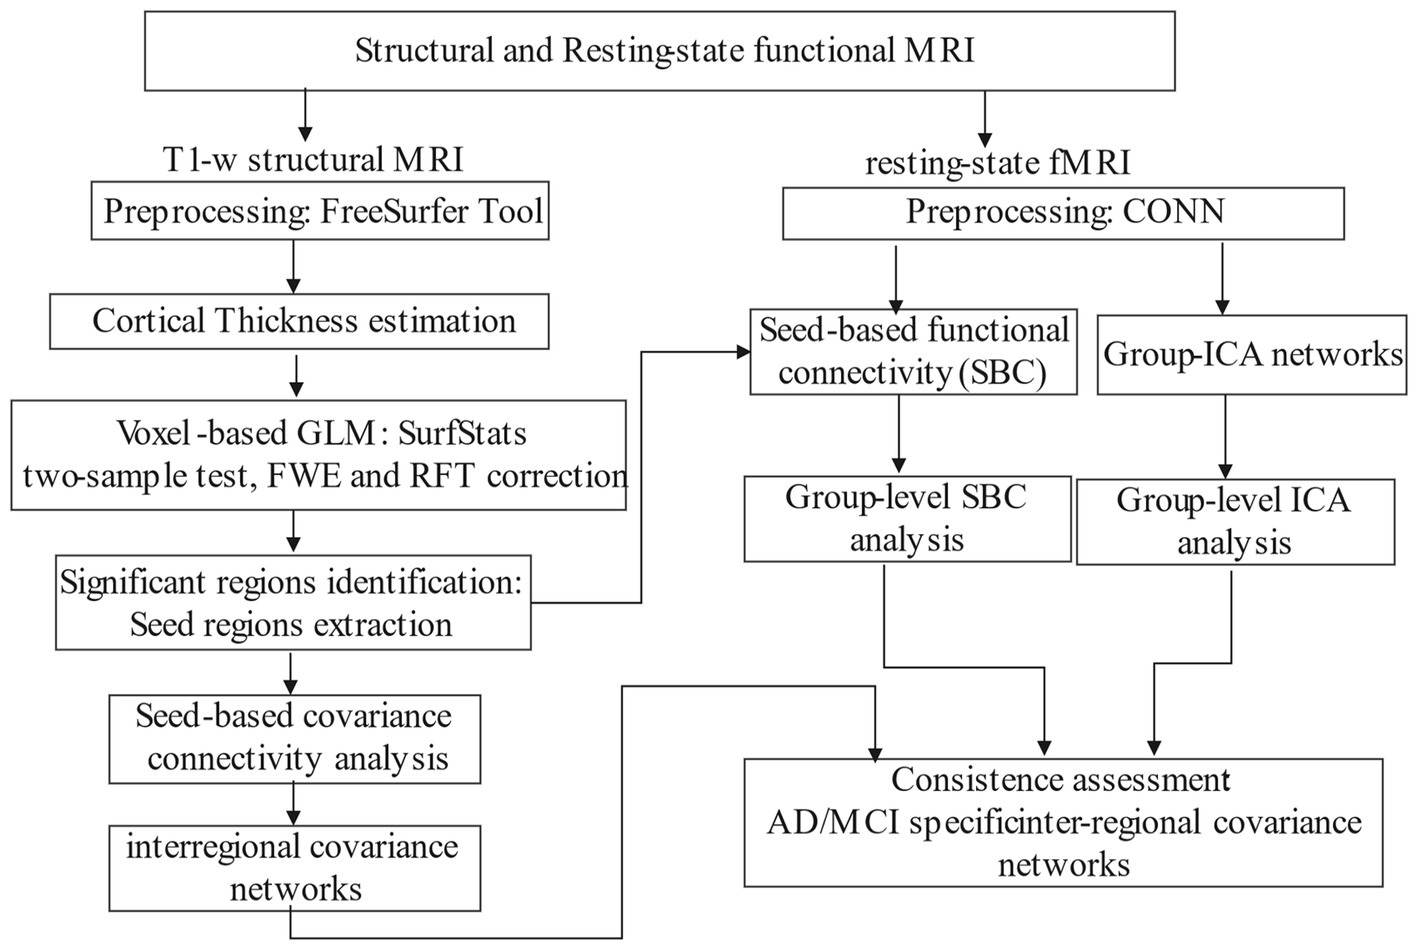
Figure 1. Schematic diagram of our study.
2.1. Data
Data used in this study were from the Alzheimer’s Disease Neuroimaging Initiative (ADNI) database.1 The ADNI was launched in 2003 as a public-private partnership functional network led by Principal Investigator Michael W. Weiner, MD. The primary goal of ADNI has been to test whether serial MRI, positron emission tomography (PET), other biological markers, and clinical and neuropsychological assessment can be combined to measure the progression of MCI and early AD.
2.2. Study participants
The study included records from the ADNI2 and ADNI3 phases, which were acquired using 3 T scanners (Siemens, Philips and GE). All data underwent quality control based on UCSF QC outcomes and MAYO QC levels from LONI. More detailed documents can be found in the ADNI dataset. For rsfMRI, sequences with multiband echo planar imaging (EPI) acquisition and data with excessive motion artifacts or scrubbling values greater than 25 during CONN preprocessing were excluded. For sMRI, subjects who failed to pass the FreeSurfer pipeline were also excluded. Finally, to maintain a balanced sample size, three diagnostic groups (AD/LMCI/CN: 52/52/52) were enrolled. In our study, the original downloaded sample size was 578 participants, and after applying selection criteria we ended up with a final sample size of 156 as shown in Figure 2.
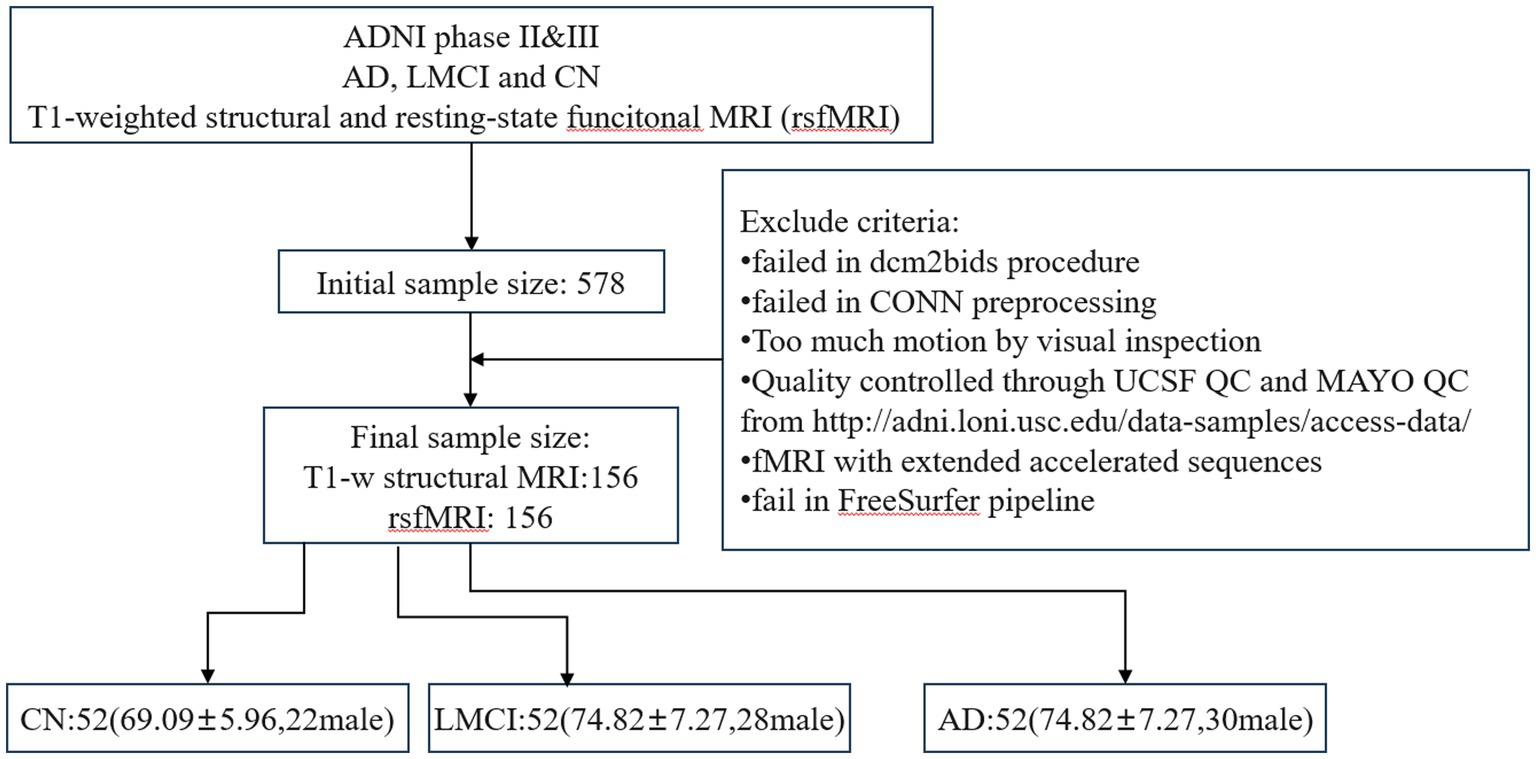
Figure 2. The workflow of selecting participants.
2.3. Image acquisition
All MRI scans in our study were collected exclusively during the Baseline Visit periods, following the participants determination of eligibility and completion of the informed consent process. The T1w sMRI data were acquired with accelerated sagittal magnetization-prepared rapid gradient echo sequence (in-plane resolution = 1.0 × 1.0 mm2; slice thickness = 1 mm; repetition time = 2,300 ms; echo time = 3.0 ms; flip angle = 9°; field of view: 224 mm). The axial rsfMRI data were acquired with EPI BOLD sequence (pixel spacing x = 3.4 mm; pixel spacing y = 3.4 mm; slice thickness = 3.4 mm; matrix: 64 × 64; flip angle = 90°; slices = 197; echo time = 30.0 ms; repetition time = 3 s; field of view: 212 mm).
2.4. Data preprocessing
The structural and rsfMRI data in DICOM format were downloaded from LONI and converted to NifTi files using dcm2niix and Dcm2Bids tools (Gorgolewski et al., 2016). Data that failed to pass Dcm2Bids procedure were excluded.
2.4.1. T1w structural data
The CT data were estimated through reconstruction of cortical surface from the T1w image using the default FreeSurfer pipeline (Dale et al., 1999). Our analysis began with brain segmentation of white matter (WM), grey matter (GM) and cerebrospinal fluid (CSF), followed by surface reconstruction. We generated the WM and pial surface, performed surface inflation and spherical flattening transformations, and assigned a Destrieux atlas label to each cortical voxel using cortical parcellation (Fischl et al., 2004). Statistical results of cortical parcellation were then created, where T1w images were registered to the surface template and smoothed with a 10 mm full-width half-maximum (FWHM) Gaussian kernel. Finally, the cortical thickness (CT) of each cortex was estimated as the shortest distance between the WM boundary and the pial surface (Fischl and Dale, 2000).
2.4.2. Resting state functional data
The preprocessing results of rsfMRI data come from analyses performed using CONN (Whitfield-Gabrieli and Nieto-Castanon, 2012) release 22.a (Nieto-Castanon and Whitfield-Gabrieli, 2022) and SPM (Penny et al., 2011) release 12.6470.
After removing the first 4 volumes, rsfMRI data were preprocessed using a default preprocessing pipeline (Nieto-Castanon, 2020). In brief, functional data were firstly realigned (Friston et al., 1995; Andersson et al., 2001) and resampled to correct for motion. Potential outlier scans were then identified (Whitfield-Gabrieli et al., 2011). Functional and anatomical data were normalized into standard MNI space, segmented into GM, WM, and CSF tissue, and resampled to 2 mm isotropic voxels (Ashburner and Friston, 2005; Ashburner, 2007; Calhoun et al., 2017). Next, functional data were smoothed with a Gaussian kernel of 6 mm FWHM. Last, functional data were denoised using a standard denoising pipeline (Whitfield-Gabrieli and Nieto-Castanon, 2012) including the regression of potential confounding effects characterized by WM timeseries, CSF timeseries, motion parameters (Friston et al., 1996), outlier scans (Power et al., 2014), and linear trends, followed by bandpass filtering (Hallquist et al., 2013) between 0.001 and 0.2 Hz.
FC values associated with a specific seed were estimated while controlling for all other seeds. The strength of FC was represented by Fisher-transform of semi-partial correlation coefficients from a weighted general linear model (GLM) (Nieto-Castanon, 2020). This approach allowed for modeling the association of BOLD time-series between each seed and other voxel in the brain.
2.4.3. Group-level ICA networks
Group-ICA (Calhoun et al., 2001) were performed to estimate 40 temporally coherent networks from the rsfMRI data across all subjects. The BOLD time series from every voxel in the brain across all subjects were temporally concatenated. For each subject, a singular value decomposition of the z-score normalized BOLD signal with 64 components was separately used as a subject-specific dimensionality reduction step. The dimensionality was further reduced to 40 components and a fast-ICA fixed-point algorithm (Hyvarinen, 1999) was used to identify spatially independent group-level networks. Lastly, a back-projection (Erhardt et al., 2011) was used to compute ICA networks separately for each subject.
2.5. Statistical analysis
2.5.1. Demographic and volumetric data analysis
We evaluated the normal distribution of continuous demographic variables (age and years of education), average CT and the total GM volume (GMV) using a single-sample Kolmogorov–Smirnov test. Group-wise differences were assessed using a two-sample Kolmogorov–Smirnov test. The analysis of sex and type of scanner were conducted using the Mann–Whitney rank sum test. All statistical analyses were performed on the Matlab platform.
2.5.2. Voxel-wise cortical thickness analysis
The vertex-wise GLM was conducted using the SurfStat Toolbox2 for CT analysis. The CT value at each vertex was modeled as the dependent variable, with group (CN, AD, LMCI) as the independent variable. Age, sex, education, scanner type, and total GMV were included as covariates. Cluster-level statistics were thresholded at p < 0.001 for AD vs. CN and p < 0.025 for LMCI vs. CN to correct for multiple comparisons using random field theory (RFT). A cluster extent threshold of p < 0.05 family-wise error (FWE) rate was then applied to control the probability of reporting false positive clusters. The cortical regions demonstrating significant group differences were mapped onto the Destrieux atlas to generate ROIs called seeds. These regions were also mapped onto the Anatomical Automatic Labeling (AAL) atlas in MNI space to create AAL-based seeds for FC analysis.
2.5.3. Cortical covariant networks
An interactive GLM approach was used to examine whether a specified seed region exhibited distinct cortical covariance patterns across the entire surface in patients compared to controls. Mathematically, the interactive GLM can be formulated as follows:
where * denotes an interaction, the weight coefficients of each covariates are denoted by i , CTi represents the CT data of the ith voxel, and CTseed is the average CT of a specific seed, GMV refers to total GMV, Diagnosis is the group identifier. The contrast for comparing AD and CN can be: contrast = CTseed.*Diagnosis.CN-CTseed.*Diagnosis.AD. The results were corrected using RFT at a cluster threshold of p = 0.025, controlling probability for FWE at cluster-wise threshold PFWE < 0.05. All surviving regions after correction were matched onto AAL atlas.
2.5.4. Group-level analysis of functional connective networks
Group-level analyses of functional networks were performed using a GLM (Nieto-Castanon, 2020). A separate GLM was estimated with first-level connectivity measures (FC connective maps/ICA maps) at this voxel as dependent variables, and group identifiers as independent variables, and covariates included age, sex, years of education and scanner type. Voxel-level hypotheses were evaluated using multivariate parametric statistics with random-effects across subjects. Inferences were performed at the level of individual cluster based on parametric statistics from Gaussian RFT (Worsley et al., 1996; Nieto-Castanon, 2020). Results were thresholded using a combination of a cluster-forming p < 0.0025 voxel-level threshold and a familywise corrected p-FDR < 0.05 cluster-size threshold (Chumbley et al., 2010).
2.5.5. The consistent inter-regional correlative networks
The inter-regional correlation networks, estimated using the three approaches mentioned above, included brain regions that are structural covaried or functionally connected with each other or in the IC network. The regions which consistently emerged in all or any two of the three networks were identified as inter-regional connective networks.
3. Results
3.1. Study demographics
The demographic data, mean CT and the total GMV are presented in Table 1. Except for the total GMV and education years showing no significant difference (p < 0.05) between LMCI and CN, other variables showed significant differences (p > 0.05) for AD and LMCI compared with CN. Therefore, these demographic variables are used as covariates in cortex-based GLM analysis to regress out their effects.
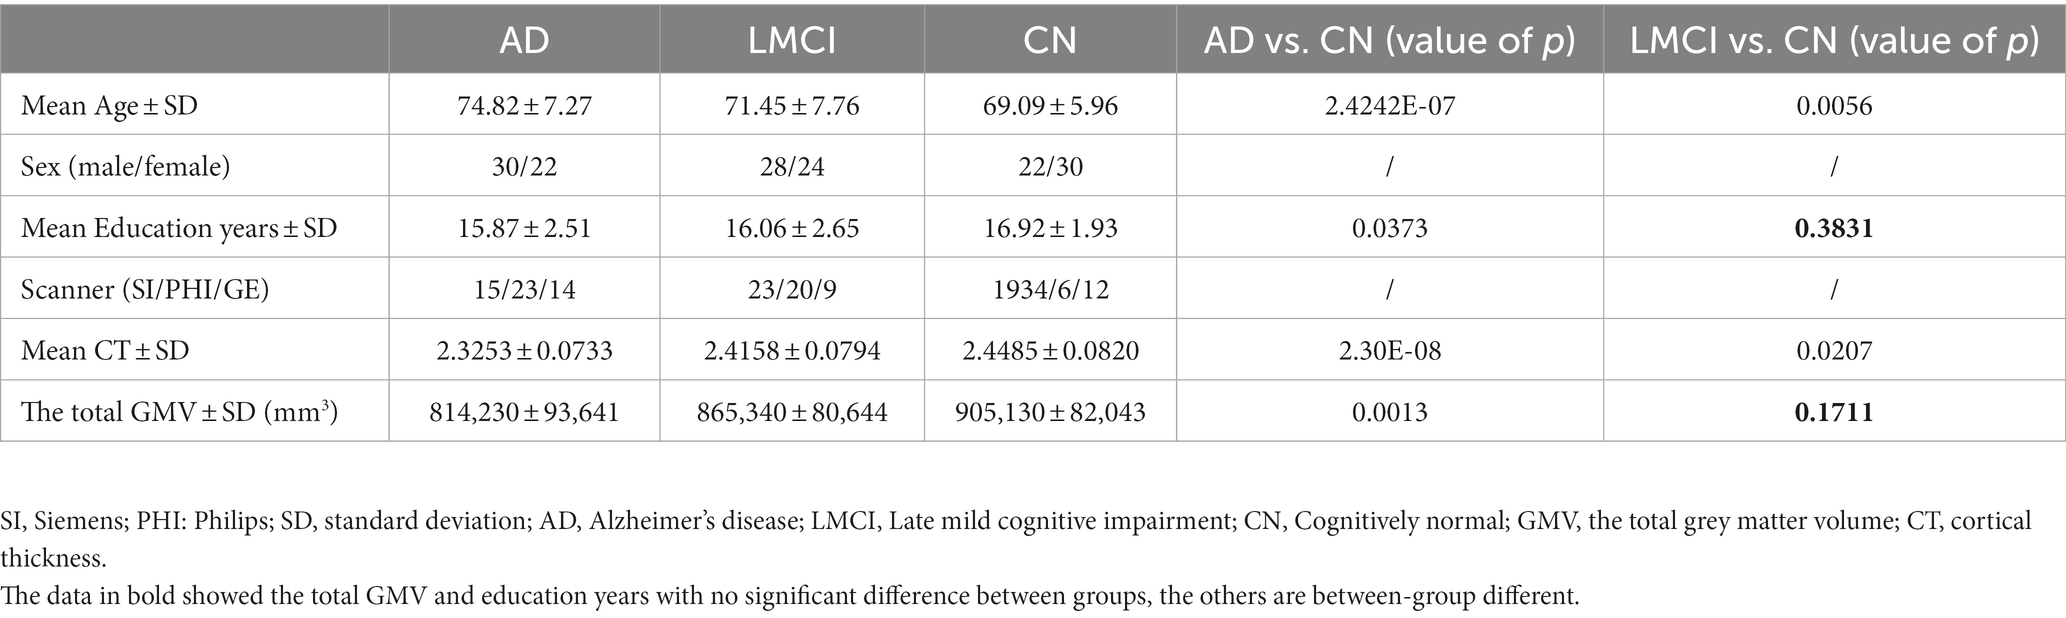
Table 1. Demographic data, the mean CT and the GMV data.
3.2. Cortical thickness and cortical covariant correlation
3.2.1. Cortical thickness
Multiple regions exhibited CT thinning in AD and LMCI patients compared to controls, but no cortical thickening was found in either. Table 2 presents the regions that display cortical thinning in AD and LMCI compared to controls after being mapped to the Destrieux atlas. Patients with AD exhibited cortical thinning in bilateral entorhinal and parahippocampal, left middle temporal cortex, temporal pole, as well as inferior temporal cortex, consistent with prior previous studies (Vemuri and Jack, 2010; Phillips et al., 2019). As shown, LMCI patients exhibited less pronounced (p < 0.0025) cortical atrophy in the left parahippocampal and entorhinal cortex, and the right middle and posterior cingulate gyrus. The diagram corresponding to the results in Table 2 is shown in Supplementary Figure S1.
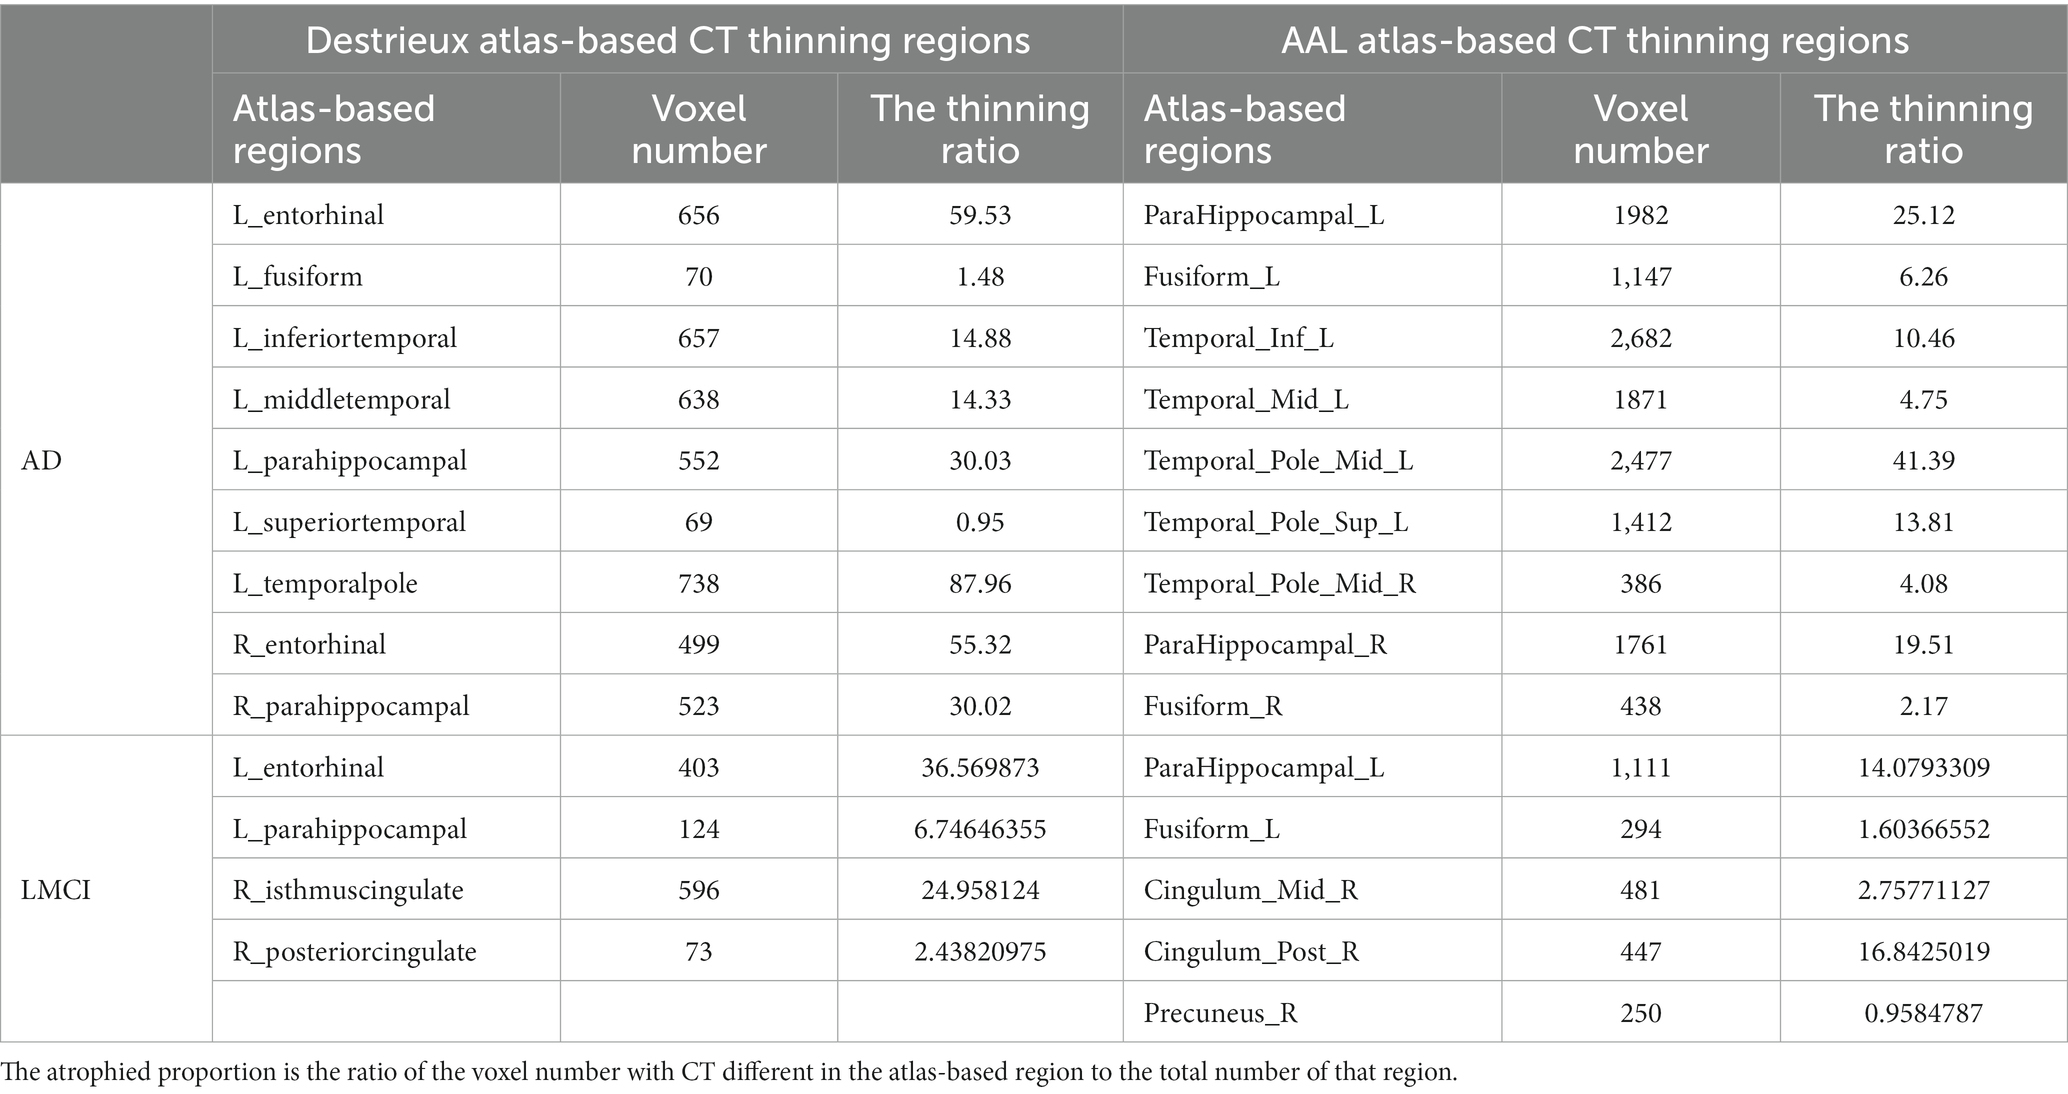
Table 2. The cortical thickness thinning regions in AD and LMCI.
Note that the cortical thinning regions being mapped to the AAL atlas are also shown in Table 2. In this study, ROIs from Destrieux and AAL atlases were used for cortical covariance and functional connectivity analysis, respectively.
3.2.2. Cortical covariant networks
The cortical covariant networks for all seeds were derived using the method described in Section 2.5.3. Table 3 summarizes the altered cortical covariant networks in AD and LMCI compared to CN.
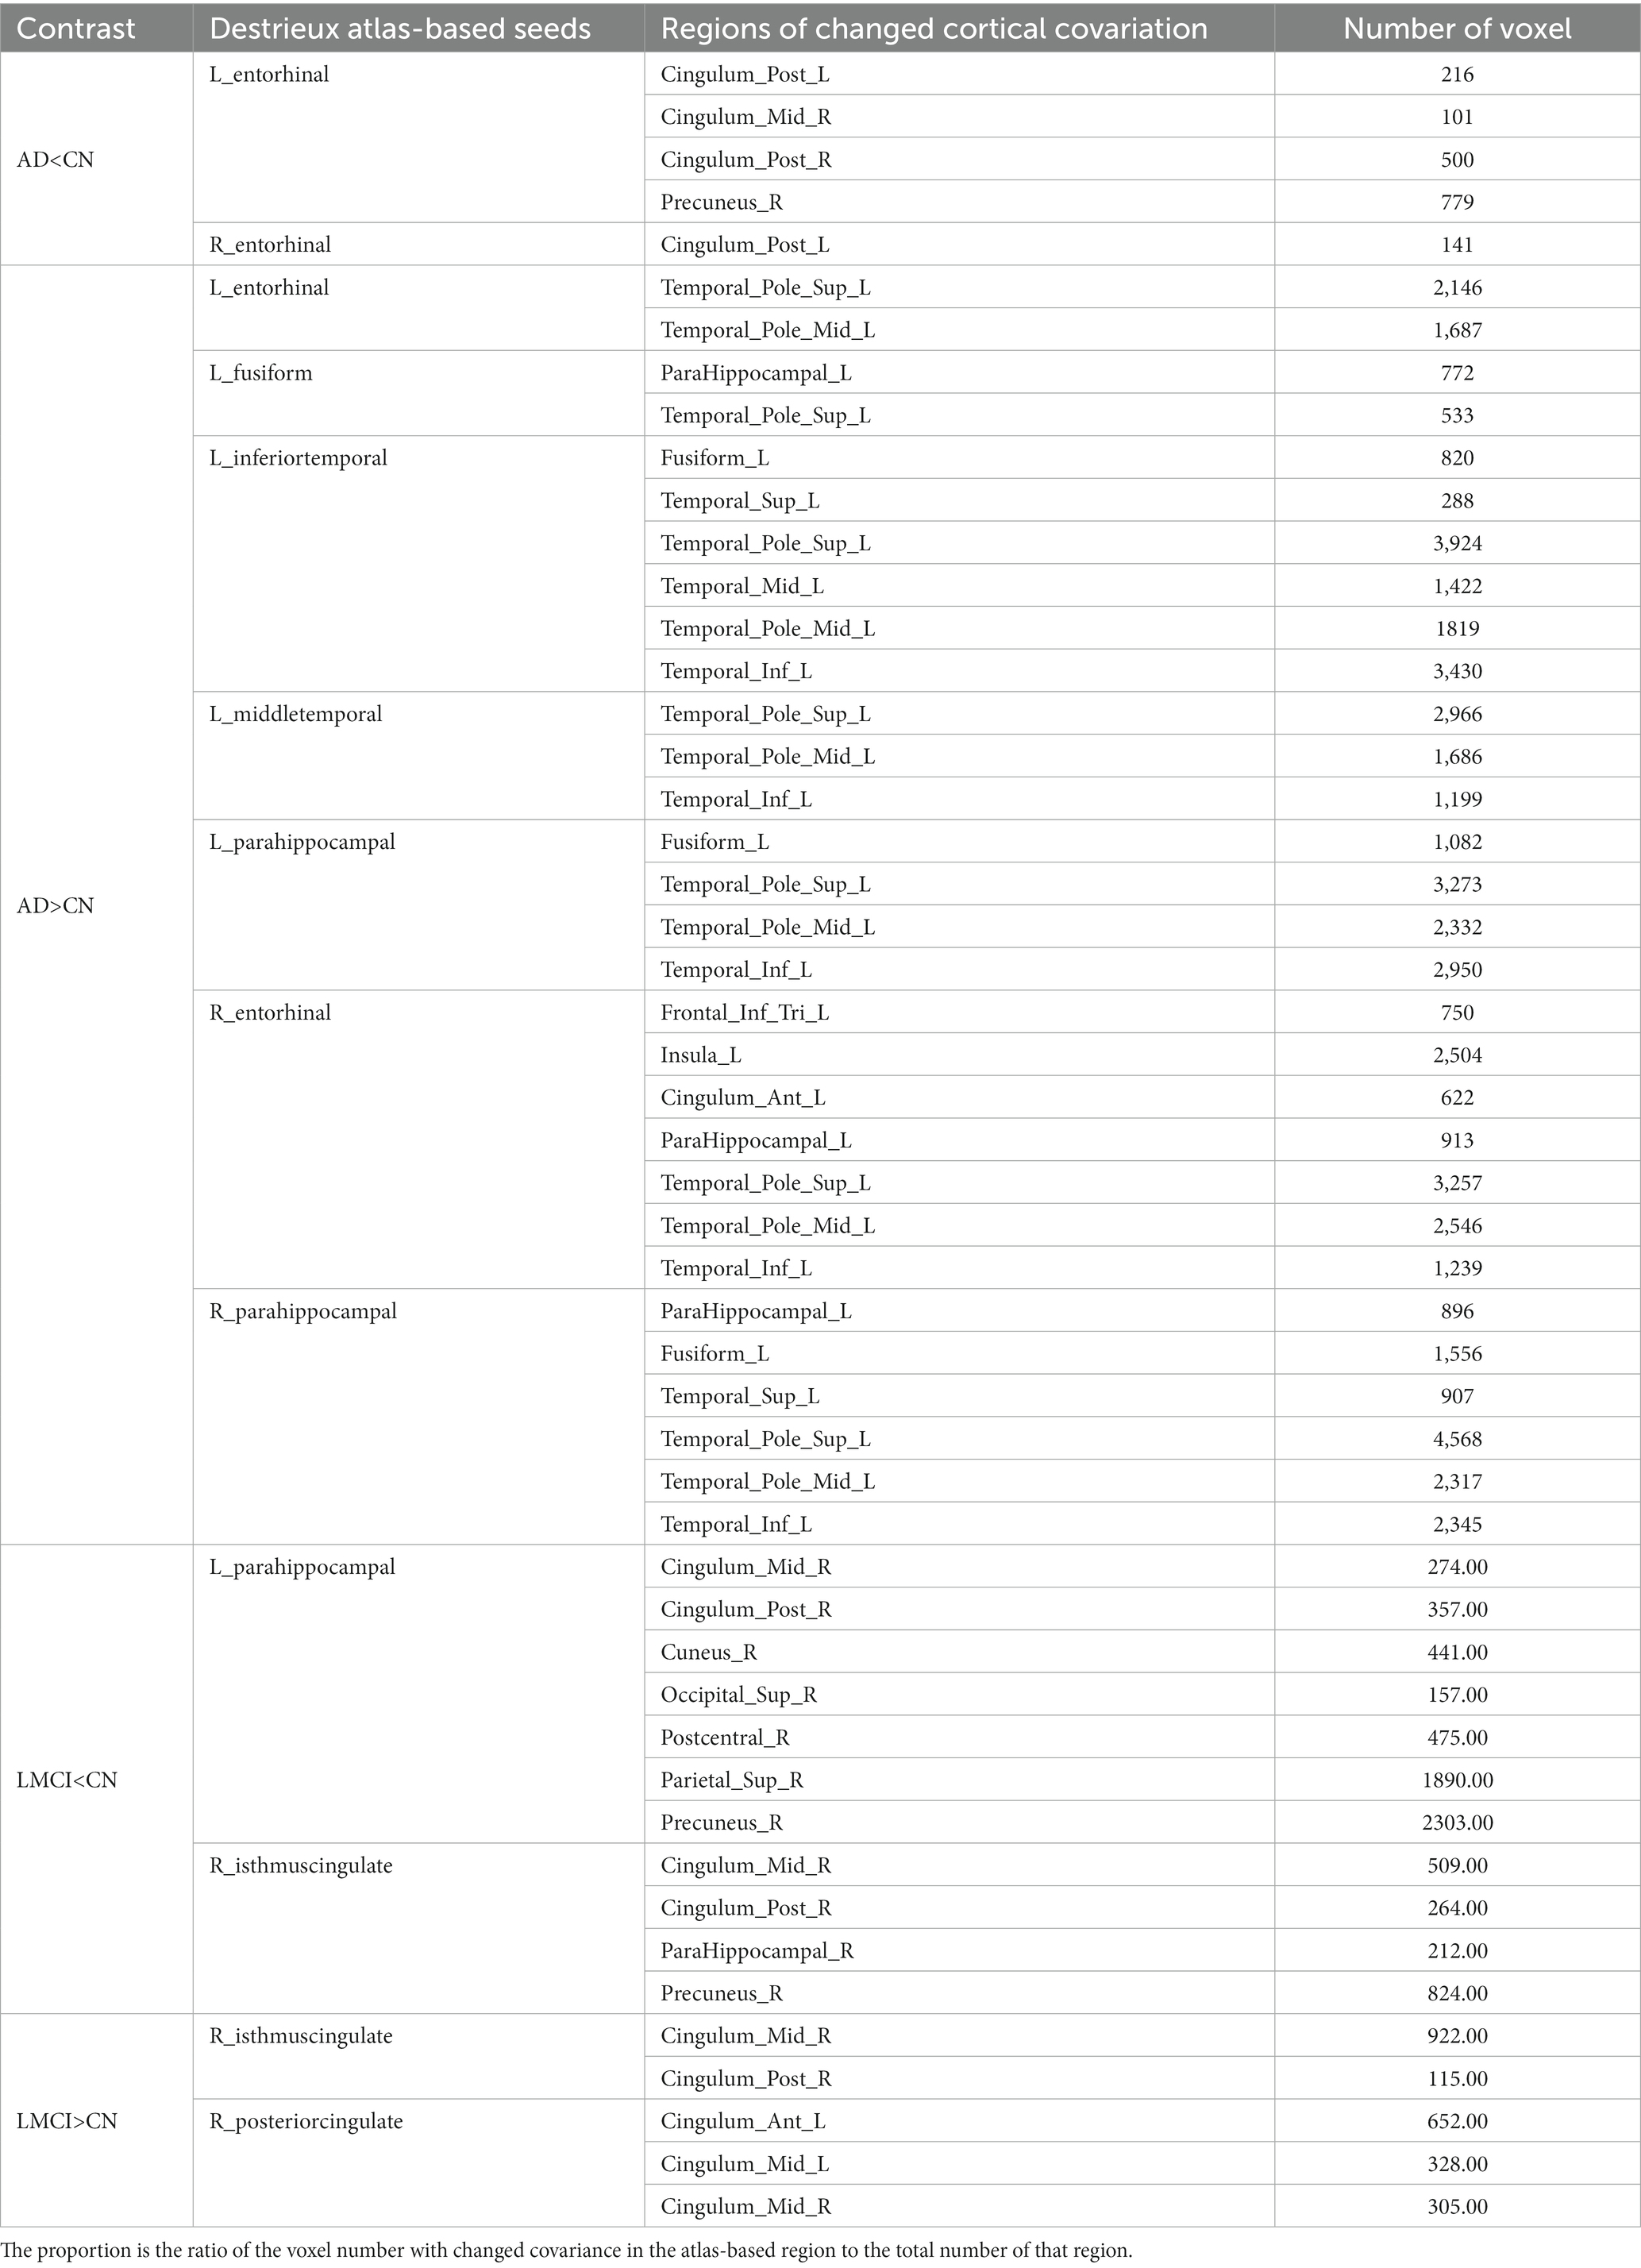
Table 3. The altered cortical covariant networks in AD and LMCI.
In Table 3, two attenuated covariant networks are identified in AD: (1) the correlation between left entorhinal and its covaried regions including bilateral posterior cingulate cortex and right precuneus. (2) The correlation between right entorhinal and left posterior cingulate cortex. These regions covered subnetwork of DMN, indicating a significant decrease in the covariant relationship between entorhinal and DMN subnetwork. In LMCI, two decreased covariant correlations were observed: (1) the connection between the DMN subnetwork (right middle and posterior cingulate cortex, and precuneus) and two seeds including left parahippocampal and right isthmus cingulate cortex. (2) The connection between right postcentral cortex and left parahippocaampal cortex.
On the other hand, the enhanced covariant networks in Table 3 reveal synchronous cortical changes between seeds and their associated regions. With all seeds showing significant CT thinning, it is expected that the corresponding covariant regions also exhibit a trend of cortical thinning. For instance, the left insula shows a trend of CT thinning in AD due to its covariation with five seeds. Also, two regions with significant trend of CT thinning in LMCI include bilateral middle cingulate and left anterior cingulate.
3.3. The functional networks
Using the rsfMRI data, functional connective networks and group ICA networks were estimated by CONN.
3.3.1. Functional connective networks
According to the method in Section 2.5.4, after comparing the FC map of each seed between AD/LMCI and CN, the regions exhibiting significant group differences were identified as the inter-regional connective network. Table 4 summarize all inter-regional FC networks capable of distinguishing AD and LMCI from CN.
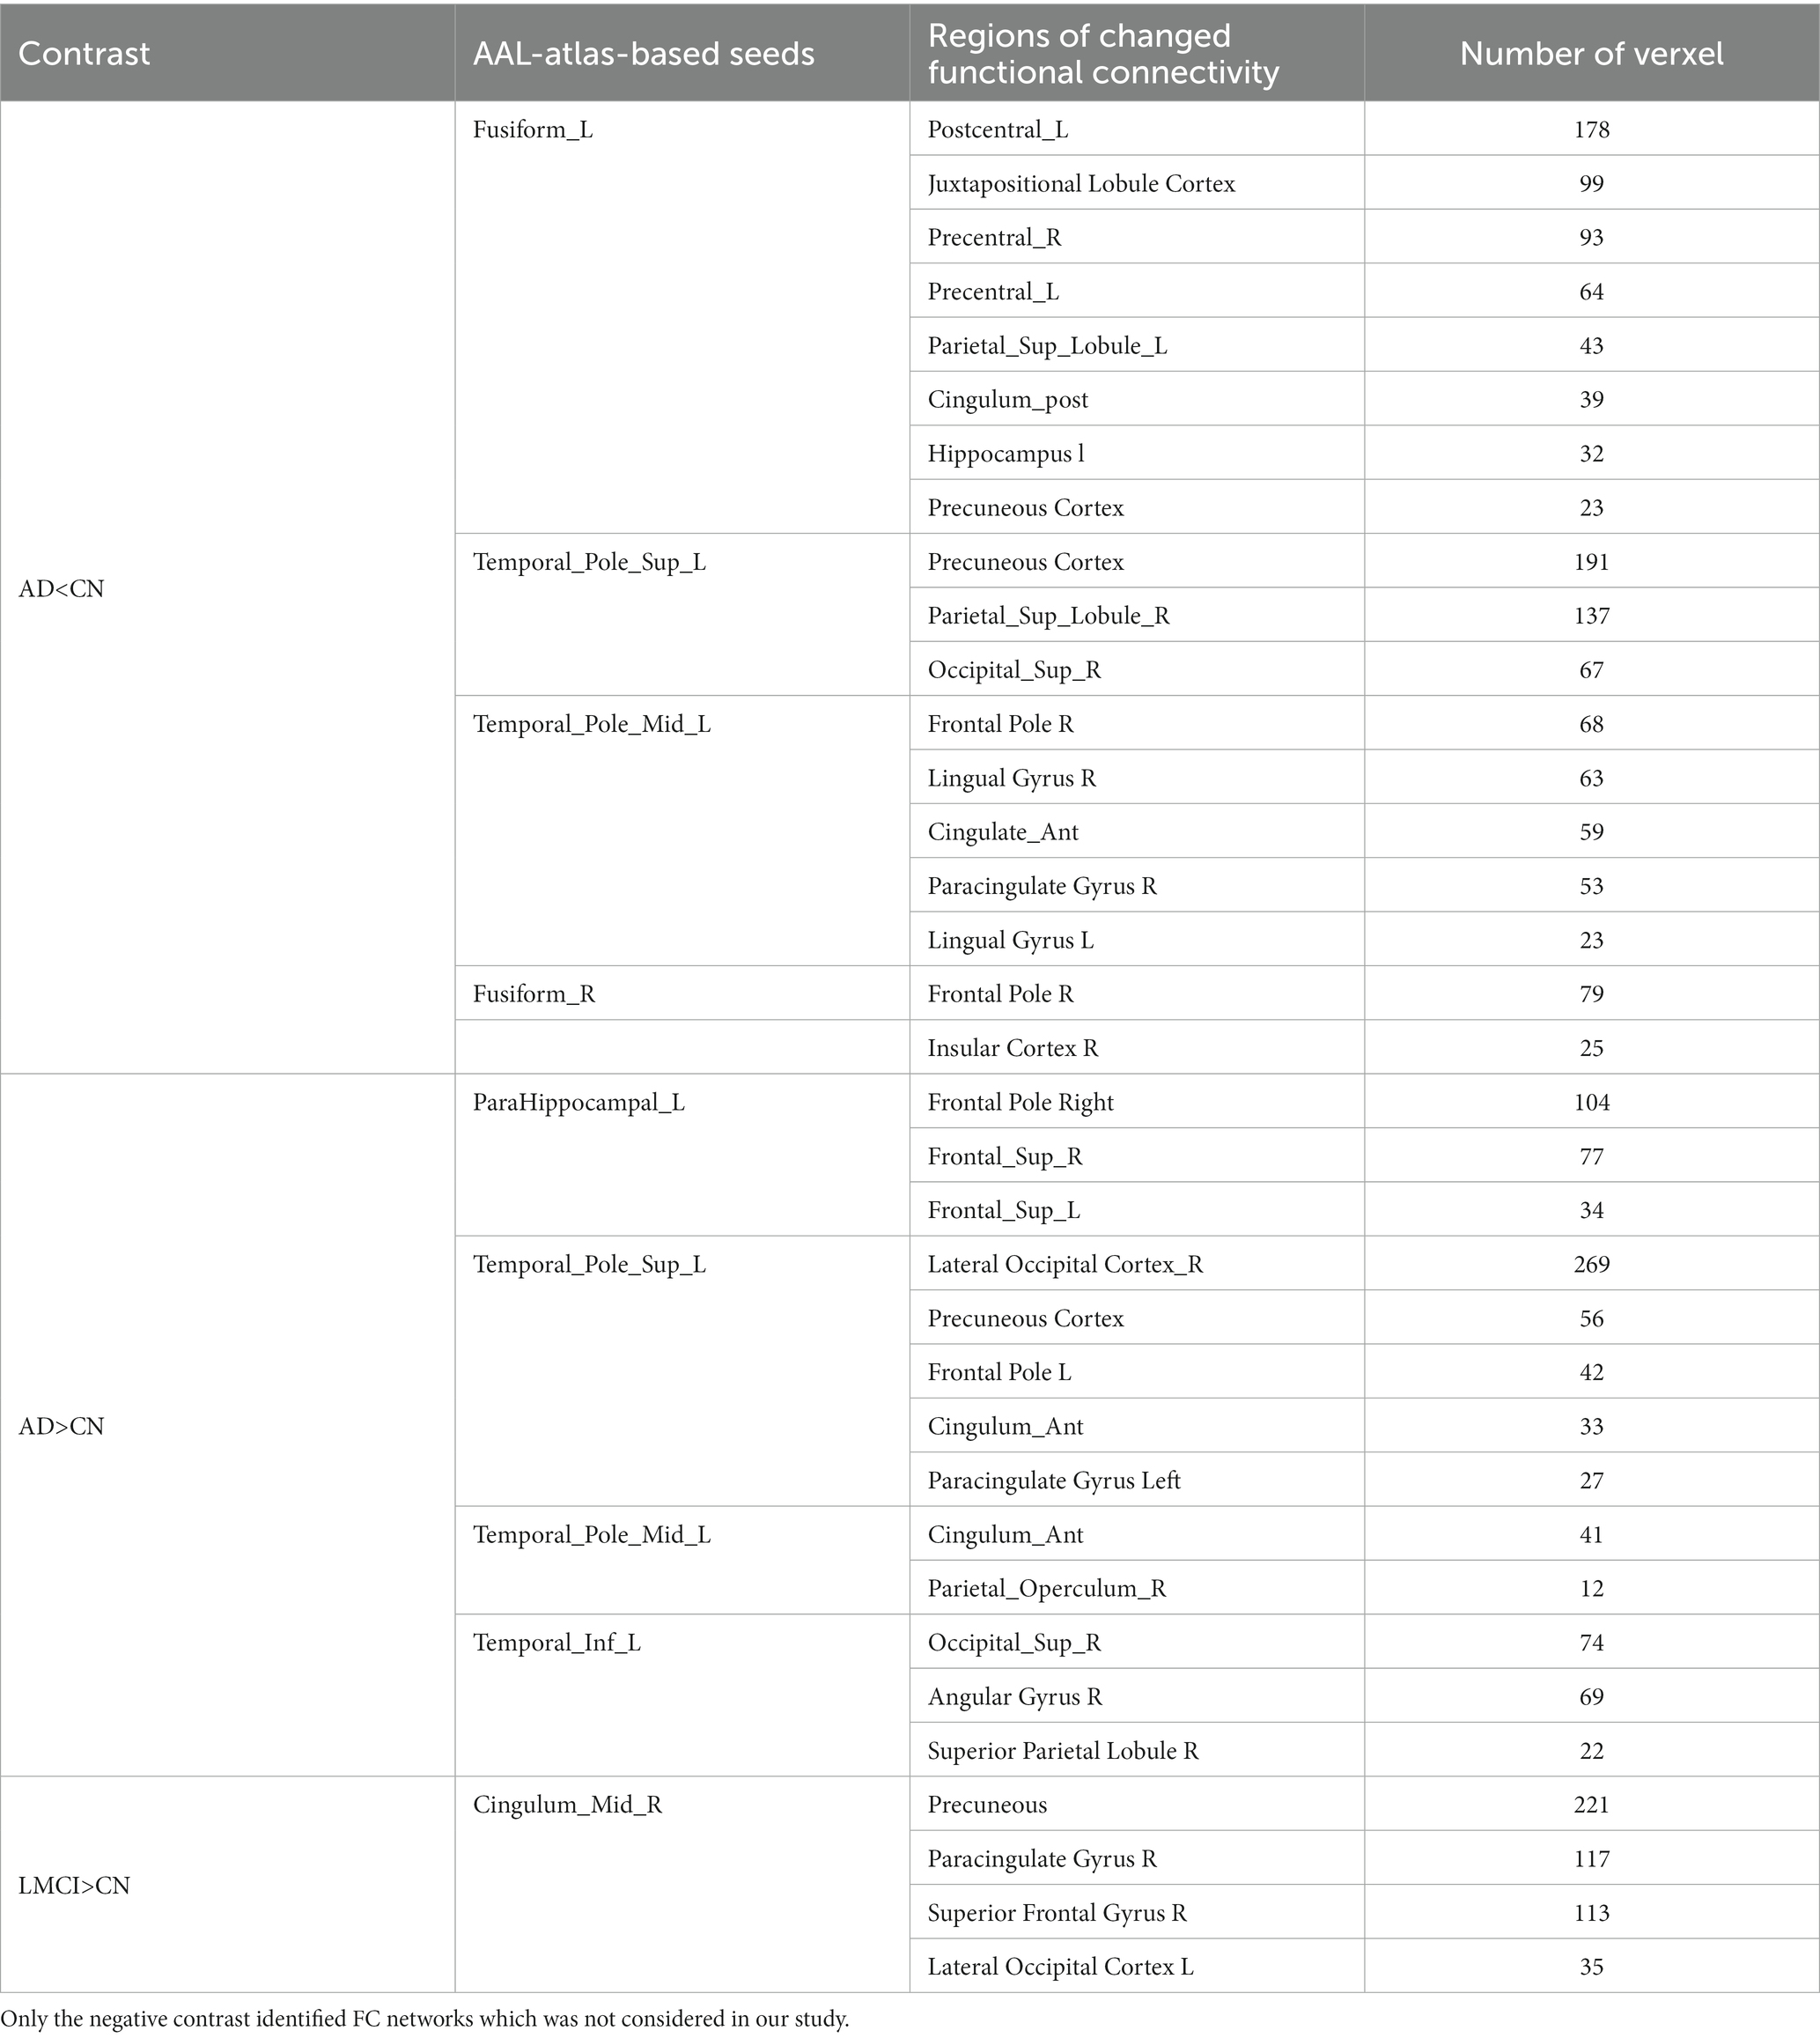
Table 4. The altered inter-regional functional connectivity in AD and LMCI.
Three inter-regional FC networks, located in the DMN (Precuneous Cortex, posterior cingulate cortex), sensorimotor network (bilateral precentral gyrus and left postcentral gyrus) and salience network (SN) (anterior cingulate, right paracingulate cortex and insular cortex), were found as indicated in Table 4 in bold. Compared with CN, the connectivity between these three networks and seeds was less significantly weakened (p < 0.05) in AD. For LMCI compared with controls, no significant reduction in FC correlative network was observed. Of note, enhanced FC networks were also found in AD and LMCI, which were not considered in this study.
3.3.2. Group-ICA networks
Group ICA networks were generated for 40 ICs as described in Section 2.5.4. The slices of all 40 ICs in AD vs. CN and LMCI vs. CN are shown in Supplementary Figures S2, S3, respectively.
Nine out of the 40 ICs showed significantly decreased weights in AD compared to CN, as displayed in Supplementary Table S3. Figures 3A,B below illustrate two examples, IC16 and IC32, which correspond to DMN’s subnetwork (precuneous cortex, posterior cingulate gyrus) and SN (anterior cingulate gyrus, paracingulate gyrus, and insular cortex), respectively. In addition, IC3 as shown in Supplementary Table S3 corresponding to sensorimotor network, including precentral and postcentral gyrus, was also significantly different between AD and CN.
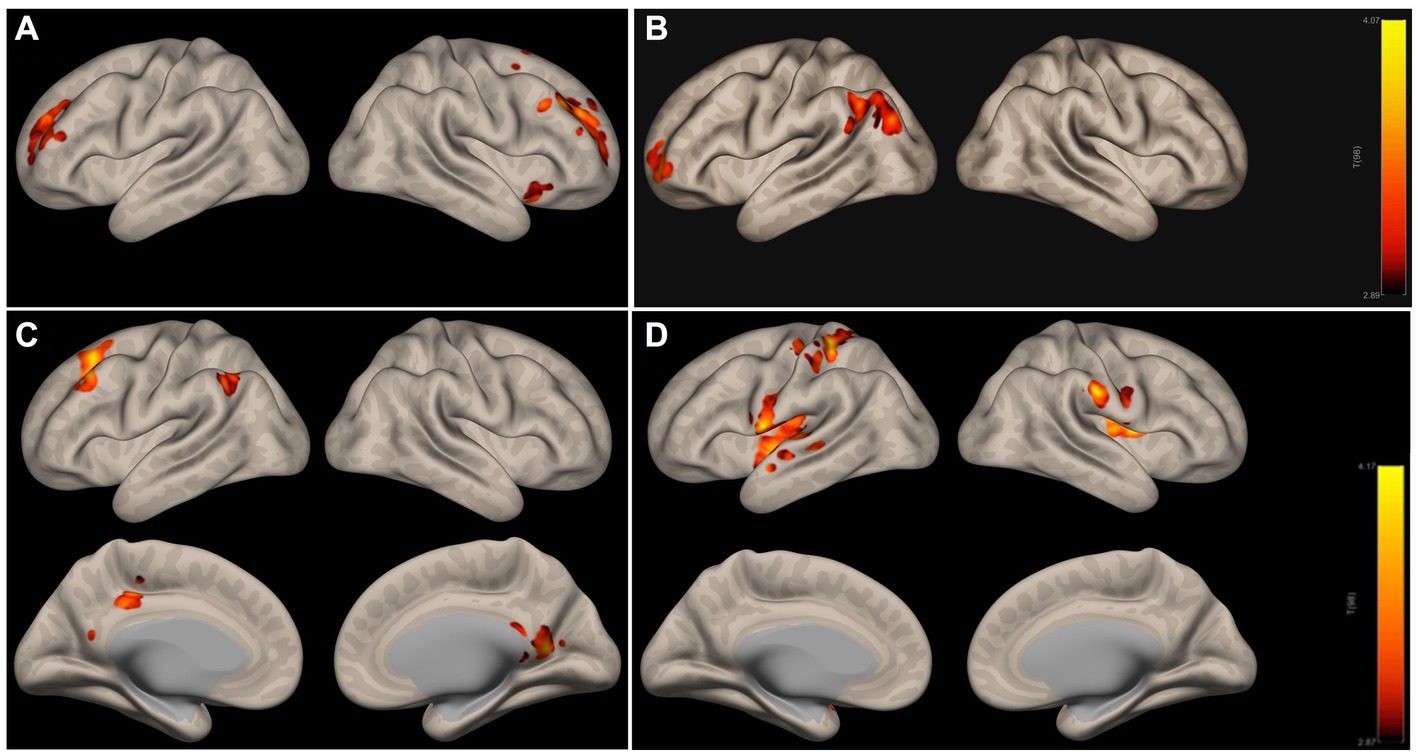
Figure 3. ICA networks with significant differences in AD (A,B) and LMCI (C,D) relative to CN. (A,B) Are subnetworks of DMN and SN; (C,D) are subnetworks of DMN and the motor network. The colorbar indicates the strength of IC weights, red indicates the strongest weight, and the color above red indicates the weaker weight. DMN, the default mode network; SN, salience network.
ICA networks in LMCI compared to CN are presented in Supplementary Table S4 and Figures 3C,D illustrate two examples, IC8 and IC22, which correspond to DMN’s subnetwork (precuneous cortex, posterior cingulate gyrus, left angular gyrus) and sensorimotor network (bilateral postcentral gyrus, left precentral gyrus, bilateral insular cortex), respectively.
3.3.3. The consistent inter-regional networks
We examined the consistence between structural covariance, functional connectivity, and ICA networks to identify consistent inter-regional connectivity patterns.
According to Tables 3, 4 and Supplementary Table S3, for AD comparing with CN, the subnetwork of DMN, which includes posterior cingulate gyrus and precuneous cortex, is the consistent inter-regional connective network of the above three networks, while a subnetwork of SN (anterior cingulate gyrus, bilateral paracingulate gyrus and frontal) and a subnetwork of sensorimotor network (bilateral precentral gyrus and right postcentral gyrus) are contained in both FC network and ICA network, but not in covariance network.
For LMCI comparing with CN, as indicated in Tables 3, 4 and Supplementary Table S4, no significant reduced functional connective network was found, while a subnetwork of DMN (posterior cingulate gyrus and precuneous) and the motor areas (right postcentral and precentral cortex), consistently presented in both structural covariance network and group-ICA network.
4. Discussion and conclusion
In this study, we integrated three approaches – structural covariance, functional connectivity, and group ICA – to identify inter-regional networks that distinguish AD/LMCI patients from controls. First, we separately derived patient-specific networks using each method: seed-based structural covariance, seed-based functional connectivity, and group-ICA approach. Then, we extracted regions with consistent connectivity differences across these three network types in patients compared to controls. This allowed us to generate robust inter-regional networks specifically disrupted in AD and LMCI.
Brain atrophy in AD examined on sMRI by manual or automatic technique has been extensively used for early prediction of AD, but it still exhibits low sensitivity and specificity (Vemuri and Jack, 2010; Pini et al., 2016; Lombardi et al., 2020). Compared to GMV, cortical thickness provides an index to neuro number and density in a specific area and is widely utilized for measuring cortical atrophy (Fischl and Dale, 2000; Cheng et al., 2015), detecting disease progression (Phillips et al., 2019), and early prediction (Canu et al., 2017) in AD. In this study, the CT analysis was employed using voxel-wise GLM and the cortical atrophied regions with CT reduction were identified in AD and LMCI. Our results of cortical thinning in AD are consistent with previous studies (Phillips et al., 2019; Putcha et al., 2019). However, LMCI exhibited less pronounced cortical atrophy only in left entorhinal and parahippocampal cortex. Compared to a previous study (Canu et al., 2017), these biased results may have been caused by the different clinical populations, MRI scanners and statistical methods.
It is now widely accepted that AD damage results from disrupted connectivity between brain regions (Nestor et al., 2017; Park et al., 2017; Grajski and Bressler, 2019; Neitzel et al., 2019; Putcha et al., 2019; Berron et al., 2020; Tetreault et al., 2020) rather than individual atrophied region. Numerous studies on structural covariance (Abela et al., 2015; Valk et al., 2017) and functional connectivity (Kuang et al., 2019; Berron et al., 2020; Smith et al., 2021) have been conducted by pre-defining ROI seeds based on prior knowledge. Although the ROI-based approach is more reliable (Smitha et al., 2017), these predefined seeds ignore abnormal changes outside the defined ROIs and fail to reflect alterations in particular dataset. Contrastingly, we defined cortical atrophy regions with the CT thinning as the automatic and data-driven seeds for inter-regional correlation analysis, including cortical covariance and functional connectivity. This facilitate clear interpretation of brain atrophy as disruption of between-region connectivity. Additionally, group-ICA has been utilized for identifying distinct functional networks in a variety of disease (Caspers et al., 2021; Geng et al., 2022). In the study, group-level ICA networks were identified in AD or LMCI compared to CN groups.
The results in Tables 3, 4 and Supplementary Tables S3, S4 indicate that for AD, a subnetwork including posterior cingulate and precuneous cortex exhibits reduced connective correlation in both structural covariance and functional connectivity as well as reduced IC weights. The similar reductions in connectivity are observed in structural covariance and group ICA network for LMCI. Interestingly, group ICA consistently identifies the DMN subnetwork in AD, and sensorimotor network in both AD and LMCI, which were not necessarily fully identified by structural covariance and functional connectivity. This suggests that group ICA holds promise in replacing functional connectivity and structural covariance correlation to investigate brain network to some degree. Moreover, some increased connectivity correlations, that were identified by our method, have previously been detected in amyloid-β + MCI patients (Berron et al., 2020) and aging (Yao et al., 2013) which were more random. These enhanced connective correlation may stem from compensation mechanism to maintain memory, but the interpretation of the mechanism remains challenging and therefore was not considered in our current study.
This study has several limitations that could be addressed in future work: (1) The ICA performance depends on parameter selection. The number of ICs was fixed at 40 based on default settings, but robustness could be improved by testing a range of 30–100 ICs. (2) Only clinical diagnoses were used to construct the GLM model. Incorporating PET biomarkers, such as levels of tau accumulation, could enhance prediction accuracy of morphological damage concerning AD pathology. (3) Subcortical regions and DTI-based structural connectivity were not yet considered. Adding mesoscale subcortical networks and white matter connectivity could provide a more comprehensive connectomic characterization of AD. (4) We only recruited the late MCI subjects in this study. Adding early MCI could help enable earlier prediction of AD progression. (5) The diagnostic performance needs validation. Studies have shown that the classification performance by combining statistically significant morphological and functional information was significantly improved (Park et al., 2017; Li et al., 2020; Zhang et al., 2022). Therefore, using classification algorithms and related evaluation metrics to evaluate the diagnostic performance of our inter-regional connectivity network will be the focus of our next work.
In summary, we used structural covariance, functional connectivity, and group ICA networks to identify disrupted inter-regional connectivity in AD and LMCI. Our results suggest that patients with AD and LMCI exhibit reduced inter-regional connectivity within subnetworks of typical brain networks, such as DMN. These differences in inter-regional connectivity distinguish AD/LMCI patients from controls and provide insights into network-level disruptions underlying the disease. Overall, our multi-modal connectivity analysis may elucidate mechanisms of cognitive decline and identify imaging markers for diagnosis of AD/LMCI.
Data availability statement
Publicly available datasets were analyzed in this study. This data can be found at: https://ida.loni.usc.edu/home/projectPage.jsp?project=ADNI.
Author contributions
XR: Conceptualization, Data curation, Investigation, Methodology, Software, Writing – original draft, Writing – review & editing. BD: Data curation, Software, Writing – review & editing. YL: Data curation, Methodology, Writing – review & editing. YW: Methodology, Project administration, Supervision, Writing – review & editing, Conceptualization. YH: Conceptualization, Investigation, Methodology, Supervision, Writing – review & editing, Project administration.
Alzheimer's Disease Neuroimaging Initiative
Data used in the preparation of this article were obtained from the Alzheimer’s Disease Neuroimaging Initiative (ADNI) database (adni.loni.usc.edu). As such, the investigators within the ADNI contributed to the design and implementation of ADNI and/or provided data but did not participate in the analysis or writing of this report. A complete listing of ADNI investigators can be found at: http://adni.loni.usc.edu/wp-content/uploads/how_to_apply/ADNI_Acknowledgement_List.pdf.
Funding
The author(s) declare financial support was received for the research, authorship, and/or publication of this article. This work was supported in part by the National Natural Science Foundation of China under Grant 62101365, and the Innovation and Entrepreneurship Project of Jiangsu Province under Grant JSSCB0220565.
Acknowledgments
Data collection and sharing for this project was funded by the ADNI (National Institutes of Health Grant U01 AG024904) and DOD ADNI (Department of Defense award number W81XWH-12-2-0012). ADNI is funded by the National Institute on Aging, the National Institute of Biomedical Imaging and Bioengineering, and through generous contributions from the following: AbbVie, Alzheimer’s Association; Alzheimer’s Drug Discovery Foundation; Araclon Biotech; BioClinica, Inc.; Biogen; Bristol-Myers Squibb Company; CereSpir, Inc.; Cogstate; Eisai Inc.; Elan Pharmaceuticals, Inc.; Eli Lilly and Company; EuroImmun; F. Hoffmann-La Roche Ltd. and its affiliated company Genentech, Inc.; Fujirebio; GE Healthcare; IXICO Ltd.; Janssen Alzheimer Immunotherapy Research & Development, LLC.; Johnson & Johnson Pharmaceutical Research & Development LLC.; Lumosity; Lundbeck; Merck & Co., Inc.; Meso Scale Diagnostics, LLC.; NeuroRx Research; Neurotrack Technologies; Novartis Pharmaceuticals Corporation; Pfizer Inc.; Piramal Imaging; Servier; Takeda Pharmaceutical Company; and Transition Therapeutics. The Canadian Institutes of Health Research is providing funds to support ADNI clinical sites in Canada. Private sector contributions are facilitated by the Foundation for the National Institutes of Health (www.fnih.org). The grantee organization is the Northern California Institute for Research and Education, and the study is coordinated by the Alzheimer’s Therapeutic Research Institute at the University of Southern California. The Laboratory disseminates ADNI data for Neuro Imaging at the University of Southern California.
Conflict of interest
The authors declare that the research was conducted in the absence of any commercial or financial relationships that could be construed as a potential conflict of interest.
Publisher’s note
All claims expressed in this article are solely those of the authors and do not necessarily represent those of their affiliated organizations, or those of the publisher, the editors and the reviewers. Any product that may be evaluated in this article, or claim that may be made by its manufacturer, is not guaranteed or endorsed by the publisher.
Supplementary material
The Supplementary material for this article can be found online at:
https://www.frontiersin.org/articles/10.3389/fnhum.2023.1276994/full#supplementary-material
Footnotes
References
Abela, E., Missimer, J. H., Federspiel, A., Seiler, A., Hess, C. W., Sturzenegger, M., et al. (2015). A thalamic-fronto-parietal structural covariance network emerging in the course of recovery from hand paresis after ischemic stroke. Front. Neurol. 6:211. doi: 10.3389/fneur.2015.00211
Andersson, J. L., Hutton, C., Ashburner, J., Turner, R., and Friston, K. (2001). Modeling geometric deformations in EPI time series. NeuroImage 13, 903–919. doi: 10.1006/nimg.2001.0746
Arbabshirani, M. R., Plis, S., Sui, J., and Calhoun, V. D. (2017). Single subject prediction of brain disorders in neuroimaging: promises and pitfalls. NeuroImage 145, 137–165. doi: 10.1016/j.neuroimage.2016.02.079
Ashburner, J. (2007). A fast diffeomorphic image registration algorithm. NeuroImage 38, 95–113. doi: 10.1016/j.neuroimage.2007.07.007
Ashburner, J., and Friston, K. J. (2005). Unified segmentation. NeuroImage 26, 839–851. doi: 10.1016/j.neuroimage.2005.02.018
Beheshtian, E., Jalilianhasanpour, R., Modir Shanechi, A., Sethi, V., Wang, G., Lindquist, M. A., et al. (2021). Identification of the somatomotor network from language task-based fMRI compared with resting-state fMRI in patients with brain lesions. Radiology 301, 178–184. doi: 10.1148/radiol.2021204594
Berron, D., van Westen, D., Ossenkoppele, R., Strandberg, O., and Hansson, O. (2020). Medial temporal lobe connectivity and its associations with cognition in early Alzheimer's disease. Brain 143, 1233–1248. doi: 10.1093/brain/awaa068
Calhoun, V. D., Adali, T., Pearlson, G. D., and Pekar, J. J. (2001). A method for making group inferences from functional MRI data using independent component analysis. Hum. Brain Mapp. 14, 140–151. doi: 10.1002/hbm.1048
Calhoun, V. D., Wager, T. D., Krishnan, A., Rosch, K. S., Seymour, K. E., Nebel, M. B., et al. (2017). The impact of T1 versus EPI spatial normalization templates for fMRI data analyses. Hum. Brain Mapp. 38, 5331–5342. doi: 10.1002/hbm.23737
Canu, E., Agosta, F., Mandic-Stojmenovic, G., Stojković, T., Stefanova, E., Inuggi, A., et al. (2017). Multiparametric MRI to distinguish early onset Alzheimer's disease and behavioural variant of frontotemporal dementia. NeuroImage 15, 428–438. doi: 10.1016/j.nicl.2017.05.018
Caspers, J., Rubbert, C., Eickhoff, S. B., Hoffstaedter, F., Südmeyer, M., Hartmann, C. J., et al. (2021). Within-and across-network alterations of the sensorimotor network in Parkinson’s disease. Neuroradiology 63, 2073–2085. doi: 10.1007/s00234-021-02731-w
Cheng, B., Schulz, R., Bönstrup, M., Hummel, F. C., Sedlacik, J., Fiehler, J., et al. (2015). Structural plasticity of remote cortical brain regions is determined by connectivity to the primary lesion in subcortical stroke. J. Cereb. Blood Flow Metab. 35, 1507–1514. doi: 10.1038/jcbfm.2015.74
Chumbley, J., Worsley, K., Flandin, G., and Friston, K. (2010). Topological FDR for neuroimaging. NeuroImage 49, 3057–3064. doi: 10.1016/j.neuroimage.2009.10.090
Dadi, K., Rahim, M., Abraham, A., Chyzhyk, D., Milham, M., Thirion, B., et al. (2019). Benchmarking functional connectome-based predictive models for resting-state fMRI. NeuroImage 192, 115–134. doi: 10.1016/j.neuroimage.2019.02.062
Dale, A. M., Fischl, B., and Sereno, M. (1999). Cortical surface-based analysis I. Segmentation and Surface Reconstruction. NeuroImage 9, 179–194. doi: 10.1006/nimg.1998.0395
Delli Pizzi, S., Punzi, M., and Sensi, S. L. (2019). Alzheimer's disease neuroimaging initiative, functional signature of conversion of patients with mild cognitive impairment. Neurobiol. Aging 74, 21–37. doi: 10.1016/j.neurobiolaging.2018.10.004
Erhardt, E. B., Rachakonda, S., Bedrick, E. J., Allen, E. A., Adali, T., and Calhoun, V. D. (2011). Comparison of multi-subject ICA methods for analysis of fMRI data. Hum. Brain Mapp. 32, 2075–2095. doi: 10.1002/hbm.21170
Fischl, B., and Dale, A. M. (2000). Measuring the thickness of the human cerebral cortex from magnetic resonance images. PNAS 97, 11050–11055. doi: 10.1073/pnas.200033797
Fischl, B., van der Kouwe, A., Destrieux, C., Halgren, E., Ségonne, F., Salat, D. H., et al. (2004). Automatically parcellating the human cerebral cortex. Cereb. Cortex 14, 11–22. doi: 10.1093/cercor/bhg087
Friston, K. J., Ashburner, J., Frith, C. D., Poline, J. B., Heather, J. D., and Frackowiak, R. S. (1995). Spatial registration and normalization of images. Hum. Brain Mapp. 3, 165–189. doi: 10.1002/hbm.460030303
Friston, K. J., Williams, S., Howard, R., Frackowiak, R. S., and Turner, R. (1996). Movement-related effects in fMRI time-series. Magn. Reson. Med. 35, 346–355. doi: 10.1002/mrm.1910350312
Geng, W., Zhang, J., Shang, S., Chen, H., Shi, M., Jiang, L., et al. (2022). Reduced functional network connectivity is associated with upper limb dysfunction in acute ischemic brainstem stroke. Brain Imaging Behav. 16, 802–810. doi: 10.1007/s11682-021-00554-0
Gorgolewski, K. J., Auer, T., Calhoun, V. D., Craddock, R. C., Das, S., Duff, E. P., et al. (2016). The brain imaging data structure, a format for organizing and describing outputs of neuroimaging experiments. Scientific Data 3, 1–9. doi: 10.1038/sdata.2016.44
Grajski, K. A., and Bressler, S. L. (2019). Alzheimer's disease neuroimaging, differential medial temporal lobe and default-mode network functional connectivity and morphometric changes in Alzheimer's disease. Neuroimage Clin 23:101860. doi: 10.1016/j.nicl.2019.101860
Hallquist, M. N., Hwang, K., and Luna, B. (2013). The nuisance of nuisance regression: spectral misspecification in a common approach to resting-state fMRI preprocessing reintroduces noise and obscures functional connectivity. NeuroImage 82, 208–225. doi: 10.1016/j.neuroimage.2013.05.116
Hyvarinen, A. (1999). Fast and robust fixed-point algorithms for independent component analysis. IEEE Transac. Neural. Network 10, 626–634. doi: 10.1109/72.761722
Kuang, L., Han, X., Chen, K., Caselli, R. J., Reiman, E. M., Wang, Y., et al. (2019). A concise and persistent feature to study brain resting-state network dynamics: findings from the Alzheimer's disease neuroimaging initiative. Hum. Brain Mapp. 40, 1062–1081. doi: 10.1002/hbm.24383
Li, W., Lin, X., and Chen, X. (2020). Detecting Alzheimer's disease based on 4D fMRI: an exploration under deep learning framework. Neurocomputing 388, 280–287. doi: 10.1016/j.neucom.2020.01.053
Lombardi, G., Crescioli, G., Cavedo, E., Lucenteforte, E., Casazza, G., Bellatorre, A. G., et al. (2020). Structural magnetic resonance imaging for the early diagnosis of dementia due to Alzheimer's disease in people with mild cognitive impairment. Cochrane Database Syst. Rev. 3:CD009628. doi: 10.1002/14651858.CD009628.pub2
Neitzel, J., Franzmeier, N., Rubinski, A., and Ewers, M. (2019). Left frontal connectivity attenuates the adverse effect of entorhinal tau pathology on memory. Neurology 93, e347–e357. doi: 10.1212/WNL.0000000000007822
Nestor, S. M., Mišić, B., Ramirez, J., Zhao, J., Graham, S. J., Verhoeff, N. P. L. G., et al. (2017). Small vessel disease is linked to disrupted structural network covariance in Alzheimer's disease. Alzheimers Dement. 13, 749–760. doi: 10.1016/j.jalz.2016.12.007
Nieto-Castanon, A. (2020). Handbook of functional connectivity magnetic resonance imaging methods in CONN. Hilbert Press.
Nieto-Castanon, A., and Whitfield-Gabrieli, S. (2022). CONN functional connectivity toolbox: RRID SCR_009550, release 22. Hilbert Press Manual/Technical Report Library.
Park, J. E., Park, B., Kim, S. J., Kim, H. S., Choi, C. G., Jung, S. C., et al. (2017). Improved diagnostic accuracy of Alzheimer's disease by combining regional cortical thickness and default mode network functional connectivity: validated in the Alzheimer's disease neuroimaging initiative set. Korean J. Radiol. 18, 983–991. doi: 10.3348/kjr.2017.18.6.983
Penny, W. D., Friston, K. J., Ashburner, J. T., Kiebel, S. J., and Nichols, T. E. (2011). Statistical parametric mapping: the analysis of functional brain images. Academic Press. an imprint of Elsevier.
Phillips, J. S., da Re, F., Irwin, D. J., McMillan, C. T., Vaishnavi, S. N., Xie, S. X., et al. (2019). Longitudinal progression of grey matter atrophy in non-amnestic Alzheimer's disease. Brain 142, 1701–1722. doi: 10.1093/brain/awz091
Pini, L., Pievani, M., Bocchetta, M., Altomare, D., Bosco, P., Cavedo, E., et al. (2016). Brain atrophy in Alzheimer's disease and aging. Ageing Res. Rev. 30, 25–48. doi: 10.1016/j.arr.2016.01.002
Power, J. D., Mitra, A., To, L., Snyder, A. Z., Schlaggar, B. L., and Petersen, S. E. (2014). Methods to detect, characterize, and remove motion artifact in resting state fMRI. NeuroImage 84, 320–341. doi: 10.1016/j.neuroimage.2013.08.048
Putcha, D., Brickhouse, M., Wolk, D. A., and Dickerson, B. C., Alzheimer's Disease Neuroimaging Initiative (2019). Alzheimer's disease neuroimaging initiative., fractionating the Rey auditory verbal learning test: distinct roles of large-scale cortical networks in prodromal Alzheimer's disease. Neuropsychologia 129, 83–92. doi: 10.1016/j.neuropsychologia.2019.03.015
Smith, R. X., Strain, J. F., Tanenbaum, A., Fagan, A. M., Hassenstab, J., McDade, E., et al. (2021). Resting-state functional connectivity disruption as a pathological biomarker in autosomal dominant Alzheimer disease. Brain Connect. 11, 239–249. doi: 10.1089/brain.2020.0808
Smitha, K. A., Akhil Raja, K., Arun, K. M., Rajesh, P. G., Thomas, B., Kapilamoorthy, T. R., et al. (2017). Resting state fMRI: a review on methods in resting state connectivity analysis and resting state networks. Neuroradiol. J. 30, 305–317. doi: 10.1177/1971400917697342
Son, S. J., Hong, C. H., Kim, N. R., Choi, J. W., Roh, H. W., Lee, H., et al. (2022). Structural covariance changes in major cortico-basal ganglia and thalamic networks in amyloid-positive patients with white matter hyperintensities. Neurobiol. Aging 117, 117–127. doi: 10.1016/j.neurobiolaging.2022.05.010
Tetreault, A. M., Phan, T., Orlando, D., Lyu, I., Kang, H., Landman, B., et al. (2020). Network localization of clinical, cognitive, and neuropsychiatric symptoms in Alzheimer's disease. Brain 143, 1249–1260. doi: 10.1093/brain/awaa058
Tuladhar, A. M., Reid, A. T., Shumskaya, E., de Laat, K. F., van Norden, A. G., van Dijk, E. J., et al. (2015). Relationship between white matter hyperintensities, cortical thickness, and cognition. Stroke 46, 425–432. doi: 10.1161/STROKEAHA.114.007146
Valk, S. L., Bernhardt, B. C., Böckler, A., Trautwein, F. M., Kanske, P., and Singer, T. (2017). Socio-cognitive phenotypes differentially modulate large-scale structural covariance networks. Cereb. Cortex 27, 1358–1368. doi: 10.1093/cercor/bhv319
Vemuri, P., and Jack, C. R. (2010). Role of structural MRI in Alzheimer's disease. Alzheimers Res. Ther. 2, 1–10. doi: 10.1186/alzrt47
Whitfield-Gabrieli, S., and Nieto-Castanon, A. (2012). Conn: a functional connectivity toolbox for correlated and anticorrelated brain networks. Brain Connect. 2, 125–141. doi: 10.1089/brain.2012.0073
Whitfield-Gabrieli, S., Nieto-Castanon, A., and Ghosh, S., Artifact detection tools (ART). Cambridge, MA: Artifact Detection Tools (RRID:SCR_005994). Organization: MIT. Center: The Gabrieli Lab. McGovern Institute for Brain Research (2011). 7: 11.
Worsley, K. J., Marrett, S., Neelin, P., Vandal, A. C., Friston, K. J., and Evans, A. C. (1996). A unified statistical approach for determining significant signals in images of cerebral activation. Hum. Brain Mapp. 4, 58–73. doi: 10.1002/(SICI)1097-0193(1996)4:1<58::AID-HBM4>3.0.CO;2-O
Yan, C. G., Yang, Z., Colcombe, S. J., Zuo, X. N., and Milham, M. P. (2017). Concordance among indices of intrinsic brain function: insights from inter-individual variation and temporal dynamics. Sci. Bull. 62, 1572–1584. doi: 10.1016/j.scib.2017.09.015
Yao, Y., Lu, W. L., Xu, B., Li, C. B., Lin, C. P., Waxman, D., et al. (2013). The increase of the functional entropy of the human brain with age. Sci. Rep. 3, 1–8. doi: 10.1038/srep02853
Yu, M., Sporns, O., and Saykin, A. J. (2021). The human connectome in Alzheimer disease - relationship to biomarkers and genetics. Nat. Rev. Neurol. 17, 545–563. doi: 10.1038/s41582-021-00529-1
Zhang, Y., Zhang, H., Adeli, E., Chen, X., Liu, M., and Shen, D. (2022). Multiview feature learning with multiatlas-based functional connectivity networks for MCI diagnosis. IEEE Trans Cybern 52, 6822–6833. doi: 10.1109/TCYB.2020.3016953
Zhao, Q., Sang, X., Metmer, H., Swati, Z. N. N. K., and Lu, J., Alzheimer's Disease NeuroImaging Initiative (2019). Alzheimer's disease NeuroImaging initiative, functional segregation of executive control network and frontoparietal network in Alzheimer's disease. Cortex 120, 36–48. doi: 10.1016/j.cortex.2019.04.026
Keywords: cortical thickness, cortical covariance network, vortex-wise general linear model, seed-based functional connectivity, group-level independent component analysis
Citation: Ren X, Dong B, Luan Y, Wu Y, Huang Y and the Alzheimer's Disease Neuroimaging Initiative (2023) Alterations via inter-regional connective relationships in Alzheimer’s disease. Front. Hum. Neurosci. 17:1276994. doi: 10.3389/fnhum.2023.1276994
Edited by:
Chen Li, Northeastern University, ChinaReviewed by:
Siyuan Liu, Dalian Maritime University, ChinaYingchun Zhang, University of Houston, United States
Copyright © 2023 Ren, Dong, Luan, Wu, Huang and the Alzheimer's Disease Neuroimaging Initiative. This is an open-access article distributed under the terms of the Creative Commons Attribution License (CC BY). The use, distribution or reproduction in other forums is permitted, provided the original author(s) and the copyright owner(s) are credited and that the original publication in this journal is cited, in accordance with accepted academic practice. No use, distribution or reproduction is permitted which does not comply with these terms.
*Correspondence: Yunzhi Huang, aHVhbmdfeXVuemhpQG51aXN0LmVkdS5jbg==; Ye Wu, d3V5ZUBuanVzdC5lZHUuY24=
†These authors have contributed equally to this work and share first authorship