 K. Rasool Reddy1
 Durga Prasad Bavirisetti
- 1Department of Electronics and Communication Engineering, Malla Reddy College of Engineering and Technology (MRCET), Hyderabad, India
- 2Department of Computer Science and Engineering (Data Science), Prasad V. Potluri Siddhartha Institute of Technology (PVPSIT), Vijayawada, India
- 3Department of Electronics and Communication Engineering, Vignan’s Institute of Engineering for Women (VIEW), Visakhapatnam, India
- 4Department of Computer Science, Norwegian University of Science and Technology (NTNU), Trondheim, Norway
Introduction: Brain tumors arise due to abnormal growth of cells at any brain location with uneven boundaries and shapes. Usually, they proliferate rapidly, and their size increases by approximately 1.4% a day, resulting in invisible illness and psychological and behavioral changes in the human body. It is one of the leading causes of the increase in the mortality rate of adults worldwide. Therefore, early prediction of brain tumors is crucial in saving a patient’s life. In addition, selecting a suitable imaging sequence also plays a significant role in treating brain tumors. Among available techniques, the magnetic resonance (MR) imaging modality is widely used due to its noninvasive nature and ability to represent the inherent details of brain tissue. Several computer-assisted diagnosis (CAD) approaches have recently been developed based on these observations. However, there is scope for improvement due to tumor characteristics and image noise variations. Hence, it is essential to establish a new paradigm.
Methods: This paper attempts to develop a new medical decision-support system for detecting and differentiating brain tumors from MR images. In the implemented approach, initially, we improve the contrast and brightness using the tuned single-scale retinex (TSSR) approach. Then, we extract the infected tumor region(s) using maximum entropy-based thresholding and morphological operations. Furthermore, we obtain the relevant texture features based on the non-local binary pattern (NLBP) feature descriptor. Finally, the extracted features are subjected to a support vector machine (SVM), K-nearest neighbors (KNN), random forest (RF), and GentleBoost (GB).
Results: The presented CAD model achieved 99.75% classification accuracy with 5-fold cross-validation and a 91.88% dice similarity score, which is higher than the existing models.
Discussions: By analyzing the experimental outcomes, we conclude that our method can be used as a supportive clinical tool for physicians during the diagnosis of brain tumors.
1. Introduction
Magnetic resonance (MR) imaging is a widely used noninvasive imaging sequence for the visualization of various brain abnormalities since it offers high-contrast human brain tissue images (Westbrook, 2014). Hence, researchers are working extensively on MR images to identify brain abnormalities and other soft tissue details in medical applications (Ullah et al., 2020). There are many methods have been proposed in recent years for detecting tumors from brain MR images. Among them, computer-aided diagnosis (CAD) based approaches have received significant attention since they speed up the diagnostic process and substantially minimize manual intervention (Tiwari et al., 2020). Typically, these techniques include pre-processing, feature extraction, feature selection and reduction, and classification (Abd-Ellah et al., 2016).
Pre-processing is a fundamental step in the analysis of brain MR images. In this phase, noise and other artifacts are removed from the MR brain images to make them suitable for subsequent stages. It can be achieved by using image enhancement approaches (Garg and Juneja, 2019). Usually, these techniques improve the image’s visual quality, and one can easily obtain information.
In the feature extraction phase, identifying the significant features present in the brain MR images results in better knowledge about the image. Usually, these features capture the inherent details of the source images. Texture feature extraction techniques are popular among the available methods, including statistical and structural, transform, model, graph, learning, and entropy-based methods (Humeau-Heurtier, 2019).
Feature selection and reduction techniques play a vital role in improving the accuracy of classification. Typically, they reduce the number of features or attributes in a dataset. These two approaches are used for the same purpose, but they have significant differences. Feature selection excludes features with missing values, low variance attributes, and highly correlated attributes without changing them. At the same time, feature reduction simplifies the problem space from higher to lower dimensions. The most frequently used reduction methods are: principal component analysis (PCA), kernel PCA (KPCA), probabilistic PCA (PPCA), linear discriminant analysis (LDA), etc. However, these are optional for models where the features are limited.
Finally, the selected or reduced attributes are applied to a classifier at the classification level to distinguish between healthy and pathological brain MR images. Recently, in most of the literature, supervised learning approaches such as support vector machine (SVM), K-nearest neighbors (KNN), logistic regression (LR), naive Bayes (NB), boosting and bagging, random forest (RF), and neural network-based classifiers have been used for adequate classification.
Based on the above discussion, recently, several CAD methods have been introduced (Mohan and Subashini, 2018; Rao and Karunakara, 2021). We discuss a few of the latest strategies and summarize the techniques’ limitations.
Mudda et al. (2020) implemented an improved brain tumor classification framework based on the gray-level run-length matrix (GLRLM), center-symmetric local binary patterns (CS-LBP), and artificial neural network (ANN). Sumathi and Mandadi (2021) developed an automated segmentation approach using kernel-based probabilistic C-means (KPCM), particle swarm optimization (PSO) and morphological operations. Paul and Sivarani (2020) designed a CAD approach to detect MR-based brain tumors using fuzzy K-means clustering (FKM), gray-level co-occurrence matrix (GLCM), and a bag of visual word (BOVW) classifier. Lu et al. (2018) proposed a novel framework for the early detection of brain tumors using wavelet energy features and a kernel-based extreme learning machine (K-LEM).
Rajesh et al. (2019) suggested a novel system for the efficient segmentation and classification of brain MR images using rough set theory (RST) and a particle swarm optimization-based neural network (PSONN). Veeramuthu et al. (2022) developed a combined feature and image-based classifier (CFIC) for the classification of brain MR images. Kanmani and Marikkannu (2018) developed a CAD system for improving classification and segmentation accuracy using threshold-based region optimization (TBRO) and corner detection approaches. Selvapandian and Manivannan (2018) proposed an automated brain tumor segmentation approach using GLCM, GLRLM, and gradient boosting. Habib et al. (2021) implemented a hybrid methodology for detecting and classifying MR-based brain tumors.
Sumathi et al. (2021) suggested an automated methodology for the early detection of brain tumors based on cuckoo search and the KNN classifier. Singh et al. (2020) designed a hybrid framework using the discrete wavelet transform (DWT), independent component analysis (ICA), and SVM. Sandhya et al. (2020) proposed an efficient brain tumor segmentation approach using a self-organizing map (SOM)-based active contour model (SOM-ACM). Polepaka et al. (2020) developed an enhanced CAD approach using local-binary patterns (LBP) and an SVM classifier.
Hua et al. (2021) presented a novel brain tumor segmentation approach using an improved multiview fuzzy C-means clustering algorithm. Younis et al. (2022) implemented an ensemble learning model for the early diagnosis of MR-based brain tumors. Mandle et al. (2022) suggested an automated detection framework for segmenting and classifying brain tumors in MR images using DWT, PCA, and kernel-based SVM (K-SVM). Behera et al. (2022) developed an ensemble deep transfer learning model using simple linear iterative clustering (SLIC) and convolutional neural networks (CNN).
Rupesh kumar et al. (Kolla et al., 2022) suggested an intelligent design for detecting and classifying brain tumors using CNN, LBP, and a multi-layered SVM approach. Priyanka et al. (Modiya and Vahora, 2022) presented an enhanced MR-based brain tumor classification methodology using EfficientNet-B7 with transfer learning and PCA. Srinivas et al. (2022) proposed a pre-trained CNN model such as VGG-16 with transfer learning to detect brain abnormality from MR images. Rahman and Islam (2023) implemented a parallel deep CNN (PDCNN) architecture for detecting MR-based brain tumors.
1.1. Research gaps
From an analysis of the above literature, the following observations emerged.
(1) Some methods used wavelet-based feature extraction techniques but showed poor directionality and introduced artifacts around edges. Therefore, they fail to extract complete texture details at the edges.
(2) Some mechanisms utilize second- and higher-order statistical texture features such as GLCM and GLRLM. However, they ignore local texture details because they omit an image’s spatial relationship between distinct local texture patterns.
(3) A few approaches have applied LBP and its variants to extract meaningful local texture information. However, they failed to establish the relationship between central pixels and outside neighborhood pixels. As a result, some significant texture features could be lost.
(4) A few models recommend CNN-based brain tumor detection approaches, but these require a lot of data to train the model, and high computational complexity. Besides that, selecting the number of convolutional layers, epochs, and other training parameters like batch size, optimization technique, and the learning rate is a difficult task.
(5) In most approaches, conventional image enhancement techniques, such as median and average filters, and histogram equalization, were used to remove unwanted image noise. However, some fine details in the image must be recovered in their approaches.
To address the problems reported above, we propose a new approach for detecting and differentiating brain MR images based on tuned single-scale retinex (TSSR), entropy-based thresholding, non-local binary pattern (NLBP) descriptor, and supervised learning approaches such as SVM, KNN, RF and GentleBoost (GB).
1.2. Highlights of the proposed study
The significant contributions of the proposed approach are as follows:
(1) A retinex model is utilized to enhance the brightness/contrast of brain MR images to improve the suggested segmentation and classification model’s performance. The significant advantage of this approach is describing human visual perception.
(2) Maximum entropy-based image thresholding and morphological operations are employed to differentiate tumor and non-tumor areas of brain MR images. This process significantly extracts both single and multiple tumor regions.
(3) We implemented a new feature descriptor such as NLBP to extract meaningful texture details for efficient classification. This technique considers the structural relationships between a local patch and a global image. As a result, we can adequately capture hidden information in the image by interacting with pixels outside the neighborhood region, which is a significant contribution to our proposed model.
(4) To accurately estimate the model’s performance, we employed K-fold cross-validation since it minimizes the bias and reduces the computational cost.
The rest of the work is organized as follows: In Section “2. Methodology,” we explore the description of the proposed technique, which includes tumor segmentation, feature extraction, and classification. In “Section 3. Results and discussion,” the segmentation and classification outcomes of both the presented and existing approaches are analyzed, and finally, in Section “4. Conclusion and future scope,” we describe the conclusion of the proposed system.
2. Methodology
The proposed model includes four modules: image enhancement using TSSR, image segmentation by entropy-based thresholding along with morphological operations, feature extraction with the NLBP texture descriptor, and classification using SVM, KNN, RF, and GB, as shown in Figure 1.
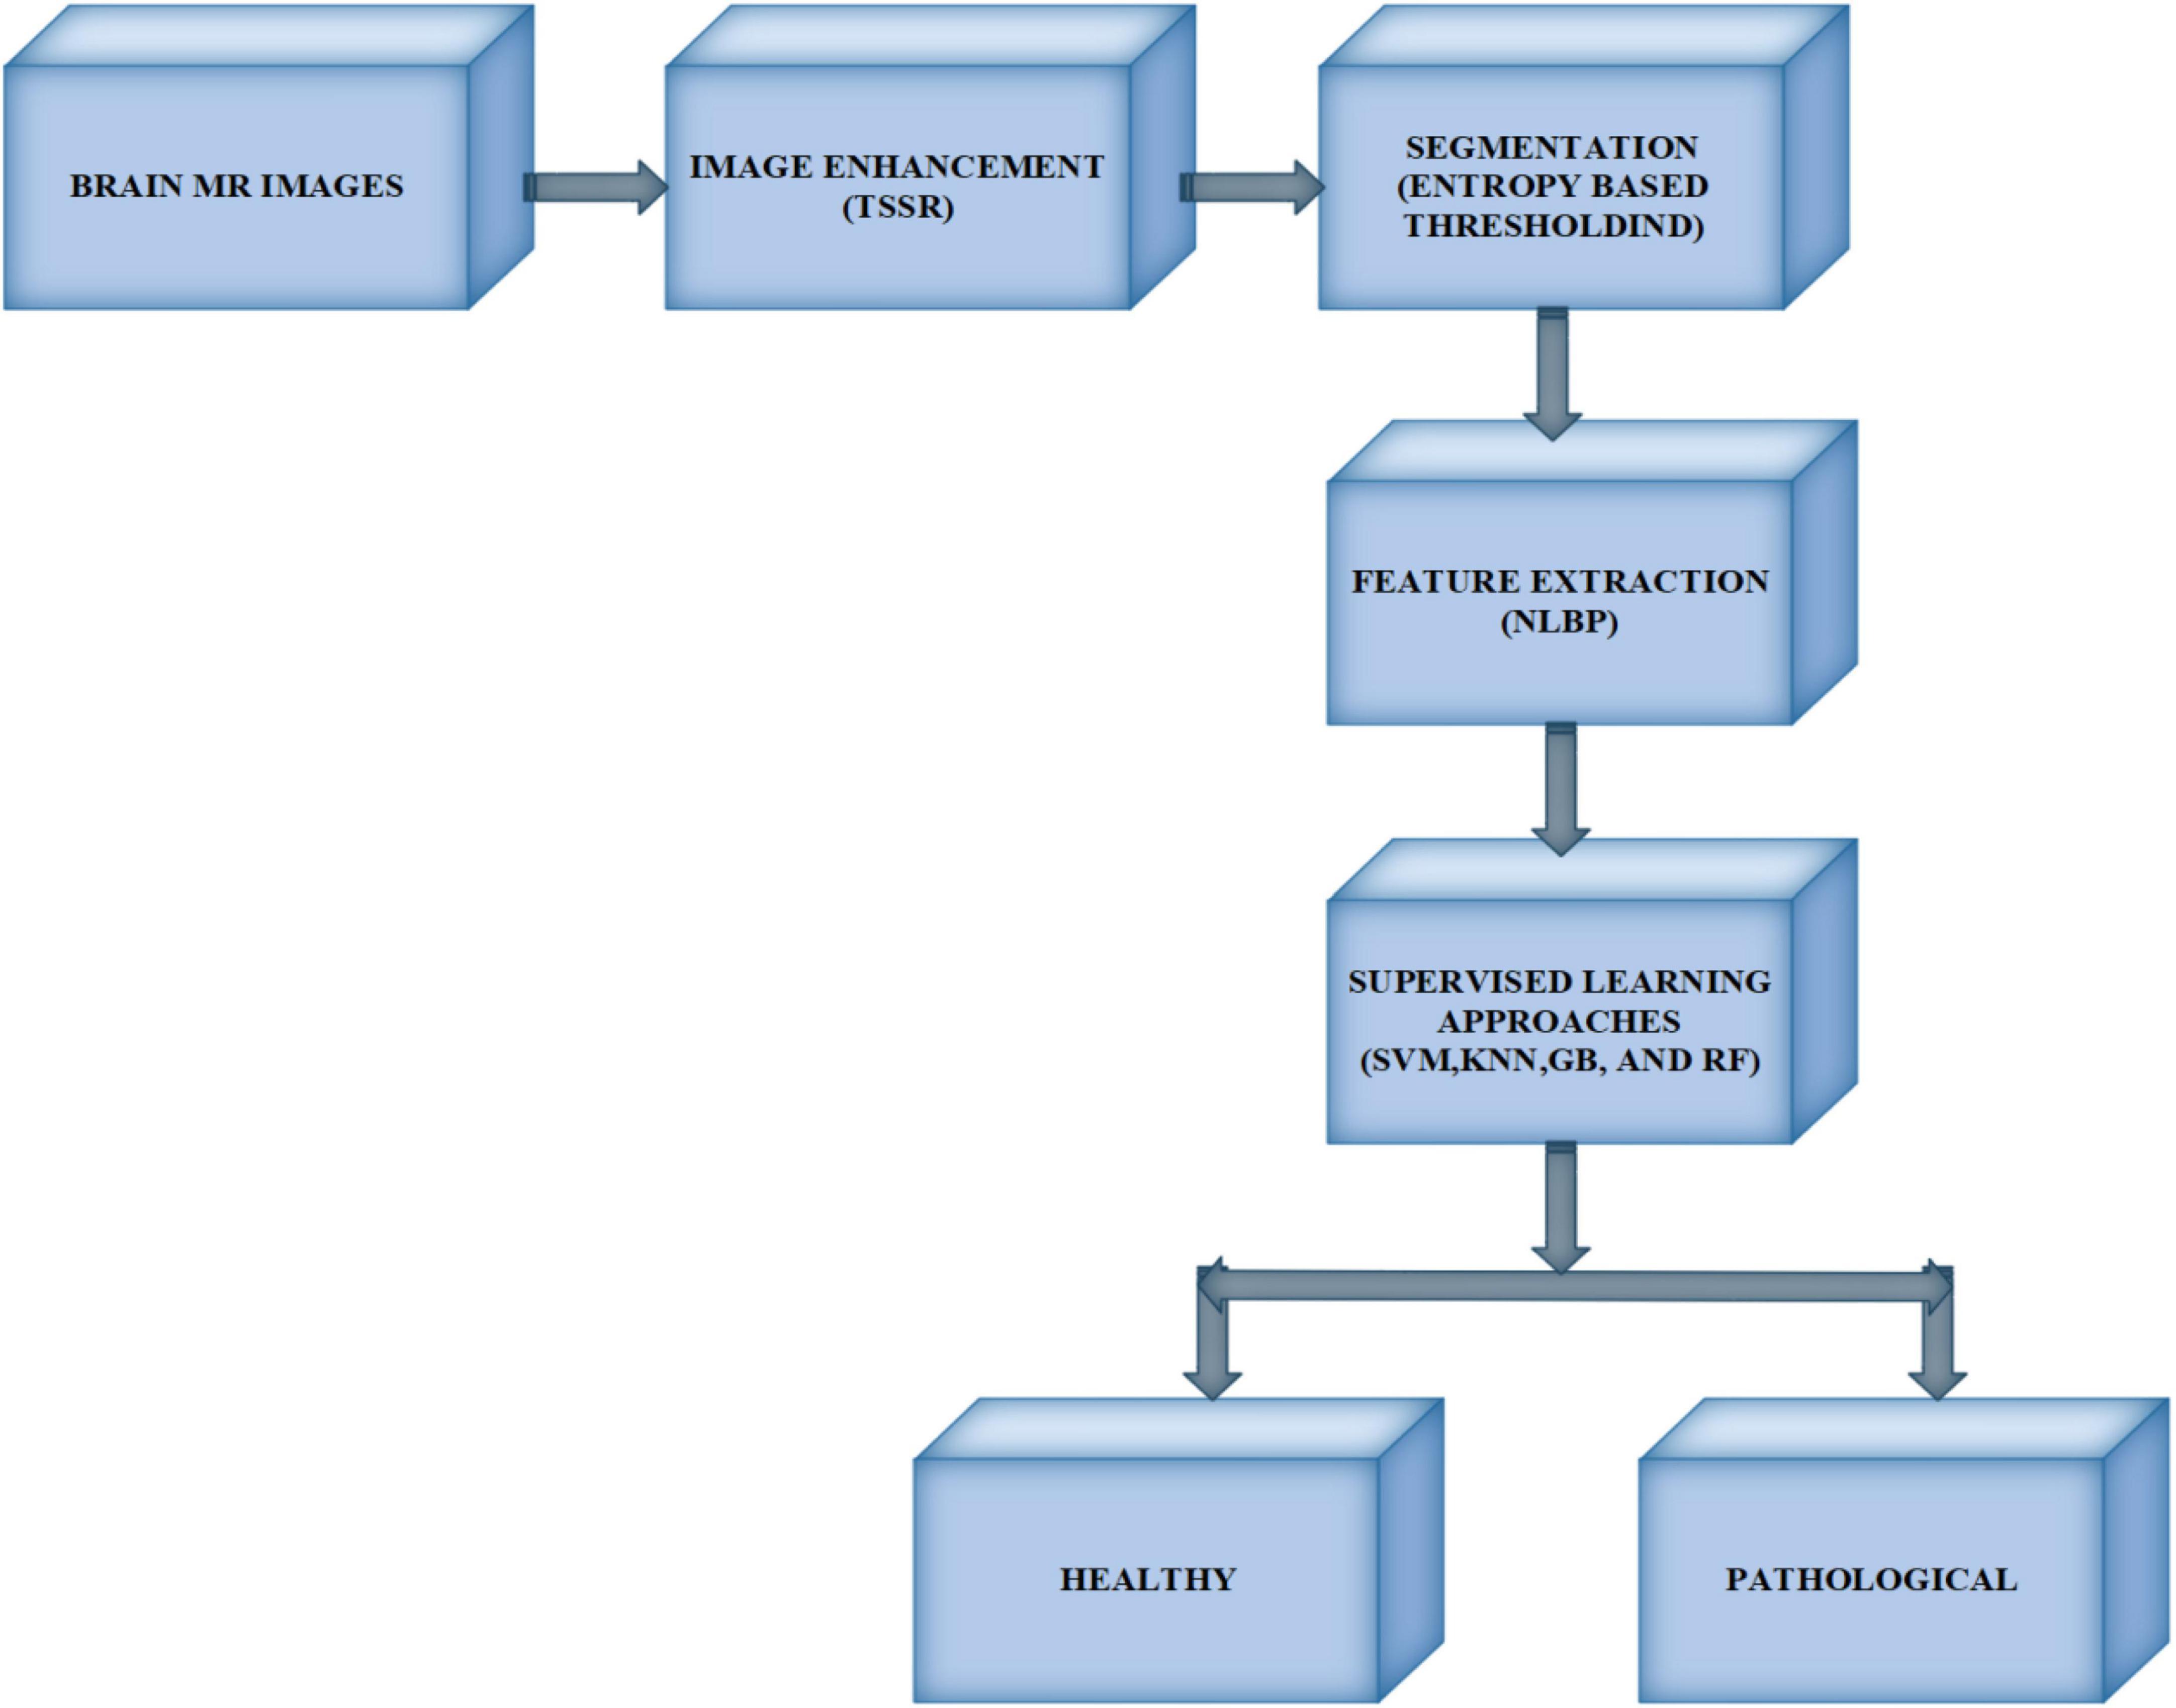
Figure 1. Block diagram of the proposed framework.
2.1. Image enhancement
The MR imaging sequence is an essential diagnostic tool for analyzing medical images, and it is used to visualize the inherent structure of the human body. However, during the acquisition process, MR images suffer from several types of image noise (Boyat and Joshi, 2015) due to environmental factors, particularly illumination. Thus, the input images may lose precise information and reduce image quality, severely impacting practitioners during disease examination. Therefore, acquiring good-quality MR images is vital in improving detection accuracy. For this purpose, a tuned single-scale retinex (TSSR) approach has been implemented (Al-Ameen and Sulong, 2016). With this method, the contrast and brightness of MR brain images greatly improved without losing fine details compared to existing systems (Garg and Juneja, 2019). The mathematical representation of the TSSR is as follows:
where M(x,y) is the original image; L represents the dimensions of the image; W and V represent the gradient along the x and y directions, respectively; K denotes the normalization factor; g(x,y) signifies the modified Gaussian function; ‘*’ indicates the convolution operator; and ξ is an arbitrary constant that controls the brightness and contrast of an image. In this work, we chose ξ as 1.5. The resulting outcomes of TSSR are shown in Figure 2 as well as Figures 3, 4A–H. We observed that using the TSSR method, we improve the visual details of the affected tumor region compared to source images. As a result, the proposed model effectively detects and distinguishes tumors from enhanced MR brain images. After that, we performed image segmentation to extract the infected area of the brain tumor.
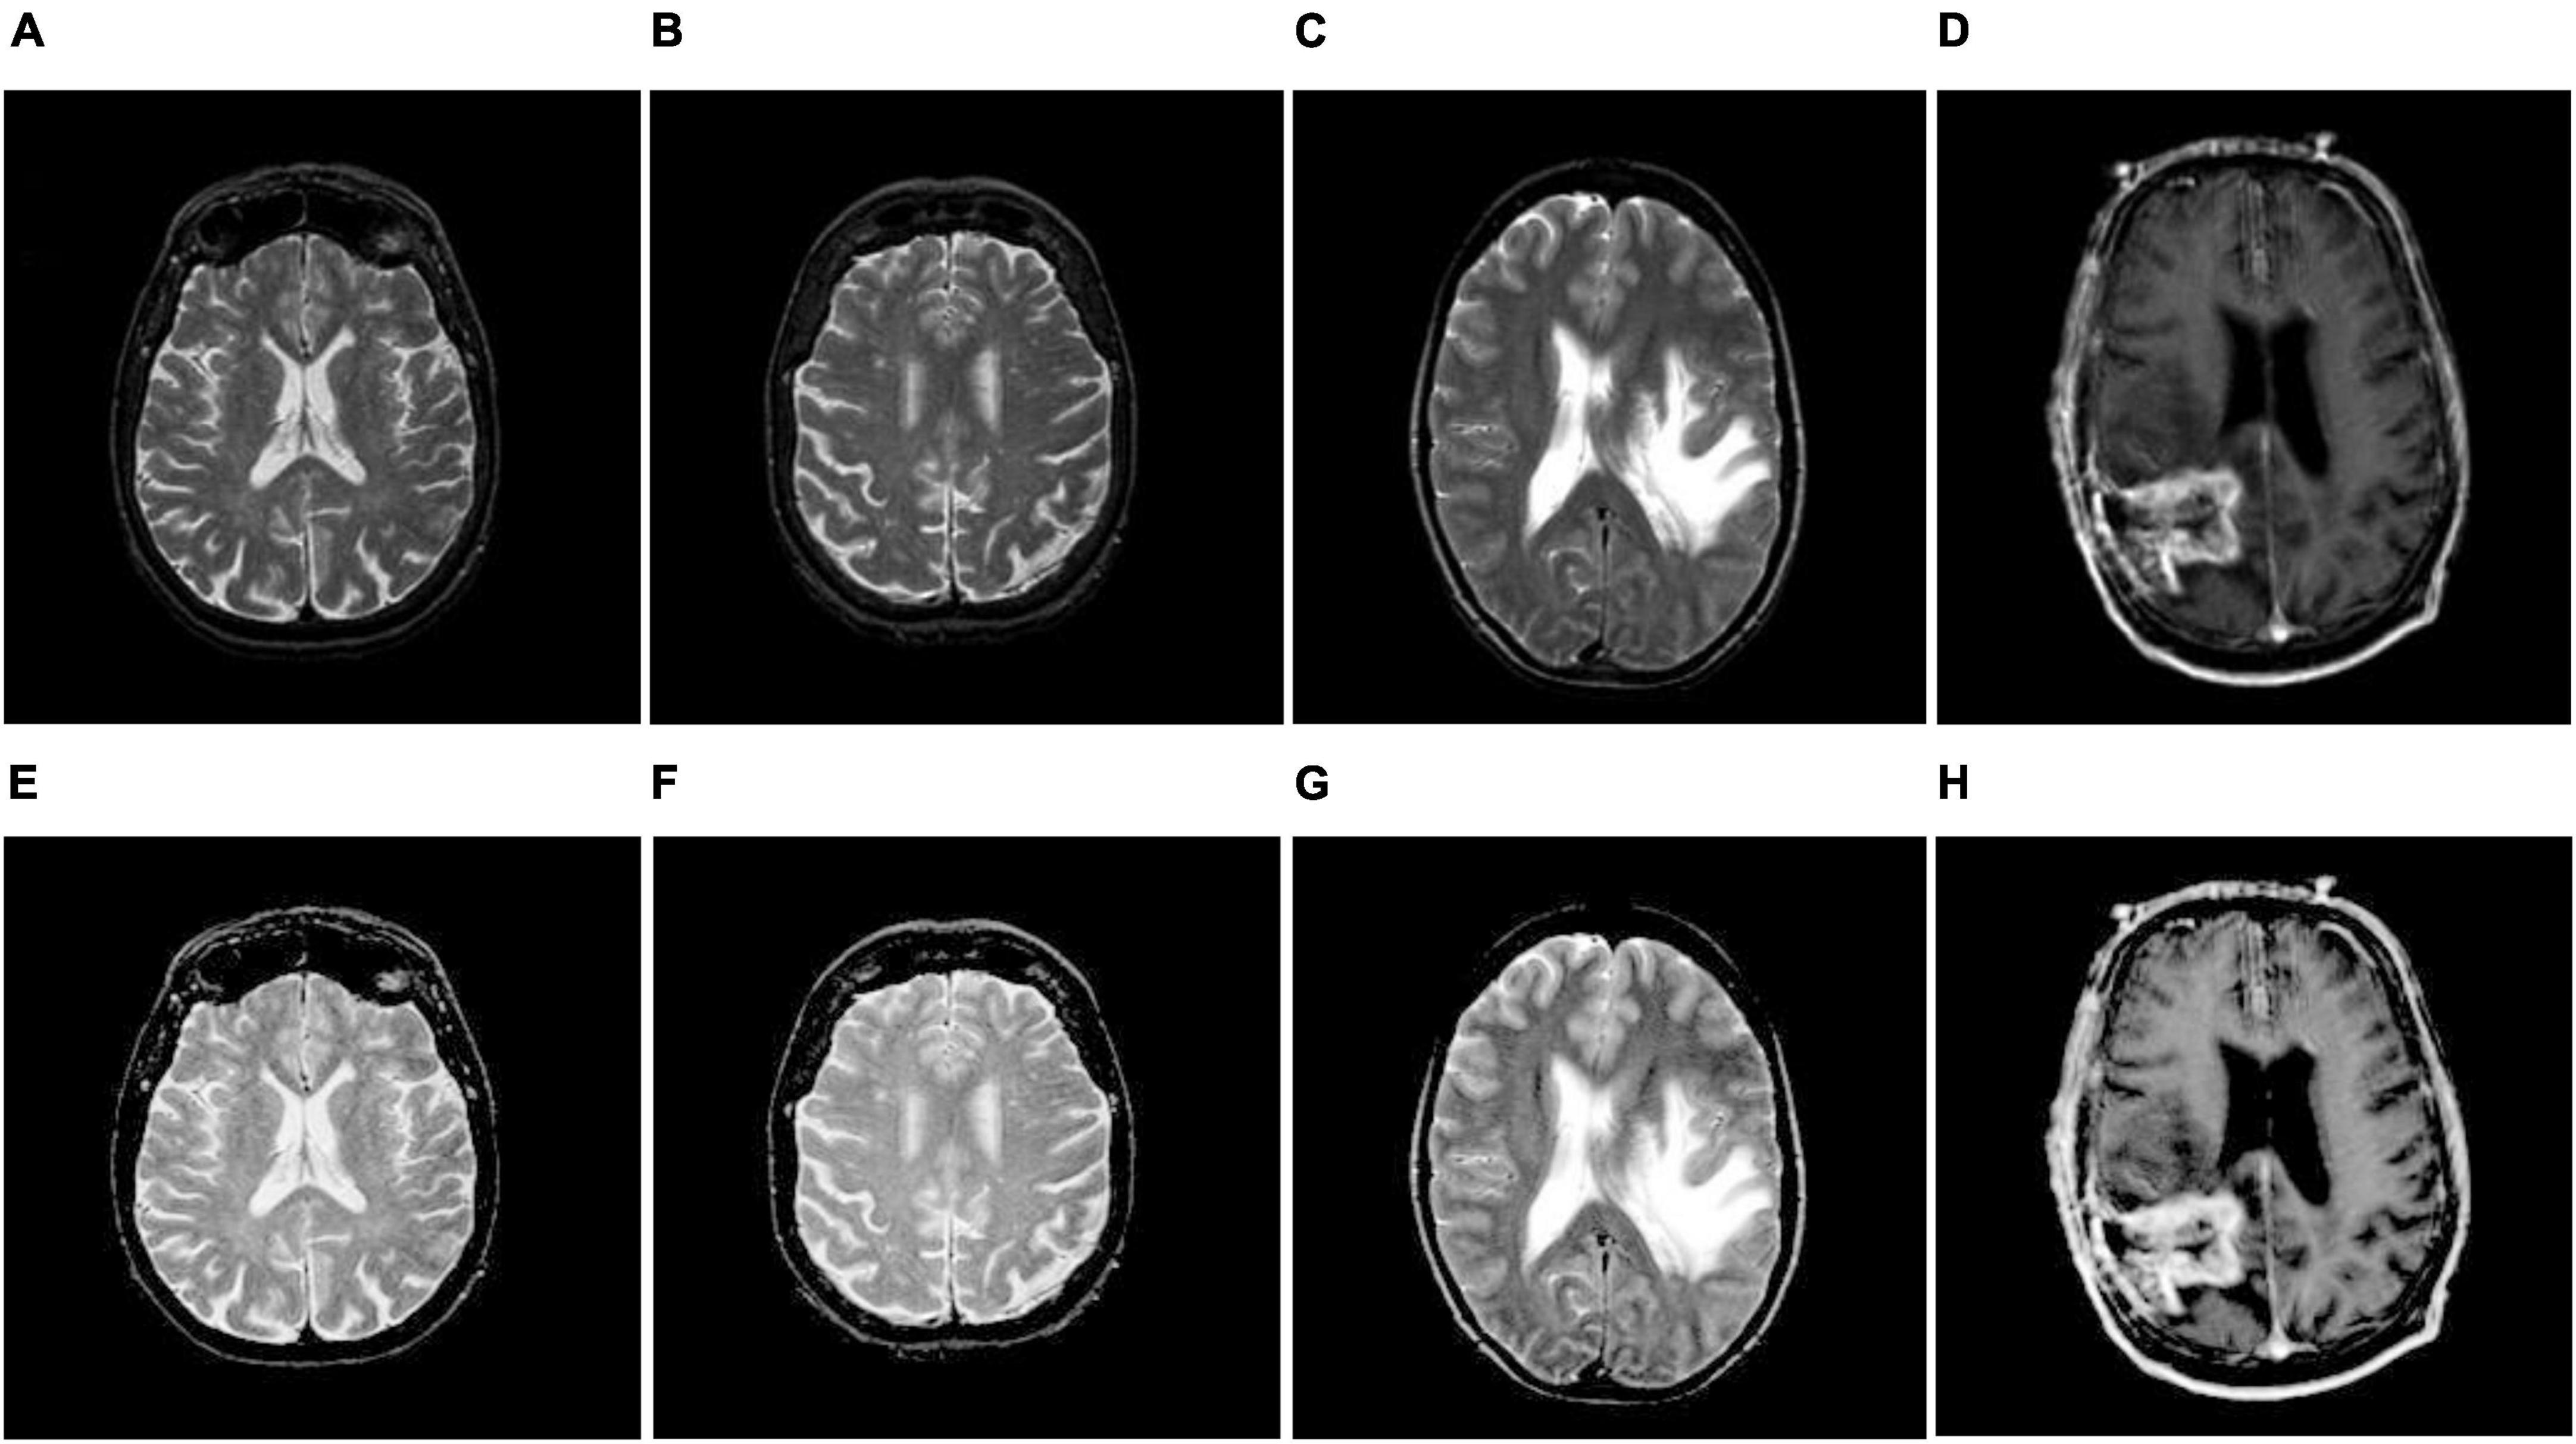
Figure 2. Brain MR image enhancement. (A–D) Original brain MR images; (E–H) enhanced brain MR images.

Figure 3. Illustration of the suggested segmentation approach (single tumor): (A–D) Input images; (E,H) enhancement using TSSR; (I–L) lumor extraction by entropy-based thresholding; (M–P) post-processing using mathematical morphology.
2.2. Image segmentation
Image segmentation is a frequently used approach in medical imaging to assist radiologists during the treatment planning of brain tumors. Here, the main objective is to obtain the region-of-interest (ROI) or infected tumor area from MR-based brain tumors. Recently, several segmentation frameworks have been introduced (Rao and Karunakara, 2021). However, it is challenging due to the low sensitivity of boundary pixels and tumor characteristic variations. Therefore, maximum entropy-based image thresholding and morphological operations have been introduced. The following steps are involved in the proposed brain tumor segmentation:
(1) First, we estimate the histogram of the source image I and then calculate the probability p of each grayscale.
(2) Divide the image I into two regions R1 (foreground) and R2 (background) over a threshold, t(0 < =t < L−1). Here, Lis the number of intensity levels.
(3) Evaluate the probability density function of R1 and R2 as follows:
where, and
(4) Under each threshold value t, calculate the total entropy H
where, H1, H2 are the entropies of R1, R2, and they are estimated by
(5) Evaluate the optimal threshold value, Topt by choosing the maximum entropy Hmax and then divide it by the maximum pixel intensity value of an image.
(6) We separate the infected area from MR images based on the thresholding value obtained in step 5, and the corresponding implications are shown in Figures 3, 4I–L. From there, we observe that we relatively extract the ROI (tumor) during this process, but there is a scope for enhancement since they continue to show unnecessary spurious spots or dots.
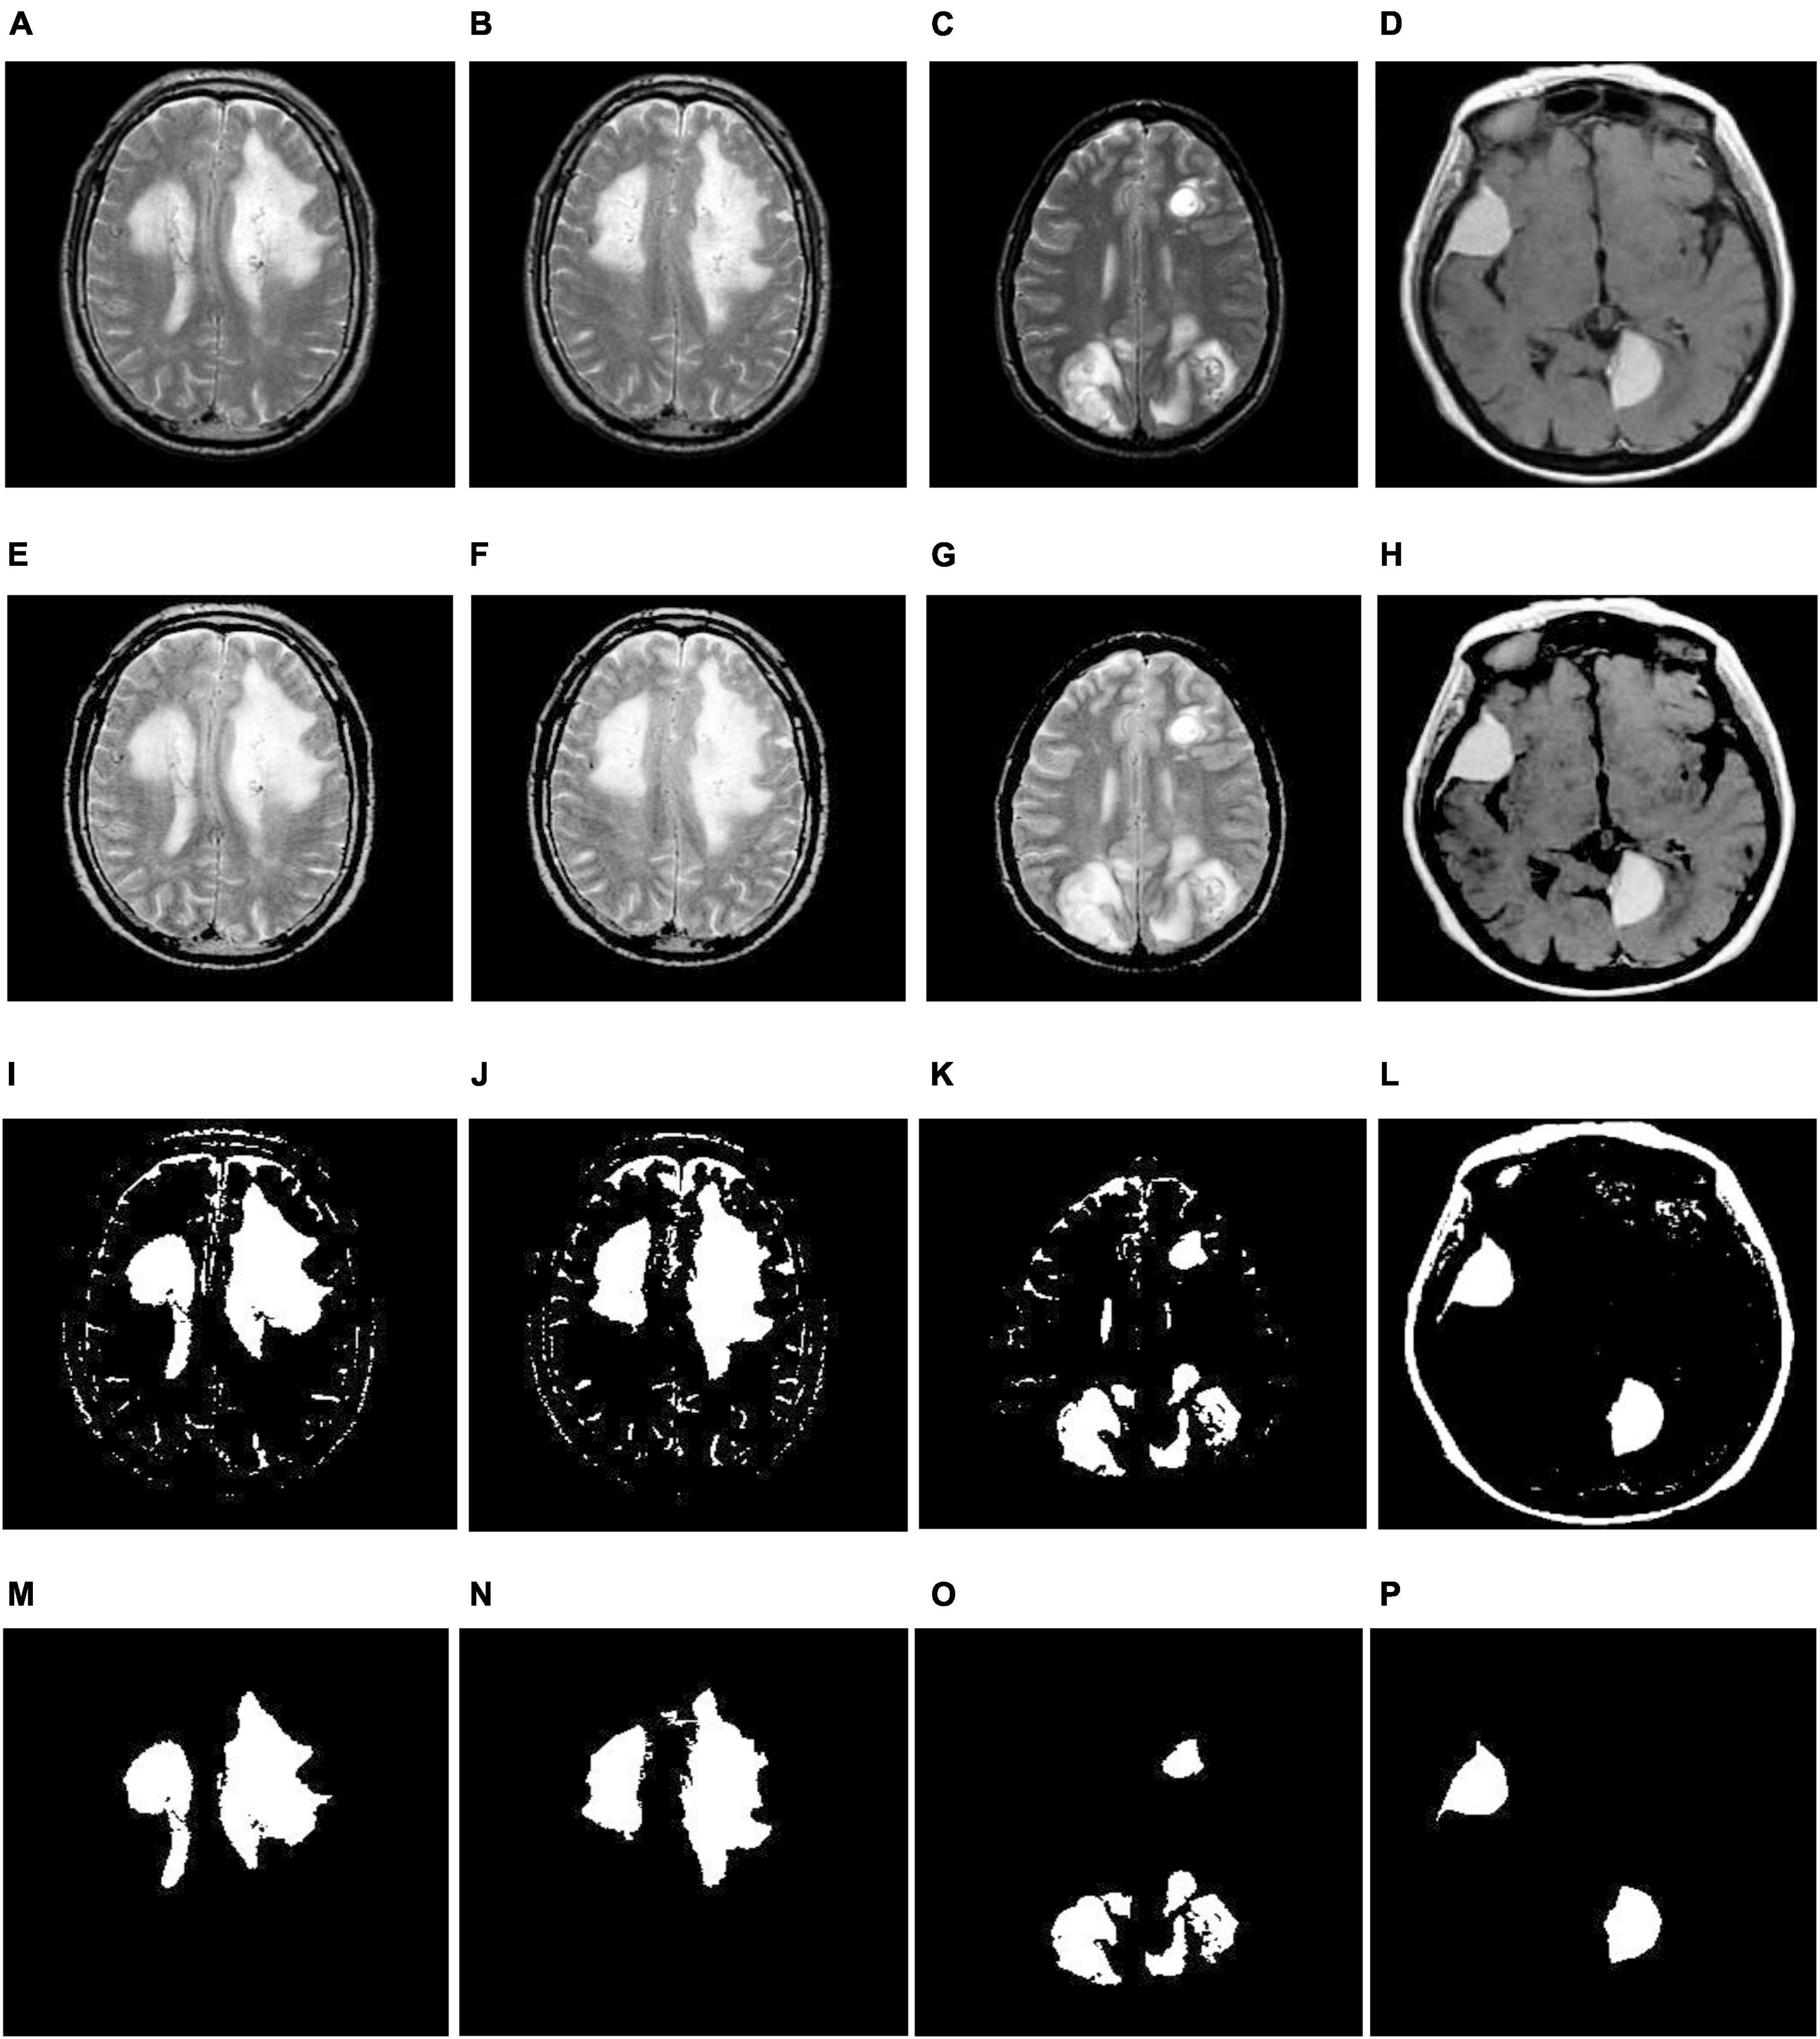
Figure 4. Illustration of the suggested segmentation approach (multiple tumors): (A–D) Input images; (E–H) enhancement using TSSR; (I–L) tumor extraction by entropy-based thresholding; (M–P) post-processing using mathematical morphology.
(7) Finally, we employed mathematical morphological operations (Gonzalez et al., 2003) to remove the imperfections that appeared in step 6. To achieve this, we employed erosion followed by dilation (opening) on a thresholding image with the help of a disk-shaped structuring element over a range of radius 8-12. The corresponding outcomes are illustrated in Figures 3, 4M–P. From this, we note that the proposed segmentation approach separates a single tumor and multiple tumors from the enhanced brain MR images. As a result, we can improve the classification accuracy by extracting the relevant features.
2.3. Feature extraction
Texture features play a vital role in classification of medical images since they can significantly capture the variations within the image. The available techniques utilize local-binary patterns (LBP) and their variants extensively (Maheshwari et al., 2019, 2021; Maheshwari and Kumar, 2022). Most approaches extract the inherent texture details by encoding the intensity difference between a central pixel and its neighborhoods. However, they fail to capture long-distance pixel interactions outside the defined neighborhood. Therefore, they need to fully consider the structural relationship between the entire image and its local image patch. It can be overcome by a newly developed texture descriptor known as NLBP (Song et al., 2020) and is mainly used to encode the non-uniform patterns analogous to complex structures within the image, such as corners, lines, and edges.
In the NLBP descriptor process, we initially estimate the non-local central pixels (or anchors) using global image statistics. Then, we encode the intensity difference between anchors and their neighborhoods non-locally using extended rotation-invariant uniform (eriu2) patterns. The entire procedure of the NLBP descriptor is outlined as follows:
(1) Primarily, arrange the intensity values of the central pixels of the segmented image S in ascending order as follows:
where, “sort (.)” represents the sorting function, denotes the intensity of the n-th sorted central pixel, and Nis the number of central pixels.
(2) Partition the sorted central pixels into Mequal intervals and then compute the intensities of anchors over Mintervals:
where “⌊.⌋ “ denotes the greatest integer function and gives the intensity of the m−th anchor.
(3) Finally, we employed “eriu2” to encode the non-local intensity difference between anchors and their neighborhoods as follows:
where “r” is the radius, “K” denotes the number of neighboring samples, and
“U” is determined by Eq. (10).
Thus, by the NLBP descriptor, we attain K + 6 patterns for each central pixel over an anchor. In this work, we consider r as five, and K as twenty-four for an effective classification. Figure 5 represents the histogram of the NLBP feature descriptor.
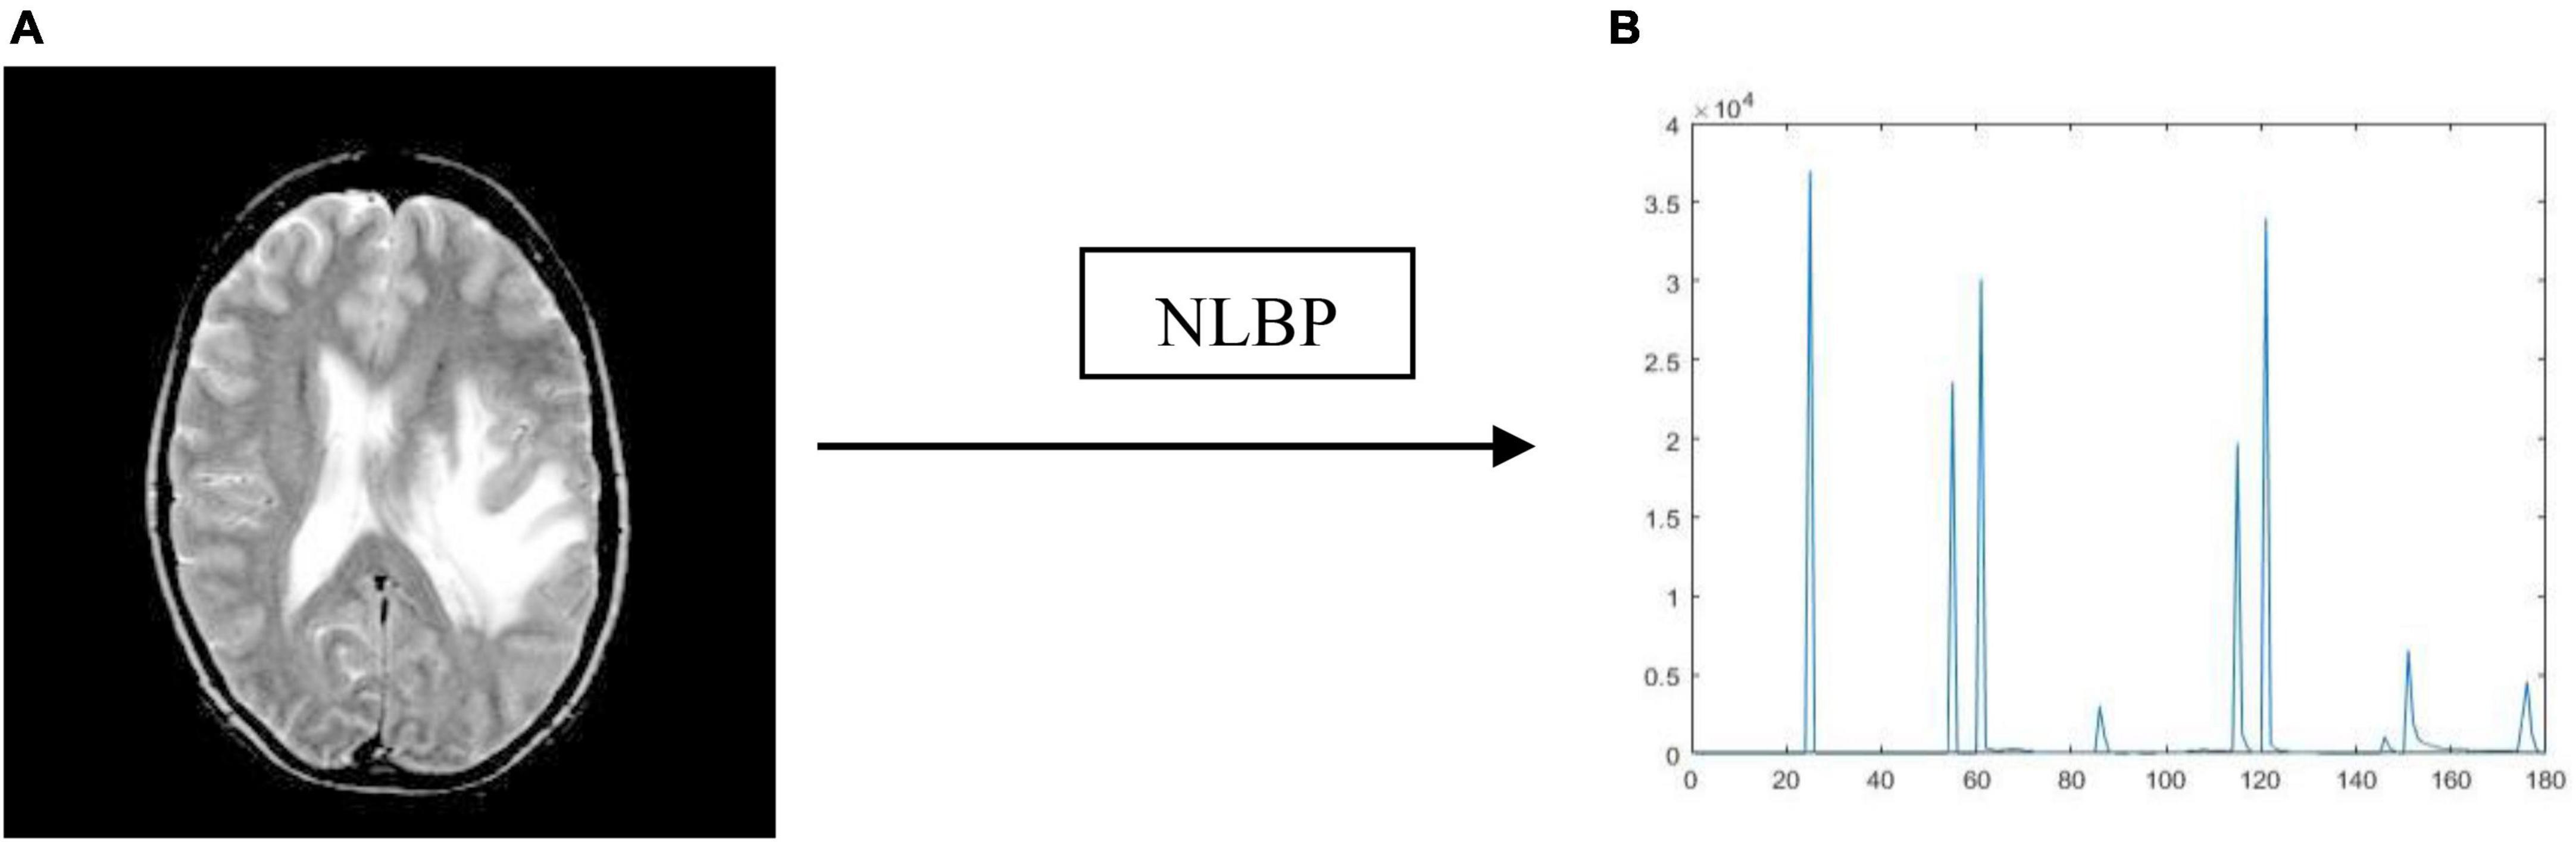
Figure 5. Resultant outcome of NLBP descriptor: (A) Source image; (B) histogram of NLBP.
2.4. Classification
Classification plays a significant role in processing medical images, especially when identifying brain MR image abnormalities. A proper selection of learning algorithms can accomplish this. In this work, we consider support vector machine (SVM), K-nearest neighbors (KNN), random forest (RF), and GentleBoost (GB).
2.4.1. Support vector machine (SVM)
Currently, SVM (Vapnik, 2013) is commonly used in the neuroimaging analysis, particularly in classification problems. The primary objective of this approach is to estimate an optimal hyperplane by maximizing the margin between data points and the decision surface. However, in most cases, the data points within the classes are contaminated by noise, where SVM (linear SVM) cannot distinguish the data points completely. To limit this issue, introducing a soft margin and a cost function, C into SVM helps to mitigate the training error (Cortes and Vapnik, 1995). In some scenarios, especially when we map a feature set that contains many features into a higher dimensional feature space, the data points within the classes are not linearly separable. For this reason, a nonlinear SVM is initiated with the help of a kernel trick (Cristianini and Shawe-Taylor, 2000). In this paper, we have chosen a radial basis function (RBF) kernel because:
(1) It provides good performance when the feature set contains fewer features.
(2) It needs fewer hyperparameters compared to the polynomial kernel.
The RBF kernel is defined by the following equation
where, yi and yj denote the objects i and j; α denotes the kernel variable which is used to evaluate the smoothness of the boundary between the classes in the original object space.
2.4.2. GentleBoost (GB)
GentleBoost (GB) (Schapire and Singer, 1999) is formally known as Gentle adaptive boosting or Gentle AdaBoost and is developed by integrating the features of AdaBoost and LogitBoost. Let us assume that, X = [(x1,y1),(x2,y2),…,(xP,yP)] is a training vector with P number of attributes and the corresponding label associated with input features xq is ym = [−1,1]. Here, we perform binomial classification, using the decision tree as a weak classifier. The procedure for obtaining a strong classifier with GentleBoost is outlined in Algorithm 1.
Algorithm 1. GentleBoost
1. Begin: Initialize the weights as
; q = 1,2,3,…,P
2. Repeat the following steps for each
round v = 1,2,3,…,V
(b) To train the decision tree (weak
classifier), subdivide the training set
X into D number of partitions. Then, for
each partition (here j = 1,2,3,…,D),
calculate and using
(c) Estimate the weak hypothesis for each
as follows
(d) Update the weights using Eq. (15) and
Eq. (16)
3. Obtain the optimal hypothesis to
classify brain MR images as healthy or
pathological by
The hyperparameters of the GB classifier as follows:
(1) The maximum number of splits allowed by classification tree = 10.
(2) Learner = ‘Decision tree’.
(3) Number of decision trees = 100
2.4.3. K- nearest neighbor (KNN)
KNN (Cunningham and Delany, 2007) is a widely supervised machine learning approach for analyzing both classification and regression problems. Moreover, it is primarily applied in classification scenarios. Typically, KNN stores all data points of corresponding classes and then distinguishes the new classes based on the distance metrics between the data points.
Generally, in KNN, the classes are separated by a majority vote of their neighbors. Based on this majority vote, KNN predicts the most frequent classes among those with the help of distance metrics. In KNN, the selection of K and the distance function plays a prominent role in improving classification accuracy.
(1) The first criterion is a selection of K; if the dataset is small, then choose a smaller Kvalue; otherwise choose a higher value of K. In this work, we choseK as 3.
(2) A second criterion is a distance function. Several distance functions estimate the similarity between data points, such as Euclidean, Manhattan, Mahalanobis, and Chebyshev. In this work, we preferred Euclidean distance because it provides reasonable accuracy for categorizing categorical data.
2.4.4. Random forest (RF)
The RF (Liaw and Wiener, 2002) is used to tackle classification and regression problems. It employs ensemble learning, combining multiple classifiers to solve complex problems. An RF comprises several decision trees and creates a “forest” trained by bagging or bootstrap aggregation. Bagging is a meta-algorithm for ensembles that increases the efficiency of machine learning methods. The outcome in RF is determined based on the predictions of the decision trees. It makes predictions by taking the average, or “mean,” of the results from several trees. The model’s efficiency grows as the number of trees increases but sometimes may lead to overfitting. Finally, the constraints of decision trees are eliminated by RF. This further decrease the dataset’s overfitting and boosts accuracy.
The characteristics of the RF learning approach are as follows:
(1) Learner = ‘Decision tree’.
(2) Number of estimators = 100.
2.5. Evaluation measures
The performance of the proposed framework is validated using various well-known metrics, such as the true positive rate (TPR), true negative rate (TNR), positive predictive value (PPV), F-score, dice similarity coefficient (DSC), area under the curve (AUC), and accuracy (Raschka, 2018).
3. Results and discussion
3.1. Database
To validate the performance of the suggested and existing frameworks, 235 two-dimensional T2-weighted MR-based brain images were taken, including 45 healthy and 190 pathological images with dimensions of 256 × 256 from an open access benchmark database such as Harvard Medical School (Johnson and Becker, n.d.).
3.2. Simulation results
This result division is subdivided into two modules to emphasize the detection (or segmentation) and classification independently. Here, the first module identifies tumor areas by the image segmentation process, and the second module engages with the discrimination between healthy and pathological brain MR images using appropriate feature extraction and supervised machine learning approaches.
3.2.1. Identification of the tumor area
In this section, we detect the tumor portions from brain MR images using maximum entropy-based thresholding and morphological operations. Before that, we improved the dynamic range of brain MR images by adopting the human visual perception concept. Due to this, we efficiently preserve fine details by enhancing contrast as well as brightness. As a result, we increase the segmentation accuracy. After that, we separate foreground (tumor area) and background (non-tumor area) regions by maximum entropy-based thresholding. However, through this process, we cannot achieve significant performance since images generated by the thresholding approach are distorted by noise and texture (see Figures 3, 4I–L). Therefore, we employed morphological operations to remove the tiny objects that appeared in the thresholding image without minimizing the size and shape of the large objects (see Figures 3, 4M–P). Through this process, we effectively improve the segmentation performance with 91.88% DSC, 99.71% PPV, 99.38% TPR, 95.69% TNR, 99.55% F-Score, 97.54% AUC and 99.17% accuracy (see Table 1).
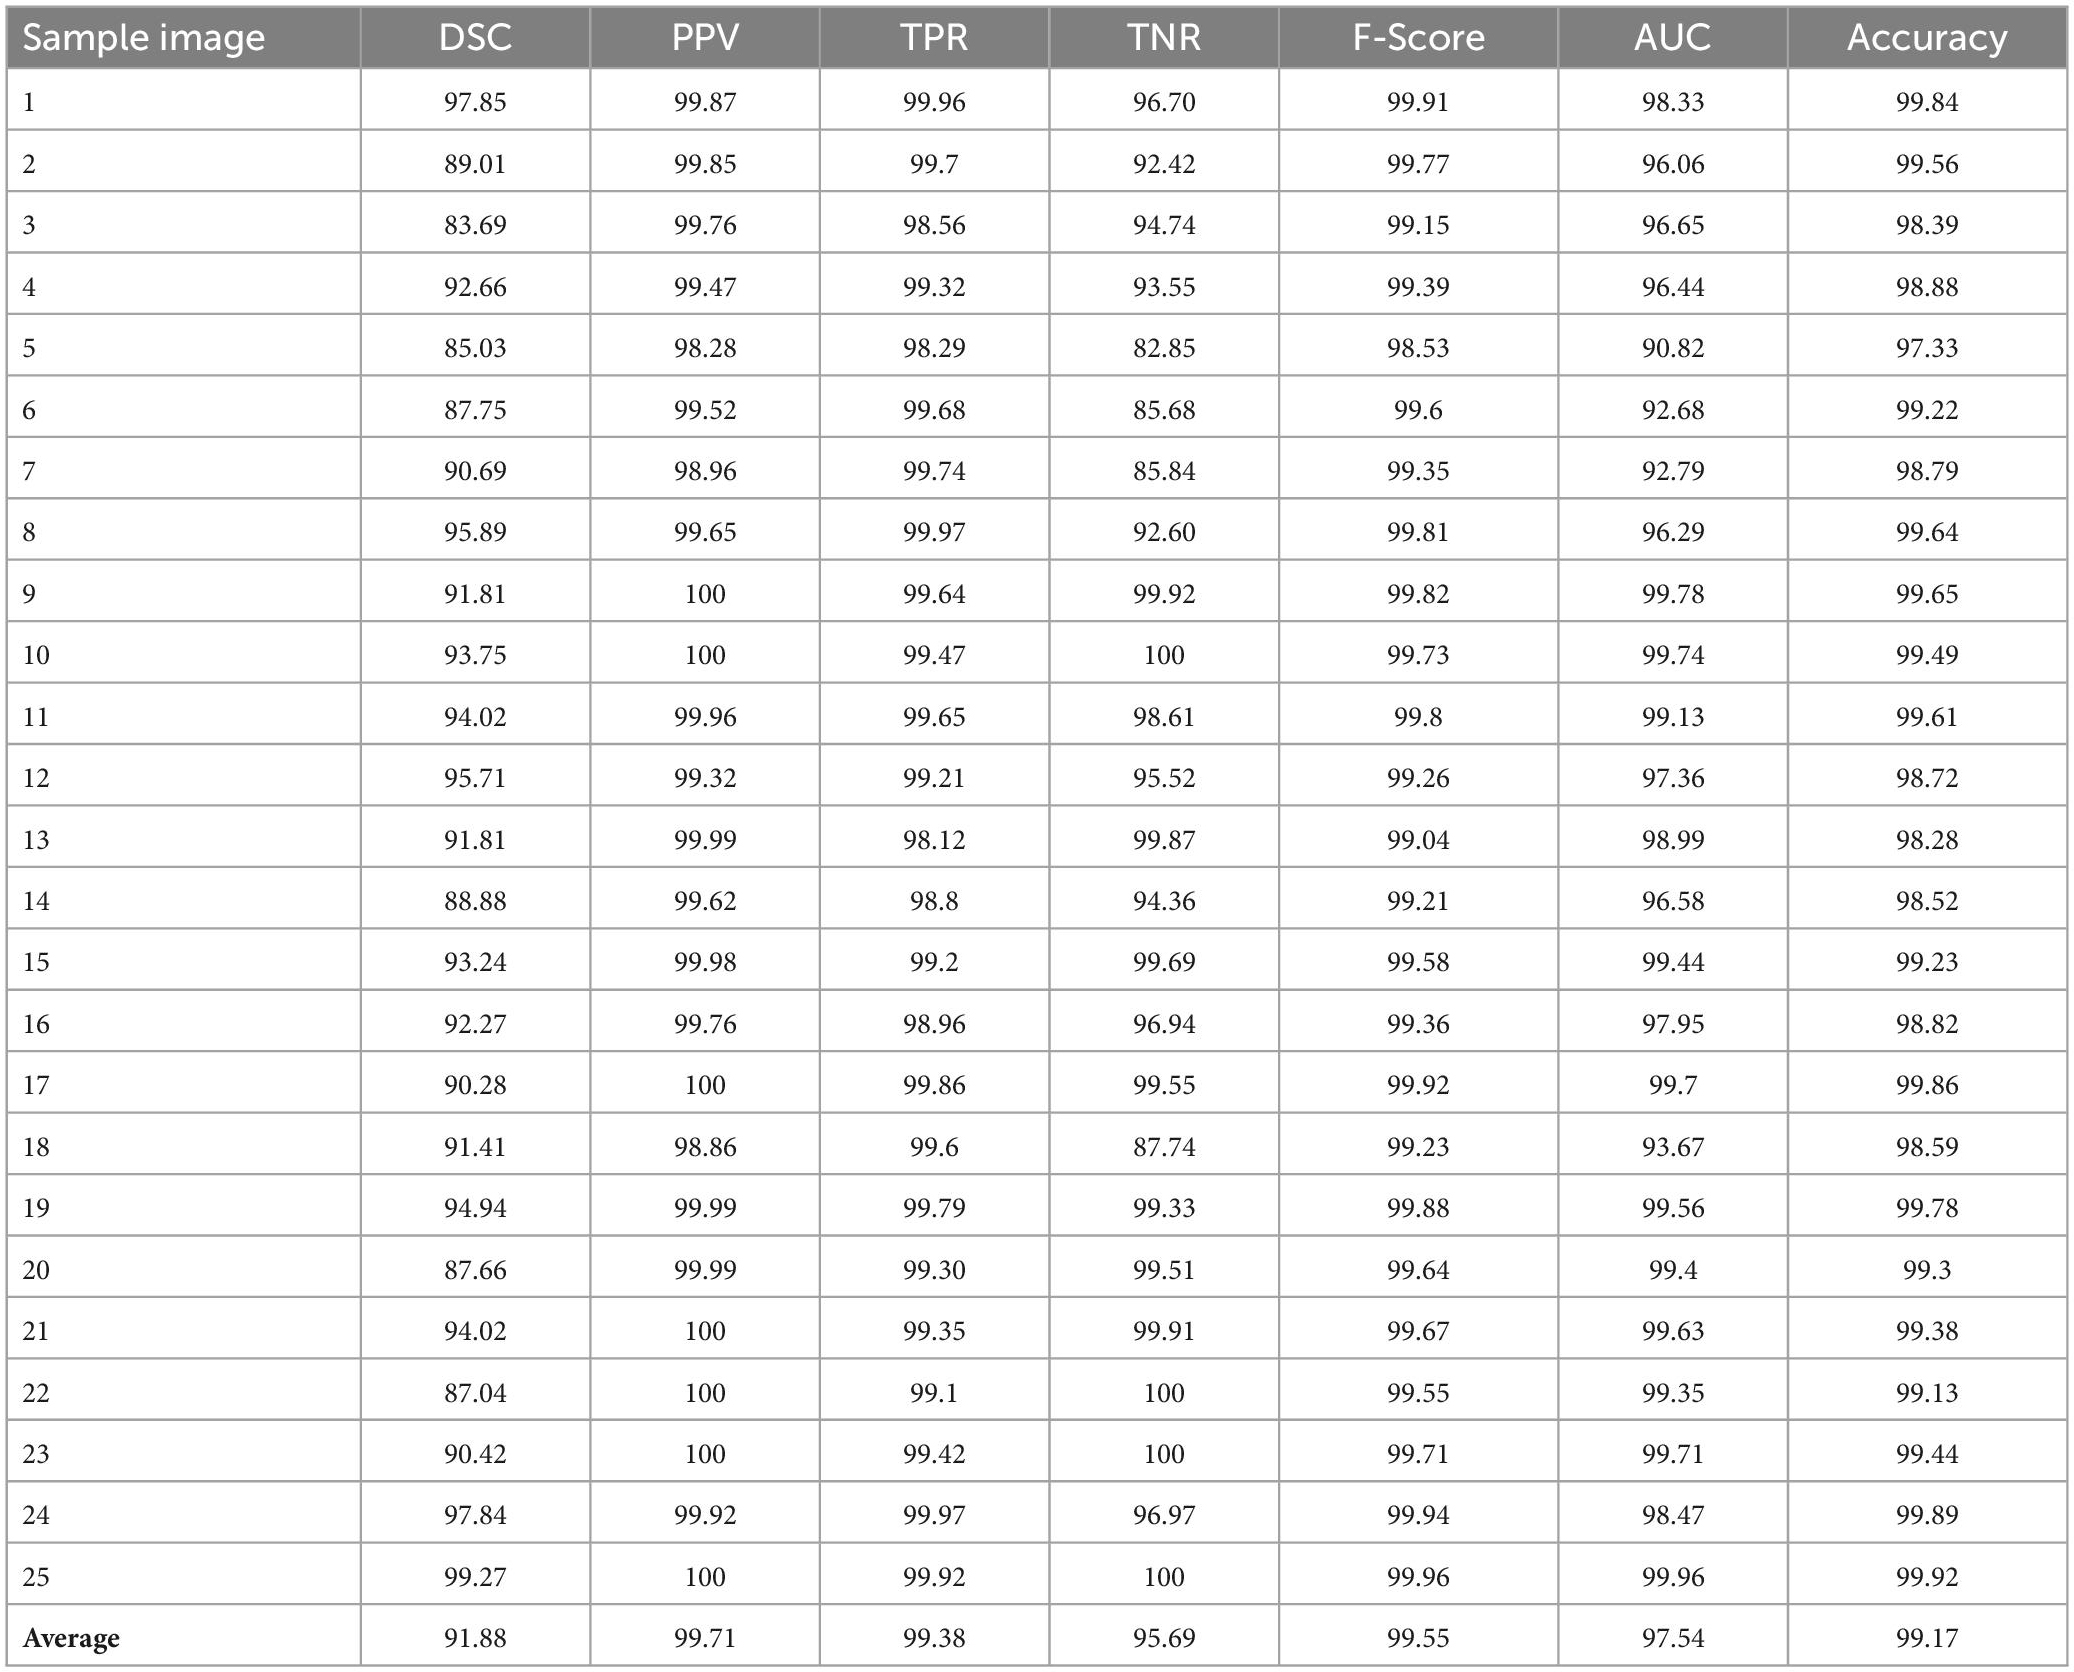
Table 1. Segmentation performance of the proposed approach.
3.2.2. Classification of brain MR images
To classify the given brain MR images as healthy or pathological, we extracted relevant features from segmented brain MR images using the NLBP feature descriptor by establishing interactions between anchors and their neighboring pixels. Then, the obtained features were fed to various supervised learning approaches such as SVM, KNN, RF, and GB, and they were assessed through K-fold cross-validation (K−FCV). Typically, K-FCV is a simple and effective method compared to other validation strategies (Raschka, 2018) that involve a typical resampling technique without any replacement in the data. Furthermore, in each fold of the K−FCV train and test would be conducted precisely once during this whole procedure, which helps us avoid overfitting. However, the selection of the K-value is a significant factor during validation. A lower number of K-folds will produce a model that fits the data poorly and has a strong bias and low variance. Similarly, a high K-fold value results in an overfitting model. Therefore, to prevent this uncertainty, we picked a reasonable number of 5 for K, and the outcomes are tabulated in Tables 2–4. The corresponding average performance is summarized in Tables 5–7, as well as in Figures 6–8. From there, we observed that in cases involving enhancement and segmentation, the proposed approach achieved high classification accuracy when we employed the RF classifier (see Table 7) compared to other cases (see Tables 5, 6) since by segmenting the brain MR images, we efficiently distinguished the characteristics of pathological and healthy tissues.
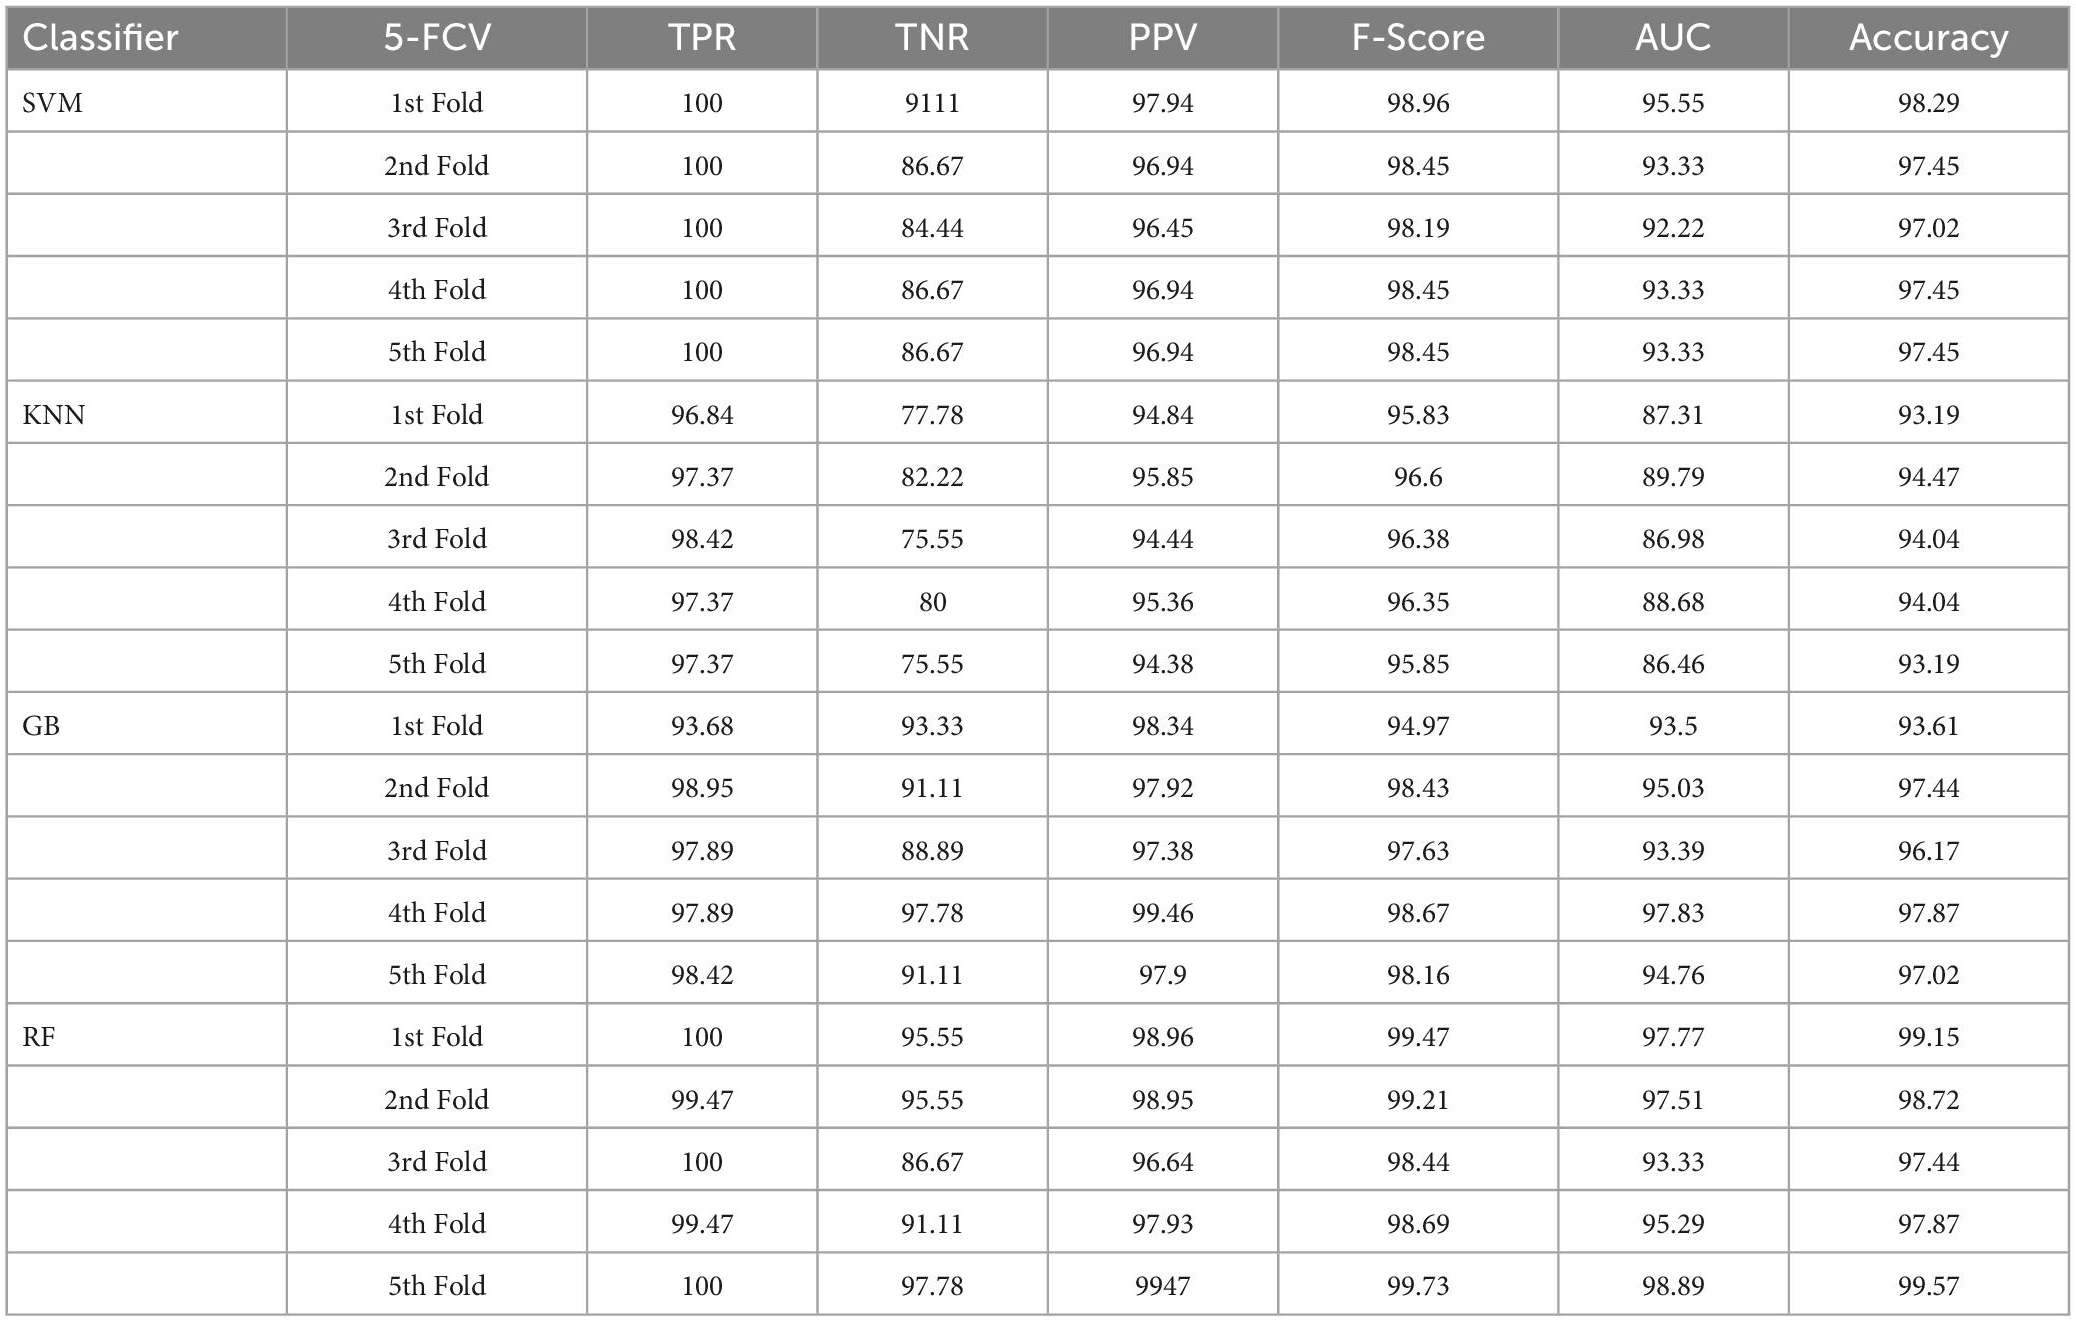
Table 2. Classification performance of the implemented framework without enhancement and segmentation using 5-FCV.
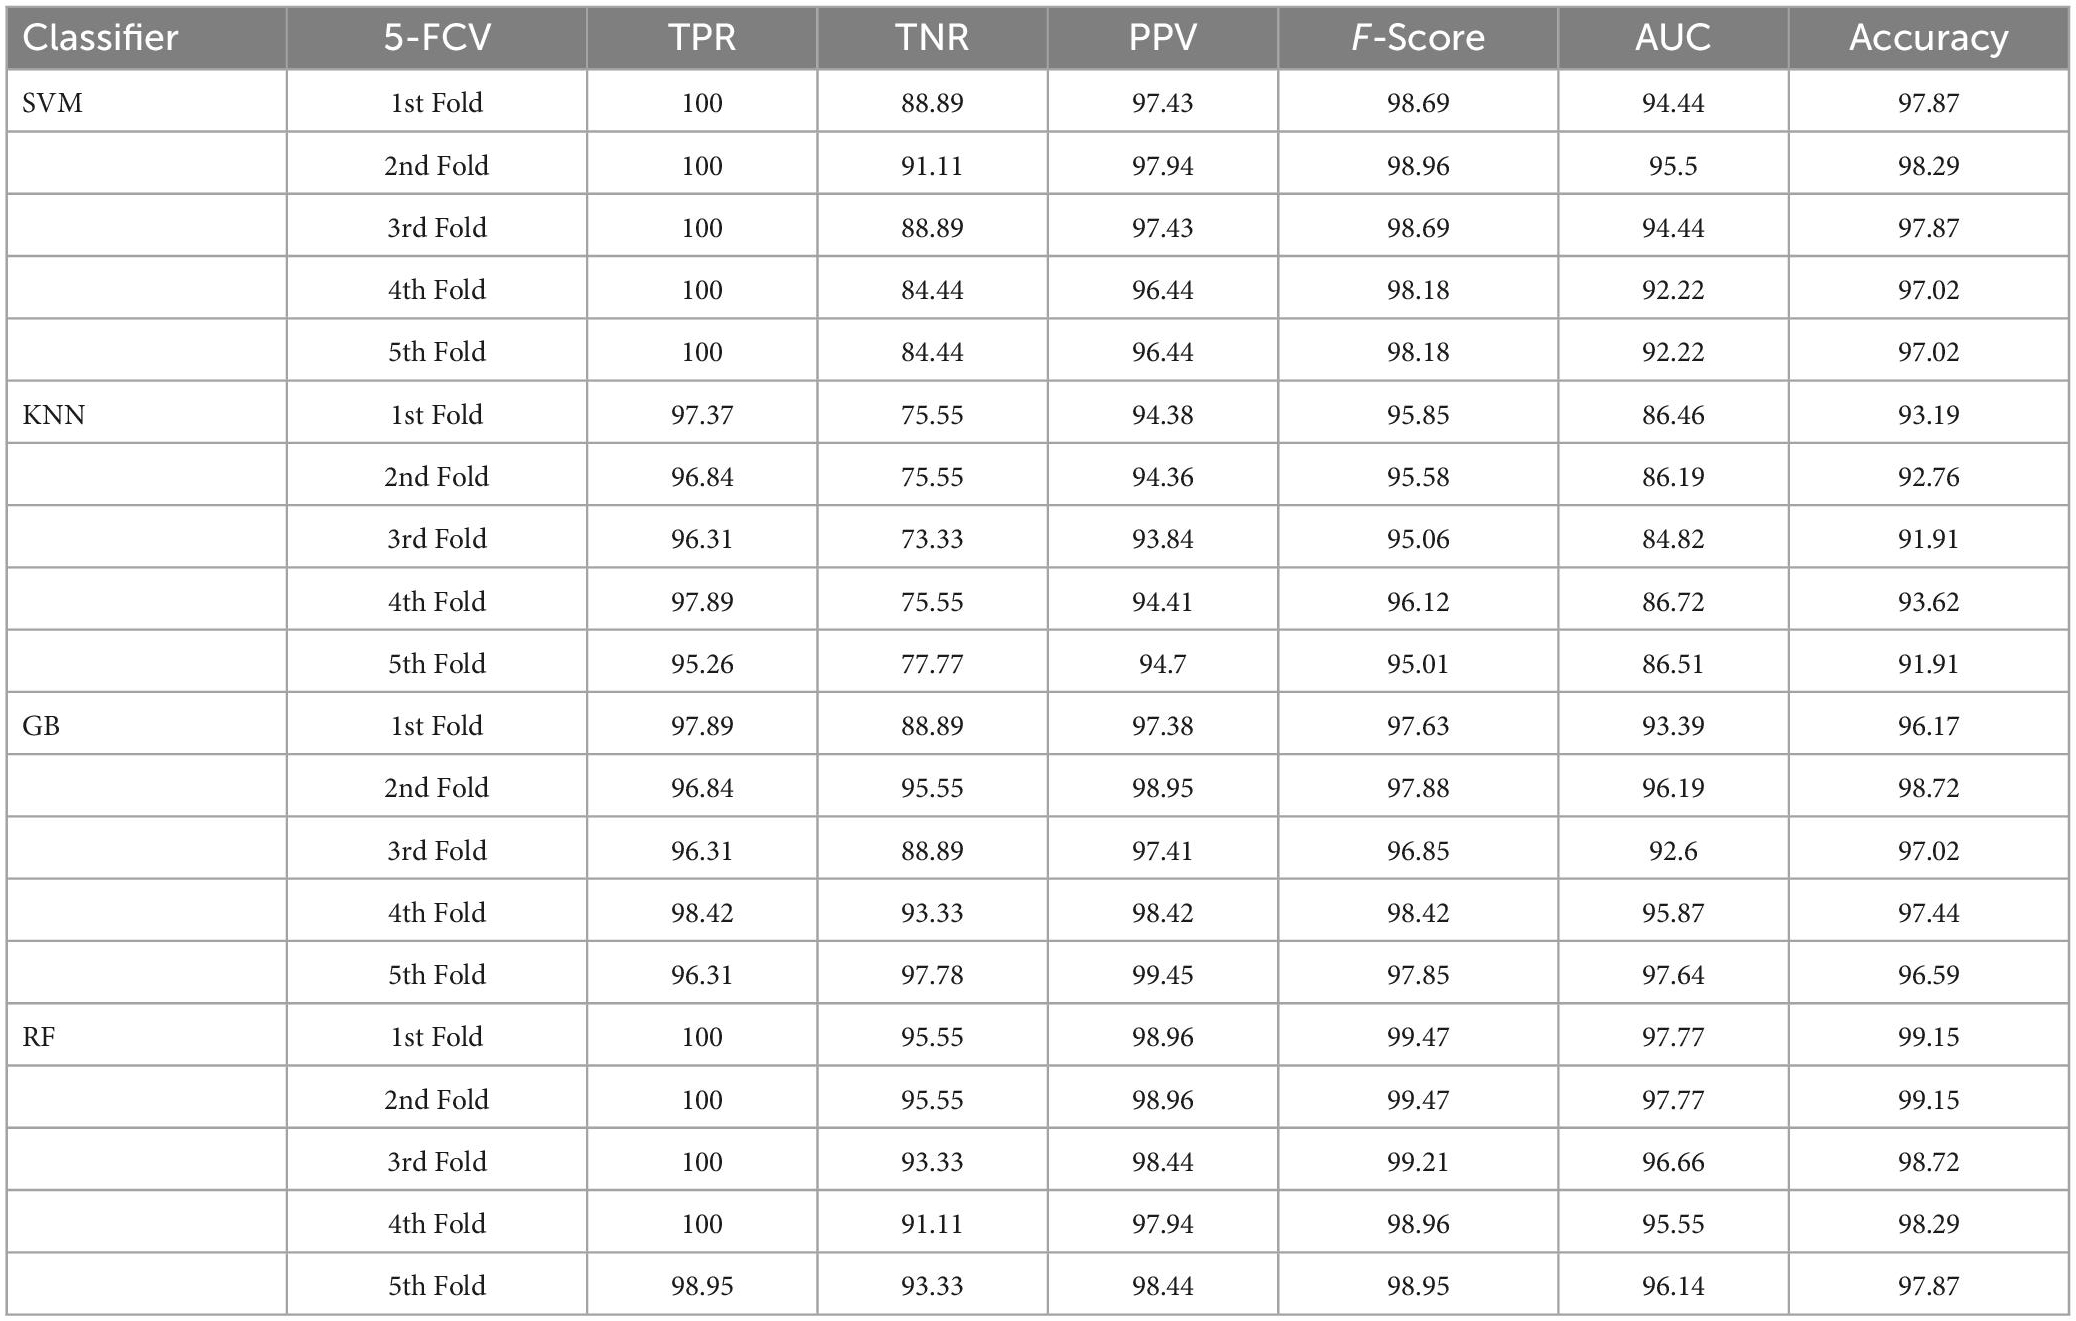
Table 3. Classification performance of the presented approach with enhancement and without segmentation using 5-FCV.
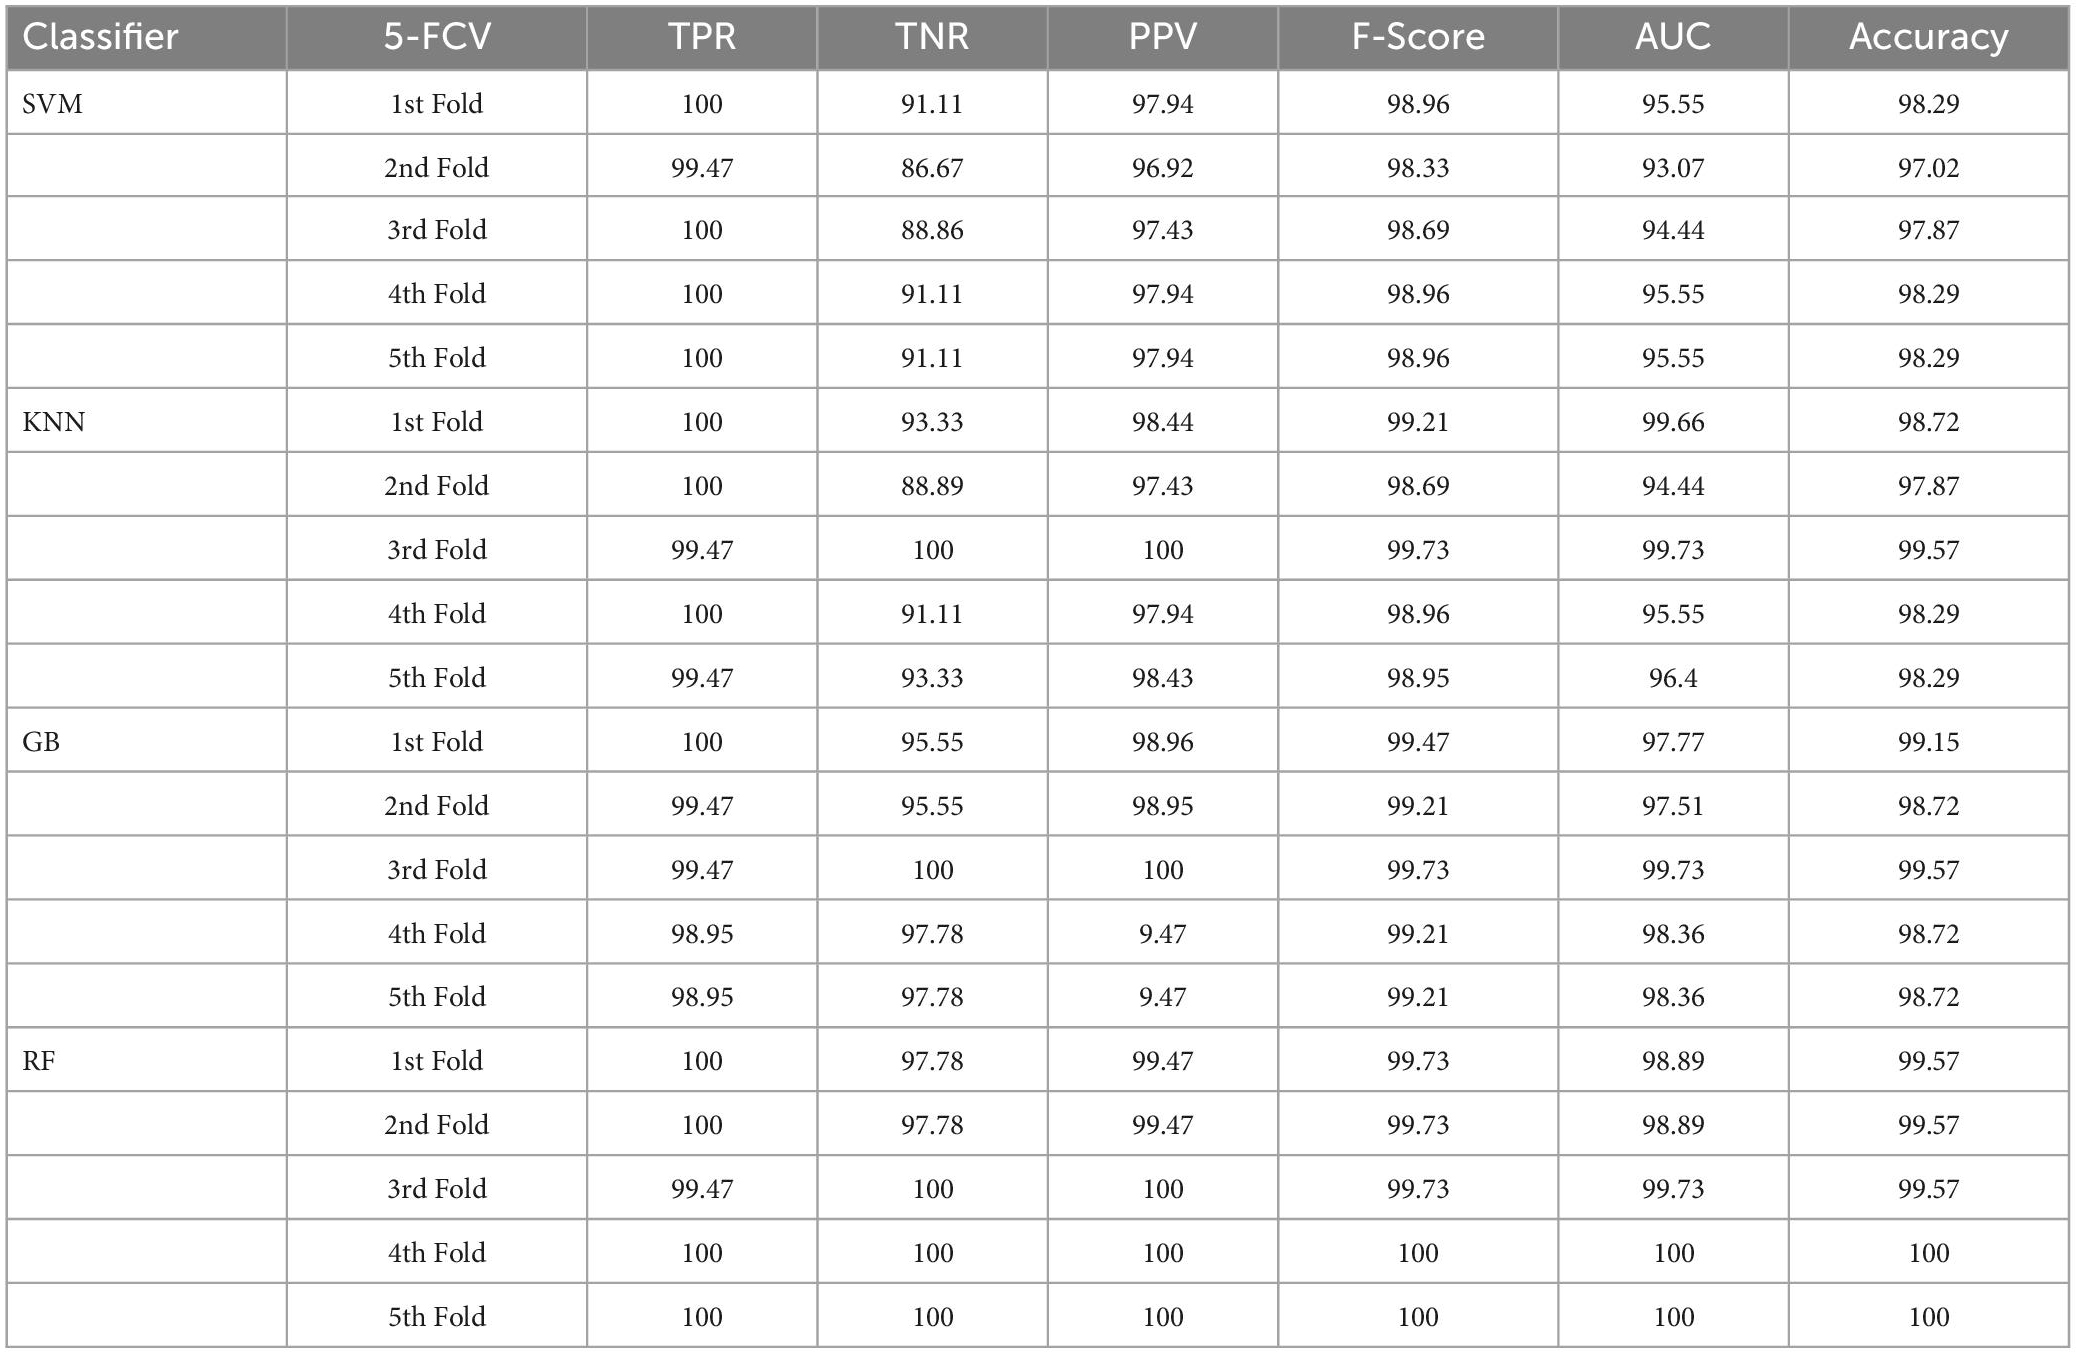
Table 4. Classification performance of the proposed approach with enhancement and segmentation using 5-FCV.
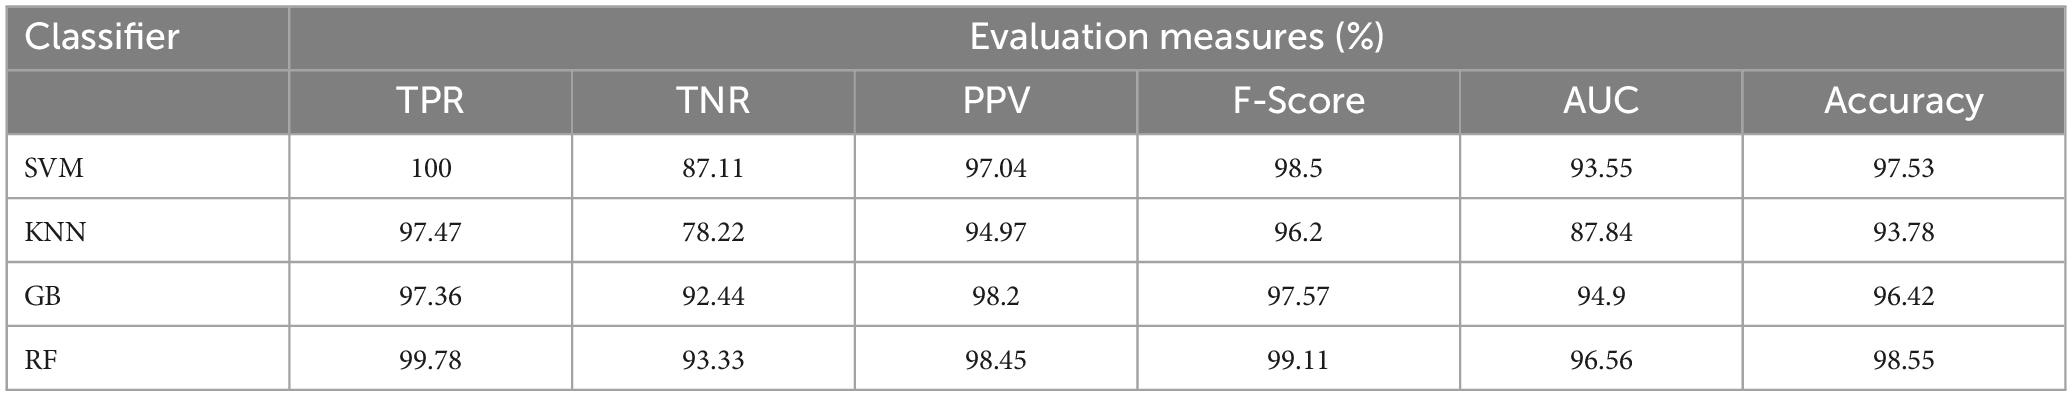
Table 5. Average classification performance of the proposed framework without enhancement and segmentation.
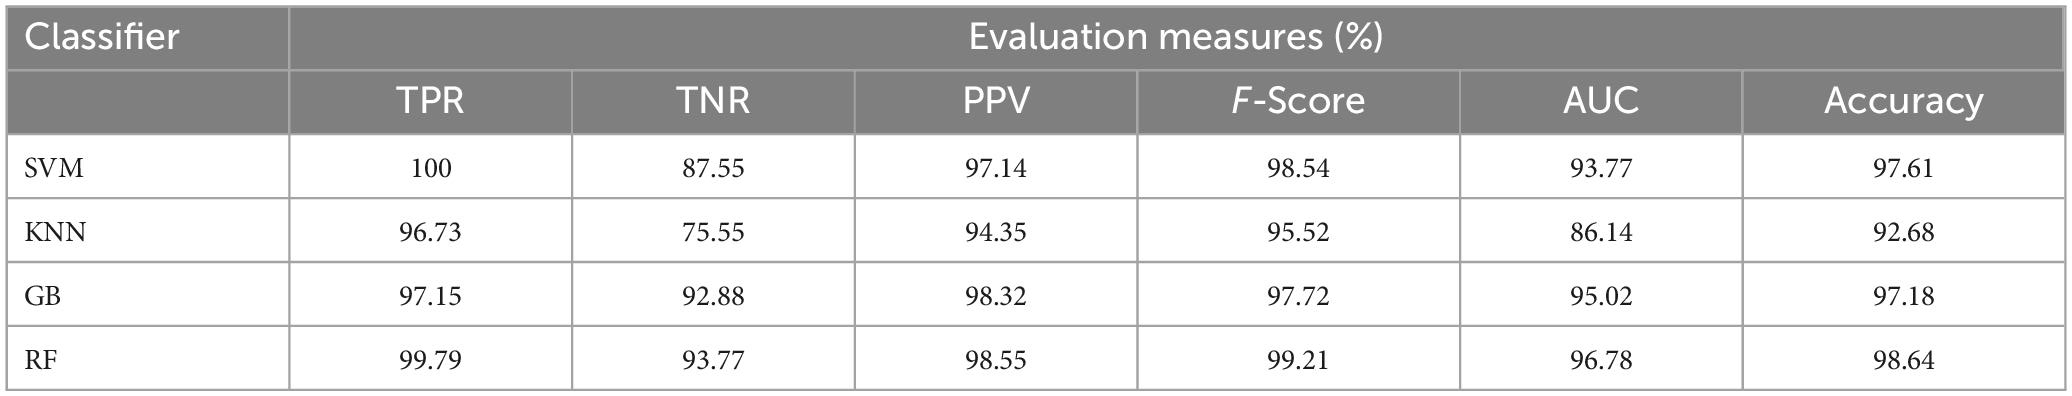
Table 6. Average classification performance of the proposed framework with enhancement and without segmentation.
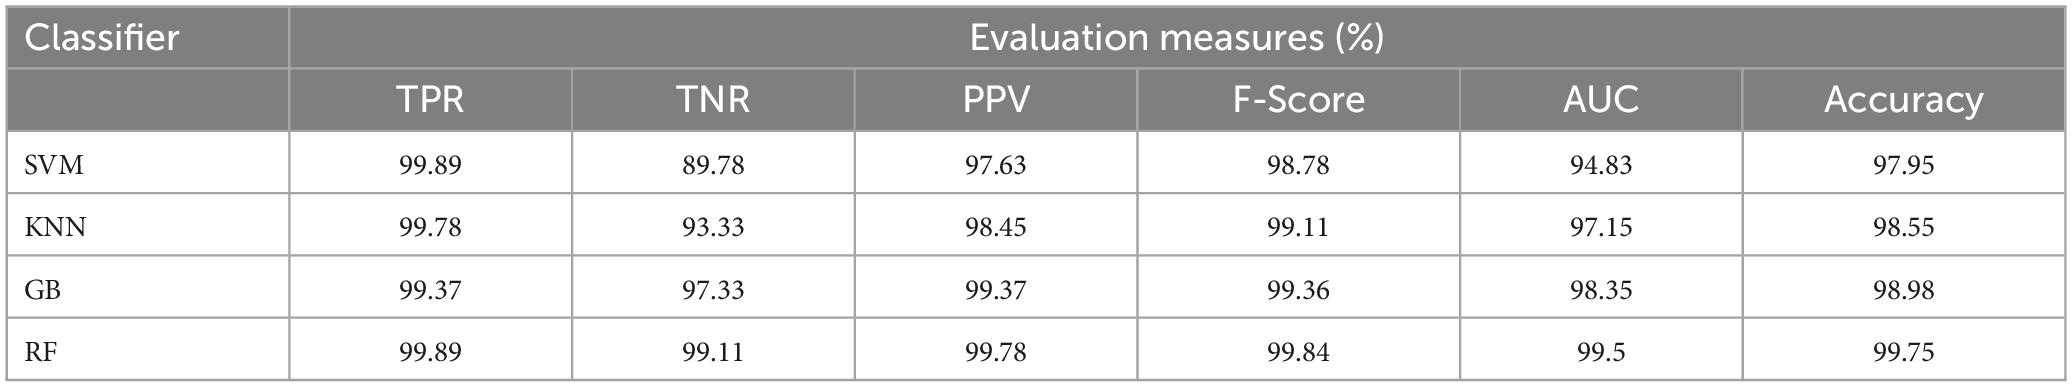
Table 7. Average classification performance of the suggested method with enhancement and segmentation.
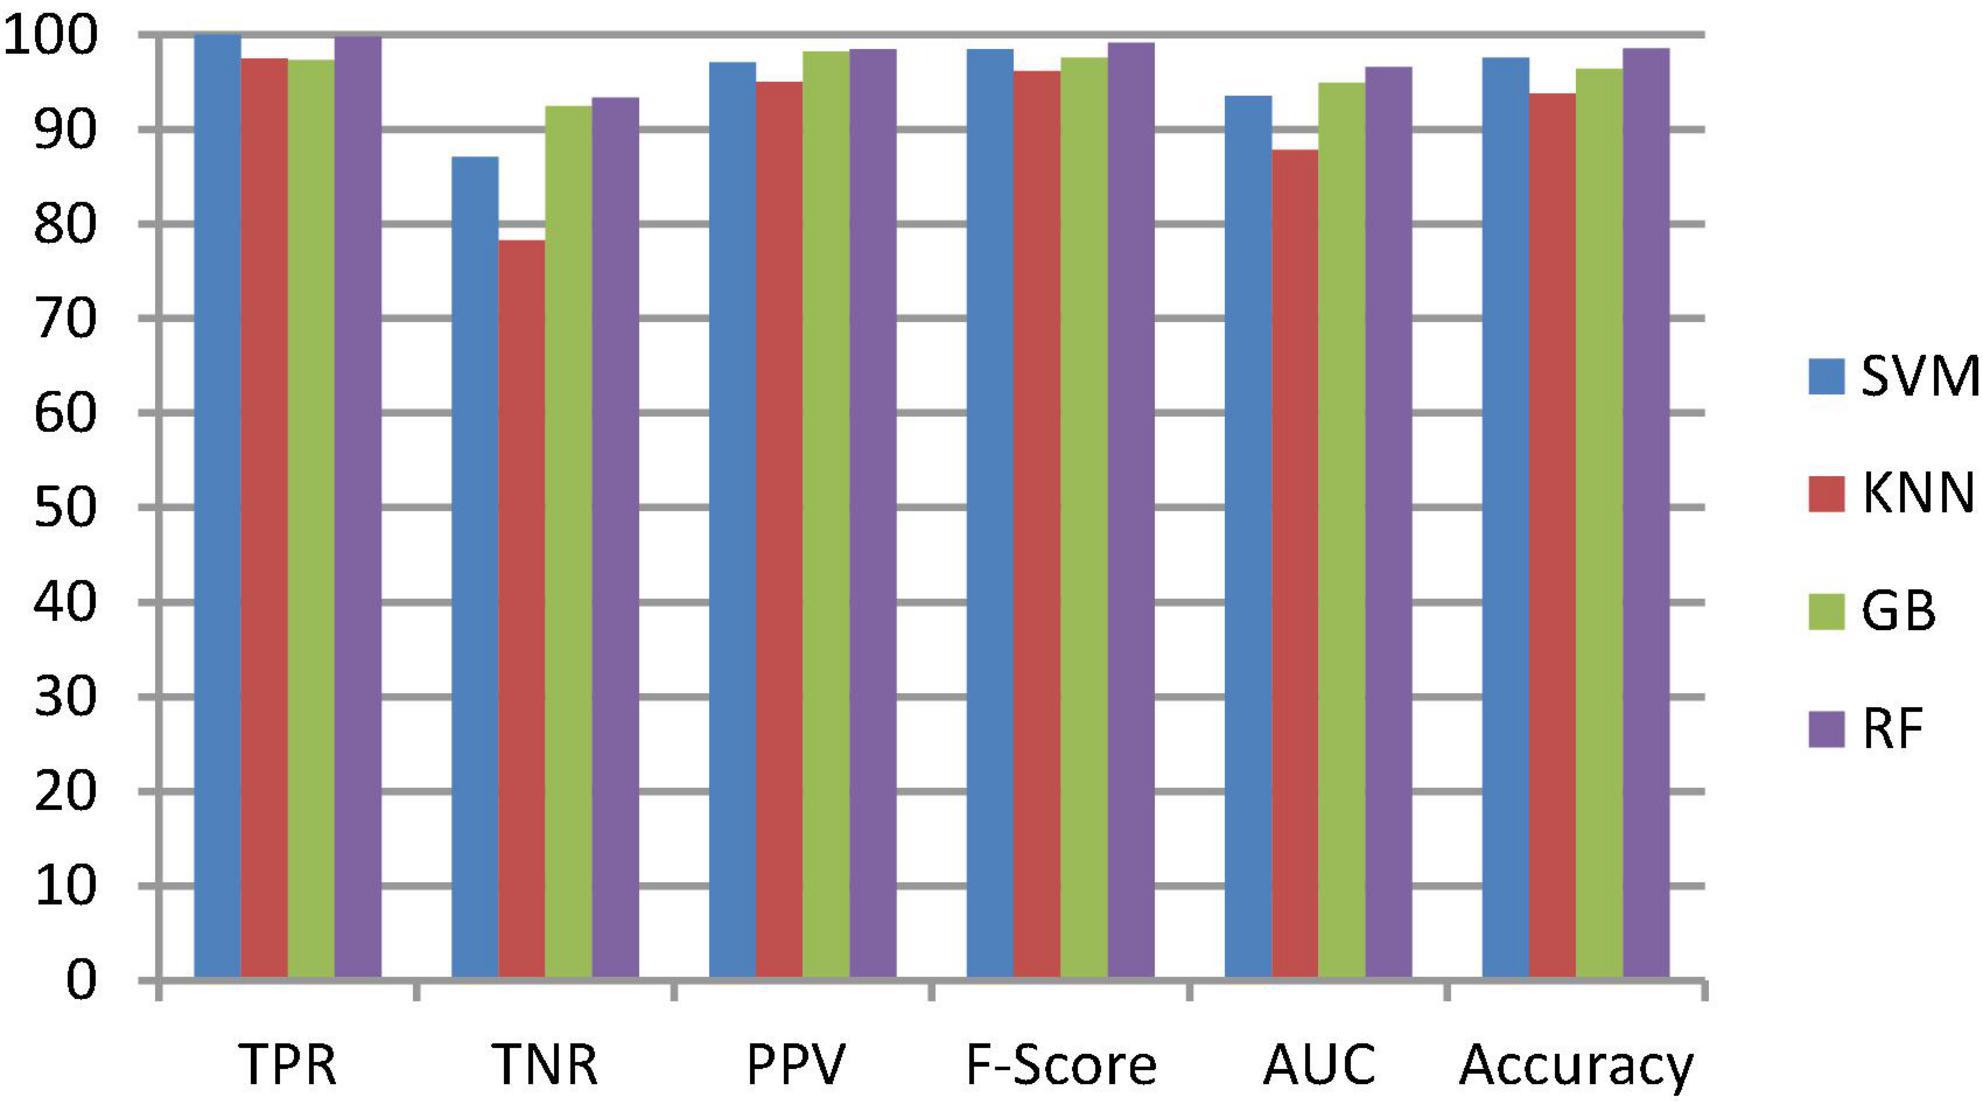
Figure 6. Classification performance comparison between various classifiers without enhancement and segmentation.
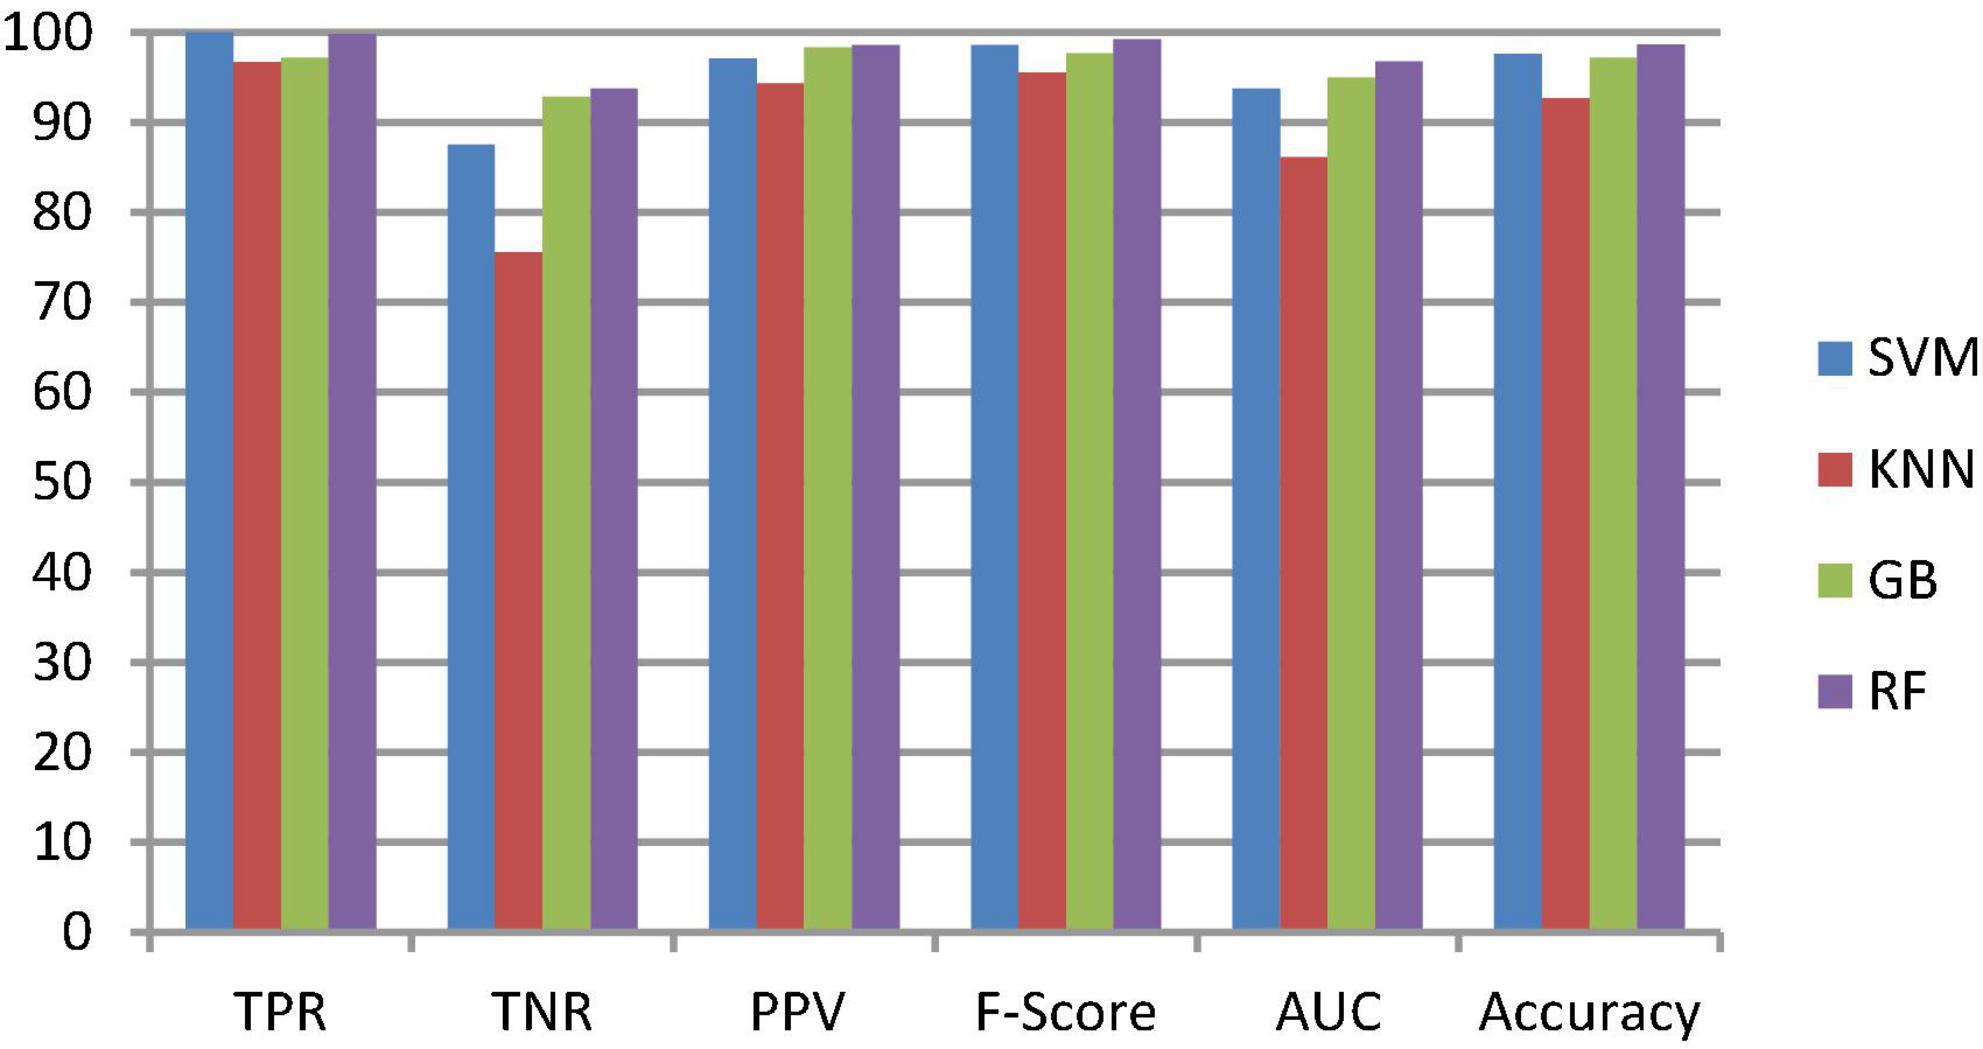
Figure 7. Classification performance comparison between various classifiers with enhancement and without segmentation.

Figure 8. Comparative analysis of the proposed and existing segmentation approaches based on the DSC.
3.2.3. Ablation study
This section talks about the results of ablation studies we did to choose the suggested. These results are illustrated in Tables 5–7. It’s important to note that these results are attained by taking features from enhanced or non-enhanced images and with/without segmentation. The first ablation study (Table 6) described how various ML models are accurate when images are not enhanced and segmented. The results of this study are used as a baseline for the second ablation study. Here, features are directly fed to classifiers without any enhancement and segmentation. Due to that, the presented model doesn’t differentiate normal images from abnormal brain MR images in an effective manner, which results in low-classification accuracy.
The second ablation study (Table 3) mainly deals with the effectiveness of the proposed model when images are enhanced but not segmented. In that case, by enhancing the input brain MR images, we can relatively improve the accuracy of the model compared to the results of the first ablation study since retinex theory considers human visual perception. The outcomes of this study can be considered as a paradigm for the third ablation study.
The third ablation study (Table 7) primarily engages the suggested framework’s significance when enhanced and segmented images. In this scenario, the proposed NLBP descriptor relatively extracts the inherent details from segmented images, resulting in supervised learning approaches efficiently distinguishing normal and abnormal brain MR images compared to the results of the first and second ablation studies.
From the above three ablation studies, we conclude that enhancing and segmenting brain MR tumors can easily differentiate normal and abnormal regions from a given image. So, in the third ablation study, we achieved high accuracy compared to other studies.
3.2.4. Comparison with state-of-the-art approaches
The segmentation and classification performance of the proposed system is compared with well-known received approaches, and their results are depicted in Tables 8, 9 as well as Figures 9, 10. From this, it is clear that the suggested framework increases the segmentation and classification accuracy in terms of DSC, TPR, TNR, and accuracy metrics compared to existing works. Hence, the proposed strategy can be used as a diagnostic tool in clinical analysis to help radiologists identify abnormalities in brain MR images. From the analysis of experimental outcomes, we observed that the following parameters play a crucial role in the success of our proposed methodology:
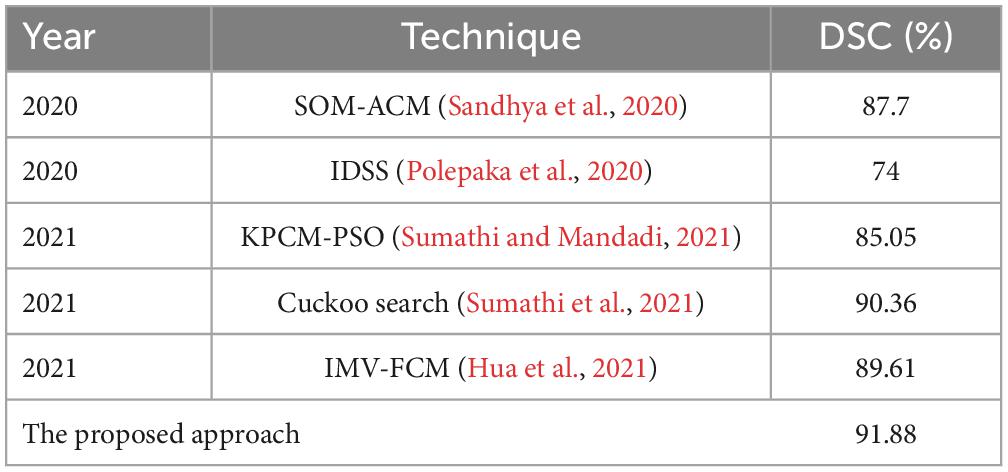
Table 8. Performance of the presented and existing segmentation frameworks.
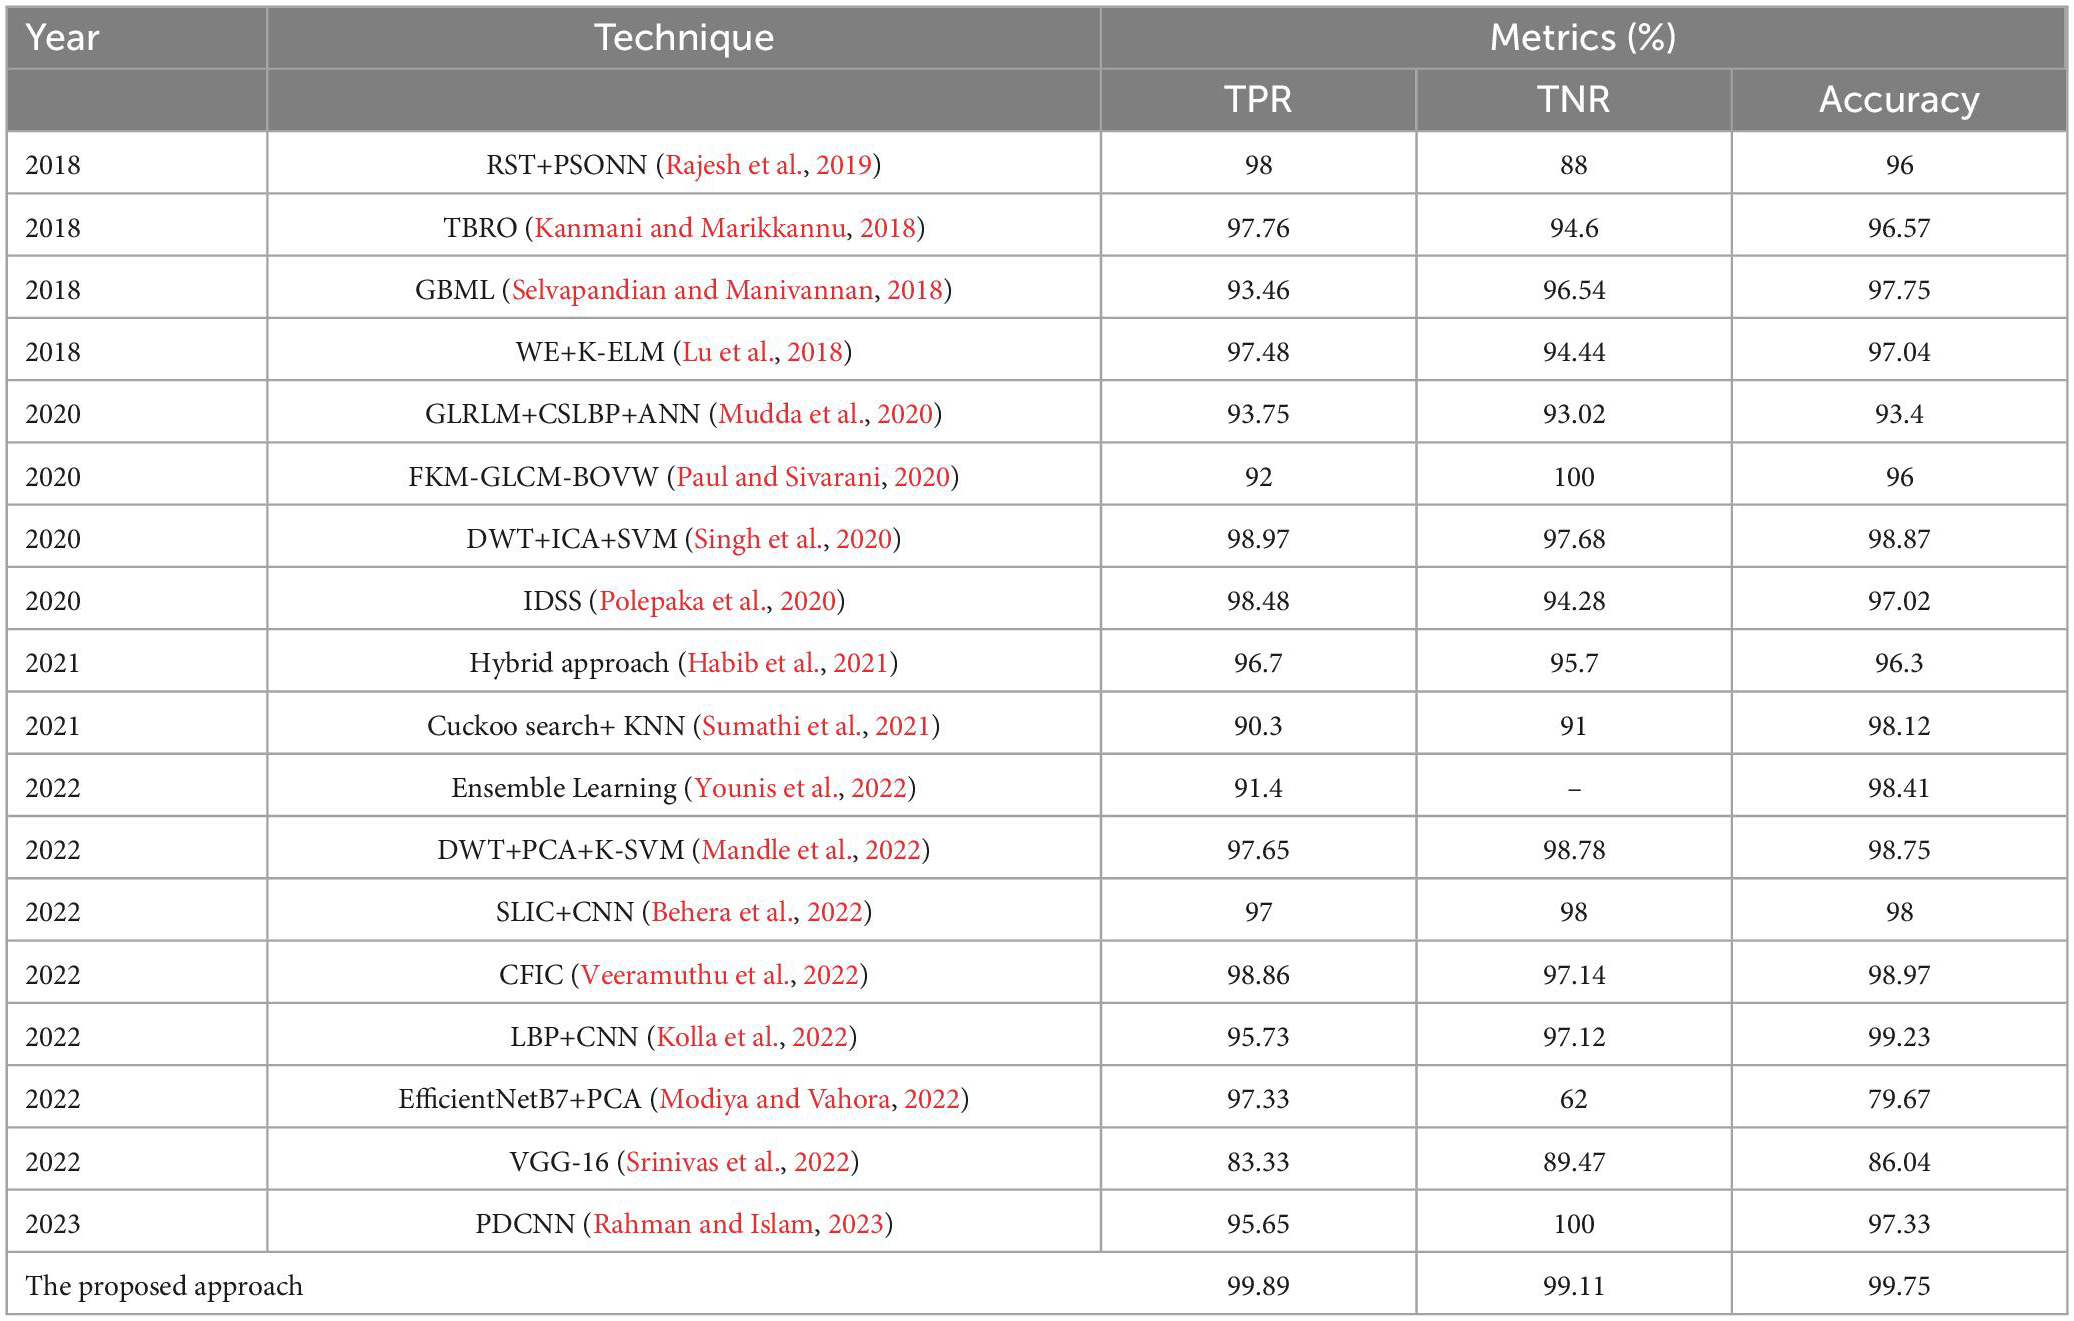
Table 9. Performance of the presented and existing classification frameworks.

Figure 9. Classification performance comparison between various classifiers with enhancement and segmentation.
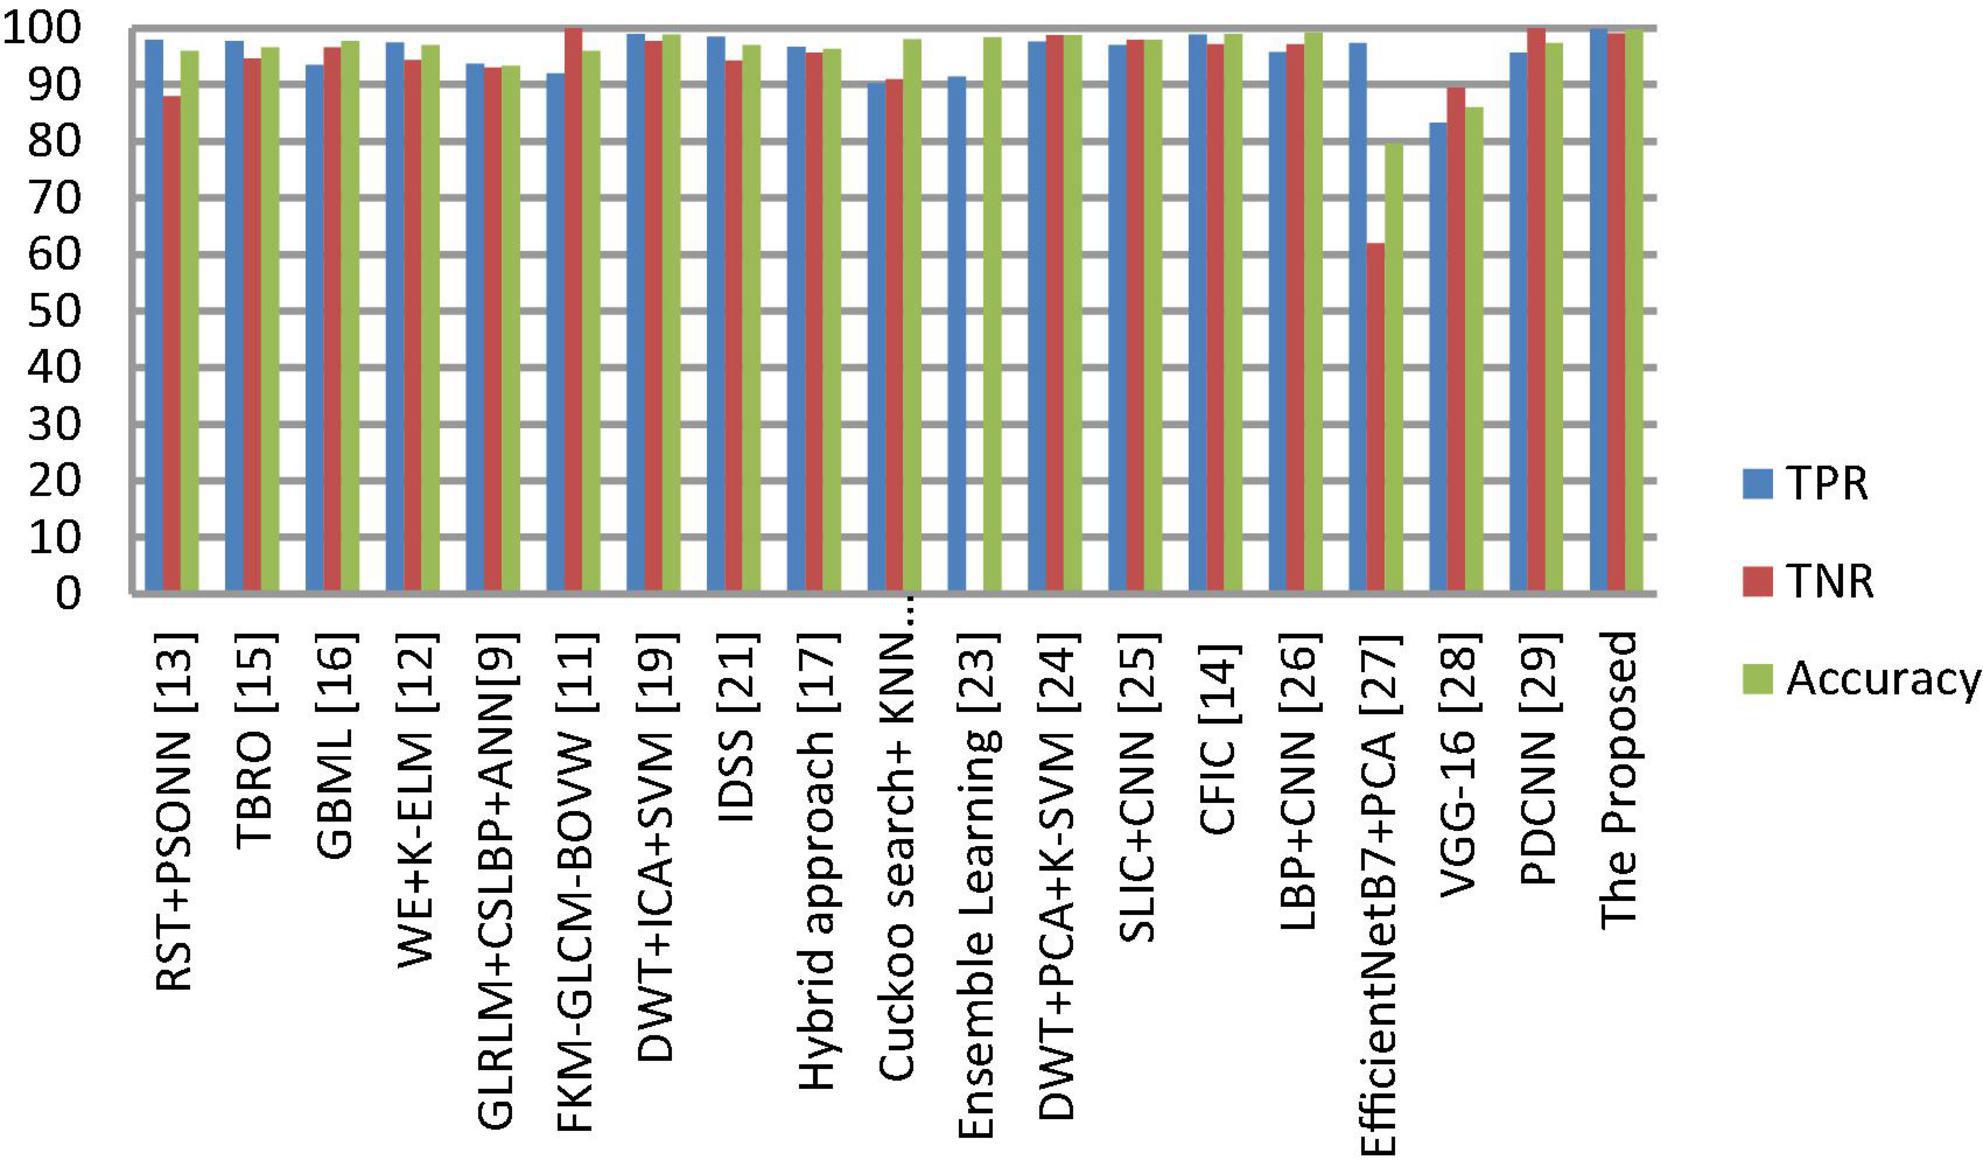
Figure 10. Comprehensive analysis of the proposed and existing classification approaches based on TPR, TNR and accuracy.
(1) Using the TSSR technique, we significantly maintain the fine details of pathological brain MR images by enhancing the brightness and contrast. As a result, we effectively distinguish pathological brain MR images from healthy images (see Table 7).
(2) Using the proposed thresholding process, we relatively differentiate the tumor (either single or multiple) and non-tumor regions with high DSC values compared to existing models (see Table 8) since our method considers the local details and eliminates noise spots in the output image. Therefore, we effectively improve the classification accuracy (see Table 7) compared to other scenarios represented in Tables 5, 6.
(3) Using the NLBP feature extraction technique, we efficiently extracted meaningful details by maintaining the structural relationships between the local image patch and the entire image. Consequently, we obtained better classification performance when we employed the method on segmented images (see Table 7) rather than on original and enhanced brain MR images (see Tables 5, 6).
(4) The suggested NLBP descriptor is some extent robust to illumination changes, and Gaussian noise. Hence, the presented model achieved better results than the existing approaches (see Table 9).
4. Conclusion and future scope
The brain is the most complicated structure and is responsible for controlling the human body. Therefore, any disorder within the brain may adversely impact human life. Brain tumors are the acute disorders that arise from the abnormal development of cells in the brain. Among all brain tumors, malignant or cancerous tumors are very harmful to human beings; however, if diagnosed at early stages, the majority of victims may recover. For this purpose, in this article, a new methodology is preferred. The method first employed image enhancement using TSSR and then maximum entropy-based thresholding along with morphological operations were applied to extract the tumor affected region. Finally, feature extraction followed by classification is performed based on NLBP and supervised learning approaches are used to distinguish the given brain MR image as healthy or pathological. The abovementioned process is investigated in the MATLAB R2020a environment using images taken from the Harvard Medical School database. After implementing the system, various performance measures have been utilized to evaluate and compare the efficiency of the suggested method with some other existing systems. From this analysis, we observed that the proposed framework reaches better segmentation and classification accuracy when compared to state-of-the-art approaches. Hence, we conclude that our model can be used as a supportive tool for radiologists during the detection of brain tumors. In the future, our work will extend to the prediction of other medical-related diseases such as Parkinson’s disease, breast, and skin cancer.
Data availability statement
The original contributions presented in this study are included in the article/supplementary material, further inquiries can be directed to the corresponding author.
Author contributions
KR: conceptualization, methodology, software, validation, investigation, data creation, and writing—original draft preparation. RB: formal analysis. SP: resources and visualization. KR, DB, and RB: writing—review and editing. DB: supervision and funding acquisition. DB and SP: project administration. All authors read and agreed to the published version of the manuscript.
Conflict of interest
The authors declare that the research was conducted in the absence of any commercial or financial relationships that could be construed as a potential conflict of interest.
Publisher’s note
All claims expressed in this article are solely those of the authors and do not necessarily represent those of their affiliated organizations, or those of the publisher, the editors and the reviewers. Any product that may be evaluated in this article, or claim that may be made by its manufacturer, is not guaranteed or endorsed by the publisher.
References
Abd-Ellah, M. K., Awad, A. I., Khalaf, A. A., and Hamed, H. F. (2016). “Design and implementation of a computer-aided diagnosis system for brain tumor classification,” in Proceedings of the 2016 28th international conference on microelectronics (ICM), (Piscataway, NJ: IEEE). doi: 10.1002/rcs.123
Al-Ameen, Z., and Sulong, G. (2016). Ameliorating the dynamic range of magnetic resonance images using a tuned single-scale retinex algorithm. Int. J. Signal Process. Image Process. Pattern Recognit. 9, 285–292. doi: 10.14257/ijsip.2016.9.7.25
Behera, T. K., Khan, M. A., and Bakshi, S. (2022). Brain MR image classification using superpixel-based deep transfer learning. IEEE J. Biomed. Health Inform. 1–11. doi: 10.1109/JBHI.2022.3216270
Boyat, A. K., and Joshi, B. K. (2015). A review paper: Noise models in digital image processing. arXiv [Preprint]. arXiv: 1505.03489.
Cortes, C., and Vapnik, V. (1995). Support-vector networks. Mach. Learn. 20, 273—-297. doi: 10.1007/BF00994018
Cristianini, N., and Shawe-Taylor, J. (2000). An introduction to support vector machines and other kernel-based learning methods. Cambridge: Cambridge university press. doi: 10.1017/CBO9780511801389
Cunningham, P., and Delany, S. (2007). k-Nearest neighbor classifiers. Mult. Classifier Syst. 34, 1–17.
Garg, G., and Juneja, M. (2019). A survey of denoising techniques for multi-parametric prostate MRI. Multimed. Tools Appl. 78, 12689–12722. doi: 10.1007/s11042-018-6487-2
Gonzalez, R. C., Woods, R. E., and Eddins, S. L. (2003). Digital image processing using MATLAB. Hoboken, NJ: Prentice Hall.
Habib, H., Amin, R., Ahmed, B., and Hannan, A. (2021). Hybrid algorithms for brain tumor segmentation, classification and feature extraction. J. Ambient Intell. Human. Comput. 13, 2763–2784. doi: 10.1007/s12652-021-03544-8
Hua, L., Gu, Y., Gu, X., Xue, J., and Ni, T. (2021). A novel brain MRI image segmentation method using an improved multi-view fuzzy c-means clustering algorithm. Front. Neurosci. 15:662674. doi: 10.3389/fnins.2021.662674
Humeau-Heurtier, A. (2019). Texture feature extraction methods: A survey. IEEE Access 7, 8975–9000. doi: 10.1109/ACCESS.2018.2890743
Johnson, K., and Becker, J. A. (n.d.). Harvard medical school lecture notes: Introduction to neuroimaging. Available online at: http://www.med.harvard.edu/AANLIB/ (accessed May 28, 2022).
Kanmani, P., and Marikkannu, P. (2018). MRI brain images classification: A multi-level threshold based region optimization technique. J. Med. Syst. 42, 1–12. doi: 10.1007/s10916-018-0915-8
Kolla, M., Mishra, R., Zahoor Ul Huq, S., Vijayalata, Y., Gopalachari, M., and Siddiquee, K. (2022). CNN-based brain tumor detection model using local binary pattern and multilayered SVM classifier. Comput. Intell. Neurosci. 2022:9015778. doi: 10.1155/2022/9015778
Lu, S., Lu, Z., Yang, J., Yang, M., and Wang, S. (2018). A pathological brain detection system based on kernel based ELM. Multimed. Tools Appl. 77, 3715–3728. doi: 10.1007/s11042-016-3559-z
Maheshwari, S., and Kumar, T. S. (2022). “A comparison of local descriptor-based data augmentation techniques for glaucoma detection using retinal fundus images,” in Proceeding of the 2022 E-health and bioengineering conference (EHB), (Iasi: IEEE). doi: 10.1109/EHB55594.2022.9991688
Maheshwari, S., Kanhangad, V., Pachori, R., Bhandary, S., and Acharya, U. (2019). Automated glaucoma diagnosis using bit-plane slicing and local binary pattern techniques. Comput. Biol. Med. 105, 72–80. doi: 10.1016/j.compbiomed.2018.11.028
Maheshwari, S., Sharma, R., and Kumar, M. (2021). LBP-based information assisted intelligent system for COVID-19 identification. Comput. Biol. Med. 134:104453. doi: 10.1016/j.compbiomed.2021.104453
Mandle, A. K., Sahu, S. P., and Gupta, G. P. (2022). Brain tumor segmentation and classification in MRI using clustering and kernel-based SVM. Biomed. Pharmacol. J. 15, 699–716. doi: 10.13005/bpj/2409
Modiya, P., and Vahora, S. (2022). Brain tumor detection using transfer learning with dimensionality reduction method. Int. J. Intell. Syst. Appl. Eng. 10, 201–206.
Mohan, G., and Subashini, M. M. (2018). MRI based medical image analysis: Survey on brain tumor grade classification. Biomed. Signal Process. Control 39, 139–161. doi: 10.1016/j.bspc.2017.07.007
Mudda, M., Manjunath, R., and Krishnamurthy, N. (2020). Brain tumor classification using enhanced statistical texture features. IETE J. Res. 68, 1–12. doi: 10.1080/03772063.2020.1775501
Paul, J., and Sivarani, T. S. (2020). Computer aided diagnosis of brain tumor using novel classification techniques. J. Ambient Intell. Human. Comput. 12, 7499–7509. doi: 10.1007/s12652-020-02429-6
Polepaka, S., Rao, C. S., and Chandra Mohan, M. (2020). IDSS-based two stage classification of brain tumor using SVM. Health Technol. 10, 249–258. doi: 10.1007/s12553-018-00290-4
Rahman, T., and Islam, M. (2023). MRI brain tumor detection and classification using parallel deep convolutional neural networks. Measurement 26:100694. doi: 10.1016/j.measen.2023.100694
Rajesh, T., Malar, R. S. M., and Geetha, M. R. (2019). Brain tumor detection using optimization classification based on rough set theory. Cluster Comput. 22, 13853–13859. doi: 10.1007/s10586-018-2111-5
Rao, C. S., and Karunakara, K. (2021). A comprehensive review on brain tumor segmentation and classification of MRI images. Multimed. Tools Appl. 80, 17611–17643. doi: 10.1007/s11042-020-10443-1
Raschka, S. (2018). Model evaluation, model selection, and algorithm selection in machine learning. arXiv [Preprint]. arXiv:1811.12808.
Sandhya, G., Kande, G. B., and Savithri, T. S. (2020). Tumor segmentation by a self-organizing-map based active contour model (SOMACM) from the brain MRIs. IETE J. Res. 68, 3927–3939. doi: 10.1080/03772063.2020.1782780
Schapire, R. E., and Singer, Y. (1999). Improved boosting algorithms using confidence-rated predictions. Mach. Learn. 37, 297–336. doi: 10.1007/s10994-005-1123-6
Selvapandian, A., and Manivannan, K. (2018). Performance analysis of meningioma brain tumor classifications based on gradient boosting classifier. Int. J. Imaging Syst. Technol. 28, 295–301. doi: 10.1002/ima.22288
Singh, R., Goel, A., and Raghuvanshi, D. K. M. R. (2020). MR brain tumor classification employing ICA and kernel-based support vector machine. SIVIP 15, 501–510. doi: 10.1007/s11760-020-01770-9
Song, T., Feng, J., Luo, L., Gao, C., and Li, H. (2020). Robust texture description using local grouped order pattern and non-local binary pattern. IEEE Trans. Circuits Syst. Video Technol. 31, 189–202. doi: 10.1109/TCSVT.2020.2972155
Srinivas, C., K S, N., Zakariah, M., Alothaibi, Y., Shaukat, K., Partibane, B., et al. (2022). Deep transfer learning approaches in performance analysis of brain tumor classification using MRI images. J. Healthc. Eng. 2022, 1–17. doi: 10.1155/2022/3264367
Sumathi, R., and Mandadi, V. (2021). Towards better segmentation of abnormal part in multimodal images using kernel possibilistic C means particle swarm optimization with morphological reconstruction filters: Combination of KFCM and PSO with morphological filters. Int. J. E Health Med. Commun. 12, 55–73. doi: 10.4018/IJEHMC.20210501.oa4
Sumathi, R., Venkatesulu, M., and Arjunan, S. P. (2021). Segmenting and classifying MRI multimodal images using cuckoo search optimization and KNN classifier. IETE J. Res. 1–8. doi: 10.1080/03772063.2021.1939803
Tiwari, A., Srivastava, S., and Pant, M. (2020). Brain tumor segmentation and classification from magnetic resonance images: Review of selected methods from 2014 to 2019. Pattern Recognit. Lett. 131, 244–260. doi: 10.1016/j.patrec.2019.11.020
Ullah, Z., Farooq, M., Lee, S., and An, D. (2020). A hybrid image enhancement based brain MRI images classification technique. Med. Hypotheses 143:109922. doi: 10.1016/j.mehy.2020.109922
Vapnik, V. (2013). The nature of statistical learning theory. Berlin: Springer science & business media.
Veeramuthu, A., Meenakshi, S., Mathivanan, G., Kotecha, K., Saini, J., Vijayakumar, V., et al. (2022). MRI brain tumor image classification using a combined feature and image-based classifier. Front. Psychol. 13:848784. doi: 10.3389/fpsyg.2022.848784
Keywords: brain tumors, entropy, magnetic resonance imaging, non-local binary pattern, thresholding, tuned single-scale retinex
Citation: Reddy KR, Batchu RK, Polinati S and Bavirisetti DP (2023) Design of a medical decision-supporting system for the identification of brain tumors using entropy-based thresholding and non-local texture features. Front. Hum. Neurosci. 17:1157155. doi: 10.3389/fnhum.2023.1157155
Received: 02 February 2023; Accepted: 06 March 2023;
Published: 22 March 2023.
Edited by:
Sunil Kumar Telagamsetti, KU Leuven, BelgiumReviewed by:
Rishi Raj Sharma, Defence Institute of Advanced Technology (DIAT), IndiaShishir Maheshwari, Thapar Institute of Engineering & Technology, India
Mahesh Gour, Maulana Azad National Institute of Technology, India
Copyright © 2023 Reddy, Batchu, Polinati and Bavirisetti. This is an open-access article distributed under the terms of the Creative Commons Attribution License (CC BY). The use, distribution or reproduction in other forums is permitted, provided the original author(s) and the copyright owner(s) are credited and that the original publication in this journal is cited, in accordance with accepted academic practice. No use, distribution or reproduction is permitted which does not comply with these terms.
*Correspondence: Durga Prasad Bavirisetti, ZHVyZ2EuYmF2aXJpc2V0dGlAbnRudS5ubw==