 Yun Wang
 Hongxia Xuan1,2†
 Wenli Hu
- 1Department of Neurology, Beijing Chaoyang Hospital, Capital Medical University, Beijing, China
- 2Department of Neurology, Hongda Hospital, Jiamusi University, Jiamusi, China
Background: The aim of this study was to explore the clinical relevance of linear measures of Wilson's disease (WD).
Methods: Relative values of brain atrophy in 30 patients with WD and 30 healthy volunteers were measured and compared using a manual measurement method. Linear measurement indicators of brain atrophy in patients with and without mental disorders were also compared. In addition, correlations of patients' age, disease duration, and Unified Wilson's Disease Rating Scale (UWDRS) scores with brain atrophy indicators were determined.
Results: The results showed that the e-value, Huckman number, Evans index, and lateral ventricular body index were higher in the WD group compared with the control group. The age of patients with WD was negatively correlated with the k-value and significantly positively correlated with the brainstem index. WD duration was prominently positively correlated with the d-value and negatively correlated with the j-value. In addition, neurological function scores were significantly positively correlated with the c-value, e-value, caudate nucleus index, Huckman number, Evans index, and lateral ventricular body index. By contrast, patients with psychiatric symptoms had a higher a-value and fourth ventricular index than those without psychiatric symptoms.
Conclusion: Therefore, it can be concluded that patients with WD and those with psychiatric symptoms have more severe brain atrophy compared to normal subjects. The patient's age, disease duration, and neurological function scores were positively correlated with the severity of brain atrophy.
1. Introduction
Wilson's disease (WD) is an autosomal recessive disorder that occurs more frequently in adolescence (Fernando et al., 2020). It is chronic and progressive condition that can trigger abnormal copper metabolism in multiple organs of the body, resulting in a series of diseases due to systemic copper accumulation (Kitzberger et al., 2005), even with lifelong medication (Hedera, 2019). Previous studies indicated that WD has various initial symptoms (Pfeiffer, 2016) and a high misdiagnosis rate at an early stage. With complicated and diverse clinical manifestations, it may present with a single system or multisystem involvement and can be classified into the brain type, liver type, and mixed type (Poujois et al., 2017; Guindi, 2019; Mulligan and Bronstein, 2020), of which brain damage provoked by WD has brought great distress to people's life and health.
Brain atrophy caused by WD is very common, occurring in 31.6% of patients (Zhong et al., 2019; Du and Bydder, 2021), and is associated with copper accumulation in the brain (Czlonkowska et al., 2018; Dusek et al., 2019). One study found a correlation with WD nerve injury by measuring the longitudinal brain atrophy rate (Smolinski et al., 2022). Moreover, brain atrophy is a marker of increased risk of death (Lauksio et al., 2021; van den Berg, 2022), which can be divided into cerebral atrophy, cerebellar atrophy, and brain stem atrophy (Hayashi et al., 2008; Christova et al., 2017; Gellersen et al., 2017). As a chronic disease, brain atrophy leads to memory loss, decreased concentration, and language disorders (Park and Reuter-Lorenz, 2009; Callisaya et al., 2019; Mungas et al., 2021). Importantly, it is not easily detected owing to its slow development, but once the condition worsens, it will seriously affect the health and life of patients. Therefore, early detection and timely treatment can minimize the impact of brain atrophy on patients and bring the best results (Sastre-Garriga et al., 2020). Previous studies have shown that neuroimaging (Shribman et al., 2022), sNfL levels (Wang et al., 2022), the Unified Wilson's Disease Rating Scale (UWDRS) neurological and psychiatric subscales, and the GAS of the WD Tier 2 score (Volpert et al., 2017) can be used as biomarkers of WD (Pfeiffer, 2020). Currently, MRI has been reported to be mostly used to diagnose brain atrophy and classify it into diffuse brain atrophy and localized cerebral atrophy based on its scope, degree, and location (Planche et al., 2021). In addition, the third ventricle width, fourth ventricular index, frontal angle index, caudate nucleus index, Evans index, Huckman number, lateral ventricular body index, brainstem index, superior cerebellar cistern index, and sulcus width are usually determined using visual and linear measurements. The Huckman number is the sum of the widths of the anterior and posterior ventricular horns on both sides (Chrzan et al., 2019), the Evans index is the ratio of the maximum distance between the bilateral anterior ventricular horns in the axial position and the maximum internal diameter of the cranial cavity at the same level, and an Evans index value of >0.3 indicates ventricular enlargement (Chrzan et al., 2019; Zhou and Xia, 2021). However, the association between the severity and clinical features of brain atrophy in patients with WD remains unclear.
This study aimed to compare the linear measurement indicators of brain atrophy in patients with WD and healthy controls and quantitatively analyze the atrophy of different brain structures in patients with WD to investigate the correlation between the degree of brain atrophy and clinical manifestations.
2. Methods
2.1. Research object
A total of 30 patients with the brain type of WD, 15 men and 15 women, aged 15–54 (31.60 ± 11.03) years, with disease duration ranging from 0.5 to 24 years, diagnosed in the Neurology Department of the Beijing Chaoyang Hospital from January 2017 to January 2022, were involved in this study according to the diagnosed criteria of the Chinese Guidelines for Diagnosis and Treatment of Hepatolenticular Degeneration 2021 (Li, 2022). All patients have neurological and/or psychiatric symptoms. Among them, 20 (20/30, 66.67%) had limb tremors, 18 (18/30, 60.00%) had rigidity, and nine (9/30, 30.00%) had memory loss and decreased concentration. Meanwhile, 11 (11/30, 36.67%) had different degrees of psychiatric symptoms, including insomnia, anxiety, depression, visual hallucinations, auditory hallucination, and suicide impulsion, and 27 (27/30, 90.00%) had KF rings. In addition, 18 (18/30, 60.00%) had hepatic dysfunction and eight (8/30, 26.67%) had gastrointestinal symptoms such as constipation. Among the female patients, four (4/15, 26.67%) had irregular menstruation and five (5/15, 33.33%) had a history of abortion. All patients were on medication. Except for two cases that took zinc only, other patients were treated with penicillium or penicillium combined with zinc.
Thirty healthy volunteers without underlying diseases and neurological symptoms, aged 16–54 (31.30 ± 10.40) years, were recruited as controls, including 14 men and 16 women. All participants had signed informed consent. The study was approved by the Ethics Committee of the Beijing Chaoyang Hospital, Capital Medical University (2022-KE-484).
2.2. Clinical evaluation
All patients with WD were examined using the UWDRS score (Volpert et al., 2017). The full UWDRS consists of three subscales: the neurological subscale, the hepatic subscale, and the psychiatric subscale. It represents the three main features of the clinical presentation of WD.
2.3. Linear measurement of brain atrophy
Head MRI was performed on all patients and normal controls. Brain imaging was carried out by the same neurologist, and the required diameters of each case were measured two times and then recorded and averaged.
The measured indicators were as follows: (1) a, the maximum transverse diameter of the fourth ventricular; h, the maximum transverse diameter of the posterior cranial fossa brain tissue; and a/h, the fourth ventricular index; (2) b, the maximum distance between the frontal horns of bilateral brain ventricles; i, the transverse diameter of the brain tissue at the b level; and b/i, the frontal angle index; (3) c, the minimum distance between the two caudate nuclei of frontal horns of bilateral brain ventricles; j, the transverse diameter of the brain tissue at the c level; and c/j, the caudate nucleus index; (4) b + c, the Huckman number and c/b, the Evans index; (5) d, the width of the third ventricle; (6) e, the minimum distance between the lateral walls of bilateral brain ventricles; k, the brain tissue at the e level and e/k, the lateral ventricular body index; (7) f, pontine cistern width; n, the distance from the median point of the dorsum sellae posterior border to the fourth ventricle anterior border; and f/n, the brainstem index; (8) g, the width of the anterior part of the superior cerebellar cistern; o, the brain tissue at the g level; g/o, the superior cerebellar cistern index; and (9) taking the average value obtained by dividing the sum of the four widest sulcus values at the highest scan level by 4 as the measured value of sulcus 1, and a value of > 0.5 cm was considered as sulcus enlargement.
Transverse diameters of the cerebral ventricular system were represented by a, b, c, d, e, f, and g. Their values were positively related to the degree of brain atrophy, and the greater the transverse diameters, the more serious the brain atrophy. In addition, transverse diameters of the brain tissue were denoted by h, i, j, k, n, and o. The ratio of the transverse diameter of the ventricles to the corresponding transverse diameter of the brain tissue was known as the measured relative value of brain atrophy, and the greater the relative value, the more severe the brain atrophy.
2.4. MRI acquisition
MRI was performed with a 3.0-T scanner (Trio, Siemens) with a 20-channel birdcage head coil. The MRI scanning sequences included T1-weighted imaging [sagittal slice thickness, 5.0 mm; slice spacing, 0.35 mm; repetition time msec/echo time ms, 2,000/9; field of view, 230 × 230 mm; spatial resolution: 1.2 × 1.2 × 5 mm], T2-weighted imaging [sagittal slice thickness, 5.0 mm; slice spacing, 0.35 mm; repetition time ms/echo time ms, 5,000/94; field of view, 230 × 230 mm; spatial resolution: 1.2 × 1.2 × 5 mm], diffusion-weighted imaging (DWI) [sagittal slice thickness, 5.0 mm; slice spacing, 0.35 mm; repetition time ms/echo time ms, 4,000/86; field of view, 230 × 230 mm, spatial resolution: 1.2 × 1.2 × 5 mm], and liquid flip recovery attenuation sequence (FLAIR) [sagittal slice thickness, 5.0 mm; slice spacing, 0.4 mm; repetition time ms/echo time ms, 2,000/9; field of view, 190 × 190 mm, spatial resolution: 1.2 × 1.2 × 5 mm]. The MRI protocol also included sagittal T1-weighted three-dimensional fast spin-echo acquisition, with the following parameters: sagittal slice thickness, 5.0 mm; slice spacing, 0.4 mm; repetition time ms/echo time ms, 2,000/9; field of view, 190 × 190 mm; and spatial resolution: 1.2 × 1.2 × 5 mm.
2.5. Statistical analysis
Statistical analysis was conducted using SPSS version 22.0. Continuous data in normal distribution were expressed as mean ± standard deviation, and Student's t-test was applied for comparison between the two groups; continuous data not in normal distribution were presented as M (Q1–Q3), and the Mann–Whitney U-test was carried out for comparison between the two groups. For bivariate normally distributed, Pearson's analysis was performed, and for bivariate with at least one variable did not normally distribute, Spearman's analysis was employed. A P < 0.05 was considered a significant difference.
3. Results
3.1. UWDRS score of patients with WD
As shown in Table 1, the average scores of the UWDRS, neurological function, psychiatric symptom, and liver function of the 30 patients were 37.50 (9.25–76.25), 29.00 (7.00–66.25), 2.00 (0–7.00), and 0.50 (0–2.00), respectively.
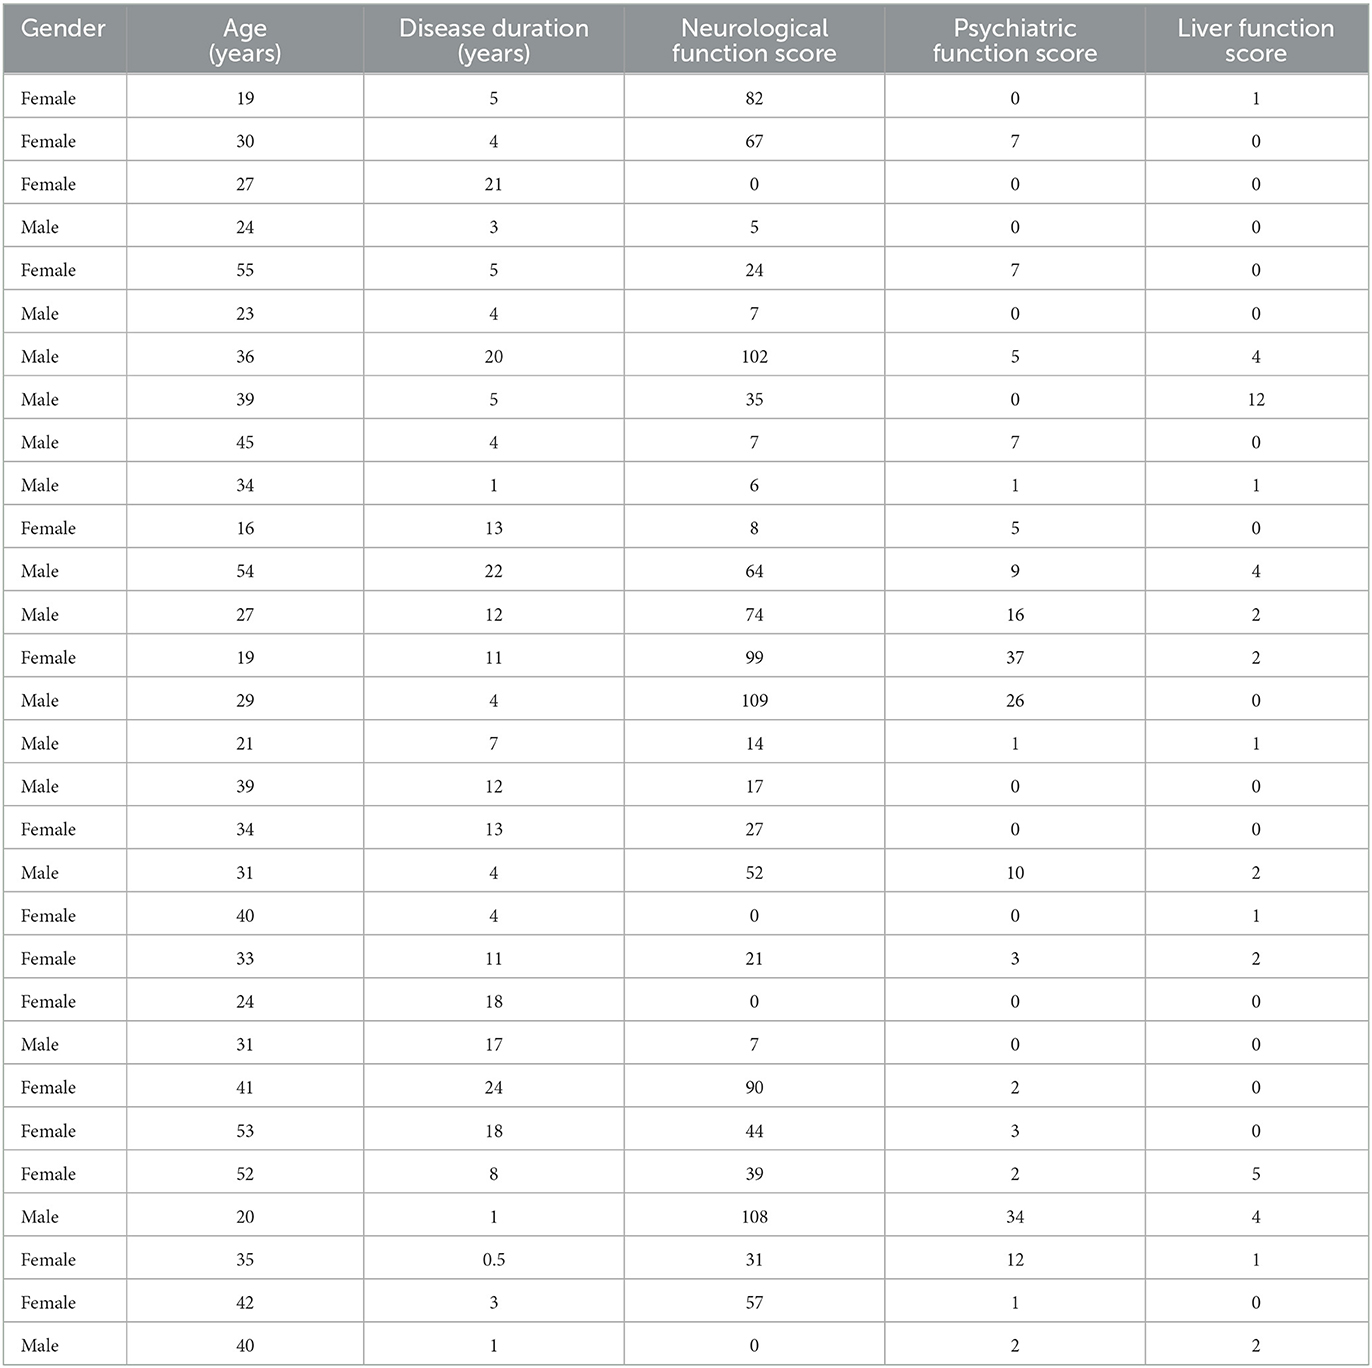
Table 1. Basic information of 30 patients with WD.
3.2. Comparison of linear measurement indicators of brain atrophy between patients with WD and healthy controls
As shown in Table 2, the WD group had a lower h-value (P < 0.001) and k-value (P = 0.005) and a higher e-value (P = 0.001) compared to the control group. In addition, the Huckman number (P < 0.001), Evans index (P < 0.001), and lateral ventricular body index (P < 0.001) in the WD group were higher than those in the control group. Therefore, patients with WD had more serious brain atrophy.
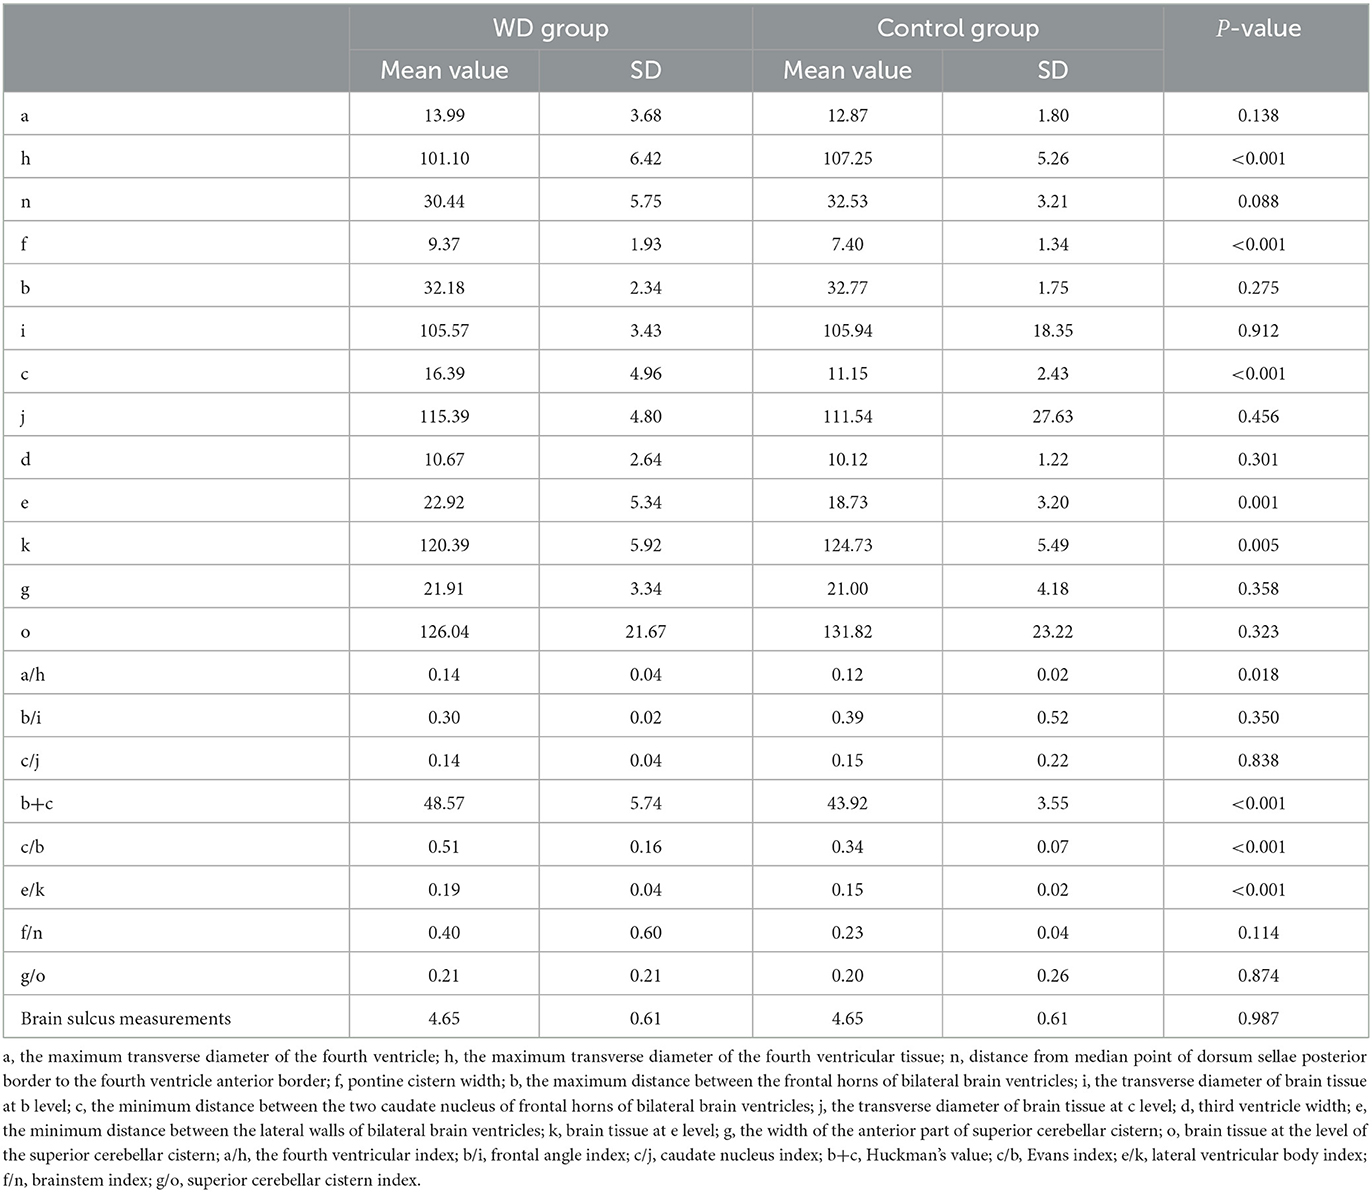
Table 2. Linear measurement indicators of brain atrophy in WD patients and healthy controls.
3.3. Correlation between age, disease duration, and linear measurement indicators of brain atrophy in patients with WD
As presented in Table 3, the age of patients with WD was dramatically negatively correlated with the k-value (P = 0.047, r = −0.365) and significantly positively correlated with the brainstem index (P = 0.049, r = 0.362). Furthermore, most of the ventricular system transverse diameters and the measured relative values of brain atrophy were positively correlated with the age of patients. Although there was no statistically significant difference, it had a certain reference value. These findings indicated that older patients with WD had worse brain atrophy. In addition, we found that the disease duration of patients with WD was markedly positively correlated with the d-value (P = 0.027, r = 0.403) but prominently negatively related to the j-value (P = 0.027, r = −0.403). Most of the measured relative values of brain atrophy had a positive link to the age of patients. However, no statistically significant difference was detected. Thus, it could be seen that WD patients with longer disease duration had more serious brain atrophy.
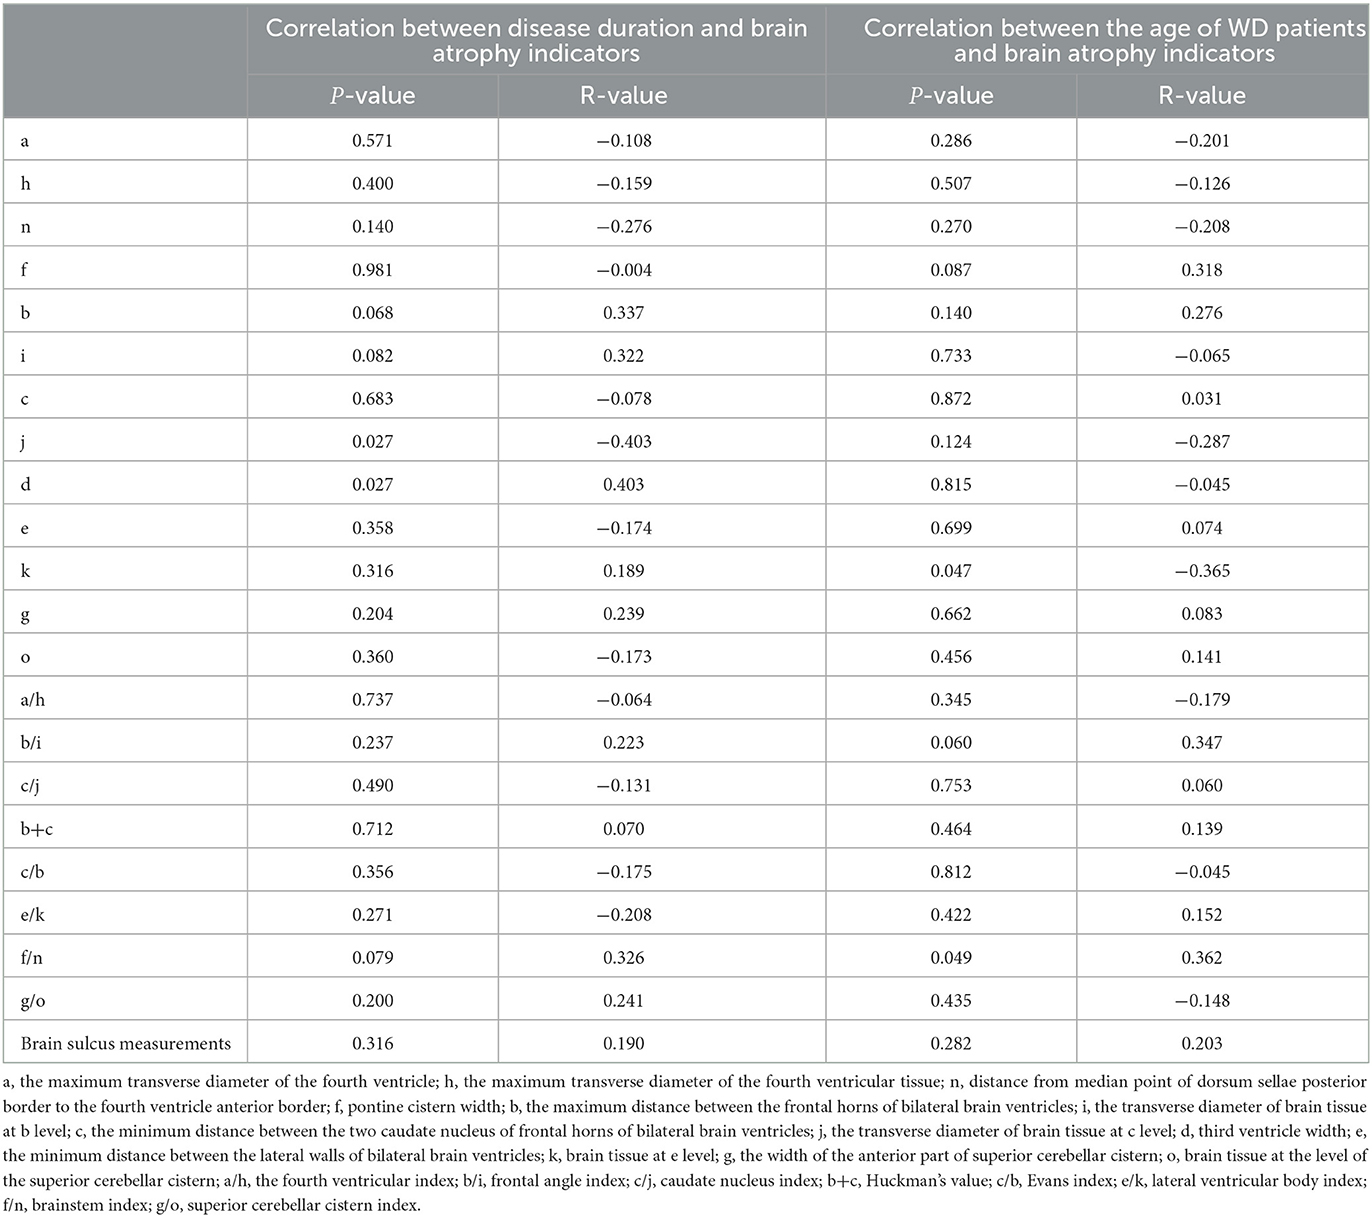
Table 3. Correlation between age, disease duration, and linear measurement indicators of brain atrophy in WD patients.
3.4. Correlation between the UWDRS neurological function score and the linear measurement indicators of brain atrophy in patients with WD
In the present study, we observed that the neurological function score was notably positively related to the c-value (P = 0.001, r = 0.597) and the e-value (P < 0.001, r = 0.706) (Table 4). In addition, it was significantly positively correlated with many measured relative values of brain atrophy, including caudate nucleus index (P = 0.001, r = 0.596), Huckman number (P = 0.002, r = 0.535), Evans index (P = 0.001, r = 0.583), and lateral ventricular body index (P < 0.001, r = 0.676). These results suggested that the higher the neurological function score, the more severe the brain atrophy.
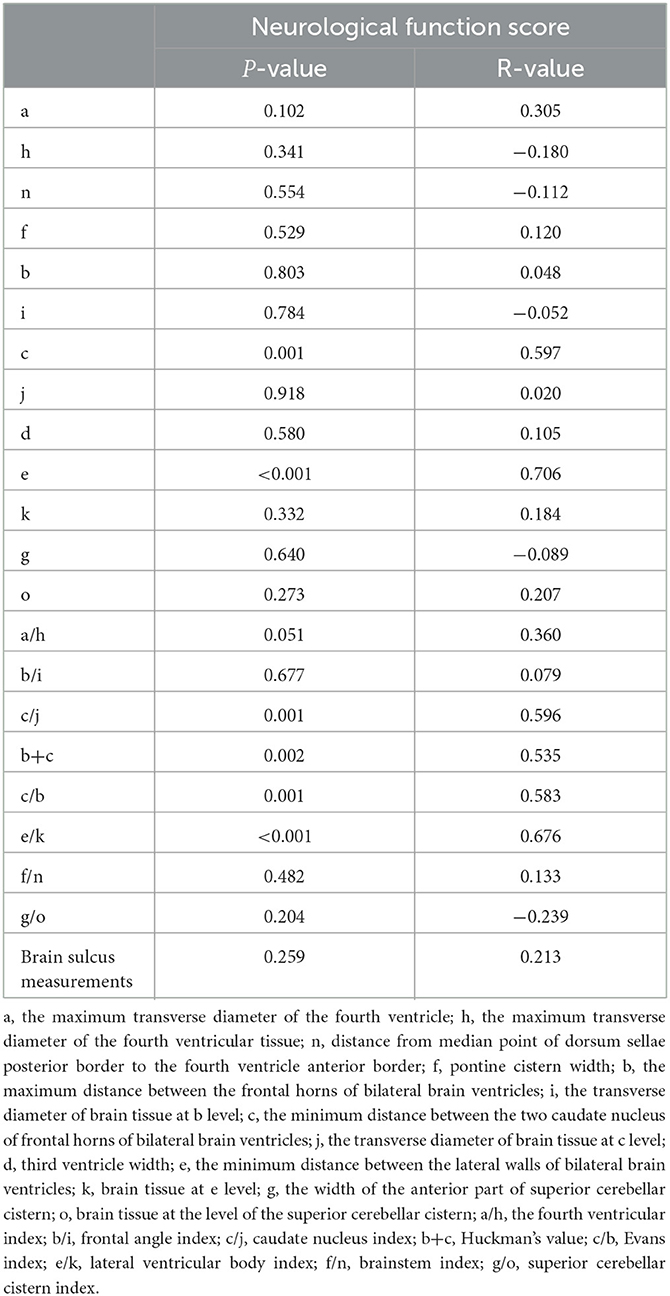
Table 4. Correlation between the UWDRS neurological function score and the linear measurement indicators of brain atrophy in WD patients.
3.5. Comparison of linear measurement indicators of brain atrophy between patients with and without psychiatric symptoms
As shown in Table 5, patients with psychiatric symptoms exhibited a higher a-value (P = 0.013) and a fourth ventricular index (P = 0.006) than those without psychiatric symptoms. Moreover, most measured relative values of brain atrophy were higher in patients with psychiatric symptoms than in those without psychiatric symptoms. Therefore, brain atrophy in patients with psychiatric symptoms was more severe.

Table 5. Linear measures of brain atrophy between WD patients with and without psychiatric symptoms.
4. Discussion
Wilson's disease is an autosomal recessive inherited disease caused by gene mutation and is often misdiagnosed (Lorincz, 2010). Brain atrophy was most evident in the central structure of patients with WD (Dusek et al., 2021). Du and Bydder (2021) suggested that brain atrophy is a good biomarker for evaluating the clinical severity of WD. In this study, the degree of brain atrophy in patients was analyzed using linear measurement, and the association of brain atrophy severity with the clinical manifestations in patients was further explored. Our results revealed that patients with WD had more serious brain atrophy than healthy individuals, and the age, disease duration, and neurological function score were all positively correlated with the severity of brain atrophy. In addition, patients with psychiatric symptoms showed more serious brain atrophy.
This study compared WD patients with healthy controls based on linear measurement indicators after the head MRI, attempting to investigate the brains of patients. MRI is an important tool for detecting brain atrophy and increasing research is trying to explore and expand its functions (Dusek et al., 2020; Shribman et al., 2021). Studies suggested that abnormalities in the putamen nucleus, the pons, the midbrain, and the thalamus are commonly found in WD via MRI (Yu et al., 2019). Our study indicated that the WD group had a higher Huckman number (P < 0.001), Evans index (P < 0.001), and lateral ventricular body index (P < 0.001). The study by Hamed et al. revealed a correlation between age and brain atrophy (Hamed et al., 2020). However, the association of patients' age and disease duration with the linear measurement indicators of brain atrophy caused by WD is yet to be adequately studied. In this study, we observed that the age of patients was markedly positively linked to the brainstem index (P = 0.049, r = 0.362). In addition, the disease duration was positively correlated with the degree of brain atrophy.
The UWDRS plays an essential role in assessing the severity of WD (Leinweber et al., 2008), and it has also been demonstrated to be associated with WD-induced brain atrophy (Dusek et al., 2021). Our study found that the neurological function score, psychiatric symptom score, and liver function score were low in patients with WD, and the correlation between neurological function score and linear measurement indicators of brain atrophy caused by WD remained to be investigated. Smolinski et al. found that patients with neurological manifestations had significantly higher annualized atrophy rates than other patients (Smolinski et al., 2022) and that the volume of all major brain structures correlated with functional and neurological impairment in patients with WD (Smolinski et al., 2019). In line with previous studies which revealed an association between brain atrophy and cognitive functions (Nagai et al., 2008; Liu et al., 2016), Kalita et al. found that midbrain atrophy was associated with nervous system severity through 3D BRAVO sequence measurements of the midbrain and the pons (Kalita et al., 2017). Song et al. quantified brain morphological abnormalities by whole brain volume and cortical thickness using 3D T1-weighted images (Song et al., 2021). We observed that the neurological function score was significantly positively correlated with various measured relative values of brain atrophy. Furthermore, as psychiatric dysfunctions are crucial clinical features of patients with WD (Pfeiffer, 2016), the present study compared the linear measurement indicators of brain atrophy in patients with and without psychiatric symptoms, indicating that patients with psychiatric symptoms had a higher a value (P = 0.013) and fourth ventricular index (P = 0.006).
In conclusion, by exploring the relationship between the linear measurement indicators of WD-caused brain atrophy and the clinical manifestations, we found that patients with WD have more serious brain atrophy than healthy individuals and those with longer disease duration and older age exhibit worse brain atrophy. The results also suggest that the neurological function scores of patients with WD were positively correlated with the severity of brain atrophy. In addition, patients with psychiatric symptoms have more severe brain atrophy. However, this study also has some limitations. The number of participants in our study was limited; thus, the correlation between the degree of brain atrophy and clinical manifestations in patients with WD still needs to be further studied by analyzing more clinical features and a larger number of subjects. In addition, in future research studies, we will try to use more sophisticated measures of brain atrophy and explore the relations between the measures and the pathological changes of WD, such as the damage to specific deep gray matter nuclei. Since brain atrophy caused by WD is a pressing problem, more explorations and research studies are needed to resolve it.
Data availability statement
The raw data supporting the conclusions of this article will be made available by the authors, without undue reservation.
Ethics statement
The study was approved by the Ethics Committee of Beijing Chaoyang Hospital, Capital Medical University (2022-KE-484). The patients/participants provided their written informed consent to participate in this study.
Author contributions
YW and HX designed and conceived this study. TZ and XL analyzed the data and created the tables. SL and WH contributed to the measurement of MRI images and wrote the article. All authors reviewed and approved the manuscript.
Funding
This research was supported by the National Natural Science Foundation of China (No. 81771414).
Conflict of interest
The authors declare that the research was conducted in the absence of any commercial or financial relationships that could be construed as a potential conflict of interest.
Publisher's note
All claims expressed in this article are solely those of the authors and do not necessarily represent those of their affiliated organizations, or those of the publisher, the editors and the reviewers. Any product that may be evaluated in this article, or claim that may be made by its manufacturer, is not guaranteed or endorsed by the publisher.
References
Callisaya, M. L., Beare, R., Moran, C., Phan, T., Wang, W., Srikanth, V. K., et al. (2019). Type 2 diabetes mellitus, brain atrophy and cognitive decline in older people: a longitudinal study. Diabetologia. 62, 448–458. doi: 10.1007/s00125-018-4778-9
Christova, P., James, L. M., Engdahl, B. E., Lewis, S. M., Carpenter, A. F., Georgopoulos, A. P., et al. (2017). Subcortical brain atrophy in Gulf War Illness. Exp. Brain Res. 235, 2777–2786. doi: 10.1007/s00221-017-5010-8
Chrzan, R., Glen, A., Bryll, A., and Urbanik, A. (2019). Computed tomography assessment of brain atrophy in centenarians. Int. J. Environ. Res. Public Health. 16, 3659. doi: 10.3390/ijerph16193659
Czlonkowska, A., Litwin, T., Dusek, P., Ferenci, P., Lutsenko, S., Medici, V., et al. (2018). Wilson disease. Nat Rev Dis Primers. 4, 21. doi: 10.1038/s41572-018-0018-3
Du, J., and Bydder, G. M. (2021). Brain atrophy is a better biomarker than susceptibility for evaluating clinical severity in wilson disease. Radiology. 299, 673–674. doi: 10.1148/radiol.2021210106
Dusek, P., Lescinskij, A., Ruzicka, F., Acosta-Cabronero, J., Bruha, R., Sieger, T., et al. (2021). Associations of brain atrophy and cerebral iron accumulation at MRI with clinical severity in Wilson disease. Radiology. 299, 662–672. doi: 10.1148/radiol.2021202846
Dusek, P., Litwin, T., and Czlonkowska, A. (2019). Neurologic impairment in Wilson disease. Ann Transl Med. 7, S64. doi: 10.21037/atm.2019.02.43
Dusek, P., Smolinski, L., Redzia-Ogrodnik, B., Golebiowski, M., Skowronska, M., Poujois, A., et al. (2020). Semiquantitative scale for assessing brain MRI abnormalities in Wilson disease: a validation study. Mov. Disord. 35, 994–1001. doi: 10.1002/mds.28018
Fernando, M., van Mourik, I., Wassmer, E., and Kelly, D. (2020). Wilson disease in children and adolescents. Arch. Dis. Child. 105, 499–505. doi: 10.1136/archdischild-2018-315705
Gellersen, H. M., Guo, C. C., O'Callaghan, C., Tan, R. H., Sami, S., Hornberger, M., et al. (2017). Cerebellar atrophy in neurodegeneration-a meta-analysis. J. Neurol. Neurosurg. Psychiatr. 88, 780–788. doi: 10.1136/jnnp-2017-315607
Guindi, M. (2019). Wilson disease. Semin. Diagn. Pathol. 36, 415–422. doi: 10.1053/j.semdp.2019.07.008
Hamed, M. A., Ponce, F. A., Lambert, M., and Moguel-Cobos, G. (2020). Subcortical atrophy and motor outcomes in pallidal deep brain stimulation for Parkinson disease. World Neurosurg. 142, e89–e94. doi: 10.1016/j.wneu.2020.06.046
Hayashi, N., Sanada, S., Suzuki, M., Matsuura, Y., Kawahara, K., Tsujii, H., et al. (2008). Semiautomated volumetry of the cerebrum, cerebellum-brain stem, and temporal lobe on brain magnetic resonance images. Radiat. Med. 26, 104–114. doi: 10.1007/s11604-007-0200-0
Hedera, P. (2019). Wilson's disease: a master of disguise. Parkinsonism Relat. Disord. 59, 140–145. doi: 10.1016/j.parkreldis.2019.02.016
Kalita, J., Naik, S., Bhoi, S. K., Misra, U. K., Ranjan, A., Kumar, S., et al. (2017). Pontomesencephalic atrophy and postural instability in Wilson disease. AJNR Am. J. Neuroradiol. 38, 1343–1347. doi: 10.3174/ajnr.A5207
Kitzberger, R., Madl, C., and Ferenci, P. (2005). Wilson disease. Metab. Brain Dis. 20, 295–302. doi: 10.1007/s11011-005-7910-8
Lauksio, I., Lindstrom, I., Khan, N., Sillanpaa, N., Hernesniemi, J., Oksala, N., et al. (2021). Brain atrophy predicts mortality after mechanical thrombectomy of proximal anterior circulation occlusion. J. Neurointerv. Surg. 13, 415–420. doi: 10.1136/neurintsurg-2020-016168
Leinweber, B., Moller, J. C., Scherag, A., Reuner, U., Gunther, P., Lang, C. J., et al. (2008). Evaluation of the unified Wilson's disease rating scale (UWDRS) in German patients with treated Wilson's disease. Mov. Disord. 23, 54–62. doi: 10.1002/mds.21761
Li, T. (2022). Chinese Guidelines for the diagnosis and treatment of HIV/AIDS (2021 edition). Infect. Dis. Immunol. 3, 002. doi: 10.3760/cma.j.cn112138-20211006-00676
Liu, G., Weinger, J. G., Lu, Z. L., Xue, F., and Sadeghpour, S. (2016). Efficacy and safety of MMFS-01, a synapse density enhancer, for treating cognitive impairment in older adults: a randomized, double-blind, placebo-controlled trial. J. Alzheimers. Dis. 49, 971–990. doi: 10.3233/JAD-150538
Lorincz, M. T. (2010). Neurologic Wilson's disease. Ann. N. Y. Acad. Sci. 1184, 173–187. doi: 10.1111/j.1749-6632.2009.05109.x
Mulligan, C., and Bronstein, J. M. (2020). Wilson disease: an overview and approach to management. Neurol. Clin. 38, 417–432. doi: 10.1016/j.ncl.2020.01.005
Mungas, D., Fletcher, E., Gavett, B. E., Widaman, K., Zahodne, L. B., Hohman, T. J., et al. (2021). Comparison of education and episodic memory as modifiers of brain atrophy effects on cognitive decline: implications for measuring cognitive reserve. J. Int. Neuropsychol. Soc. 27, 401–411. doi: 10.1017/S1355617720001095
Nagai, M., Hoshide, S., Ishikawa, J., Shimada, K., and Kario, K. (2008). Ambulatory blood pressure as an independent determinant of brain atrophy and cognitive function in elderly hypertension. J. Hypertens. 26, 1636–1641. doi: 10.1097/HJH.0b013e3283018333
Park, D. C., and Reuter-Lorenz, P. (2009). The adaptive brain: aging and neurocognitive scaffolding. Annu. Rev. Psychol. 60, 173–196. doi: 10.1146/annurev.psych.59.103006.093656
Pfeiffer, R. F. (2016). Wilson Disease. Continuum (Minneap Minn). 22, 1246–1261. doi: 10.1212/CON.0000000000000350
Pfeiffer, R. F. (2020). Diagnosing Wilson's disease under the sword of damocles. Neurol. Neurochir. Pol. 54, 364–365. doi: 10.5603/PJNNS.2020.0086
Planche, V., Bouteloup, V., Mangin, J. F., Dubois, B., Delrieu, J., Pasquier, F., et al. (2021). Clinical relevance of brain atrophy subtypes categorization in memory clinics. Alzheimers. Dement. 17, 641–652. doi: 10.1002/alz.12231
Poujois, A., Mikol, J., and Woimant, F. (2017). Wilson disease: brain pathology. Handb. Clin. Neurol. 142, 77–89. doi: 10.1016/B978-0-444-63625-6.00008-2
Sastre-Garriga, J., Pareto, D., Battaglini, M., Rocca, M. A., Ciccarelli, O., Enzinger, C., et al. (2020). MAGNIMS consensus recommendations on the use of brain and spinal cord atrophy measures in clinical practice. Nat. Rev. Neurol. 16, 171–182. doi: 10.1038/s41582-020-0314-x
Shribman, S., Burrows, M., Convery, R., Bocchetta, M., Sudre, C. H., Acosta-Cabronero, J., et al. (2022). Neuroimaging correlates of cognitive deficits in Wilson's disease. Mov. Disord. 37, 1728–1738. doi: 10.1002/mds.29123
Shribman, S., Poujois, A., Bandmann, O., Czlonkowska, A., and Warner, T. T. (2021). Wilson's disease: update on pathogenesis, biomarkers and treatments. J. Neurol. Neurosurg. Psychiatr. 92, 1053–1061. doi: 10.1136/jnnp-2021-326123
Smolinski, L., Litwin, T., Redzia-Ogrodnik, B., Dziezyc, K., Kurkowska-Jastrzebska, I., Czlonkowska, A., et al. (2019). Brain volume is related to neurological impairment and to copper overload in Wilson's disease. Neurol. Sci. 40, 2089–2095. doi: 10.1007/s10072-019-03942-z
Smolinski, L., Ziemssen, T., Akgun, K., Antos, A., Skowronska, M., Kurkowska-Jastrzebska, I., et al. (2022). Brain atrophy is substantially accelerated in neurological wilson's disease: a longitudinal study. Mov. Disord. 37, 2446–2451. doi: 10.1002/mds.29229
Song, Y., Zou, L., Zhao, J., Zhou, X., Huang, Y., Qiu, H., et al. (2021). Whole brain volume and cortical thickness abnormalities in Wilson's disease: a clinical correlation study. Brain Imaging Behav. 15, 1778–1787. doi: 10.1007/s11682-020-00373-9
van den Berg, J. C. (2022). Measurement of the brain atrophy index to predict mortality: a ‘no brainer’? Eur. J. Vasc Endovasc Surg. S1078–5884, 865–866. doi: 10.1016/j.ejvs.2022.12.023
Volpert, H. M., Pfeiffenberger, J., Groner, J. B., Stremmel, W., Gotthardt, D. N., Schafer, M., et al. (2017). Comparative assessment of clinical rating scales in Wilson's disease. BMC Neurol. 17, 140. doi: 10.1186/s12883-017-0921-3
Wang, R. M., Xu, W. Q., Zheng, Z. W., Yang, G. M., Zhang, M. Y., Ke, H. Z., et al. (2022). Serum neurofilament light chain in Wilson's disease: a promising indicator but unparallel to real-time treatment response. Mov. Disord. 37, 1531–1535. doi: 10.1002/mds.29039
Yu, X. E., Gao, S., Yang, R. M., and Han, Y. Z. M. R. (2019). Imaging of the brain in neurologic Wilson disease. AJNR Am. J. Neuroradiol. 40, 178–183. doi: 10.3174/ajnr.A5936
Zhong, W., Huang, Z., and Tang, X. (2019). A study of brain MRI characteristics and clinical features in 76 cases of Wilson's disease. J. Clin. Neurosci. 59, 167–174. doi: 10.1016/j.jocn.2018.10.096
Keywords: Wilson's disease, brain atrophy, UWDRS, linear measurement, clinical correlation
Citation: Wang Y, Xuan H, Zhao T, Li X, Li S and Hu W (2023) A study of linear measurement and clinical correlation of brain atrophy in Wilson's disease. Front. Hum. Neurosci. 17:1142082. doi: 10.3389/fnhum.2023.1142082
Received: 11 January 2023; Accepted: 14 February 2023;
Published: 28 March 2023.
Edited by:
Miguel Valencia, University of Navarra/CIMA, SpainReviewed by:
Christos Bakirtzis, Aristotle University of Thessaloniki, GreeceTomasz Litwin, Institute of Psychiatry and Neurology (IPiN), Poland
Copyright © 2023 Wang, Xuan, Zhao, Li, Li and Hu. This is an open-access article distributed under the terms of the Creative Commons Attribution License (CC BY). The use, distribution or reproduction in other forums is permitted, provided the original author(s) and the copyright owner(s) are credited and that the original publication in this journal is cited, in accordance with accepted academic practice. No use, distribution or reproduction is permitted which does not comply with these terms.
*Correspondence: Yun Wang, ZHJkcnd5QDE2My5jb20=
†These authors have contributed equally to this work