
94% of researchers rate our articles as excellent or good
Learn more about the work of our research integrity team to safeguard the quality of each article we publish.
Find out more
ORIGINAL RESEARCH article
Front. Hum. Neurosci. , 08 September 2021
Sec. Brain Imaging and Stimulation
Volume 15 - 2021 | https://doi.org/10.3389/fnhum.2021.739668
 Qin Yu1†
 Zenglin Cai2†
 Cunhua Li1Yulong Xiong1
 Yang Yang3Shuang He1Haitong Tang1Bo Zhang4Shouyun Du5
 Hongjie Yan6*
 Chunqi Chang7,8*
 Nizhuan Wang1*
Many studies reported that spontaneous fluctuation of the blood oxygen level-dependent signal exists in multiple frequency components and changes over time. By assuming a reliable energy contrast between low- and high-frequency bands for each voxel, we developed a novel spectrum contrast mapping (SCM) method to decode brain activity at the voxel-wise level and further validated it in designed experiments. SCM consists of the following steps: first, the time course of each given voxel is subjected to fast Fourier transformation; the corresponding spectrum is divided into low- and high-frequency bands by given reference frequency points; then, the spectral energy ratio of the low- to high-frequency bands is calculated for each given voxel. Finally, the activity decoding map is formed by the aforementioned energy contrast values of each voxel. Our experimental results demonstrate that the SCM (1) was able to characterize the energy contrast of task-related brain regions; (2) could decode brain activity at rest, as validated by the eyes-closed and eyes-open resting-state experiments; (3) was verified with test-retest validation, indicating excellent reliability with most coefficients > 0.9 across the test sessions; and (4) could locate the aberrant energy contrast regions which might reveal the brain pathology of brain diseases, such as Parkinson’s disease. In summary, we demonstrated that the reliable energy contrast feature was a useful biomarker in characterizing brain states, and the corresponding SCM showed excellent brain activity-decoding performance at the individual and group levels, implying its potentially broad application in neuroscience, neuroimaging, and brain diseases.
Low-frequency fluctuation is an intrinsic property of human brain activity. Biswal et al. (1995) used functional magnetic resonance imaging (fMRI) technology to initially demonstrate that spontaneous low-frequency fluctuation was synchronized in the bilateral motor cortices of the brain at rest. Inspired by this study, low-frequency fluctuations in the sensorimotor and auditory cortices were also shown to have a high degree of temporal correlation (Biswal et al., 1997; Cordes et al., 2001); this phenomenon was also observed in many other brain areas such as the visual network, default mode network, and others (Lowe et al., 1998; Raichle et al., 2001; Greicius et al., 2003; Kiviniemi et al., 2004). Several studies reported that low-frequency fluctuation observed in fMRI signals was highly connected with spontaneous neuronal activities (Logothetis et al., 2001; Goldman et al., 2002). There is also growing research into low-frequency fluctuations, and a well-known example provided the theoretical basis for the spontaneous fluctuation referred to as resting-state networks (Damoiseaux et al., 2006; De Luca et al., 2006; Robinson et al., 2009; Zuo et al., 2010). Resting-state fMRI (rs-fMRI) connectivity has also been applied to reveal abnormalities in intrinsic connectivity of the salience network in patients with psychiatric disorders (Dutta et al., 2014). For example, Yang et al. (2016) found that the amplitude of low-frequency fluctuations and functional connectivity based on resting-state data exhibited consistent alterations in the bilateral anterior insula of subjects with major depressive disorder. Another notable example is the method of amplitude of low-frequency fluctuation (ALFF) (Zang et al., 2007), and study has demonstrated that ALFF can be used as a metric of brain diseases (Han et al., 2011) and for decoding brain activity (Yang et al., 2018). Furthermore, low-frequency fluctuation has been extensively applied in research into mental illness (Cui et al., 2020), neurological disease (Dutta et al., 2014), cognition (Fransson, 2005; Welsh et al., 2010), and neuroplasticity (Lewis et al., 2009; Di et al., 2012; Wu et al., 2020).
Two decades ago, there was a relatively small body of literature regarding high-frequency fluctuations (>0.08 Hz) in brain activity (Devrim et al., 1999). Animal research showed that the cat’s primary visual cortex exhibited frequency fluctuations (<0.3 Hz) (Steriade et al., 1993). Several studies were performed that primary auditory cortex regions responded to acoustic stimuli in the frequency domain of 0.1–0.5 Hz (Filippov and Frolov, 2004; Filippov et al., 2007, 2008). In terms of high-frequency fluctuations in human brain activity, Devrim et al. (1999) reported that the sensory threshold of the human visual system might be regulated by slow cortical potentials. Moreover, Salvador et al. (2008) used a measure of functional connectivity describing to show that the high- (0.17–0.25 Hz) and middle- (0.08–0.17 Hz) frequency intervals are prominent in several limbic and temporal regions. In recent years, there has been an increasing number of publications on high-frequency fluctuation (0.08–1 Hz) and progression of low-frequency fluctuation (0.01–0.08 Hz) research. For example, Gohel et al. (2018) found differences in the regions of the visual cortex and dorsal attention in the frequency band of 0.027–0.25 Hz between healthy subjects and patients with psychosis. Jiang et al. (2019) showed that the strength of dynamic functional connectivity was weakened in the thalamus subregion of patients with schizophrenia in the frequency domain of 0.073–0.198 Hz. In an examination of frequency fluctuation, Jiang et al. (2019) demonstrated new-onset, drug-naive (unmedicated) increased functional connectivity in the rolandic network in the frequency band (0.027–0.198 Hz). Furthermore, Yaesoubi et al. (2017) found that structured spectro-temporal variability existed in resting-state connectivity and can reveal differences and similarities between clinical and healthy populations. Functional connections in the high-frequency band gradually attracted research attention, and several studies reported that the high-frequency band had a similar network connection in the low-frequency fluctuation (Boubela et al., 2013; Smith-Collins et al., 2015; Trapp et al., 2018).
The aforementioned studies indicated that this signal exists in multiple frequency components and fluctuates over time. However, they largely focused on low- or high-frequency information of a given time course separately, which ignored the relationship between the two frequencies. Thus, in this paper, we first assumed that the energy contrast between the low- and high-frequency band for each voxel (in terms of the overall frequency spectrum band) is relatively stable for a certain brain state. We proposed a novel spectrum contrast mapping (SCM) method to validate the assumption of energy contrast based on the designed experiments.
The remainder of this paper is organized as follows: the theory and methods related to SCM will be presented first, followed by the experimental designs. We also describe the initial tests using SCM on task-related, resting state, test-retest datasets and further apply SCM to Parkinson’s disease (PD) resting-state dataset. Finally, the results will be presented together with interpretations and conclusions related to the advantages and limitations of our proposed model.
The proposed SCM framework was displayed in Figure 1. According to Figure 1, the experimental fMRI signals were first preprocessed by temporal detrending, and then we performed fast Fourier transformations to obtain the corresponding power spectra of brain voxels. Segmentation of the spectral signal yielded the low-frequency band (0.01–0.1 Hz) and high-frequency band (0.1–0.25 Hz), and the latter was used as the reference benchmark. Two representative values were, respectively selected from the above two frequency bands. Ultimately, SCM values were obtained by calculating the ratio of two representative values of each brain voxel signal.
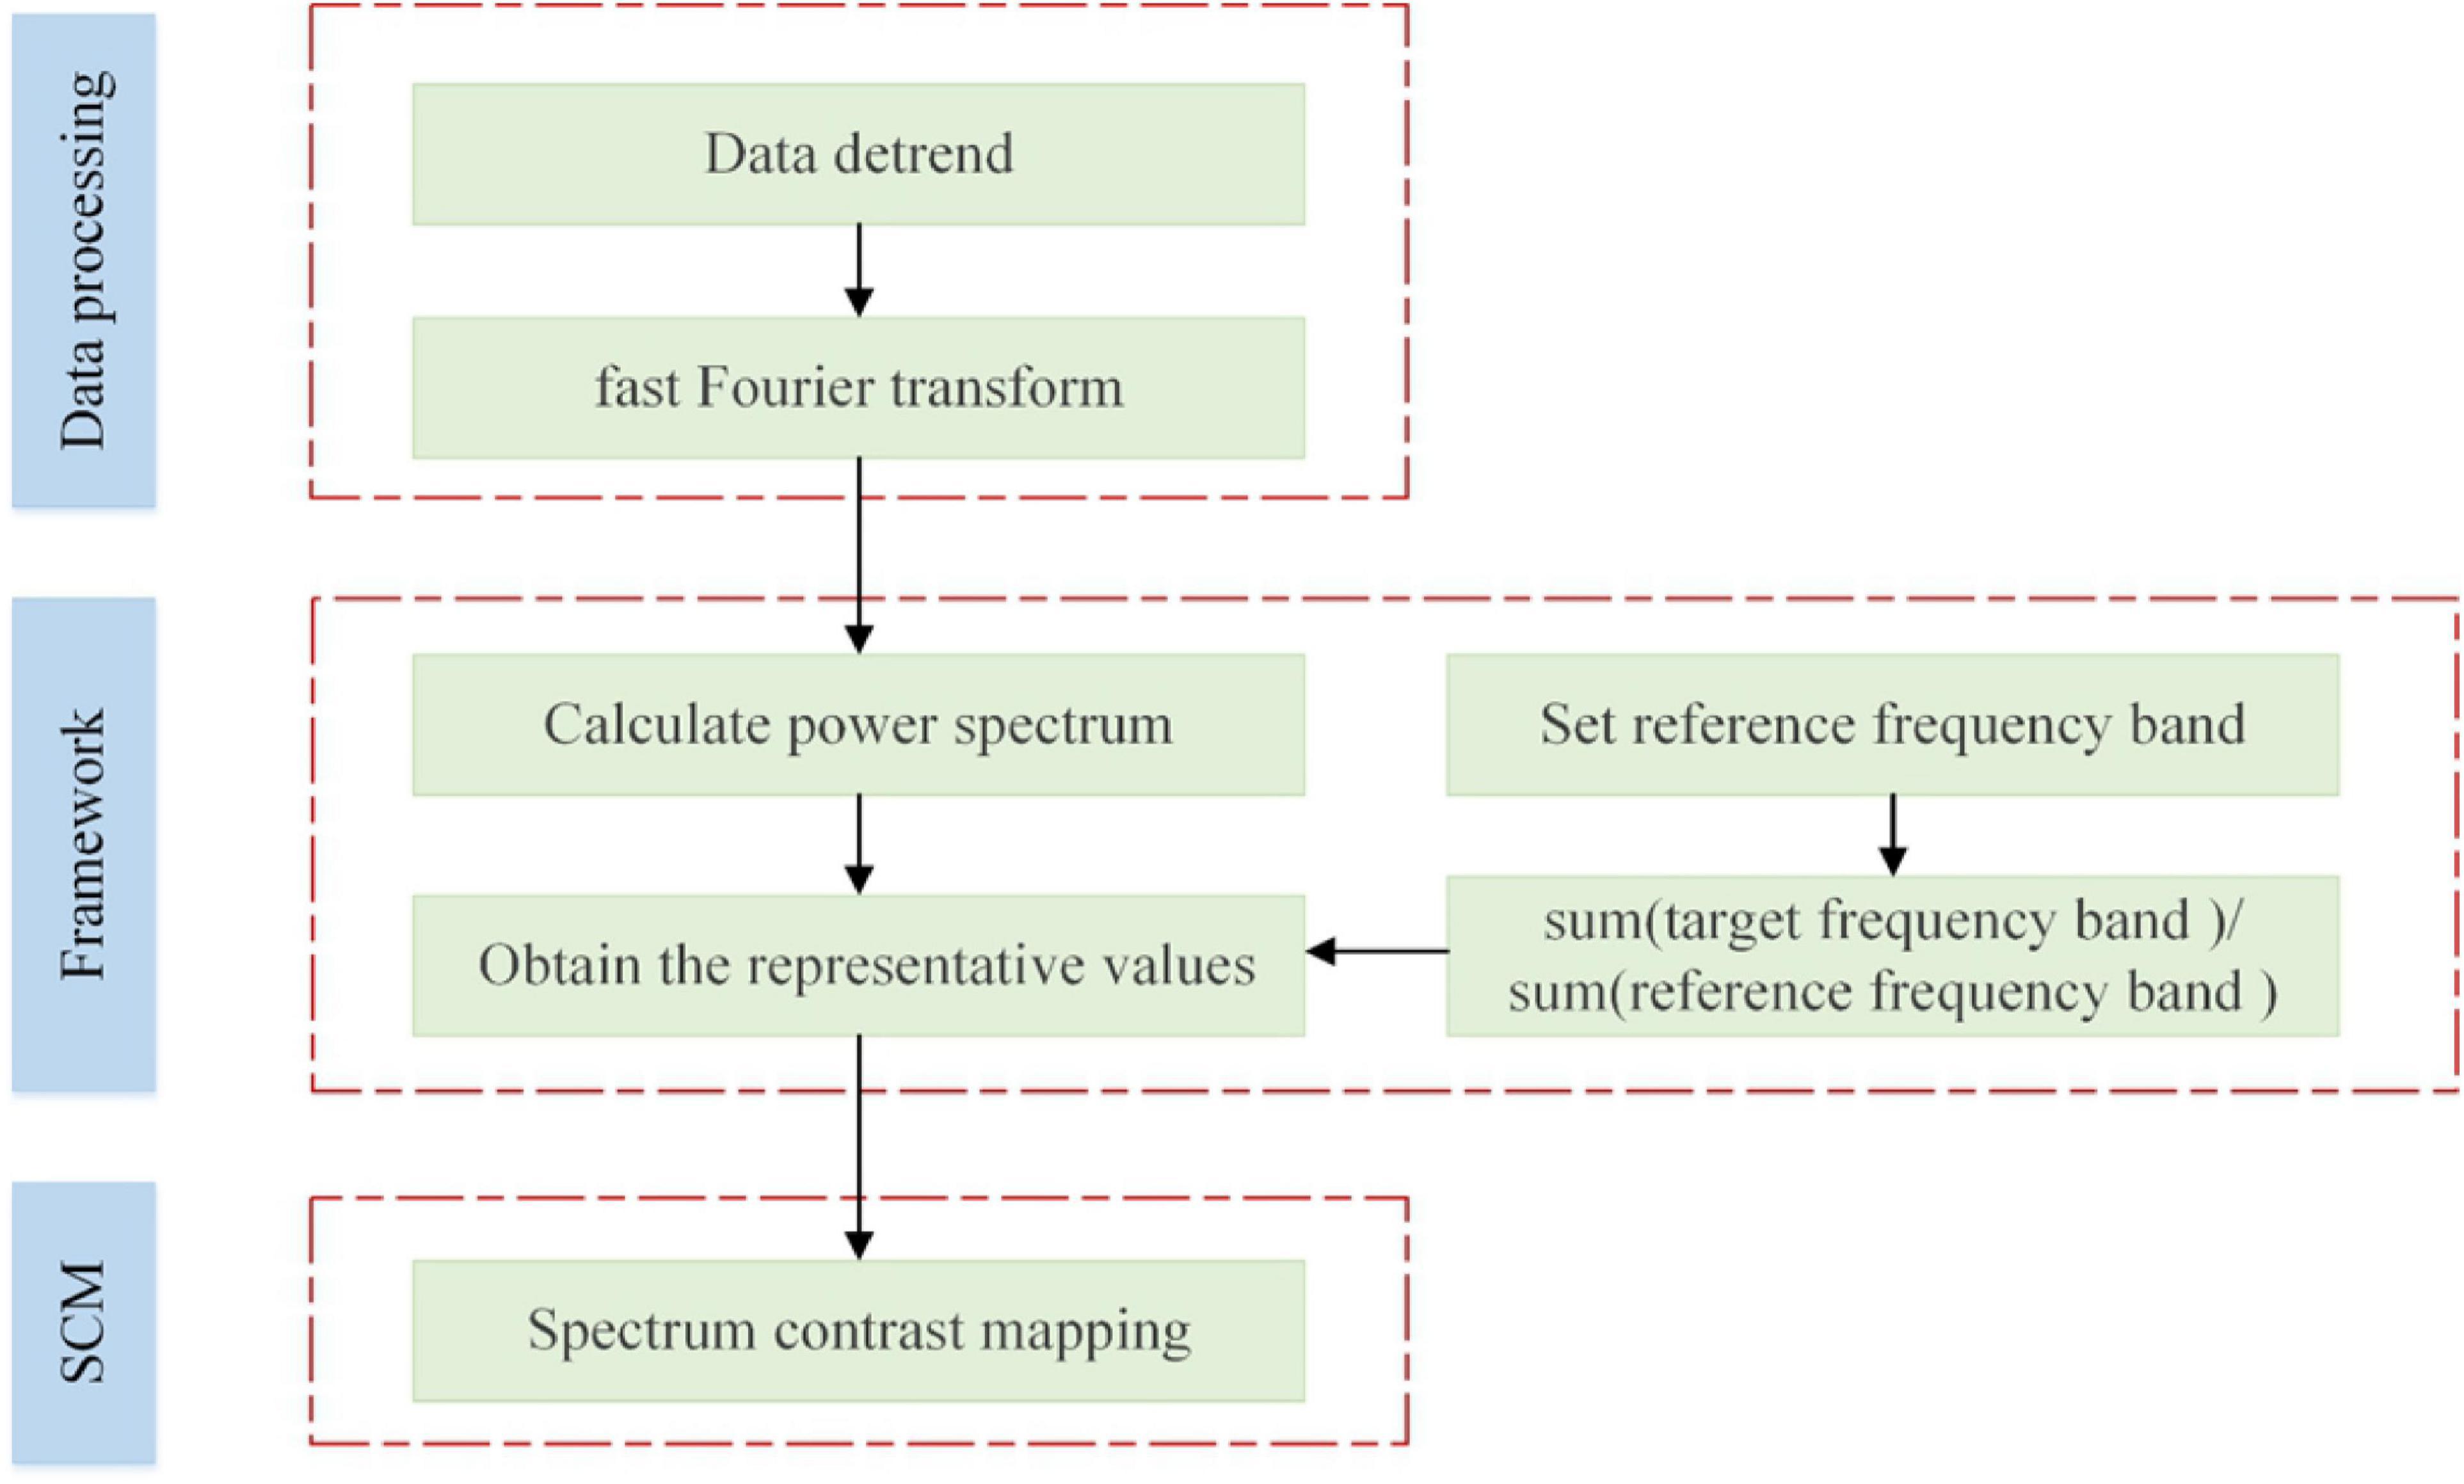
Figure 1. The framework of the proposed SCM method.
Given a signalf∈L1 (ℝ), whereAk(t)is the amplitude function, ϕk(t)is the phase function, and k is the number of components. For the time seriesf(t)of an individual element, it is expanded by Fourier series:
whereak andbk are the amplitudes of the real frequency components, fk is the frequency band,nis the number of different frequency bands, value of k:1 to n, for the following definition with SCM:
where RV represents the representative value, LFRV represents the value selected in the target low-frequency band, and HFRV represents the value selected in the high-frequency reference band. The low-, middle-, and high-frequency cut values in this study are set to 0.01, 0.1, and 0.25 Hz, respectively.
The corrcoef indicator is introduced to evaluate the effectiveness of the proposed SCM. For given matrices A and B, the correlation coefficient can be calculated as in formula (5)
where A and B are two matrices with the same dimensions, respectively; cov(•), var(•), andvec(•)represent the calculation operation of covariance, variance, and vector transform, respectively (Wang et al., 2016a).
All the algorithms and toolkits used were implemented in the Windows 10 operating system and configured as follows: Intel(R) Core (TM) i7-7700HQ CPU @ 2.80 GHz and 16GB RAM. They were run on the MATLAB 2019a platform, and all preprocessing steps were performed using dpabi software (Yan et al., 2016). The first ten time points were removed. The remaining volume images were preprocessed sequentially by slice timing, realignment, normalization, and spatial smoothing with an 8 mm full-width half-maximum Gaussian kernel.
In the visual task experimental test, six subjects were informed of the purpose of this study before taking part in the visual task-related experiment. The designed visual paradigm was OFF-ON-OFF-ON-OFF-ON in a 40-s block. In the “ON” state, the visual stimulus was a radial blue/yellow checkerboard, reversing at 7 Hz. In the “OFF” state, the participants were required to focus on a cross at the center of the screen. More experimental details can be found elsewhere (Ren et al., 2014; Wang et al., 2017).
The functional images were obtained using an echo-planar imaging (EPI) sequence with the following parameters: 33 axial slices, thickness/gap = 3.5/0.7 mm, in-plane resolution = 64 × 64, repetition time (TR) = 2,000 ms, echo time (TE) = 30 ms, flip angle 90°, field of view (FOV) = 200 × 200 mm2. Each condition consisted of 240 functional volumes. For this experiment, 45 healthy and normal subjects were selected, with eyes closed (EC) twice and once with eyes open (EO). The T1-weighted MP-RAGE image was acquired with the following parameters:128 sagittal slices, slice thickness/gap = 1.33/0 mm, in-plane resolution = 256 × 192, TR = 2,530 ms, TE = 3.39 ms, inversion time (TI) = 1,100 ms, flip angle = 7°, FOV = 256 × 256 mm2. The detailed protocol was described by Liu et al. (2013).
The test-retest resting-state fMRI dataset of 25 normal participants is available by downloading from https://www.nitrc.org/projects/nyu_trt (Shehzad et al., 2009; Zuo et al., 2010). Each participant was scanned three times at rest with a Siemens Allegra 3.0 Tesla MRI scanner, and the fMRI data for each subject consisted of 197 continuous EPI functional volumes (TR = 2 s, TE = 25 ms, flip angle = 90°, slice number = 39, matrix = 64 × 64, FOV = 192 × 192 mm2, voxel size = 3 × 3 × 3 mm3). A high-resolution T1-weighted magnetization prepared gradient echo (MPRAGE) sequence was also obtained for each participant, with the following acquisition parameters: TR = 2,500 ms, TE = 4.35 ms, TI = 900 ms, flip angle = 8°, slice number = 176, FOV = 256 × 256 mm2.
There were a total of 45 participants involved in this dataset, which had three contrast groups, i.e., cognitively normal PD with severe hyposmia (PD-SH) with 15 subjects, cognitively normal patients with PD with no/mild hyposmia (PD-N/MH) with 15 subjects, and healthy controls (HCs) with 15 subjects. Each participant was scanned at rest with a Siemens Magnetom Verio 3.0 T scanner with a 32-channel head coil. A high-resolution T1-weighted magnetization prepared gradient echo sequence was obtained for each participant. Meanwhile, the rs-fMRI scans (8 min, eyes closed) were also acquired with the following parameters: TR = 2.5 s, TE = 30 ms, slice number = 39, thickness = 3 mm, FOV = 192 × 192 mm2, matrix = 64 × 64, flip angle = 80°. The detailed protocol was described by Yoneyama et al. (2018). This dataset with accession number ds000245 was obtained from the OpenfMRI database.1
The proposed SCM was applied to extract the visual task-related voxel-wise brain activity maps of six subjects and to generate the corresponding SCM maps. The z-scored SCM maps were transformed with Z-score operation and were displayed in Figure 2. Most subjects had strong SCM values in visual task-related areas such as the occipital, fusiform, calcarine, and lingual gyri. Unlike many brain network separation models under the assumption of statistical independence or sparse distribution (Wang et al., 2012, 2013, 2016b, 2015; Yaesoubi et al., 2017; Yao et al., 2013; Shi et al., 2017; Shi and Zeng, 2018), the SCM paid more attention to the spectrum energy contrast of each voxel.

Figure 2. Extracted SCM maps for six subjects in the visual task-related dataset.
The proposed method was used in resting-state experiments for extracting brain networks in the EC and EO conditions among 45 subjects, and the corresponding SCM maps for EC and EO states were generated. The one-sample t-test SCM maps with false discovery rate (FDR) correction (Genovese et al., 2002) were calculated and displayed in Figure 3. Notably, SCM highlighted the famous default mode networks involving areas such as the medial prefrontal cortex and posterior cingulate cortex/precuneus for both the EC and EO conditions (Fransson, 2005; Buckner et al., 2008). Furthermore, parts of the dorsolateral prefrontal cortex, occipital cortex, cuneus, calcarine, lingual, fusiform, and cerebellum showed significant enhancement in the EO state compared to the EC state. Paired t-tests were performed to quantitatively analyze differences in SCM maps between the EC and EO conditions. The paired t-test maps in Figure 4 show that there were significant differences in bilateral visual areas for EC versus EO. The main differences were in the bilateral visual cortices (Brodmann areas 18 and 19) involving the occipital_mid, lingual, occipital_sup, calcarine, and cuneus. There were also differences in the fusiform and cerebellum_6 areas. These results indicated that energy contrast could be a useful biomarker to characterize the degree of activity of brain regions at rest under different conditions.
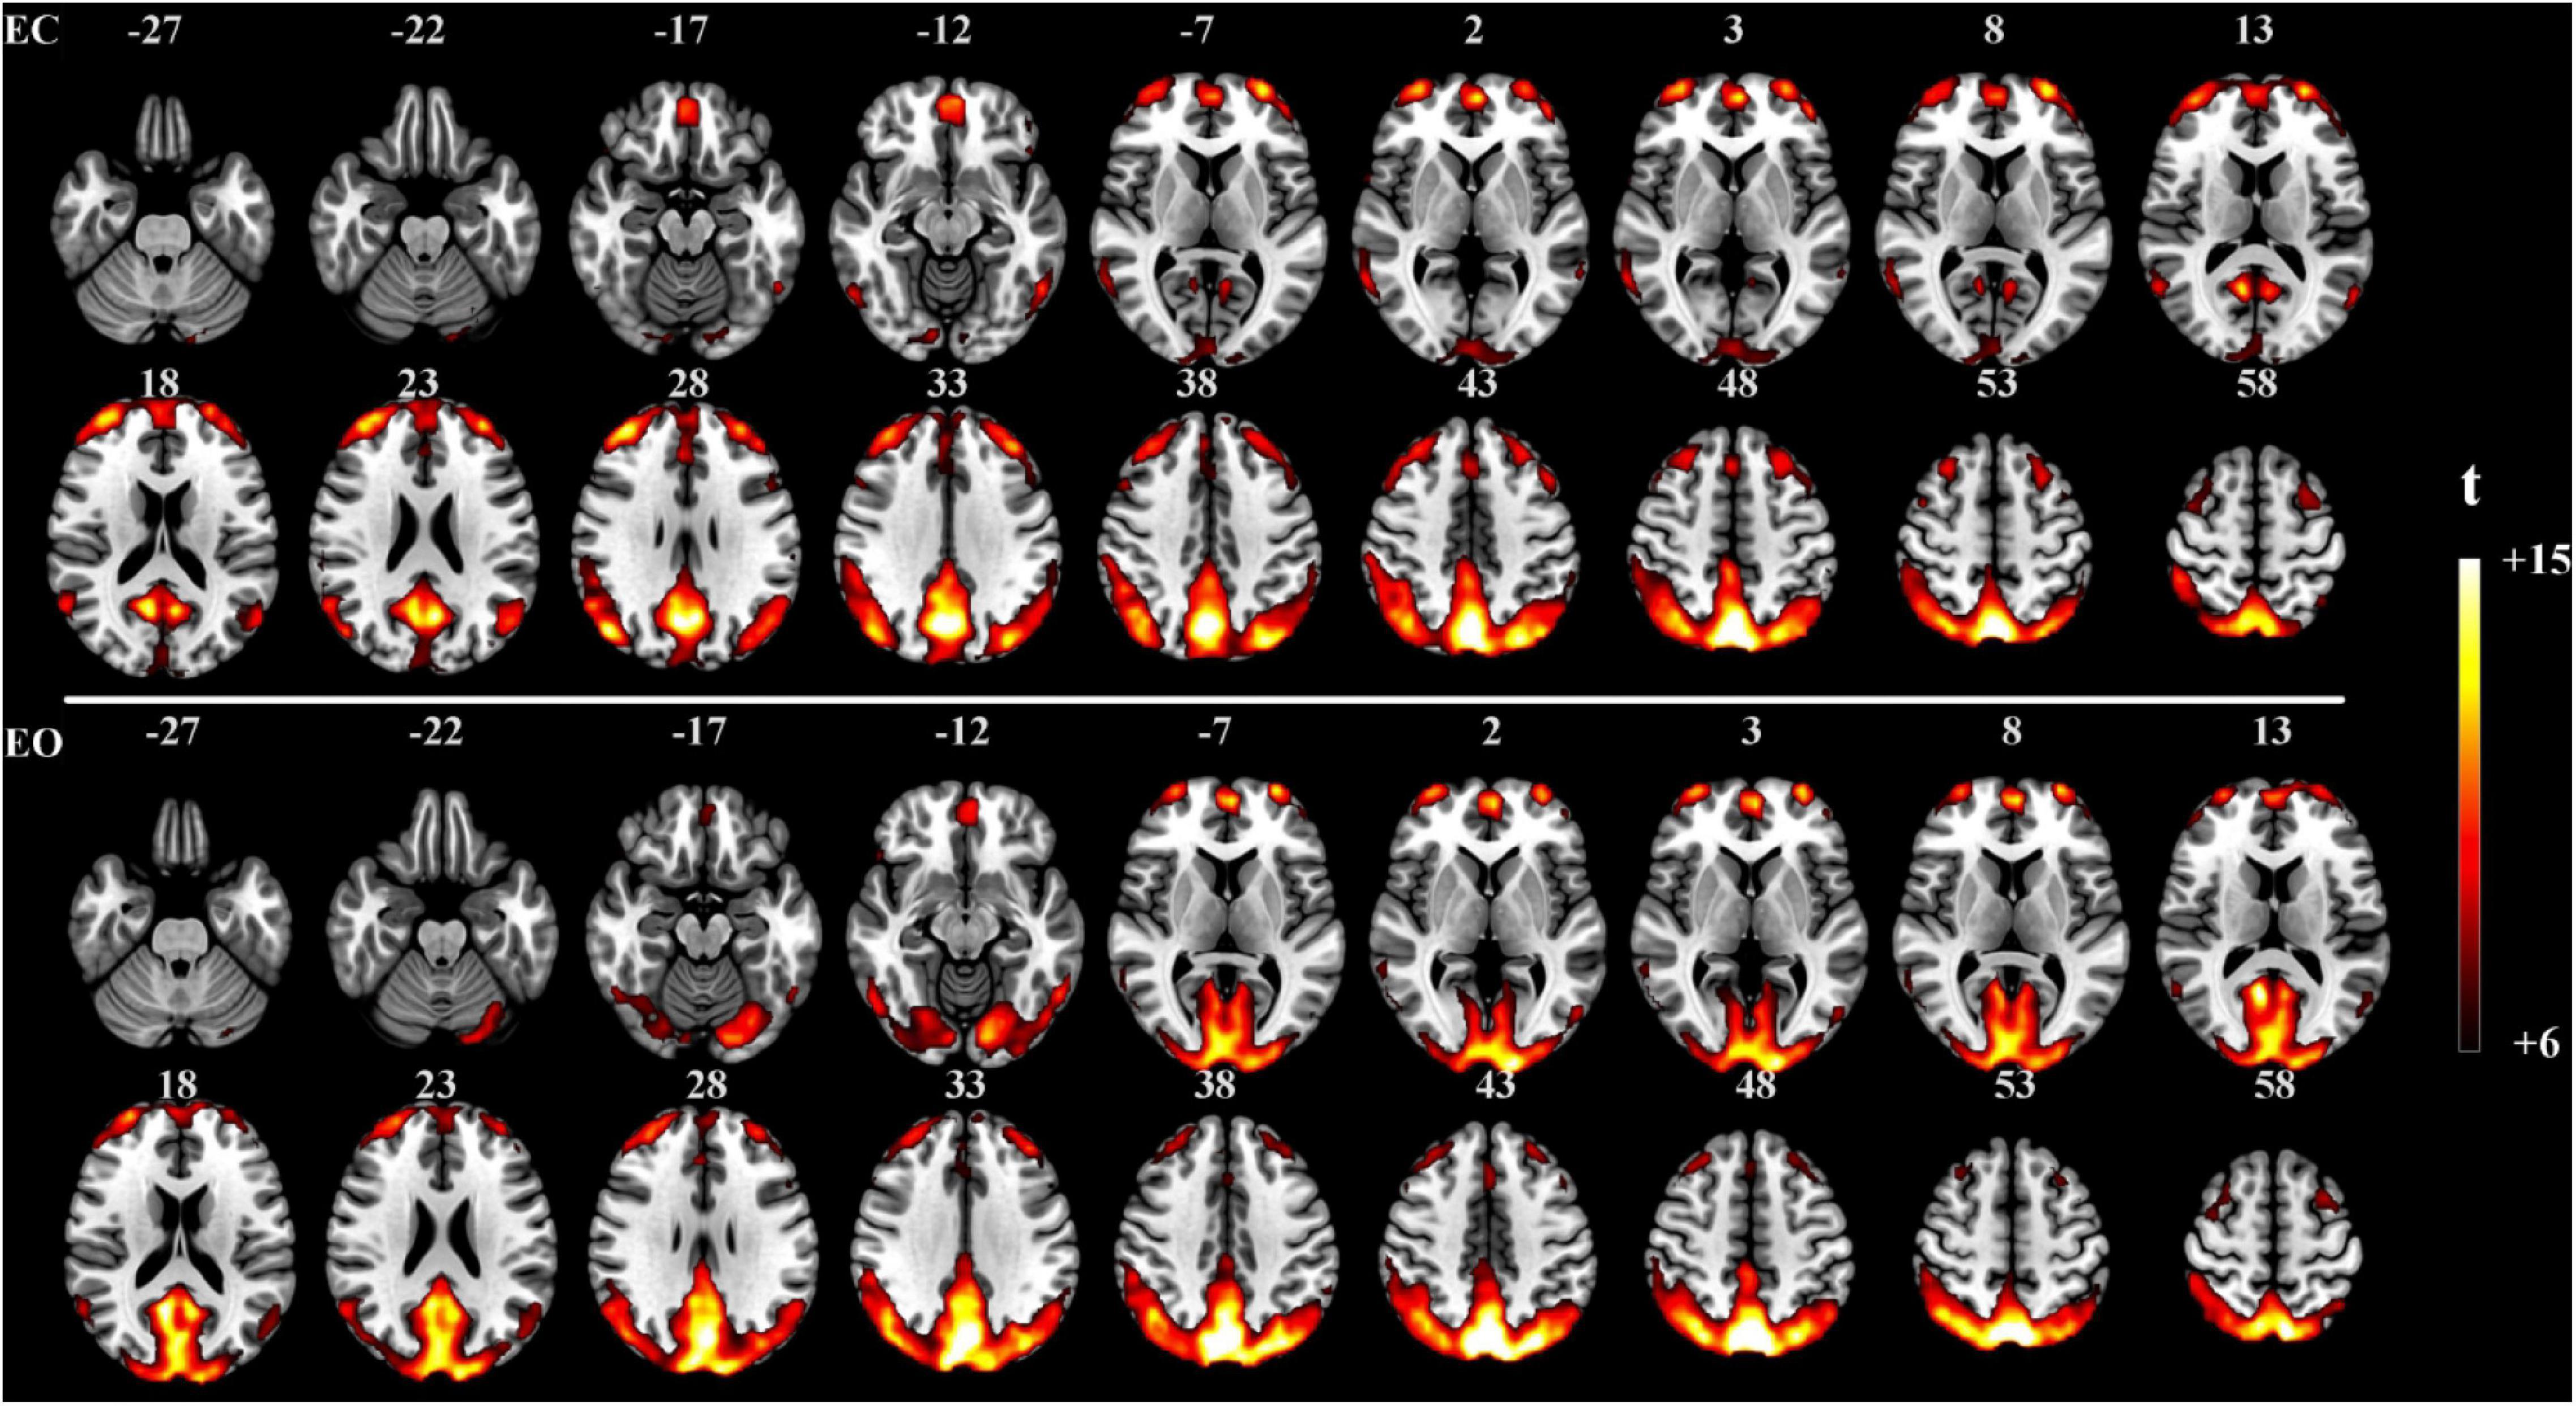
Figure 3. One-sample t-test SCM maps under the EC (n = 45, t > 6.0, p < 0.0005, FDR corrected) and EO (n = 45, t > 6.0, p < 0.0005, FDR corrected) resting-state conditions.
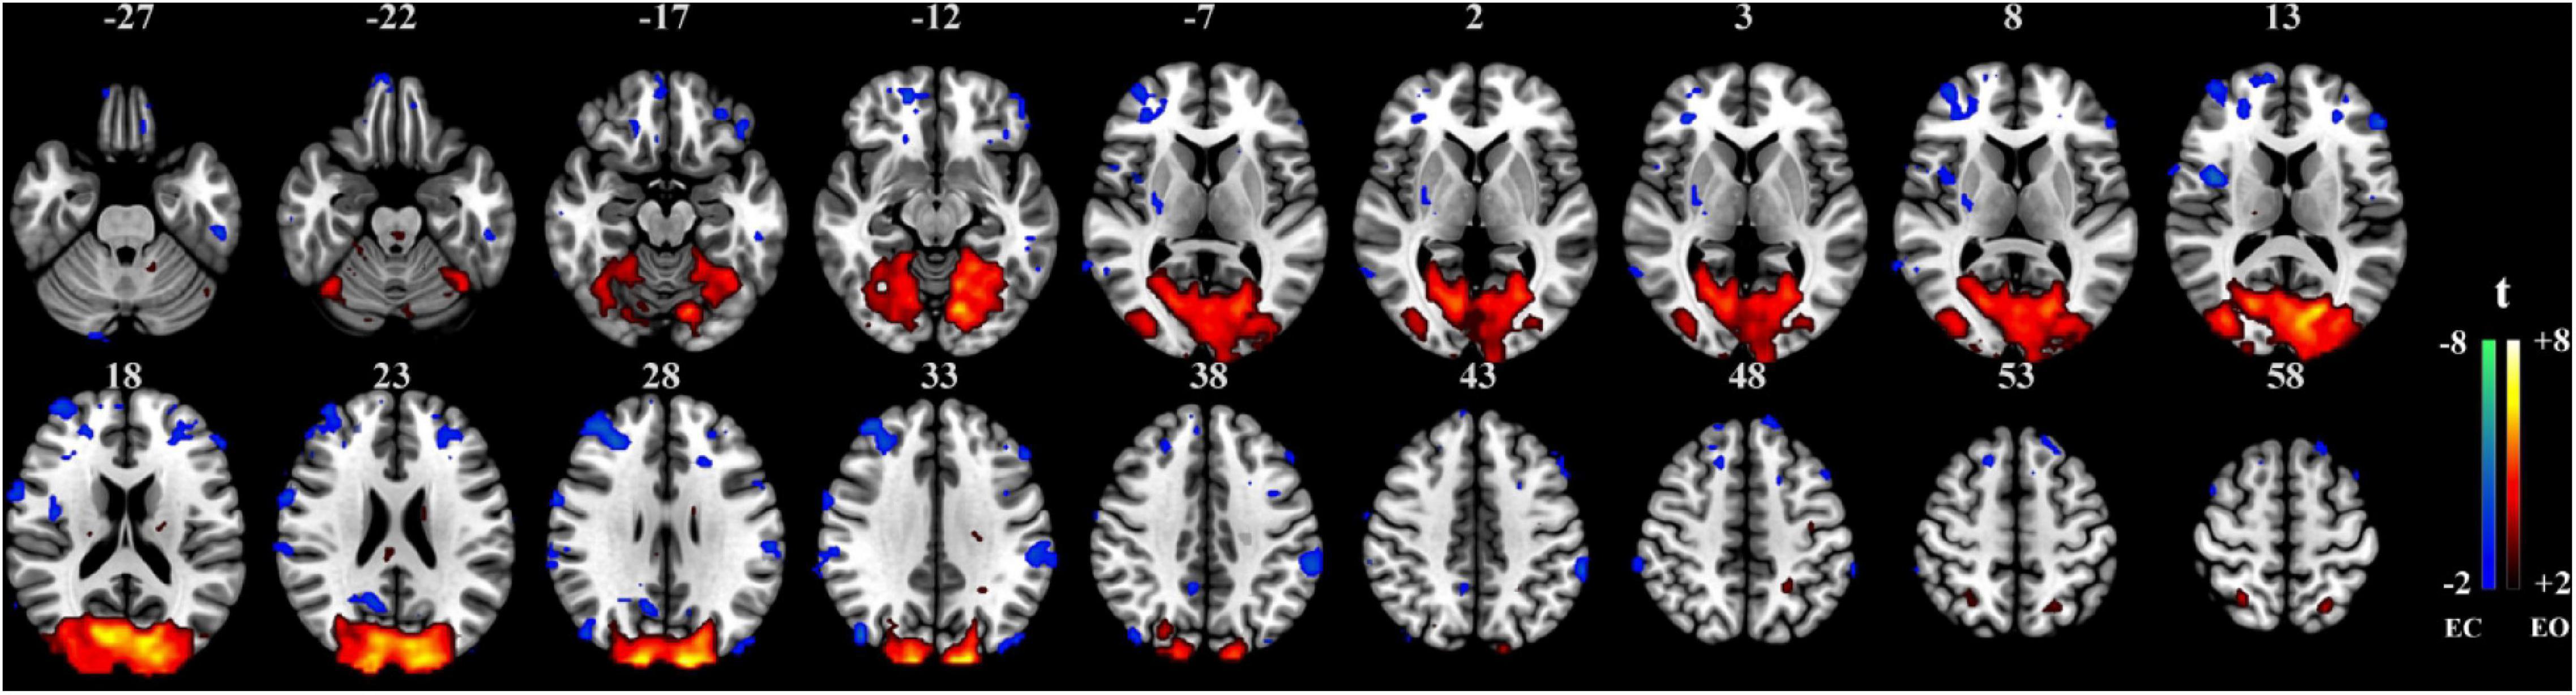
Figure 4. Paired t-test SCM maps between the EC and EO resting-state conditions (n = 45, t value > 2.0, p < 0.05, FDR corrected).
The proposed SCM method was subjected to test-retest reproducibility validation in decoding brain activity for three sessions at rest among 25 subjects, and individual SCM maps were generated. The interval between sessions 1 and sessions 2 and 3 were 5–16 months (mean 11 ± 4 months). The intercorrelation results among the SCM maps of each subject derived from different sessions were shown in Figure 5. The SCM maps of a given subject had close correlations among three sessions, especially in the intrasession scan (<1 h apart) of sessions 2 and 3. The marked mean and SD values in Figure 5 clearly showed that the proposed SCM had good individual reproducibility in test-retest resting-state experiments.
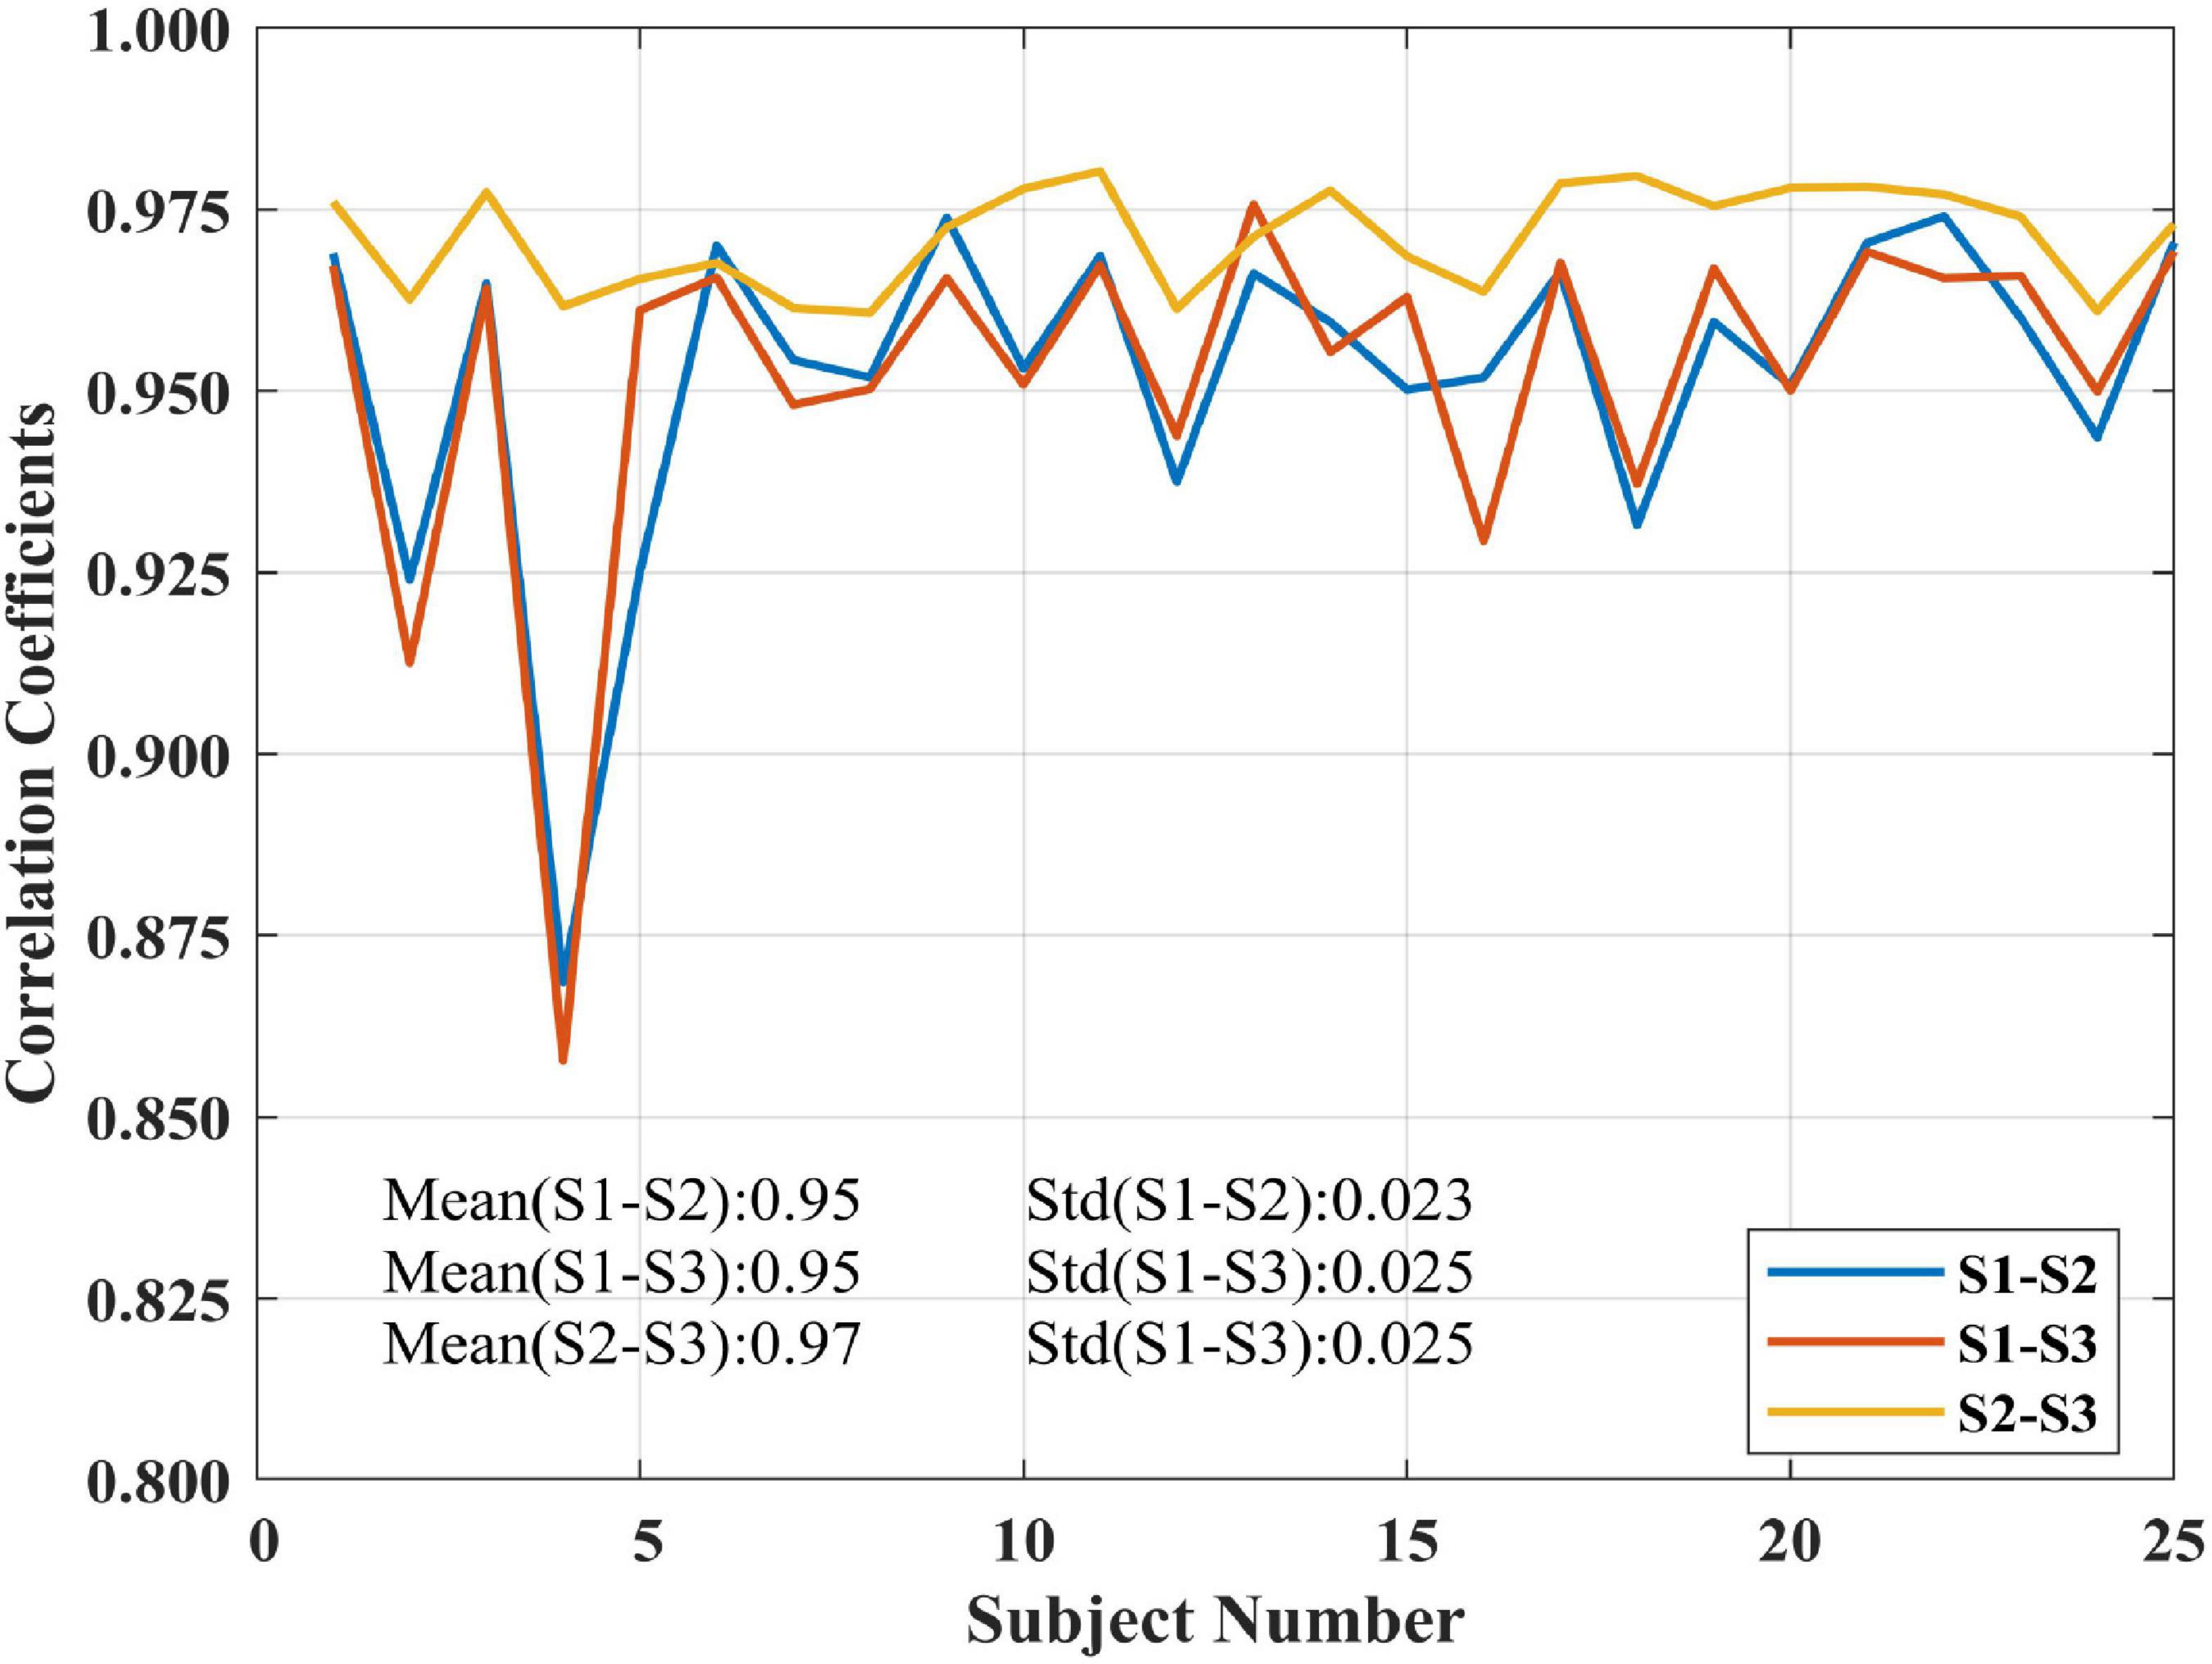
Figure 5. Correlation coefficients of SCM maps among three sessions for 25 subjects in the test-retest resting-state dataset.
The one-sample t-test SCM maps at the group level for each session were calculated and displayed in Figure 6. The visual areas, default network, and frontal lobe were simultaneously active, and there were no noisy regions in ventricles or large blood vessels. We also calculated the correlation coefficients between group-level SCM maps from three sessions. The intercorrelation coefficients of the group-level SCM maps were 0.90 (sessions 1 and 2), 0.92 (sessions 1 and 3), and 0.95 (sessions 2 and 3), demonstrating high reproducibility. Based on the test-retest validation results, the spectrum contrast feature was an effective biomarker with high reproducibility at both the individual and group levels.
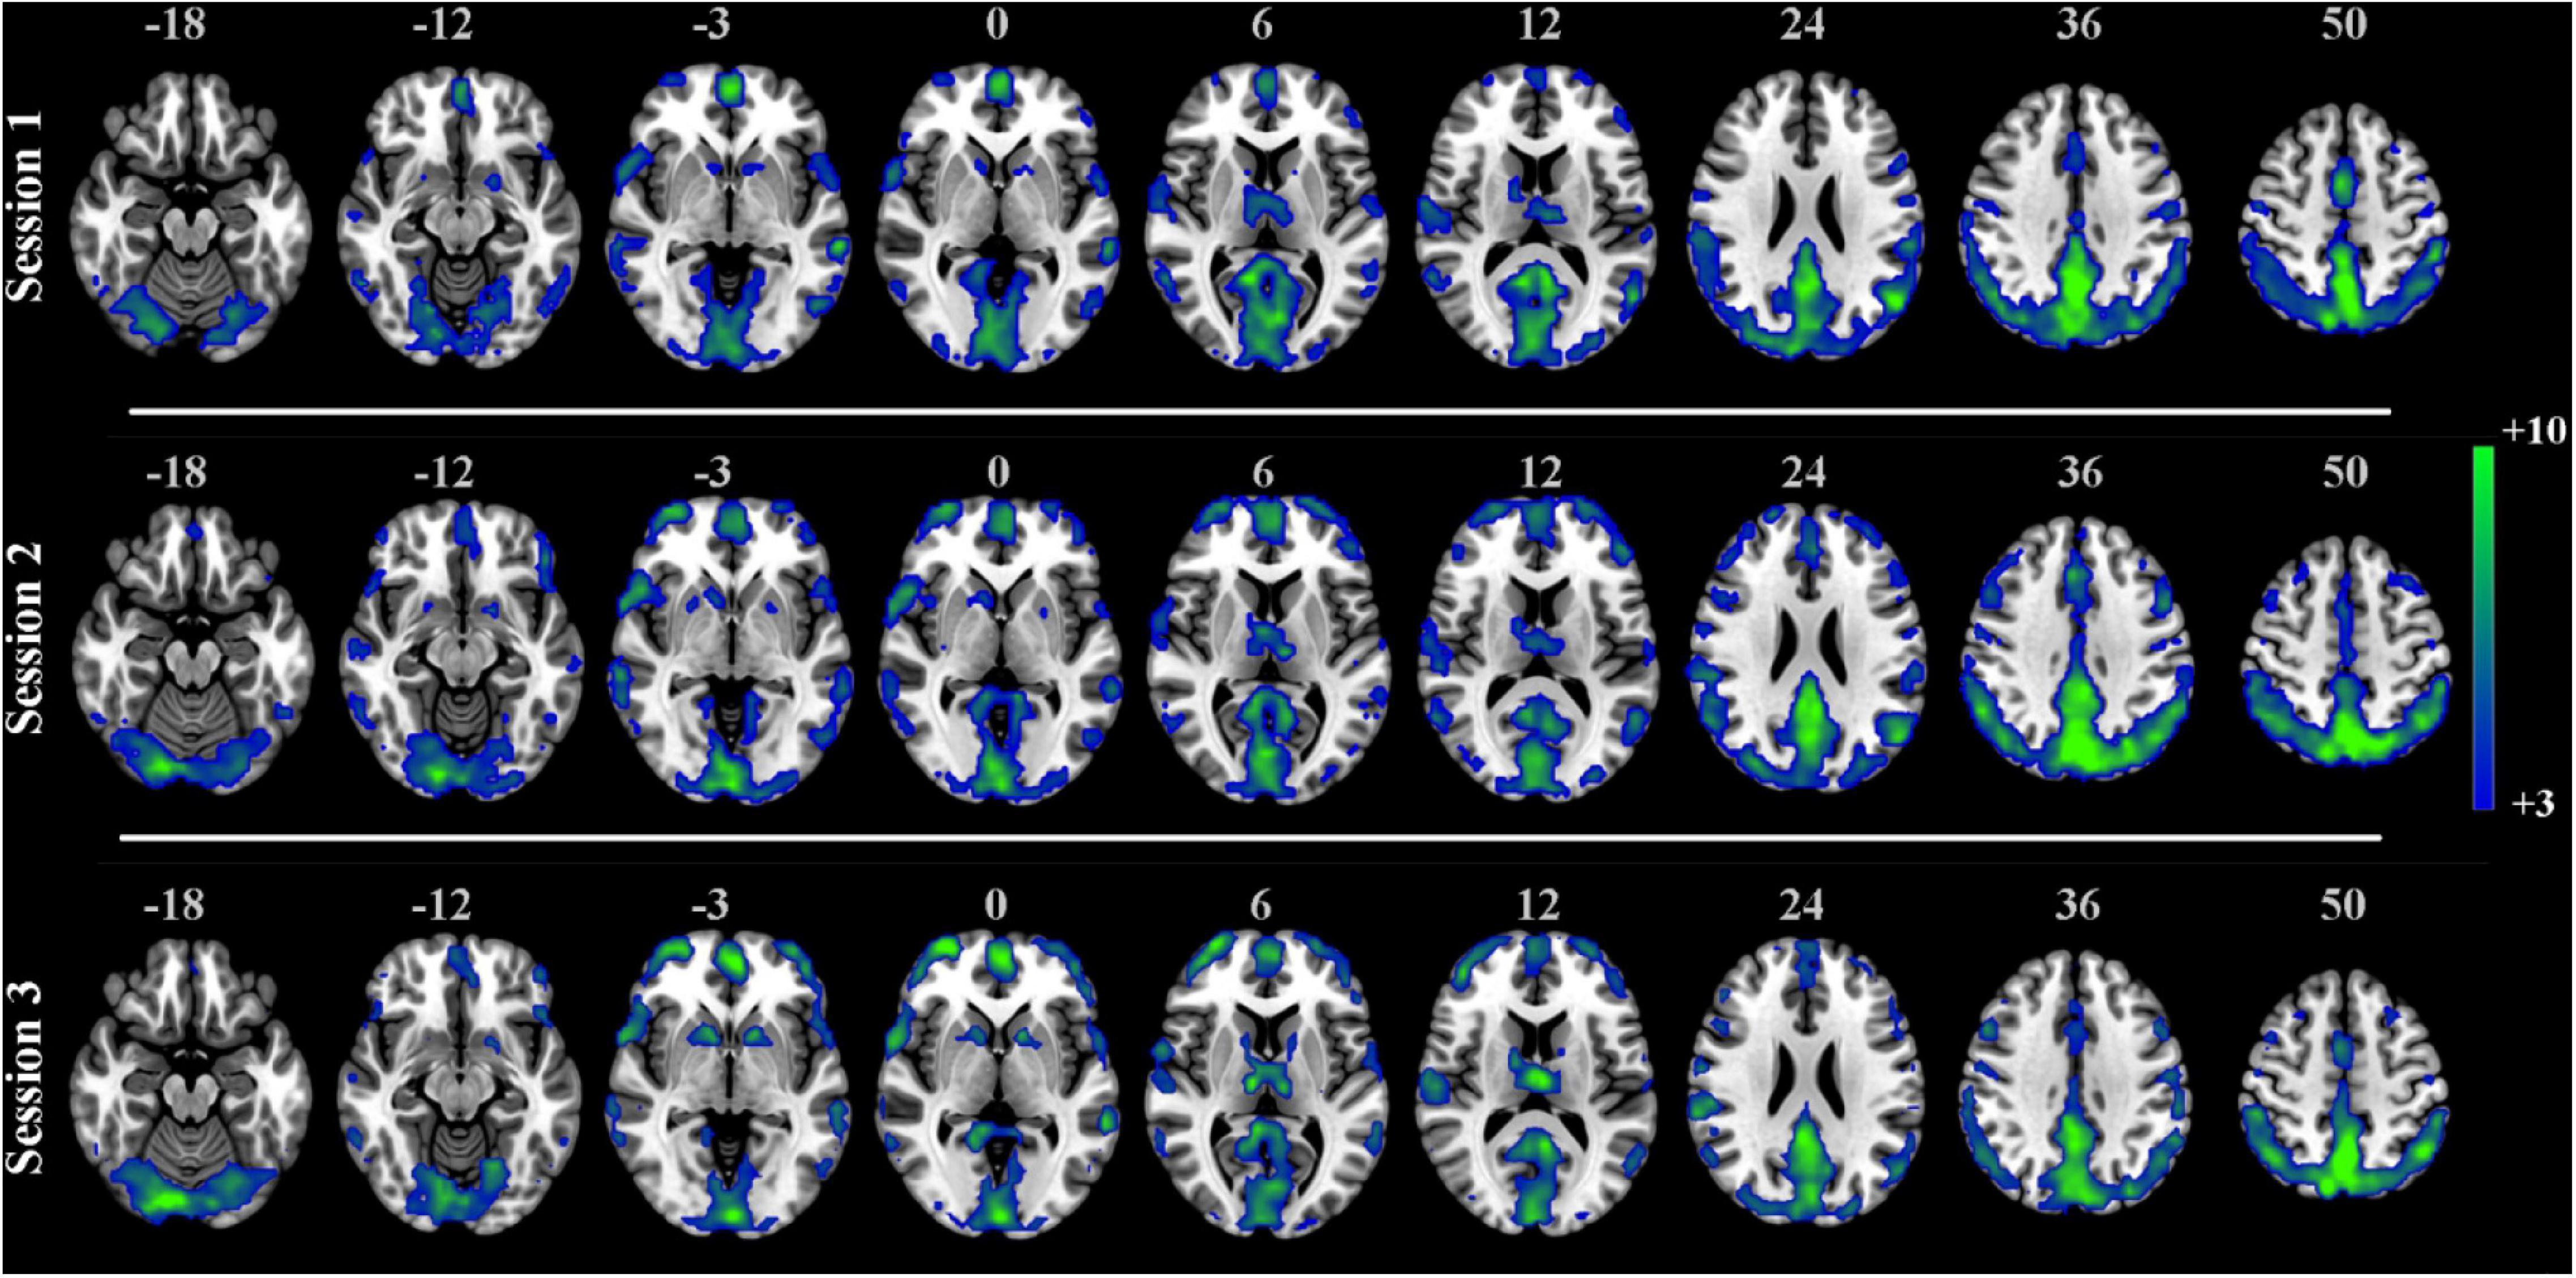
Figure 6. One-sample t-test SCM maps separately derived from three sessions in the test-retest resting-state dataset (n = 25, t > 3.0, p < 0.001, FDR corrected).
The proposed SCM method was firstly applied to PD dataset to decode the aberrant neuronal energy contrast of brain activity among three groups of participants, generating the individual SCM maps in each group, i.e., PD-SH, PD-N/MH, and HCs. Further, these corresponding SCM maps were analyzed with analysis of variance (ANOVA) model with a post hoc Tukey-Kramer correction, and the results were shown in Figure 7.
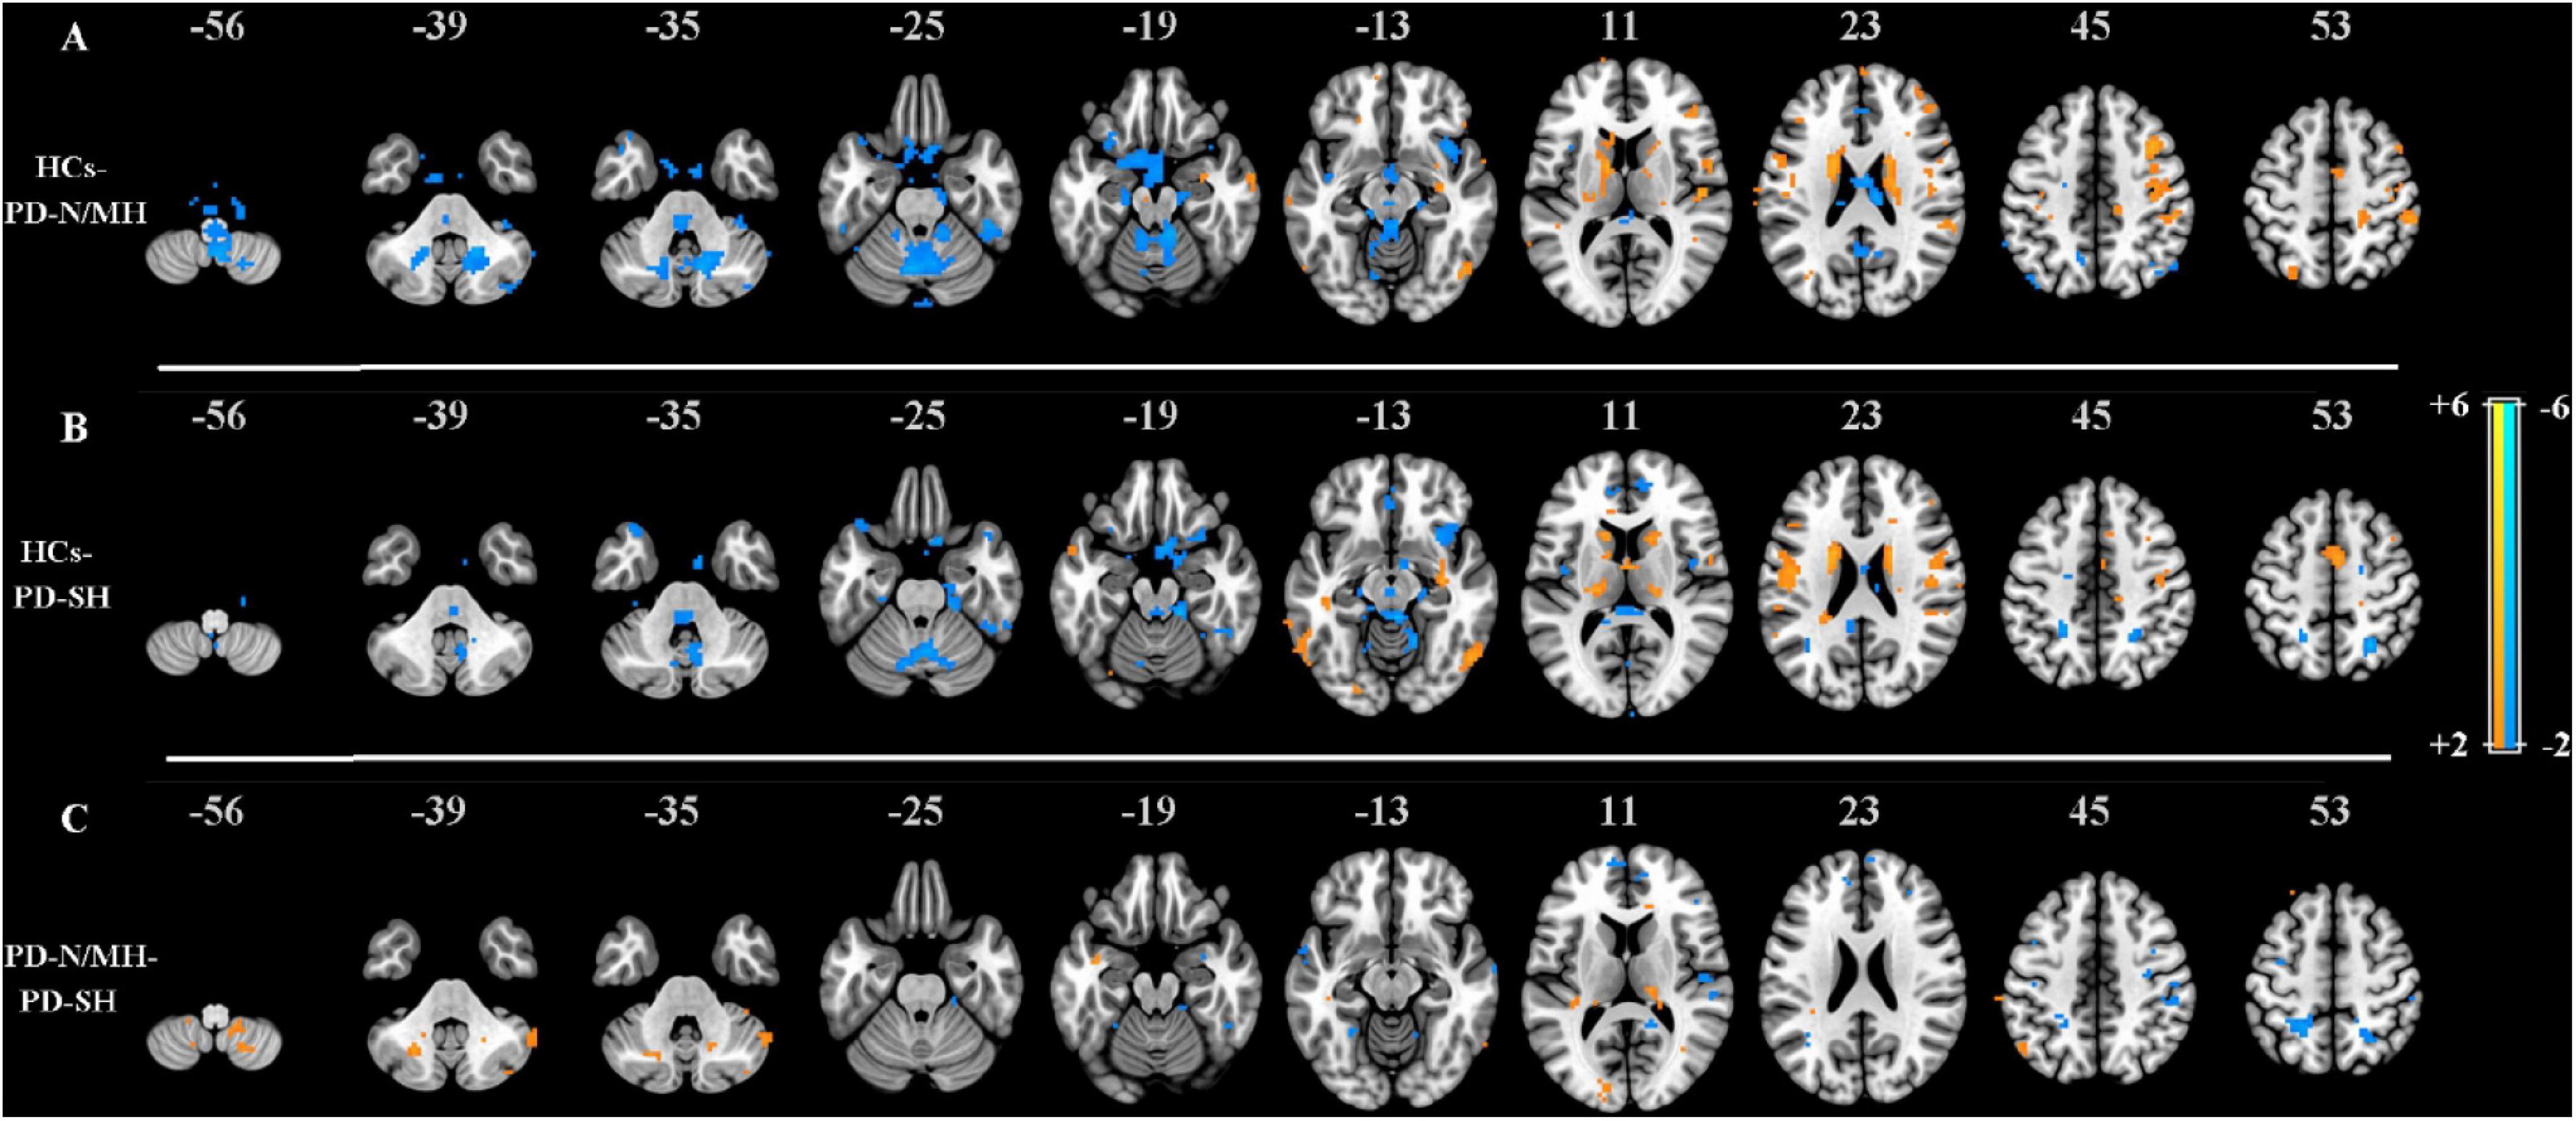
Figure 7. (A) Z–statistical difference maps between the HCs (warm color) and PD-N/MH (cool color) (n = 15, z > 2.0, p < 0.05, Tukey-Kramer correction). (B) Z–statistical difference maps between the HCs (warm color) and PD-SH (cool color) (n = 15, z > 2.0, p < 0.05, Tukey-Kramer correction). (C) Z–statistical difference maps between the PD-N/MH (warm color) and PD-SH (cool color) (n = 15, z > 2.0, p < 0.05, Tukey-Kramer correction).
By observing Figures 7A,B, compared to PD-N/MH and PD-SH, the values of SCM in many regions were significantly enhanced in HCs, including the supplementary motor area, frontal cortex, postcentral gyrus, caudate nucleus, rolandic operculum, precentral gyrus, etc. Compared to HCs, PD-N/MH and PD-SH showed extensive differences in regions such as vermis, cerebellum, insula, etc. Notably, PD-SH highlighted regions of the frontal and parietal gyrus compared to HCs (showed in Figure 7B), while PD-N/MH highlighted the regions of the precuneus and superior temporal gyrus compared to HCs (showed in Figure 7A). Further, to investigate the effects of severe hyposmia in Parkinson’s disease, a comparison was made between PD-N/MH and PD-SH, where the results were displayed in Figure 7C. The results showed that compared to PD-N/MH, PD-SH differed in the frontal, parietal and temporal gyrus; in contrast, PD-N/MH showed significant differences in the part regions of the cerebellum and thalamus, etc. These results were well consistent with previous studies (Yoneyama et al., 2018; Han et al., 2019), which demonstrated that the proposed SCM could capture the aberrant neuronal energy contrast between the patients of PD-N/MH and PD-SH compared to HCs.
The results of the visual task experiment in Figure 2 demonstrated that the proposed SCM could be effective to decode block task-evoked brain activity under the assumption that the energy contrast between low- and high-frequency bands for each voxel is reliable. However, in our task-related experiment, the stimulus task was modulated by the block design. In the future, we will fully explore SCM performance under event-related, block design, and natural stimulus conditions.
With regard to the resting-state experiment under the EC and EO conditions, the results of the two-sample paired t-tests in Figure 5 revealed differences in activated regions for the two different states in terms of the energy contrast between the low- and high-frequency bands. Generally speaking, under the EO condition, the low-high frequency energy contrast of the brain activity in several areas (i.e., the occipital, cuneus, calcarine, lingual, part of fusiform, and cerebellum) was significantly enhanced compared to the EC condition. These findings further verified that the low-high frequency energy contrast used in SCM is an effective biomarker for characterizing resting brain activity.
Reproducibility in neuroimaging has gained more and more attention (Zeng et al., 2009; Wang et al., 2016b; Chen et al., 2018; Zuo et al., 2019; Cohen et al., 2021). In this paper, a public test-retest resting-state dataset was used to test the repeatability of the proposed SCM method. As shown in Figure 5, the mean individual reproducibility of the SCM maps from three sessions across 25 subjects was within [0.9528, 0.9713], which showed a high degree of reliability. Figure 6 showed that the group-level SCM maps from three separate sessions were highly correlated with the smallest correlation coefficient equal to 0.90, further demonstrating good reproducibility of the proposed SCM at the group level.
Application of SCM in Parkinson’s disease demonstrated that PD-SH and PD-N/MH compared to HCs extensively differed in several areas (i.e., the vermis, cerebellum, insula, etc.). As shown in Figure 7, the spontaneous neuronal energy contrast captured by SCM can be sensitive, and these aberrant regions can be utilized as an effective biomarker to distinguish diseased individuals from the healthy, which may be related to the pathology of brain diseases. In the future, we will apply the SCM to explore the energy contrast biomarker of more mental illnesses and neurological diseases.
In recent years, head movements were found that can introduce artifactual differences in spectral power (Kim et al., 2014) and test-retest reproducibility (Yan et al., 2013). Thus, to demonstrate clearly all effects of head motion and global signal regression (GSR) on the proposed SCM, we explored the effects on SCM from the aforementioned two preprocessing operations. The head motion parameters and global signal were regressed out using multiple linear regression analysis in EC-EO and test-retest resting-state datasets, respectively. Specifically, Supplementary Figures 1–4 showed the differences in the head motion regression (without GSR and with GSR) by one-sample test and paired t-test. It revealed that head motion regression significantly impacted regions involving part of the frontal, temporal, lingual, and occipital cortex, cerebellum and fusiform, etc. (Kim et al., 2014), especially under the condition of the GSR. However, test-retest reproducibility analysis in Supplementary Figure 5 showed no significant effect of head movement regression (without GSR and with GSR) on reproducibility in SCM (Yan et al., 2013).
According to Section 2 Theory and Methods, the proposed SCM method assumes that the energy contrast between the low- and high-frequency bands for each voxel is reliable and credible. Thus, SCM performance mainly depends on the band selection of the reference frequency. In this study, the high-frequency band (0.1–0.25 Hz) was empirically selected as the reference due to the low-frequency oscillation of brain activity measured by fMRI, which was also used in previous studies (Luo et al., 2020; Yang et al., 2020). Theoretically, the proposed SCM highlights the signals with a more concentrated low-frequency property and higher energy contrast value, which can form different functional regions, representing biometric features of brain activity from BOLD signal.
Additionally, stable energy distribution in sub-bands of the frequency domain has been reported by Yuen et al. (2019), which implies that the SCM may be used to locate these areas by setting different target and reference frequency bands. Specifically, Supplementary Figure 6 showed results of the energy contrast between two intrinsic mode functions frequency bands (Yuen et al., 2019) (target bands: 0.01–0.05 Hz, 0.05–0.1 Hz) and the high-frequency bands (reference benchmark bands: 0.1–0.25 Hz). It provided clear evidence that reliable energy contrast existed between the intrinsic mode functions frequency bands in the form of ratios instead of the amplitude values. Moreover, the proposed SCM can be treated as a new feature extraction method based on quantifying the reliable energy contrast of the voxel’s time course, which can be applied to feature extraction, pattern classification (Savio et al., 2011; Sridhar et al., 2017), etc.
With regard to low-frequency fluctuations, Zang et al. (2007) proposed the amplitude of low-frequency fluctuation (ALFF) as a characterization of the spontaneous brain activity at the frequency domain. Zou et al. (2008) reported fractional ALFF (fALFF) for rs-fMRI signal analysis, which can be regarded as a standardized ALFF-like metric at each voxel. Recently, Jia et al. (2020) proposed the percent amplitude of fluctuation (PerAF) for rs-fMRI, focusing on the percent change compared to the mean value for each voxel time series.
Theoretically, the proposed SCM is fundamentally different from the three methods mentioned above, but in terms of metric representation, the proposed SCM is related to fALFF. Indeed, fALFF is an inspiring study with wide application in analyzing rs-fMRI signals, but the SCM method proposed in this paper is theoretically different to fALFF. For example, fALFF concerns the percentage of low-frequency bands over the entire frequency domain. By contrast, SCM mainly considers the reliable energy contrast between the target bands and the reference ones.
To compare the test-retest reliability of SCM and fALFF, the intraclass correlation coefficient (ICC) was calculated between each pair of the three sessions in the test-retest resting-state dataset. As shown in Supplementary Figures 7, 8, we could observe that the reliability of gray matter was significantly higher than the one of white matter; also, the short-term reliability was higher compared to the long-term one in the metrics of fALFF and SCM. Further, the reliability of SCM was significantly higher than the one of fALFF in both the short- and long-term test-retest, especially in the cingulate, occipital cortex, and frontal gyrus.
By comparing the results of the one-sample test between SCM and fALFF, as, respectively, shown in Figure 3 and Supplementary Figure 9, it was demonstrated that the proposed SCM effectively decoded the difference of brain activity in visual areas under the EC-EO rest conditions, consistent with fALFF. Additionally, the main difference was marked by the yellow box in Supplementary Figure 9, including temporal and precentral gyrus. Further, we performed the paired t-test to detect the differences in voxels between the fALFF and SCM maps under the EC-EO conditions (showed in Supplementary Figure 10). Under the EC condition, compared to fALFF, SCM significantly enhanced regions, including precuneus cortex, frontal and fusiform gyrus, and rectus, while fALFF highlighted regions of temporal, postcentral, occipital, precentral, frontal gyrus compared to SCM. Under the EO condition, SCM showed extensive differences in areas, such as frontal, temporal, fusiform gyrus, and precuneus cortex, while fALFF highlighted areas, such as temporal, frontal, postcentral, precentral, cingulum, parietal gyrus, caudate nucleus, and putamen. Additionally, numerous regions were located by fALFF in the white matter under both the EC and EO conditions.
The paired t-test plots of SCM comparing with both ALFF and perAF for EC and EO conditions were shown in Supplementary Figure 11, respectively. The results showed that the SCM mainly highlighted temporal, occipital, frontal, parietal, gyrus, cuneus, cerebellum, and the precuneus cortex, compared to the perAF under the EC condition. Compared to the SCM under the EC condition, the perAF mainly enhanced part of regions in the frontal, lingual gyrus, cerebellum, and many ventricles. Comparing ALFF with SCM, ALFF particularly highlighted the ventricles and the lingual gyrus, while SCM mostly enhanced the temporal, occipital, frontal, parietal, gyrus, cuneus white matter areas in the EC condition. The difference between SCM and perAF and ALFF in the EO condition was similar to the EC condition, clearly seen in Supplementary Figure 11.
Regarding the interaction of signals of different frequency bands, there existed many shreds of evidence in electroencephalogram (EEG) (Lindsley, 1952) studies, and this phenomenon was called cross-frequency coupling (CFC), including three categories: phase-phase coupling, phase-amplitude coupling, amplitude-amplitude coupling. CFC phenomenon can be observed in brain regions, such as the hippocampus, prefrontal, and sensory cortex, and CFC was considered as a potential mechanism for higher cognitive functions such as spatial and temporal memory encoding and integration of perceptual information (Händel and Haarmeier, 2009; Canolty and Knight, 2010; De Hemptinne et al., 2013; Chaieb et al., 2015; Hyafil et al., 2015). Furthermore, Rosso et al. (2001) proposed the relative wavelet energy (RWE) to represent information about the corresponding degree of importance of the different frequency bands present in the EEG. Then, Rosso et al. (2006) showed that the epileptic recruitment rhythm observed during seizure development is well described in terms of the RWE. Furthermore, Rosso (2007) applied RWE to epileptic EEG and found significantly decreasing activity in RWE associated with the frequency band 0.8–3.2 Hz (δ activity) at seizure onset, indicating a predominance of the mid-frequency band 3.2–12.8 Hz (theta and alpha bands) at seizure onset. Besides, in terms of fMRI signal, Wang et al., 2015 used the relative wavelet packet energy (RWPE) criterion to select the threshed wavelet tree nodes and to form the sparse approximation coefficients set of original fMRI signal, which helped to improve the brain functional networks identification. In addition, the fALFF also can be treated as a special energy contrast method for decoding brain activity from fMRI signals. In terms of the proposed SCM, it can be viewed as a general energy contrast based method to explore the changes in energy contrasts between different frequency bands under the assumption that the energy contrast between the frequency bands of voxels is stable during spontaneous brain activity. In the future, the other modalities of vivo brain imaging technologies such as EEG, functional near-infrared spectroscopy (fNIRS) (Naseer and Hong, 2015), magnetoencephalography (MEG) (Hansen et al., 2010), etc., will be used to help reveal the more concrete physiological explanation of energy contrasts in SCM by the concurrent EEG-fMRI, fNIRS-fMRI, or integrated MEG-fMRI.
We proposed a novel but simple voxel-wise brain activity decoding model (SCM), which assumed reliable energy contrast between low- and high-frequency bands for each voxel. The results of the visual task, rest with eyes open and closed, test-retest resting-state, and Parkinson’s disease experiments confirmed that SCM was good at characterizing the energy contrast and showed excellent reliability in decoding brain activity. Indeed, the energy contrast between low- and high-frequency bands was an effective biomarker in characterizing the brain states at both individual and group levels, and can be utilized to reveal the aberrant regions which might relate to the pathology of brain diseases. The proposed SCM method has potential application for neuroscience, neuroimaging and brain diseases.
The original contributions presented in the study are included in the article/Supplementary Material, further inquiries can be directed to the corresponding author/s.
The studies involving human participants were reviewed and approved by the IRBs of Beijing Normal University, New York University (NYU) and Nagoya University. The patients/participants provided their written informed consent to participate in this study.
QY: conceptualization, methodology, validation, formal analysis, and writing—original draft. ZC: conceptualization, validation, funding acquisition, and writing—review and editing, CL, YX, and YY: software, investigation, and writing—review and editing. SH, HT, BZ, and SD: data curation, investigation, and writing—review and editing. HY: conceptualization, methodology, validation, formal analysis, writing—review and editing, and funding acquisition. CC and NW: conceptualization, resources, writing—review and editing, supervision, funding acquisition, and project administration. All authors contributed to the article and approved the submitted version.
This work was supported by the National Natural Science Foundation of China (Nos. 61701318, 61971289, and 82001160), Project of “Six Talent Peaks” of Jiangsu Province (No. SWYY-017), the Suzhou Science and Technology Plan Project (No. SS2019048), the Suzhou City Medical Device and New Medicine (Clinical Trial) Clinical Trial Institutional Capacity Improvement Project (No. SLT202001), the Special Diagnosis and Treatment Technology for Key Clinical Diseases in Suzhou (No. LCZX202029), the Shenzhen Fundamental Research Project (No. JCYJ20170412111316339), the Shenzhen Talent Peacock Plan (No. 827–000083), the Project of Huaguoshan Mountain Talent Plan—Doctors for Innovation and Entrepreneurship, and the Jiangsu Province Graduate Research and Practice Innovation Program Project.
The authors declare that the research was conducted in the absence of any commercial or financial relationships that could be construed as a potential conflict of interest.
All claims expressed in this article are solely those of the authors and do not necessarily represent those of their affiliated organizations, or those of the publisher, the editors and the reviewers. Any product that may be evaluated in this article, or claim that may be made by its manufacturer, is not guaranteed or endorsed by the publisher.
We would like to thank the editor and all reviewers for their time and constructive comments.
The Supplementary Material for this article can be found online at: https://www.frontiersin.org/articles/10.3389/fnhum.2021.739668/full#supplementary-material
Biswal, B. B., Van Kylen, J., and Hyde, J. S. (1997). Simultaneous assessment of flow and BOLD signals in resting-state functional connectivity maps. NMR Biomed. 10, 165–170. doi: 10.1002/(SICI)1099-1492(199706/08)10:4/5<165::AID-NBM454<3.0.CO;2-7
Biswal, B., Zerrin Yetkin, F., Haughton, V. M., and Hyde, J. S. (1995). Functional connectivity in the motor cortex of resting human brain using echo-planar mri. Magn. Reson. Med. 34, 537–541. doi: 10.1002/mrm.1910340409
Boubela, R. N., Kalcher, K., Huf, W., Kronnerwetter, C., Filzmoser, P., and Moser, E. (2013). Beyond noise: using temporal ICA to extract meaningful information from high-frequency fMRI signal fluctuations during rest. Front. Hum. Neurosci. 7:168. doi: 10.3389/fnhum.2013.00168
Buckner, R. L., Andrews-Hanna, J. R., and Schacter, D. L. (2008). The brain’s default network: anatomy, function, and relevance to disease. Ann. N. Y. Acad. Sci. 1124, 1–38. doi: 10.1196/annals.1440.011
Canolty, R. T., and Knight, R. T. (2010). The functional role of cross-frequency coupling. Trends Cogn. Sci. 14, 506–515. doi: 10.1006/j.tics.2010.09.001
Chaieb, L., Leszczynski, M., Axmacher, N., Höhne, M., Elger, C. E., and Fell, J. (2015). Theta-gamma phase-phase coupling during working memory maintenance in the human hippocampus. Cogn. Neurosci. 6, 149–157. doi: 10.1080/17588928.2015.1058254
Chen, X., Lu, B., and Yan, C. G. (2018). Reproducibility of R-fMRI metrics on the impact of different strategies for multiple comparison correction and sample sizes. Hum. Brain Mapp. 39, 300–318. doi: 10.1002/hbm.23843
Cohen, A. D., Yang, B., Fernandez, B., Banerjee, S., and Wang, Y. (2021). Improved resting state functional connectivity sensitivity and reproducibility using a multiband multi-echo acquisition. Neuroimage 225:117461. doi: 10.1016/j.neuroimage.2020.117461
Cordes, D., Haughton, V. M., Arfanakis, K., Carew, J. D., Turski, P. A., Moritz, C. H., et al. (2001). Frequencies contributing to functional connectivity in the cerebral cortex in “resting-state” data. Am. J. Neuroradiol. 22, 1326–1333. doi: 10.0000/PMID11498421
Cui, Q., Sheng, W., Chen, Y., Pang, Y., Lu, F., Tang, Q., et al. (2020). Dynamic changes of amplitude of low-frequency fluctuations in patients with generalized anxiety disorder. Hum. Brain Mapp. 41, 1667–1676. doi: 10.1002/hbm.24902
Damoiseaux, J. S., Rombouts, S. A. R. B., Barkhof, F., Scheltens, P., Stam, C. J., Smith, S. M., et al. (2006). Consistent resting-state networks across healthy subjects. Proc. Natl. Acad. Sci. U. S. A. 103, 13848–13853. doi: 10.1073/pnas.0601417103
De Hemptinne, C., Ryapolova-Webb, E. S., Air, E. L., Garcia, P. A., Miller, K. J., Ojemann, J. G., et al. (2013). Exaggerated phase–amplitude coupling in the primary motor cortex in Parkinson disease. Proc. Natl. Acad. Sci. U. S. A. 110, 4780–4785. doi: 10.1073/pnas.1214546110
De Luca, M., Beckmann, C. F., De Stefano, N., Matthews, P. M., and Smith, S. M. (2006). fMRI resting state networks define distinct modes of long-distance interactions in the human brain. Neuroimage 29, 1359–1367. doi: 10.1016/j.neuroimage.2005.08.035
Devrim, M., Demiralp, T., Kurt, A., and Yücesir, I. (1999). Slow cortical potential shifts modulate the sensory threshold in human visual system. Neurosci. Lett. 270, 17–20. doi: 10.1016/S0304-3940(99)00456-5
Di, X., Zhu, S., Jin, H., Wang, P., Ye, Z., Zhou, K., et al. (2012). Altered Resting Brain Function and Structure in Professional Badminton Players. Brain Connect. 2, 225–233. doi: 10.1089/brain.2011.0050
Dutta, A., McKie, S., and Deakin, J. F. W. (2014). Resting state networks in major depressive disorder. Psychiatry Res. Neuroimaging 224, 139–151. doi: 10.1016/j.pscychresns.2014.10.003
Filippov, I. V., and Frolov, V. A. (2004). Very slow potentials in the lateral geniculate complex and primary visual cortex during different illumination changes in freely moving rats. Neurosci. Lett. 373, 51–56. doi: 10.1016/j.neulet.2004.09.056
Filippov, I. V., Williams, W. C., Krebs, A. A., and Pugachev, K. S. (2007). Sound-induced changes of infraslow brain potential fluctuations in the medial geniculate nucleus and primary auditory cortex in anaesthetized rats. Brain Res. 1133, 78–86. doi: 10.1016/j.brainres.2006.11.038
Filippov, I. V., Williams, W. C., Krebs, A. A., and Pugachev, K. S. (2008). Dynamics of infraslow potentials in the primary auditory cortex: component analysis and contribution of specific thalamic-cortical and non-specific brainstem-cortical influences. Brain Res. 1219, 66–77. doi: 10.1016/j.brainres.2008.04.011
Fransson, P. (2005). Spontaneous low-frequency BOLD signal fluctuations: an fMRI investigation of the resting-state default mode of brain function hypothesis. Hum. Brain Mapp. 26, 15–29. doi: 10.1002/hbm.20113
Genovese, C. R., Lazar, N. A., and Nichols, T. (2002). Thresholding of statistical maps in functional neuroimaging using the false discovery rate. Neuroimage 15, 870–878. doi: 10.1006/nimg.2001.1037
Gohel, S., Gallego, J. A., Robinson, D. G., DeRosse, P., Biswal, B., and Szeszko, P. R. (2018). Frequency specific resting state functional abnormalities in psychosis. Hum. Brain Mapp. 39, 4509–4518. doi: 10.1002/hbm.24302
Goldman, R. I., Stern, J. M., Engel, J., and Cohen, M. S. (2002). Simultaneous EEG and fMRI of the alpha rhythm. Neuroreport 13:2487. doi: 10.1097/00001756-200212200-00022
Greicius, M. D., Krasnow, B., Reiss, A. L., and Menon, V. (2003). Functional connectivity in the resting brain: a network analysis of the default mode hypothesis. Proc. Natl. Acad. Sci. U. S. A. 100, 253–258. doi: 10.1073/pnas.0135058100
Han, P., Zang, Y., Akshita, J., and Hummel, T. (2019). Magnetic Resonance Imaging of Human Olfactory Dysfunction. Brain Topogr. 326, 987–997. doi: 10.1007/S10548-019-00729-5
Han, Y., Wang, J., Zhao, Z., Min, B., Lu, J., Li, K., et al. (2011). Frequency-dependent changes in the amplitude of low-frequency fluctuations in amnestic mild cognitive impairment: a resting-state fMRI study. Neuroimage 55, 287–295. doi: 10.1016/j.neuroimage.2010.11.059
Händel, B., and Haarmeier, T. (2009). Cross-frequency coupling of brain oscillations indicates the success in visual motion discrimination. Neuroimage 45, 1040–1046. doi: 10.1016/j.neuroimage.2008.12.013
Hansen, P., Kringelbach, M., and Salmelin, R. (eds) (2010). MEG: An Introduction to Methods. Oxford: Oxford University Press.
Hyafil, A., Giraud, A. L., Fontolan, L., and Gutkin, B. (2015). Neural cross-frequency coupling: connecting architectures, mechanisms, and functions. Trends Neurosci. 38, 725–740. doi: 10.1016/j.tins.2015.09.001
Jia, X. Z., Sun, J. W., Ji, G. J., Liao, W., Lv, Y. T., Wang, J., et al. (2020). Percent amplitude of fluctuation: a simple measure for resting-state fMRI signal at single voxel level. PLoS One 15:e0227021. doi: 10.1371/journal.pone.0227021
Jiang, Y., Song, L., Li, X., Zhang, Y., Chen, Y., Jiang, S., et al. (2019). Dysfunctional white-matter networks in medicated and unmedicated benign epilepsy with centrotemporal spikes. Hum. Brain Mapp. 40, 3113–3124. doi: 10.1002/hbm.24584
Kim, J., Van Dijk, K. R. A., Libby, A., and Napadow, V. (2014). Frequency-dependent relationship between resting-state functional magnetic resonance imaging signal power and head motion is localized within distributed association networks. Brain Connect. 4, 30–39. doi: 10.1089/brain.2013.0153
Kiviniemi, V., Kantola, J. H., Jauhiainen, J., and Tervonen, O. (2004). Comparison of methods for detecting nondeterministic BOLD fluctuation in fMRI. Magn. Reson. Imaging 22, 197–203. doi: 10.1016/j.mri.2003.09.007
Lewis, C. M., Baldassarre, A., Committeri, G., Romani, G. L., and Corbetta, M. (2009). Learning sculpts the spontaneous activity of the resting human brain. Proc. Natl. Acad. Sci. U. S. A. 106, 17558–17563. doi: 10.1073/pnas.0902455106
Lindsley, D. B. (1952). Psychological phenomena and the electroencephalogram. Electroencephalogr. Clin. Neurophysiol. 4, 443–456.
Liu, D., Dong, Z., Zuo, X., Wang, J., and Zang, Y. (2013). Eyes-open/eyes-closed dataset sharing for reproducibility evaluation of resting state fMRI data analysis methods. Neuroinformatics 11, 469–476. doi: 10.1007/s12021-013-9187-0
Logothetis, N. K., Pauls, J., Augath, M., Trinath, T., and Oeltermann, A. (2001). Neurophysiological investigation of the basis of the fMRI signal. Nature 412, 150–157. doi: 10.1038/35084005
Lowe, M. J., Mock, B. J., and Sorenson, J. A. (1998). Functional connectivity in single and multislice echoplanar imaging using resting-state fluctuations. Neuroimage 7, 119–132. doi: 10.1006/nimg.1997.0315
Luo, F. F., Wang, J. B., Yuan, L. X., Zhou, Z. W., Xu, H., Ma, S. H., et al. (2020). Higher Sensitivity and Reproducibility of Wavelet-Based Amplitude of Resting-State fMRI. Front. Neurosci. 14:224. doi: 10.3389/fnins.2020.00224
Naseer, N., and Hong, K. S. (2015). fNIRS-based brain-computer interfaces: a review. Front. Hum. Neurosci. 9:3. doi: 10.3389/fnhum.2015.00003
Raichle, M. E., MacLeod, A. M., Snyder, A. Z., Powers, W. J., Gusnard, D. A., and Shulman, G. L. (2001). A default mode of brain function. Proc. Natl. Acad. Sci. U. S. A. 98, 676–682. doi: 10.1073/pnas.98.2.676
Ren, T., Zeng, W., Wang, N., Chen, L., and Wang, C. (2014). A novel approach for fMRI data analysis based on the combination of sparse approximation and affinity propagation clustering. Magn. Reson. Imaging 32, 736–746. doi: 10.1016/j.mri.2014.02.023
Robinson, S., Basso, G., Soldati, N., Sailer, U., Jovicich, J., Bruzzone, L., et al. (2009). A resting state network in the motor control circuit of the basal ganglia. BMC Neurosci. 10:137. doi: 10.1186/1471-2202-10-137
Rosso, O. A. (2007). Entropy changes in brain function. J. Psychophysiol. 64, 75–80. doi: 10.1016/j.ijpsycho.2006.07.010
Rosso, O. A., Blanco, S., Yordanova, J., Kolev, V., Figliola, A., Schürmann, M., et al. (2001). Wavelet entropy: a new tool for analysis of short duration brain electrical signals. J. Neurosci. Methods 105, 65–75. doi: 10.1016/S0165-0270(00)00356-31
Rosso, O. A., Martin, M. T., Figliola, A., Keller, K., and Plastino, A. (2006). EEG analysis using wavelet-based information tools. J. Neurosci. Methods 153, 163–182. doi: 10.1016/j.jneumeth.2005.10.009
Salvador, R., Martínez, A., Pomarol-Clotet, E., Gomar, J., Vila, F., Sarró, S., et al. (2008). A simple view of the brain through a frequency-specific functional connectivity measure. Neuroimage 39, 279–289. doi: 10.1016/j.neuroimage.2007.08.018
Savio, A., García-Sebastián, M. T., Chyzyk, D., Hernandez, C., Graña, M., Sistiaga, A., et al. (2011). Neurocognitive disorder detection based on feature vectors extracted from VBM analysis of structural MRI. Comput. Biol. Med. 41, 600–610. doi: 10.1016/j.compbiomed.2011.05.010
Shehzad, Z., Kelly, A. M. C., Reiss, P. T., Gee, D. G., Gotimer, K., Uddin, L. Q., et al. (2009). The resting brain: unconstrained yet reliable. Cereb. Cortex 19, 2209–2229. doi: 10.1093/cercor/bhn256
Shi, Y., and Zeng, W. (2018). SCTICA: sub-packet constrained temporal ICA method for fMRI data analysis. Comput. Biol. Med. 102, 75–85. doi: 10.1016/j.compbiomed.2018.09.012
Shi, Y., Zeng, W., and Wang, N. (2017). SCGICAR: spatial concatenation based group ICA with reference for fMRI data analysis. Comput. Methods Programs Biomed. 148, 137–151. doi: 10.1016/j.cmpb.2017.07.001
Smith-Collins, A. P. R., Luyt, K., Heep, A., and Kauppinen, R. A. (2015). High frequency functional brain networks in neonates revealed by rapid acquisition resting state fMRI. Hum. Brain Mapp. 36, 2483–2494. doi: 10.1002/hbm.22786
Sridhar, C., Bhat, S., Acharya, U. R., Adeli, H., and Bairy, G. M. (2017). Diagnosis of attention deficit hyperactivity disorder using imaging and signal processing techniques. Comput. Biol. Med. 88, 93–99. doi: 10.1016/j.compbiomed.2017.07.009
Steriade, M., Nunez, A., and Amzica, F. (1993). A novel slow (< 1 Hz) oscillation of neocortical neurons in vivo: depolarizing and hyperpolarizing components. J. Neurosci. 13, 3252–3265. doi: 10.1523/jneurosci.13-08-03252.1993
Trapp, C., Vakamudi, K., and Posse, S. (2018). On the detection of high frequency correlations in resting state fMRI. Neuroimage 164, 202–213. doi: 10.1016/j.neuroimage.2017.01.059
Wang, N., Chang, C., Zeng, W., Shi, Y., and Yan, H. (2017). A novel feature-map based ICA model for identifying the individual, intra/inter-group brain networks across multiple fMRI datasets. Front. Neurosci. 11:510. doi: 10.3389/fnins.2017.00510
Wang, N., Zeng, W., and Chen, D. (2016a). A novel sparse dictionary learning separation (SDLS) model with adaptive dictionary mutual incoherence constraint for fMRI data analysis. IEEE Trans. Biomed. Eng. 63, 2376–2389. doi: 10.1109/TBME.2016.2533722
Wang, N., Zeng, W., and Chen, L. (2012). A Fast-FENICA method on resting state fMRI data. J. Neurosci. Methods 209, 1–12. doi: 10.1016/j.jneumeth.2012.05.007
Wang, N., Zeng, W., and Chen, L. (2013). SACICA: a sparse approximation coefficient-based ICA model for functional magnetic resonance imaging data analysis. J. Neurosci. Methods 216, 49–61. doi: 10.1016/j.jneumeth.2013.03.014
Wang, N., Zeng, W., Chen, D., Yin, J., and Chen, L. (2016b). A Novel Brain Networks Enhancement Model (BNEM) for BOLD fMRI Data Analysis with Highly Spatial Reproducibility. IEEE J. Biomed. Health Inform. 20, 1107–1119. doi: 10.1109/JBHI.2015.2439685
Wang, N., Zeng, W., Shi, Y., Ren, T., Jing, Y., Yin, J., et al. (2015). WASICA: an effective wavelet-shrinkage based ICA model for brain fMRI data analysis. J. Neurosci. Methods 246, 75–96. doi: 10.1016/j.jneumeth.2015.03.011
Welsh, R. C., Chen, A. C., and Taylor, S. F. (2010). Low-frequency BOLD fluctuations demonstrate altered thalamocortical connectivity in schizophrenia. Schizophr. Bull. 36, 713–722. doi: 10.1093/schbul/sbn145
Wu, H., Yan, H., Yang, Y., Xu, M., Shi, Y., Zeng, W., et al. (2020). Occupational Neuroplasticity in the Human Brain: a Critical Review and Meta-Analysis of Neuroimaging Studies. Front. Hum. Neurosci. 14:215. doi: 10.3389/fnhum.2020.00215
Yaesoubi, M., Miller, R. L., Bustillo, J., Lim, K. O., Vaidya, J., and Calhoun, V. D. (2017). A joint time-frequency analysis of resting-state functional connectivity reveals novel patterns of connectivity shared between or unique to schizophrenia patients and healthy controls. NeuroImage Clin. 15, 761–768. doi: 10.1016/j.nicl.2017.06.023
Yan, C. G., Cheung, B., Kelly, C., Colcombe, S., Craddock, R. C., Di Martino, A., et al. (2013). A comprehensive assessment of regional variation in the impact of head micromovements on functional connectomics. Neuroimage 76, 183–201. doi: 10.1016/j.neuroimage.2013.03.004
Yan, C. G., Wang, X. D., Zuo, X. N., and Zang, Y. F. (2016). DPABI: data Processing & Analysis for (Resting-State) Brain Imaging. Neuroinformatics 14, 339–351. doi: 10.1007/s12021-016-9299-4
Yang, J., Gohel, S., and Vachha, B. (2020). Current methods and new directions in resting state fMRI. Clin. Imaging 65, 47–53. doi: 10.1016/j.clinimag.2020.04.004
Yang, L., Yan, Y., Wang, Y., Hu, X., Lu, J., Chan, P., et al. (2018). Gradual Disturbances of the Amplitude of Low-Frequency Fluctuations (ALFF) and Fractional ALFF in Alzheimer Spectrum. Front. Neurosci. 12:975. doi: 10.3389/fnins.2018.00975
Yang, Y., Zhong, N., Imamura, K., Lu, S., Li, M., Zhou, H., et al. (2016). Task and resting-state fMRI reveal altered salience responses to positive stimuli in patients with major depressive disorder. PLoS One 11:e0155092. doi: 10.1371/journal.pone.0155092
Yao, S., Zeng, W., Wang, N., and Chen, L. (2013). Validating the performance of one-time decomposition for fMRI analysis using ICA with automatic target generation process. Magn. Reson. Imaging 31, 970–975. doi: 10.1016/j.mri.2013.03.014
Yoneyama, N., Watanabe, H., Kawabata, K., Bagarinao, E., Hara, K., Tsuboi, T., et al. (2018). Severe hyposmia and aberrant functional connectivity in cognitively normal Parkinson’s disease. PLoS One 13:e0190072. doi: 10.1371/JOURNAL.PONE.0190072
Yuen, N. H., Osachoff, N., and Chen, J. J. (2019). Intrinsic Frequencies of the Resting-State fMRI Signal: the Frequency Dependence of Functional Connectivity and the Effect of Mode Mixing. Front. Neurosci. 13:900. doi: 10.3389/fnins.2019.00900
Zang, Y. F., Yong, H., Chao-Zhe, Z., Qing-Jiu, C., Man-Qiu, S., Meng, L., et al. (2007). Altered baseline brain activity in children with ADHD revealed by resting-state functional MRI. Brain Dev. 29, 83–91. doi: 10.1016/j.braindev.2006.07.002
Zeng, W., Qiu, A., Chodkowski, B., and Pekar, J. J. (2009). Spatial and temporal reproducibility-based ranking of the independent components of BOLD fMRI data. Neuroimage 46, 1041–1054. doi: 10.1016/j.neuroimage.2009.02.048
Zou, Q. H., Zhu, C. Z., Yang, Y., Zuo, X. N., Long, X. Y., Cao, Q. J., et al. (2008). An improved approach to detection of amplitude of low-frequency fluctuation (ALFF) for resting-state fMRI: fractional ALFF. J. Neurosci. Methods 172, 137–141. doi: 10.1016/j.jneumeth.2008.04.012
Zuo, X. N., Biswal, B. B., and Poldrack, R. A. (2019). Editorial: reliability and reproducibility in functional connectomics. Front. Neurosci. 13:117. doi: 10.3389/fnins.2019.00117
Keywords: functional magnetic resonance imaging, spectrum contrast mapping, fast fourier transform, resting-state, task-state, test-retest, Parkinson’s disease
Citation: Yu Q, Cai Z, Li C, Xiong Y, Yang Y, He S, Tang H, Zhang B, Du S, Yan H, Chang C and Wang N (2021) A Novel Spectrum Contrast Mapping Method for Functional Magnetic Resonance Imaging Data Analysis. Front. Hum. Neurosci. 15:739668. doi: 10.3389/fnhum.2021.739668
Received: 11 July 2021; Accepted: 18 August 2021;
Published: 08 September 2021.
Edited by:
Jingyu Liu, Georgia State University, United StatesReviewed by:
Ruibin Zhang, Southern Medical University, ChinaCopyright © 2021 Yu, Cai, Li, Xiong, Yang, He, Tang, Zhang, Du, Yan, Chang and Wang. This is an open-access article distributed under the terms of the Creative Commons Attribution License (CC BY). The use, distribution or reproduction in other forums is permitted, provided the original author(s) and the copyright owner(s) are credited and that the original publication in this journal is cited, in accordance with accepted academic practice. No use, distribution or reproduction is permitted which does not comply with these terms.
*Correspondence: Hongjie Yan, eWFuaGpuc0BnbWFpbC5jb20=; Chunqi Chang, Y3FjaGFuZ0BzenUuZWR1LmNu; Nizhuan Wang, d2FuZ25pemh1YW4xMTIwQGdtYWlsLmNvbQ==
†These authors have contributed equally to this work
Disclaimer: All claims expressed in this article are solely those of the authors and do not necessarily represent those of their affiliated organizations, or those of the publisher, the editors and the reviewers. Any product that may be evaluated in this article or claim that may be made by its manufacturer is not guaranteed or endorsed by the publisher.
Research integrity at Frontiers
Learn more about the work of our research integrity team to safeguard the quality of each article we publish.