
94% of researchers rate our articles as excellent or good
Learn more about the work of our research integrity team to safeguard the quality of each article we publish.
Find out more
REVIEW article
Front. Hum. Neurosci., 07 October 2021
Sec. Brain Imaging and Stimulation
Volume 15 - 2021 | https://doi.org/10.3389/fnhum.2021.721206
This article is part of the Research TopicCurrent Advances in Multimodal Human Brain Imaging and Analysis Across the Lifespan: From Mapping to State PredictionView all 6 articles
 Parinaz Babaeeghazvini1,2
 Laura M. Rueda-Delgado3,4Jolien Gooijers3,5Stephan P. Swinnen3,5
 Andreas Daffertshofer1,2*
Implications of structural connections within and between brain regions for their functional counterpart are timely points of discussion. White matter microstructural organization and functional activity can be assessed in unison. At first glance, however, the corresponding findings appear variable, both in the healthy brain and in numerous neuro-pathologies. To identify consistent associations between structural and functional connectivity and possible impacts for the clinic, we reviewed the literature of combined recordings of electro-encephalography (EEG) and diffusion-based magnetic resonance imaging (MRI). It appears that the strength of event-related EEG activity increases with increased integrity of structural connectivity, while latency drops. This agrees with a simple mechanistic perspective: the nature of microstructural white matter influences the transfer of activity. The EEG, however, is often assessed for its spectral content. Spectral power shows associations with structural connectivity that can be negative or positive often dependent on the frequencies under study. Functional connectivity shows even more variations, which are difficult to rank. This might be caused by the diversity of paradigms being investigated, from sleep and resting state to cognitive and motor tasks, from healthy participants to patients. More challenging, though, is the potential dependency of findings on the kind of analysis applied. While this does not diminish the principal capacity of EEG and diffusion-based MRI co-registration, it highlights the urgency to standardize especially EEG analysis.
The human brain is characterized by structural and functional connectivity within and between regions. Structural connectivity refers to the anatomical organization of the brain by means of fiber tracts. Recent advances in magnetic resonance imaging (MRI) and image processing provide various means to quantify structural connectivity in a non-invasive way using short-range local measures and/or long-range tract tracing procedures, called diffusion tractography. Functional connectivity refers to statistical dependence between time series of electro-physiological activity and (de)oxygenated blood levels in distinct regions of the brain. The first can be assessed non-invasively using encephalographic recordings. Electro- and magnetoencephalography (EEG and MEG, respectively) reflect changes in averaged post-synaptic potential and dendritic currents of neural populations and, hence, provide direct insight into ‘neural functioning’. With the latter, typically based on functional MRI (fMRI) and blood-oxygen-level dependent (BOLD) contrasts, one assesses (correlated) changes in the metabolic demand, providing indirect insight into this neural functioning.
Structural connectivity is known to shape functional connectivity (Honey et al., 2010) but the extent to which it does may vary substantially. To pinpoint this further, one may directly relate structural and functional assessments by co-registering diffusion MRI (dMRI) and EEG or fMRI. Many studies followed this idea and combined dMRI with fMRI, in parts with great success (Mulkern et al., 2006; Johansen-Berg, 2012; Bennett and Rypma, 2013). As mentioned above, however, BOLD signals are indirect measures of neural functioning. They include complex convolutions of not only neural, but also vascular signals (Logothetis, 2008), which may jeopardize the interpretation of fMRI outcomes. This has been shown, e.g., in studies in older adults and patients with cerebrovascular disease, impaired cerebrovascular dynamics and impaired neurovascular coupling (Krainik et al., 2005; Logothetis, 2008; Tsvetanov et al., 2015). Using fMRI in combination with EEG can help circumventing this possible confounder. More important, though, EEG allows for a direct assessment of neural activity, first and foremost in cortical regions. What remains to be shown, however, is whether the combination of EEG and dMRI can really help to identify the relationship between structural and functional connectivity in a consistent manner. With the current review we seek to provide a first inventory on more recent studies employing both recording modalities in unison.
Electro-encephalography signals are recorded from the scalp using surface electrodes at positions typically based on the 10–20 system (Niedermeyer and Lopes da Silva, 1993); see Figure 1, below. They predominantly reflect activity of pyramidal neurons or, more generally, electrical dipoles between soma and apical dendrites generated by summed postsynaptic potentials of large neuronal populations (Niedermeyer and Lopes da Silva, 2004). EEG recordings can serve to monitor ongoing/spontaneous or evoked/induced neural activity. The first typically involves spectral analysis to discern the functional relevance of spectral characteristics in distinct frequency bands (e.g., theta ∼4–8 Hz, alpha ∼8–14 Hz, beta ∼15–30 Hz, or gamma ∼>30 Hz). The latter relies on the study of so-called event-related potentials (ERPs), i.e., signal responses that co-vary with in- or external stimuli. For both cases, various analysis methods are available to estimate neural activity in the brain (∼ source activity) from scalp signals. Be it on electrode or source level, be it ongoing or evoked activity, ERP activity and the spectral power are considered markers for local synchronization in comparably small neural populations, while distant synchronization is defined as statistical interdependence (synchronization or, more general, correlation) between regions-of-interest (ROI).
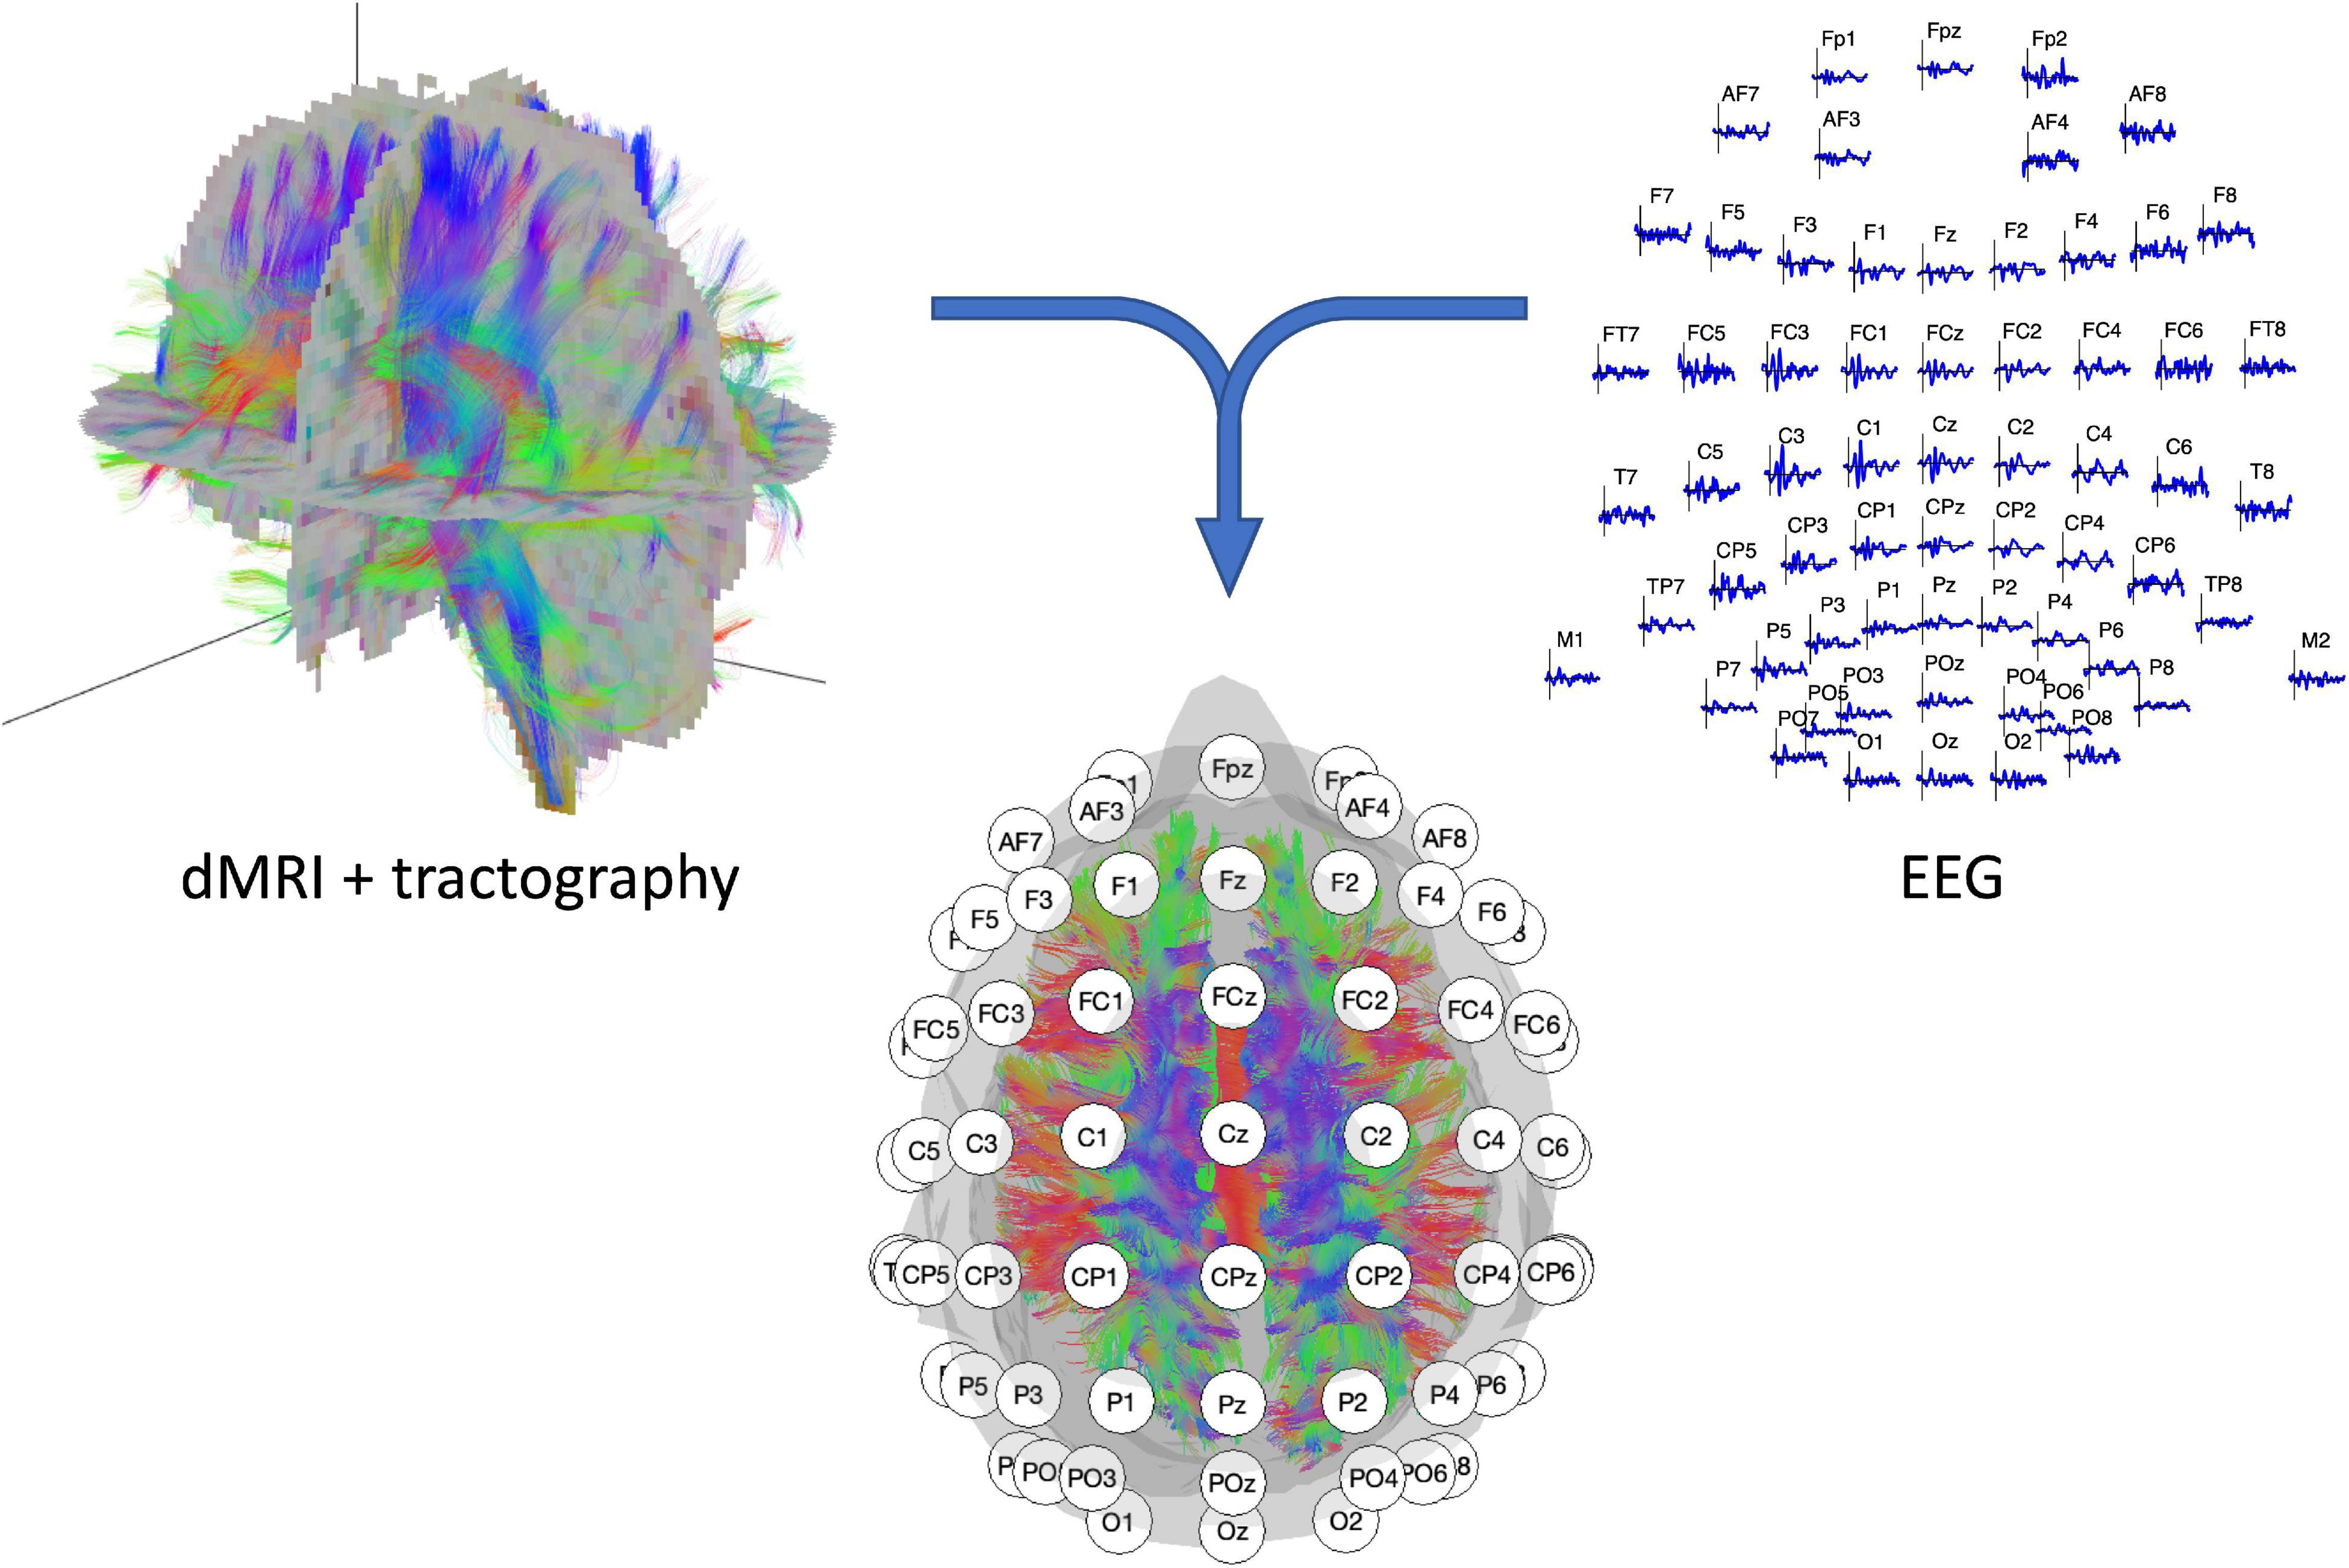
Figure 1. Illustration of the two recording modalities. (Left top panel) dMRI recording with resulting fiber tracts. (Right top panel) 64-channel EEG signal with electrode layout conform the 10–20 systematic. (Middle lower panel) EEG/dMRI combination to explore the link between structural and functional connectivity.
Diffusion MRI encodes diffusion-driven displacements of water molecules over time into MRI signals. It allows to assess tissue characteristics in vivo (Stejskal and Tanner, 1965). In the presence of gradient pulses, diffusion attenuates the MRI signal rendering it diffusion weighted. In contrast to freely diffusing water, biological tissue hinders and/or restricts molecular diffusion, which can provide information about the corresponding microstructural organization. Diffusion tensor imaging (DTI) (Basser, 1995) is a widely used dMRI analysis approach to obtain anatomic features of white matter (WM). However, DTI is based on the assumption that the molecular displacement distribution in biological tissue is Gaussian (Basser, 1995), while in reality it is distinctly non-Gaussian (Assaf et al., 2004). The degree of (symmetric) deviation from the Gaussian distribution can be quantified via the kurtosis. Diffusion kurtosis imaging (Jensen and Helpern, 2010) exploits this via so-called multi-shell high angular resolution diffusion imaging. It can provide additional and often relevant information about tissue heterogeneity.
The dMRI comes with several outcome measures, all meant to quantify the WM microstructural organization. The mostly used metrics are fractional anisotropy (FA), three forms of diffusivity, and kurtosis anisotropy (KA). FA quantifies the amount of diffusion along the principal direction on a normalized scale, i.e., a value of 0 indicates undirected or isotropic diffusion, whereas a value of 1 indicates full directedness or anisotropy. FA is thought to reflect various tissue properties such as axonal myelination, axonal diameter, axonal density, and fiber organization (Scholz et al., 2009). By contrast, diffusivity measures quantify the overall degree of water diffusion. As said, it is specified in three forms: mean diffusivity (MD), radial diffusivity (RD), and axial diffusivity (AD), all in relation to the aforementioned principal direction of diffusion (Pierpaoli and Basser, 1996). Lastly, KA solely reflects the anisotropy of the kurtosis tensor without contributions from the diffusion tensor (Poot et al., 2010). All the measures can be estimated in isolated ROIs or for fibers connecting them, the latter after conducting additional tractography; see Figure 1.
From a mechanistic perspective one may expect that the nature of WM microstructural organization influences the transfer of activity between different neuronal populations. That is, if EEG measures serve to quantify such transfer of activity directly, one may expect them to be strongly associated with the afore-listed DWI metrics. By hypothesis, a higher degree of microstructural organization is, hence, accompanied by stronger and faster neural transmission. As will be shown, this is indeed the case for some of the EEG outcomes but not for all of them.
We conducted a keyword-based search in PubMed and ISI Web-of-Science. Search terms [“DTI” AND “EEG”], [“DWI” AND “EEG”], and [“DKI” AND “EEG”], which provided 270, 220, and 3 hits, respectively. Animal and computational studies, technical/methods studies as well as clinical studies that employed the modalities for their isolated diagnostic value were excluded. We also excluded review papers and non-English publications. This selection yielded 40 combined dMRI/EEG studies including 17 experimental ones in healthy participants and 23 investigating pathology. The latter included neurodegenerative disease like epilepsy and Alzheimer, trauma-induced cases like stroke and traumatic brain injury (TBI), and psychiatric conditions (e.g., schizophrenia); an overview of some of them can be found as Supplementary Material.
Estimating the relationship between structural and functional brain characteristics requires three important steps: (i) selecting a set of ROIs, either a priori or based on the statistical significance of FA group differences or signal power as a function of location; (ii) defining appropriate (statistical) methods to determine the structural and functional characteristics of interest; and (iii) selecting the proper statistical means to identify possible associations between them. Several studies (N = 13) refrained from conducting step (iii) – for example because they referred to case studies – and only reported the individual EEG- and dMRI-based results. Yet, these studies revealed novel insight into the structure/function relationship and were included in this review.
We arranged our inventory of studies by experimental paradigm and corresponding analysis method, as both factors turned out to qualitatively affect the outcomes regarding the (expected) relation between functional EEG and structural dMRI measures. Given the long tradition of using EEG both in fundamental research and in the clinic, its experimental designs and analyses form the backbone of our review, from assessments of event-related potentials, different spectral analyses and functional connectivity approaches to more recent studies involving source-localization techniques. In what follows we will particularly highlight the reported association between these functional activities and co-registered dMRI measures before discussing the potential benefits and shortcomings of such combined recordings.
The most used approach in experimental EEG studies comprises of evoking activity patterns using repeated stimuli that may differ between studies. This design yields so-called event-related potentials (ERPs), highlights activity that is time-locked to an event (i.e., the moment of stimulation) and eliminates non-time-locked background activity via averaging to event-aligned epochs. According to the aforementioned mechanistic view (see Section “A Mechanistic View”), the possibility of time-locked activity to emerge depends on the myelination of connecting axons and dendrites (Pajevic et al., 2013; Noori et al., 2020). An increased degree of microstructural organization correlates with faster action potential conduction (Westerhausen et al., 2006; Whitford et al., 2011a). Especially FA is believed to reflect this degree of WM microstructure and should therefore be associated with different outcome measures like ERP amplitudes and latencies.
All the reports included in this section are so-called task-related studies, where participants were asked to perform a cognitive, sensory, or motor task during EEG recording. We grouped them under the headings error-related, early attention-related and later cognitive-related responses. Error-related responses are ERPs evoked by commission errors when participants are asked to respond as accurately and quickly as possible to a cognitive task (Gehring et al., 1993). Early attention-related responses can be observed when the task is to react (respond) as soon as an external sensory stimulus has been observed (Noesselt et al., 2002; Poghosyan et al., 2005). Cognition-related responses are later ERPs resulting from attention and cognitive control processes, e.g., when participants respond to stimuli like words or images (Patel and Azzam, 2005).
Westlye et al. (2009) studied the interaction between error-related negativity (ERN) and WM characteristics during a (modified) Eriksen flanker task (Eriksen and Eriksen, 1974). The ERN originates from the cingulate cortex (Herrmann et al., 2004; Debener et al., 2005) and has a negative peak ∼40–70 ms after a behavioral/cognitive error has been committed (Gehring et al., 1993; Taylor et al., 2007). Westlye et al. (2009) found a positive correlation between ERN amplitudes over medial fronto-central EEG electrodes and mean FA values in left posterior cingulate cortex and left superior longitudinal fasciculus. They also reported a negative correlation between the ERN amplitude size and RD values, i.e., smaller RD values correlated with more negative ERN amplitudes in the left cingulum bundle. According to Westlye et al. (2009) the WM microstructural organization in anterior cingulate cortex predicts amplitude of the ERN component though strictly speaking they did not provide a corresponding proof for this conjecture. Gao et al. (2017) followed a similar paradigm using the Eriksen flanker task but they focused on the N200 (or N2) amplitudes as a measure of response conflict (Clayson and Larson, 2013). N2 amplitudes were determined as maximum negativity averaged over electrodes (Yeung et al., 2004) and FA maps were estimated from a whole-brain voxel-wise analysis using tract-based spatial statistics (TBSS), which refers to the projection onto an alignment-invariant tract representation (the “mean FA skeleton”) after a properly tuned non-linear registration of individual FA images (Smith et al., 2006). With this, Gao et al. (2017) found a significant positive correlation between larger N2 amplitudes and higher FA in right superior longitudinal fasciculus connecting frontal and parietal cortex. This suggests a direct relationship between WM-based structural connectivity and EEG measures of cognitive responses.
Myer et al. (2016) evaluated the so-called Q-Collar, a neck collar worn by athletes with the intention to protect the brain from head impacts. Aim of this study was to test the collar’s effect on reducing neuroanatomical and neurophysiological damage in two groups of hockey players that either wore the collar or did not (the latter served as controls). DTI was collected at different time points (pre- and mid-season) at which also EEG data were collected while the athletes performed an auditory oddball paradigm. Latencies and amplitudes of the ERPs served to compute so-called brain network activation (BNA) scores. As compared to the collar group, controls showed larger electrophysiological changes along with increased MD/RD values from pre- to mid-season in the corpus callosum. Only in the control group, significant positive correlations were found between an increase in the absolute change of BNA scores and increased MD/RD values in various ROIs. It seems that structural alterations yield larger ERP latencies and lower ERP amplitudes.
Lateralized visual stimuli allow for unravelling the interplay between left and right hemispheres. Westerhausen et al. (2006) followed this idea and investigated both reaction time- and evoked potential-based inter-hemispheric transmission times (IHTTs) and their relation to corpus callosum architecture. Healthy participants responded to briefly presented lateralized visual stimuli. IHTT can be considered a measure of interhemispheric, functional connectivity. IHTT was estimated from P100 and N160 ERP components in lateral electrode pairs over occipital, parietal, and temporal cortices. Given the focus on the corpus callosum, DWI measures were extracted for the genu, truncus, and posterior third. This revealed significant correlations between longer left/right occipital P100 IHTT and lower MD values in callosal regions connecting visual cortical areas. While this seemingly contradicts the aforementioned mechanistic account, it does suggest a direct relationship between microstructural organization of the posterior regions of the corpus callosum and inter-hemispheric transfer time of visual information.
To further detail spatial dependencies, Whitford et al. (2011a) applied tractography between selected ROIs. They investigated the correlation between IHTT and structural connectivity but concentrated on fibers of the corpus callosum connecting visual processing areas in groups of schizophrenia patients. Unilateral visual stimuli were presented, and participants were asked to look at a central fixation cross and count the number of targets. IHTT was estimated for N100 and P100 (or P1) components, which were determined as the most negative and positive amplitudes post stimulus in the bilateral, parietal electrode pairs. Rather than correlating ERP amplitudes, Whitford et al. (2011a) used the left/right difference in peak latencies and compared them with FA values extracted from visual fibers crossing the posterior part of the corpus callosum, bilaterally connecting primary and secondary visual cortices. They found an association between longer IHTT (P100 latency differences) and lower FA values in visual callosal fibers for both groups, albeit not significant after Bonferroni correction. The relationship was found in fasciculi that were shown to be structurally affected in schizophrenia (Kubicki et al., 2007; Whitford et al., 2011b). Apparently, changes in the WM microstructural organization of the visual fibers of the corpus callosum are accompanied by additional conduction delays in schizophrenia patients. Using a lateralized cognitive task (dichotic listening), Friedrich et al. (2017) searched for correlations between individual differences in neural architecture of the corpus callosum and functional asymmetries, i.e., hemispheric latency differences. They determined the N100 ERP amplitudes in lateral central electrodes, which are believed to relate to bottom-up attentional processes (Herrmann and Knight, 2001). Left/right differences in peak latencies were compared with mean FA values in anterior callosal third, mid segment and posterior callosal third. The results indicated higher FA values to be associated with reduced hemispheric latency differences, as found in the posterior callosal third during the dichotic condition.
Turning to the interaction between the auditory and the motor network, Whitford et al. (2011c) conducted an experimental study in two groups of schizophrenia patients and healthy controls. They employed three experimental conditions to deliver self-generated auditory stimuli with different delays (0, 50, and 100 ms) after a button-press. They also included a condition coined “passive-listening”, in which auditory stimuli were delivered without button presses. From the central, medial electrode, the N1 suppression was determined as the difference between the N1 amplitude during self-generated auditory stimuli and that during the passive-listening condition. This amplitude is known to be suppressed in response to self-generated auditory stimulation (Schafer and Marcus, 1973; McCarthy and Donchin, 1976; Ford et al., 2001, 2007; Martikainen et al., 2005). And, according to Ford et al. (2007), schizophrenia patients exhibit subnormal amounts of N1 suppression to auditory stimulation evoked indirectly by a voluntary motor action. In Whitford et al. (2011c), FA values were estimated for the left arcuate fasciculus tracts, connecting motor initiation areas in the frontal lobe with auditory cortex. They observed a significant positive correlation between the corresponding FA values and the degree of N1 suppression in the un-delayed condition (higher FA values correlated with higher N1 suppression) and a negative correlation with N1 suppression in one of the delayed conditions (50 ms). Although this was the case for both schizophrenia patients and healthy controls, they speculated that structural damage to the arcuate fasciculus may have been responsible for the observed delays in corollary discharges arrival at sensory cortex in schizophrenia patients. This agrees with the idea that corollary discharges are involved in suppressing the sensory consequences of self-generated actions (Crapse and Sommer, 2008).
Evstigneev et al. (2013) assessed the relationship between structural and clinical features in patients with pharmaco-resistant epilepsy, patients in persistent remission and healthy controls during an auditory two-tone oddball paradigm. The P300 component typically occurs after sensory discrimination (Picton, 1992). Evstigneev et al. (2013) extracted this ERP from the side of epileptic activity focus. FA was estimated for anterior and posterior quadrants of axial sections. They found a significant, negative correlation between epileptic activity and FA values, in which increased amplitude of theta rhythm correlated with decreased FA values in the hemisphere with epileptic activity. Evstigneev et al. (2013) also reported that FA values were negatively correlated with a latency period of the P300 in the anterior quadrant of the epileptogenic hemisphere (decreased FA values correlated with a longer P300 latencies). Since the P300 generation seems to involve interhemispheric integration of sensory information (Knight et al., 1989; Yamaguchi and Knight, 1991, 1992), the P300 might be affected by altered transcallosal fibers (Caminiti and Sbriccoli, 1985; Pandya and Seltzer, 1986). The results hence suggest that P300 latencies can be affected by microstructural organization of the corpus callosum. Put differently, the microstructural organization of the corpus callosum seems to correlate with cognitive functions.
Oestreich et al. (2019) investigated whether quantifying structural properties of auditory WM pathways may improve the prediction of psychotic-like experiences in the healthy population over and above predictions made by auditory prediction error responses alone. Participants listened to a classical two-tone duration deviant oddball paradigm and a stochastic oddball paradigm. They were asked to focus on a visual task (stream of letters) and detect consecutive repetitions of presented letters. ERPs were estimated for each condition and mismatch negativity was extracted. Mismatch negativity is a component of prediction errors, evoked by stimuli that differ from a learnt pattern (Belger et al., 2012; Nagai et al., 2013; Näätänen, 2014). Its amplitude has been shown to be reduced in schizophrenia. As indicator of the prodromal stage makes it a candidate biomarker for schizophrenia (Light and Näätänen, 2013; Näätänen et al., 2016). The left/right arcuate fasciculi and auditory interhemispheric tracts were reconstructed (cf. Table 1). Reduced mismatch responses (less-negative amplitudes) and reduced FA of the auditory interhemispheric pathway were associated with psychotic-like experiences. Both of them may hence marker early psychotic symptoms.
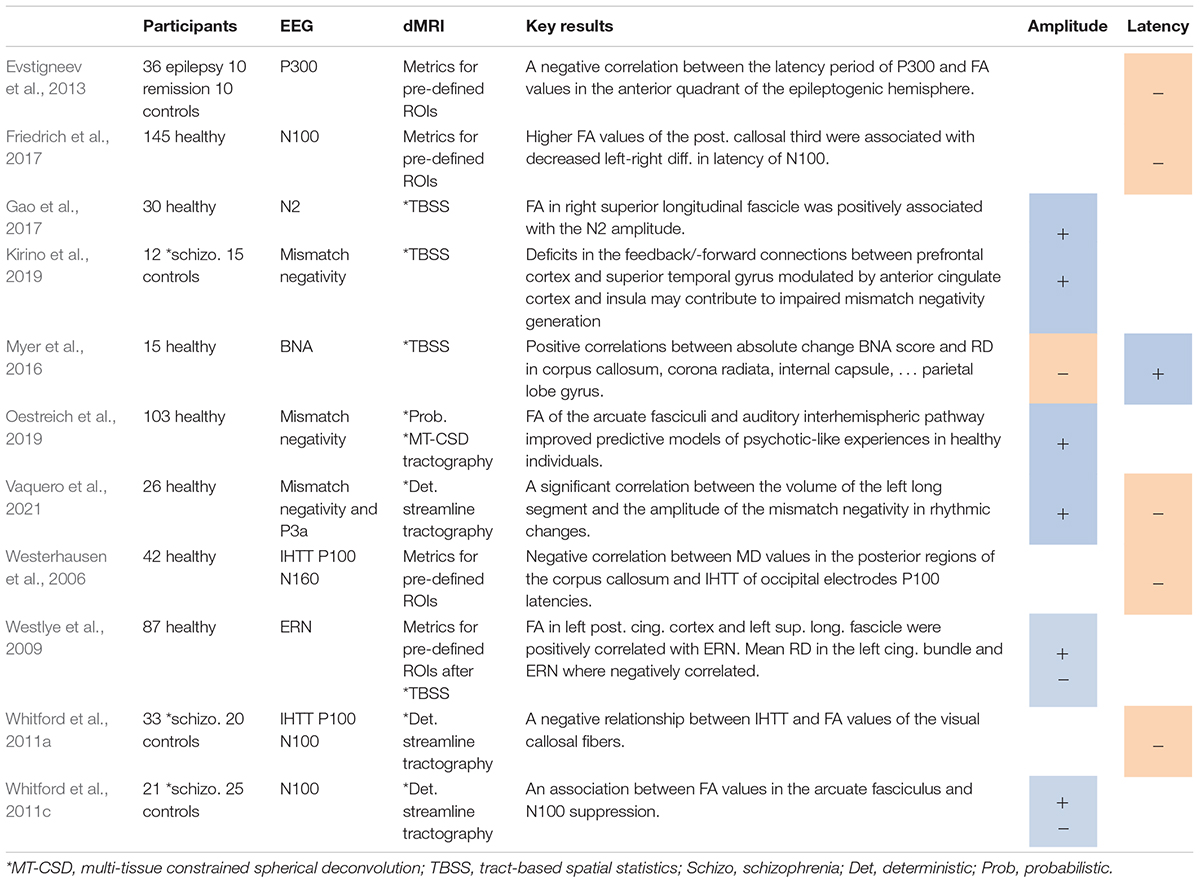
Table 1. Studies on event-related potentials, including positive (+) or negative (−) associations between ERP amplitudes (A) or latencies (L) and DTI metrics.
Kirino et al. (2019) examined the mismatch negativity responses elicited by omission of auditory stimuli and their association with structural abnormalities in anterior cingulate cortex in patients with schizophrenia. Mismatch negativity amplitudes (at frontal and central electrode at midline) were expected to be reduced in patients with schizophrenia (Koshiyama et al., 2018). EEG served primarily a regressor of the co-registered fMRI revealing significant BOLD changes in the left superior temporal gyrus, anterior cingulate cortex, right superior temporal gyrus, and inferior/mid frontal cortices (Oknina et al., 2005). In patients, the amplitudes also correlated positively with BOLD in the Heschl’s gyrus. By contrast, FA values in the left anterior cingulate cortex were positively correlated with BOLD changes in right superior temporal gyrus. Kirino et al. (2019), thus, suggested that deficits of feedback/-forward connections between prefrontal cortex and superior temporal gyrus modulated by the anterior cingulate cortex and insula are related to impaired mismatch negativity generation.
Vaquero et al. (2021) assessed correlations between macrostructural properties of the arcuate fasciculus connecting potential cortical sources of mismatch negativity during music perception. Leading hypothesis was that mismatch negativity and frontal novelty P3 (P3a) are elicited after deviant responses. Mismatch negativity reflects the pre-attentive detection of a difference between an incoming sound and the predicted one (Näätänen et al., 2007; Winkler et al., 2009; Koelsch et al., 2019) and the P3a is associated with a shift in attention toward a surprising sound (Nager et al., 2003; Horváth et al., 2008; Berti, 2013). Tract volume measures were estimated for selected ROIs. A larger volume of the left long segment of the arcuate fasciculus was correlated with larger mismatch negativity amplitudes in a paradigm with rhythmic stimuli. Vaquero et al. (2021) argued that the lateralization of correlation reflects a specialization of left auditory regions in detecting changes in rhythmic stimuli (Zatorre et al., 1992; Zatorre et al., 2002; Poeppel, 2003).
Event-related potential components can reveal the transmission of signals between neuronal populations. As such they can provide insight into neural information transfer. Effects of structural connectivity on functional activity may explain differences in amplitudes and latencies of ERP components, both in healthy participants and patients (see Table 1). Changes in WM microstructural organization may affect the latency of the ERP component and velocity of data transfer between different brain regions, in particular between hemispheres (Westerhausen et al., 2006; Whitford et al., 2011a; Friedrich et al., 2017). ERP components can hence be considered sensitive to microstructural differences and, in consequence, amplitudes and latencies of ERP components may reflect structural changes in pathology during cognitive, sensory, or motor performance.
In contrast to the ERP studies described in Section “Event-Related Potentials,” the studies regarding the spectral composition of (ongoing) activity entails both resting state and task-related assessments, a classification we adopt to group the here-included ones. The so-called resting state condition refers to EEG recordings during which participants are asked to relax and ‘do nothing’ for some time period (i.e., neither cognitive, sensory nor motor tasks were imposed). Recently, resting state studies have become quite popular but more traditionally the EEG’s spectral content has been associated with task-related functional state like attention or motor performance. Given the diversity of EEG studies supporting the latter, spectral power in distinct frequency bands and its association with structural measures has in fact been the primary target in the search for functional expression of WM microstructural changes (Colrain et al., 2011; Olbrich and Arns, 2013; Scrascia et al., 2014). Hence, we organized the here-reviewed experimental reports by the frequency bands under study.
Delta and theta oscillations cover low frequency ranges (∼0.5–4 and ∼4–8 Hz, respectively). They can be observed, e.g., during the deepest level of relaxation or sleep but also mark anxiety, poor emotional awareness, stress, depression, inattentiveness and dementia (Teplan, 2002; McFarlane et al., 2005; McLaughlin et al., 2010; Gemignani et al., 2012; Scrascia et al., 2014; Bernardi et al., 2016).
Scrascia et al. (2014) investigated the relationship between WM alterations and functional abnormalities from eyes-closed resting state EEG data in older adults with mild cognitive impairment and Alzheimer’s disease and contrasted this with data from age-matched healthy controls. Focus was on the spectral power per EEG electrode. In the left frontal WM and in the corpus callosum, the progressive decrease in FA values appeared to be significantly correlated with increased delta and theta rhythm in frontopolar and frontal ROIs. Scrascia et al. (2014) speculated frontal areas to be the most vulnerable areas in Alzheimer disease that show the ‘abnormal’ functional activity due to the macrostructural atrophy. A comparable eyes-closed resting state paradigm was used by Duru et al. (2016) in patients with thalamic stroke. They found a significant correlation between FA values and delta/theta power metrics (averaged over electrodes) for patients and age-matched healthy controls. In healthy controls, delta power was correlated with FA values in the left superior corona radiata (connecting medial frontal cortex and basal ganglia), which was absent in the patients. The theta power was correlated with FA values in the body of corpus callosum, the left cingulum, and in bilateral superior longitudinal fasciculi in the healthy controls, and in patients in the right external capsule. Unfortunately, Duru et al. (2016) did not report the direction of correlation between FA values and EEG power. However, previous studies found negative correlations between similar parameters in stroke patients (Sainio et al., 1983; Nuwer et al., 1987; Calixto et al., 2004). For this, we speculate that the increased delta and theta power were correlated with decreased FA values.
Bruno et al. (2011) used multimodal imaging to study the unresponsive wakefulness syndrome and minimally conscious state induced by trauma. Since trauma was the reason of unconsciousness in these two patients, the authors explicitly asked whether the observed functional abnormalities were related to axonal or cortical damage. They considered EEG power per hemisphere during an eyes-closed resting state condition and used a left/right asymmetry index. For this, they subtracted the EEG-power of the right hemisphere from that of the left one and divided that difference by the sum of the two. From the DTI data, the number of WM tracts per hemisphere was extracted, in line with asymmetry analysis. Correlations between EEG and DTI outcomes were not determined. Yet, non-reactive delta (4–5 Hz) dysrhythmia with larger amplitude over the left hemisphere appeared to coincide with a marked reduction of the number of WM tracts in the same hemisphere in unresponsive wakefulness syndrome. By contrast, DTI tracts appeared symmetric in the minimally conscious state. These results suggest that unconsciousness in the unresponsive wakefulness syndrome is not only due to altered functional connectivity between brain areas but is accompanied by structural damage. For the minimally conscious state this is not necessarily the case.
Colrain et al. (2011) evaluated the effect of alcoholism in older participants on the time-resolved spectral power and on the WM microstructural organization. They were particularly interested in whether (earlier reported) changes in spectral power correlate with structural changes. Participants conducted a reaction time task for a visual Go/No-Go protocol representing an “oddball” Bernoulli series of letters. Relative to healthy, age-matched controls, alcohol addicts exhibited significantly lower delta power during the No-Go condition, which correlated with increased RD values in left and right cingulate bundles. In consequence, reduced delta power might be considered an electrophysiological expression for WM degradation in the cingulate bundle linking frontal to parietal cortical regions.
Given the close relation between sleep, cognitive performance and memory consolidation, Bernardi et al. (2016) examined the relationship between sleep parameters and brain structural changes after 12 and 24 h of intensive task practice and after post-training sleep (recovery sleep) in healthy participants. Spectral power was averaged over EEG electrodes during non-REM sleep and the delta power and its changes between the first and the last non-REM sleep cycle were considered during recovery sleep. Participants performed a driving simulation game, or a set of tasks based on impulse control, decision-making and conflict resolution. The learning paradigm was chosen because learning may lead to swift microstructural changes in gray matter (GM) and WM. MD values dropped significantly in cortical GM after intense training when sleep deprived but reverted after recovery sleep. The authors could not establish significant associations between changes in MD values (in both GM and WM) after recovery sleep and differences of delta power between the first and the last non-REM sleep cycles.
Gemignani et al. (2012) studied changes in power in various frequency bands during N2 and N3 sleep stages to investigate the role of thalamic dysfunction in sleep slow oscillations in a patient with fatal familial insomnia. They compared this with healthy controls. MD values in the insomnia patient were significantly elevated in both thalamus and cingulate cortex, while delta (and sigma) power markedly dropped during sleep across all cortical areas. Although the relationship between elevated MD values and reduced delta power was again not directly quantified, the authors argued for an association between thalamic neurodegeneration and altered electrophysiological activity.
Alpha oscillations (∼8–14 Hz) are spectral components that were already observed by Hans Berger about a century ago (Berger, 1929). For many years they were thought to ‘only’ represent idling activity of the visual cortex because they are particularly dominant at occipital EEG channels when participants have their eyes closed.
Valdés-Hernández et al. (2010) examined the association between the WM architecture and frequency of the alpha peak in an eyes-closed condition in healthy participants with focus on occipital electrodes. The frequency of the alpha peak was positively correlated with FA values in the posterior and superior corona radiates of both hemispheres, as well as in the isthmus and the tapetum of the corpus callosum (connecting the bilateral superior occipital lobes). By contrast, there were negative correlations with FA of the splenium and the posterior part of the corpus callosum connecting inferior occipital lobes (all correlations were significant). The sign variability in the correlation between alpha peak frequency and corpus callosum FA might be due to the dual inhibitory and excitatory role of the corpus callosum (Bloom and Hynd, 2005) or may reflect a negative effect of fiber density on conduction velocity (Reutskiy et al., 2003) since the splenium exhibits a high fiber density (Barazany et al., 2009).
Much in line with this, Jann et al. (2012) studied the relation between dMRI measures and alpha power in healthy participants in an eyes-closed condition. Mean individual alpha frequencies (m-IAF) were defined as the mean peak position within 8–12.5 Hz across recording epochs. The DTI data revealed significant positive correlations between higher IAF and increased FA values in the superior longitudinal fascicle, the genu and the splenium of the corpus callosum. These connect the core regions of the default mode network and working memory (Damoiseaux and Greicius, 2009; Jann et al., 2009). The correlations with AD (and RD) values were like those with FA and one may speculate that the increased FA values could be attributed to high AD values. Considering IAF as a marker for the global rate of information transfer between distributed networks (Klimesch, 1996), the positive relationship between FA and m-IAF reported by Jann et al. (2012) suggests faster signal transmission within thicker fibers.
As already discussed above, Duru et al. (2016) studied patients with thalamic stroke. They also analyzed alpha power at occipital electrodes and its correlation with FA values in various areas. These correlations were altered in stroke, whereby FA values in the body of corpus callosum turned out to be significantly correlated with occipital alpha power. Since the maximum correlation between alpha power and FA was located in the superior corona radiata, one may conjecture that the cortico-thalamocortical cycles are related to changes in alpha oscillations (Contreras et al., 1996; Crunelli and Hughes, 2010).
Weinstein et al. (2018) studied bilateral (motor) activation in children with unilateral cerebral palsy. In many of these children, the non-affected side shows involuntary mirror movements during unimanual movement of the affected hand. In addition to an eyes-open resting state condition, EEG data were collected during a motor task (squeezing a soft plastic sponge ball). The mean alpha power was determined over the sensorimotor cortex during the resting state and during the production of unimanual movement relative to rest. Fiber tracking served to calculate DTI metrics of the corpus callosum and cortico-spinal tracts. As compared to the less affected side, the cortico-spinal tracts of the affected side showed higher diffusivity (AD and RD) and lower FA values. Children with mirror movements showed higher FA values than children without, especially in the genu, midbody, and splenium of the corpus callosum. Tractography did not reveal any significant injury abnormality in corpus callosum fibers. Yet, the EEG displayed a strong alpha-restoration after movement termination of the affected side in the hemisphere contralateral to the moving hand. Unfortunately, the study did not address direct correlations between FA values and EEG alpha power. Yet, Weinstein et al. (2018) suggested that motor activation in the less-affected hemisphere could be due to ipsilateral motor connections, simultaneous brain activation or lack of inhibition through the corpus callosum.
Despite the strong link of beta oscillations to motor performance, all studies collected here linked dMRI outcomes with beta power during rest.
As mentioned earlier, Scrascia et al. (2014) studied older adults with dementia and compared their structural and functional markers with those of age-matched healthy controls. Beta power sharply decreased in frontopolar and frontal regions in patients with mild cognitive impairment and more so in mild and moderate Alzheimer’s disease. This power drop was significantly correlated with reduced FA values in frontal WM and in the anterior region of the corpus callosum. In line with fronto-temporal disconnections related to Alzheimer’s disease, early and progressive structural damage in frontal areas seems to yield a progressive reduction of beta power (Delatour et al., 2004).
Coming back to the study by Duru et al. (2016) on thalamic stroke, beta power and FA values in the left posterior limb of the internal capsule in healthy participants displayed a significant correlation. However, in stroke patients this correlation was observed in the right external capsule and the anterior and posterior limbs of the internal capsule. Considering other studies on stroke (van Wijngaarden et al., 2016), we are tempted to speculate that the reduced beta power in stroke patients included in the work from Duru et al. (2016) correlated with decreased FA values.
The combination of dMRI and EEG power at different frequencies can reveal how neural structure and function are coupled. Our review of the literature suggests that when associating with dMRI, the EEG spectral power in the lower frequency bands (delta and theta but also alpha) can be considered a functional expression of structural abnormalities, especially when applied to the resting state condition or during sleep. Analyzing dMRI together with beta power showed the sensitivity of beta power (and EEG spectral power in general) to changes in structural characteristics of cognitive and motor networks, as observed in patients with Alzheimer’s or stroke; cf. Table 2. In any case, EEG spectral power appears to be a marker for functional activity that is clearly affected by differences in structural features.
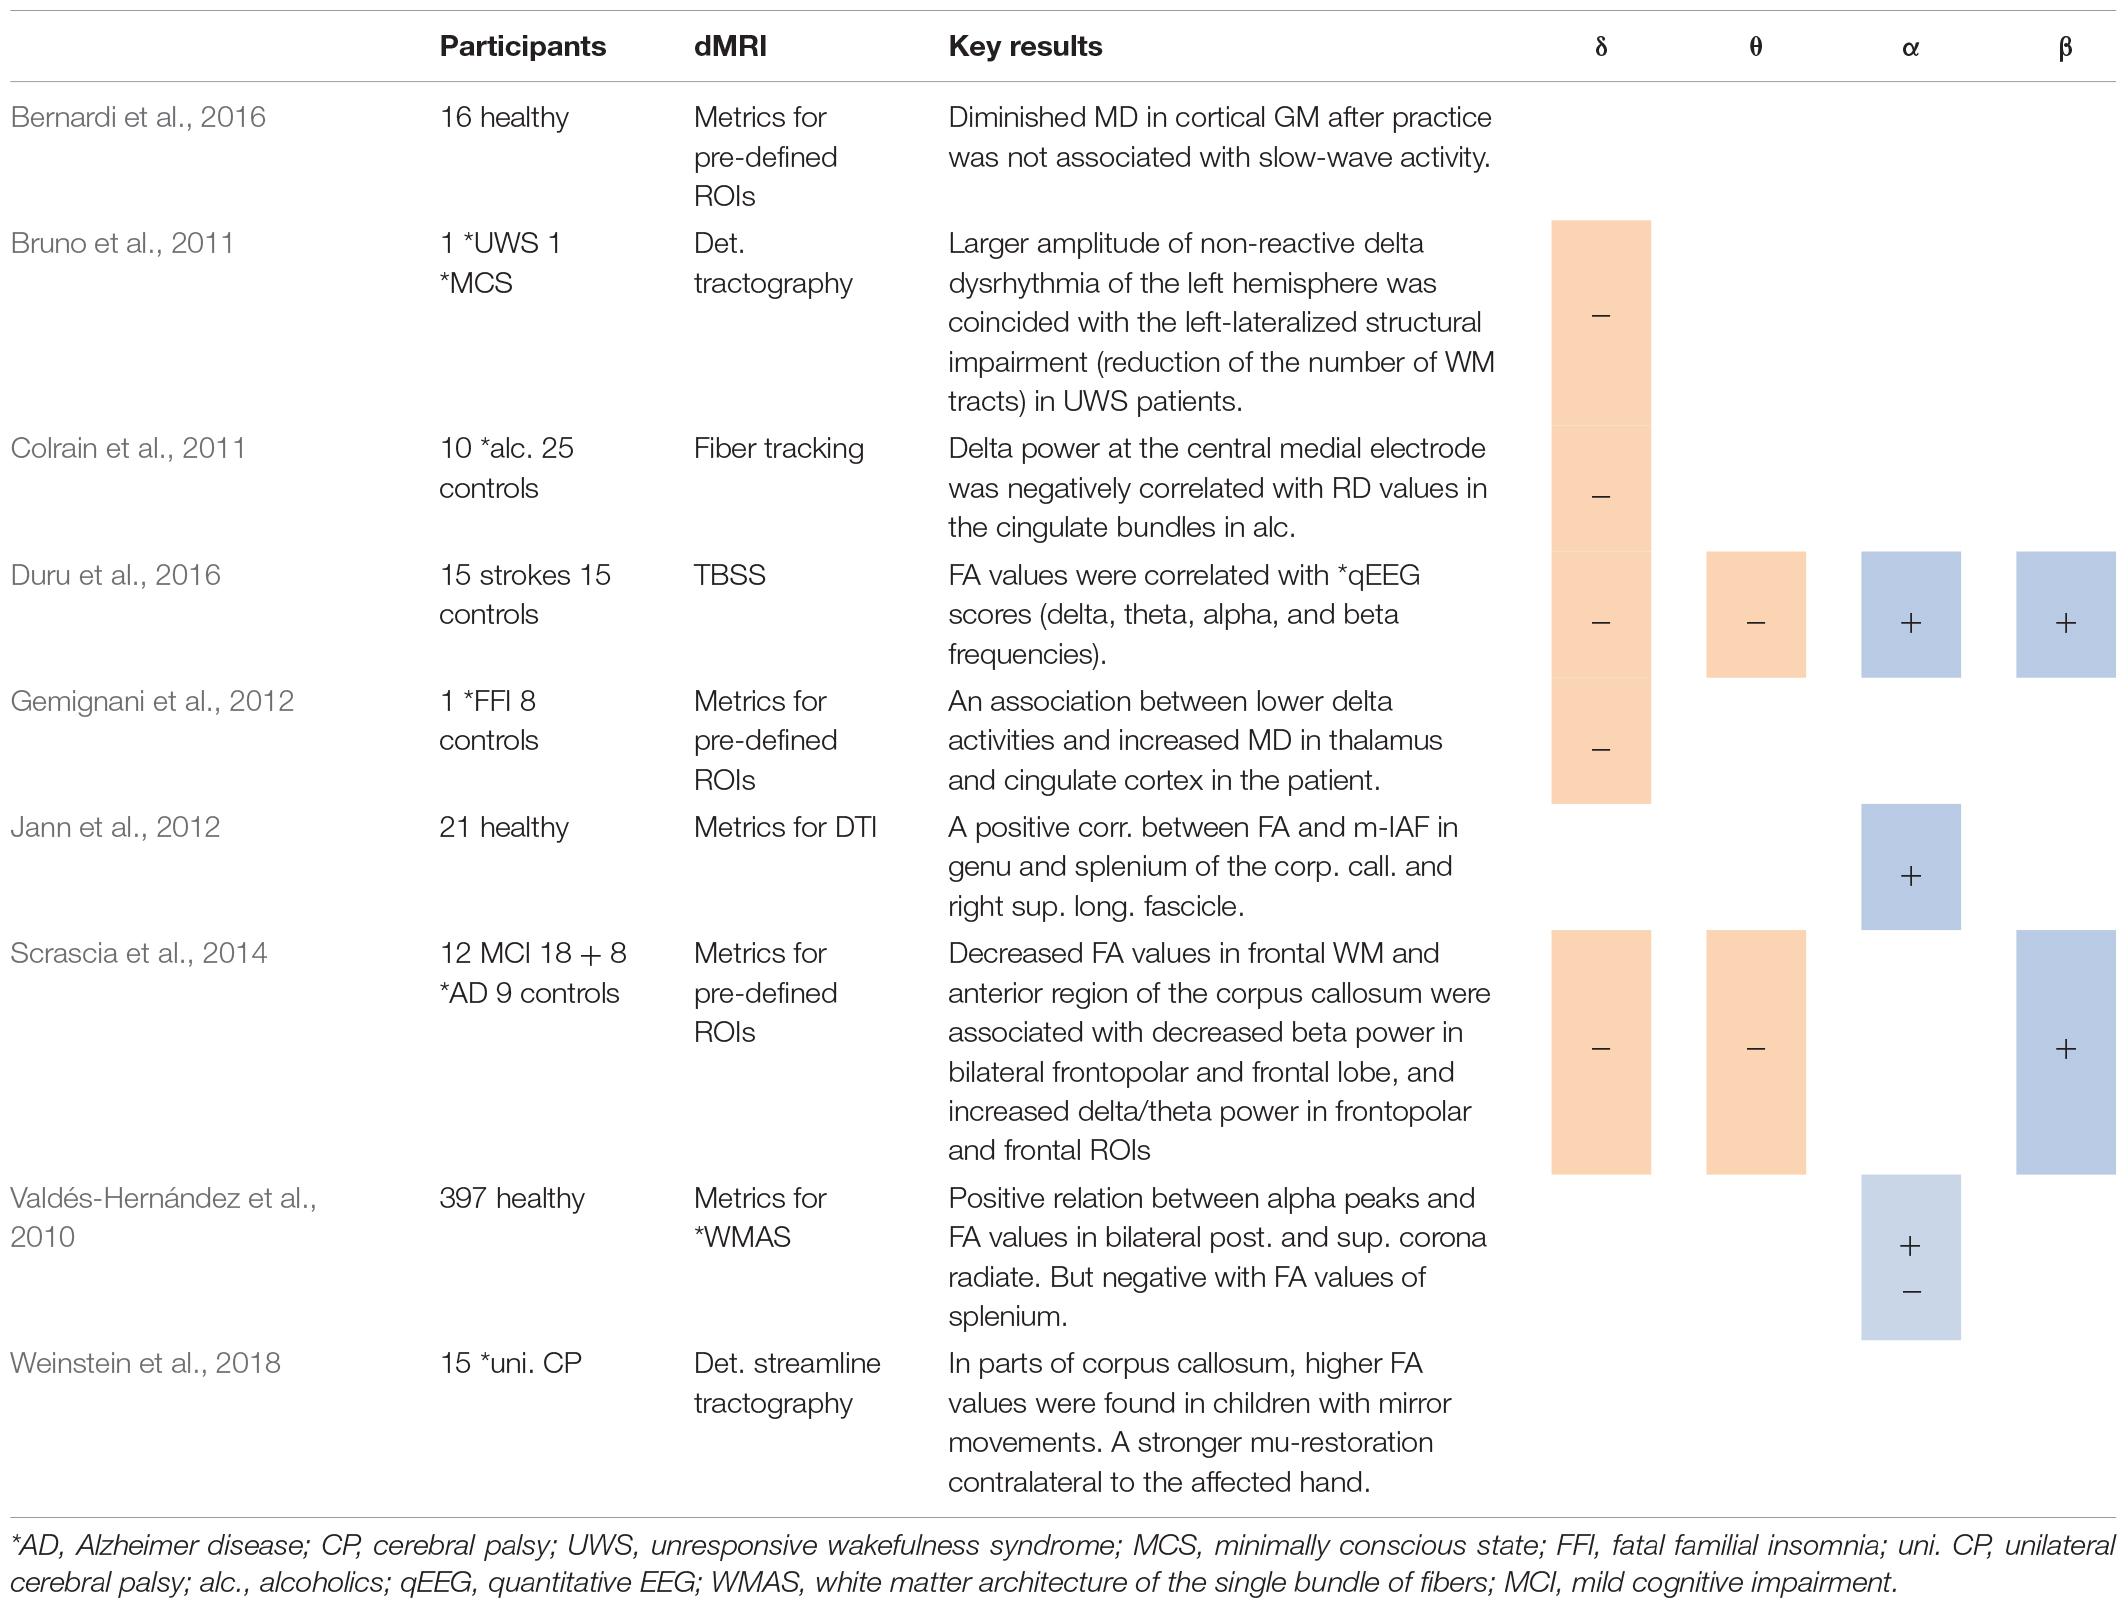
Table 2. Studies using spectral analysis, including positive (+) or negative association between spectral power in several frequency bands and DTI metrics.
The brain’s structural connectivity contributes to shaping neurophysiological activity, and thereby influences functional connectivity among neuronal populations (Wang et al., 2013) and brain regions (Honey et al., 2009; Deco et al., 2011). The strength of functional connectivity may depend on the microstructural organization of neuronal fibers crossing through the cerebral WM (Teipel et al., 2009; Cohen, 2011). A set of functionally connected regions is referred to as a functional network. Some functional networks can be detected during the resting state (Teipel et al., 2009), while others in the context of task-related behavior (Cohen, 2011; Liu et al., 2017) some of which persist across behavioral states like the default mode network (Cociu et al., 2018).
Teipel et al. (2009) investigated the relationship between regional interhemispheric coherence and subcortical fiber tracts in patients with amnestic mild cognitive impairment during eyes-closed resting state. Inter-hemispheric coherence was determined for various frequency bands between bilateral pairs of electrodes. Patients and healthy controls showed associations between reduced temporo-parietal alpha coherence and reduced FA/increased MD values in a diversity of brain regions. In the patients only, reduced frontal alpha coherence between frontal pairs of electrodes was associated with reduced FA and increased MD values in anterior corpus callosum, frontal lobe WM, thalamus, pons, and cerebellum. That is, corpus callosum, thalamus, mesencephalic and pontine WM and cerebellum seem to be involved in the maintenance of inter-hemispheric alpha coherence during resting state.
Changes in phase synchronization due to mild traumatic brain injury (mTBI) and its association with structural abnormality of WM axons were estimated from eyes-closed resting state EEG (Wang et al., 2017). The (weighted) phase-lag index between several pairs of electrodes served as a measure of synchronization. Across mTBI cases, a reduced phase synchronization between the pairs of (frontal, central, and parietal) medial and (central) lateral electrodes in the lower gamma frequency band (25–40 Hz) was significantly correlated with reduced FA values in the right inferior cerebellar peduncle, showing that an impaired WM microstructural organization is accompanied by an altered synchronization in the lower gamma frequency range. In the same spirit, Sponheim et al. (2011) studied a group of healthy controls and soldiers with mTBI caused by combat-related blast. Phase locking values between pairs of scalp electrodes were estimated during eyes-closed resting state condition. The employed time-varying analysis of neural synchronization (Cohen, 1995; Aviyente et al., 2011) allowed for determining similarities between signals from distinct brain regions. FA values of posterior/anterior corpus callosum and left/right anterior thalamic radiations were averaged over voxels within each ROI. In the anterior corpus callosum, reduced FA values showed a positive correlation with reduced beta synchronization between frontal and pre-frontal electrodes. In the left anterior thalamic radiation, reduced FA values correlated positively with reduced beta/gamma synchronization between distinct frontal electrode pairs, but only in the mTBI group. Hence, it seems save to conclude that altered WM tracts characterized by reduced FA values are associated with a reduced neural synchronization in both beta and gamma frequency bands.
The interaction between structure and function during performance of a cognitive control task in mTBI patients was investigated by Cavanagh et al. (2019). Participants were asked to respond to two-alternative-forced choice task based on the dot pattern expectancy variant of the AX-Continuous performance task (Barch et al., 2008) as a measure of balance between proactive and reactive control. Spectral power and phase angles were estimated to quantify inter-site phase clustering between medial and lateral frontal electrodes, which subsequently was compared with FA values (Smith et al., 2004) for all regions of the Johns Hopkins University WM atlas (Mori and van Zijl, 2007). FA and left-specific inter-site phase clustering in the theta frequency band were significantly correlated in both groups. In the mTBI group, this correlation was diminished along with smaller left-specific inter-site phase clustering and fewer voxels with lower FA, suggesting frontal theta band synchrony of cognitive control to be sensitive to structural disorders.
With the aim to identify long-range structural networks that support error processing function, Cohen (2011) determined functional connectivity in healthy individuals performing an auditory-visual task that was designed to elicit response errors. Time-frequency analysis of each electrode and phase synchronization between pairs of electrodes in the theta frequency band served as a measure of functional activity/connectivity. Cohen (2011) estimated structural connectivity via probabilistic tractography with seed regions selected from dipole sources of error-related theta activity (Delorme and Makeig, 2004). Those were mostly located in the anterior cingulate cortex and surrounding tissue, much in relation with the earlier discussed ERN. The number of pathways starting from the seed region and passing through the seed voxel (coined tract strength) was considered as structural connectivity index. Finally, Cohen (2011) correlated tract strength, power, and synchronization between the medial frontal electrode and other scalp electrodes across individuals. Participants with increased theta synchronization had stronger WM connections (based on the tract strength) from dipole source locations through the corpus callosum and fibers leading to the superior frontal gyrus (dorsomedial prefrontal WM pathways). The error-related theta power at the medial frontal electrode was positively correlated with the tract strengths between seed regions and ventral striatum, motor cortex, and ventrolateral prefrontal cortex. Cohen (2011) suggested that structural networks underlie the generation of medial frontal error-related neural dynamics and the neural activity related to error processing.
Liu et al. (2017) studied theta synchronization between medial frontal and posterior parietal cortices during response conflict conditions. They collected task-related EEG data from healthy participants using a modified flanker task to eliminate feature integration and contingency learning (Duthoo et al., 2014). Participants were asked to respond to the target digit (placed in the middle of four flanker digits) by pressing the corresponding key on the keyboard. A time-frequency decomposition yielded inter-channel phase synchronization in the theta frequency band between medial frontal and posterior parietal cortex. Voxel-wise statistical analyses of DTI indices were performed. Higher conflict-induced theta synchronization between medial frontal and right parietal electrodes turned out to be negatively correlated with reduced AD values in the genu, the splenium, the body of corpus callosum, and bilateral anterior and superior corona radiates. Given the earlier suggested involvement of posterior parietal cortices during conflict conditions (Bunge et al., 2002; Brass and von Cramon, 2004), the pattern of theta synchronization was interpreted as transient functional connectivity due to the induced conflict condition.
The combination of dMRI and coherence/phase synchronization allows for studying the link between functional and structural connectivity and to identify structural networks underlying task-related or resting state functional networks at different frequency bands (Table 3). All the reviewed studies support the notion that structural connectivity is associated with both task-related and resting state functional coupling at certain frequency bands. Overall, it seems that reduced coherence/phase synchronization is accompanied by an altered WM microstructural organization.
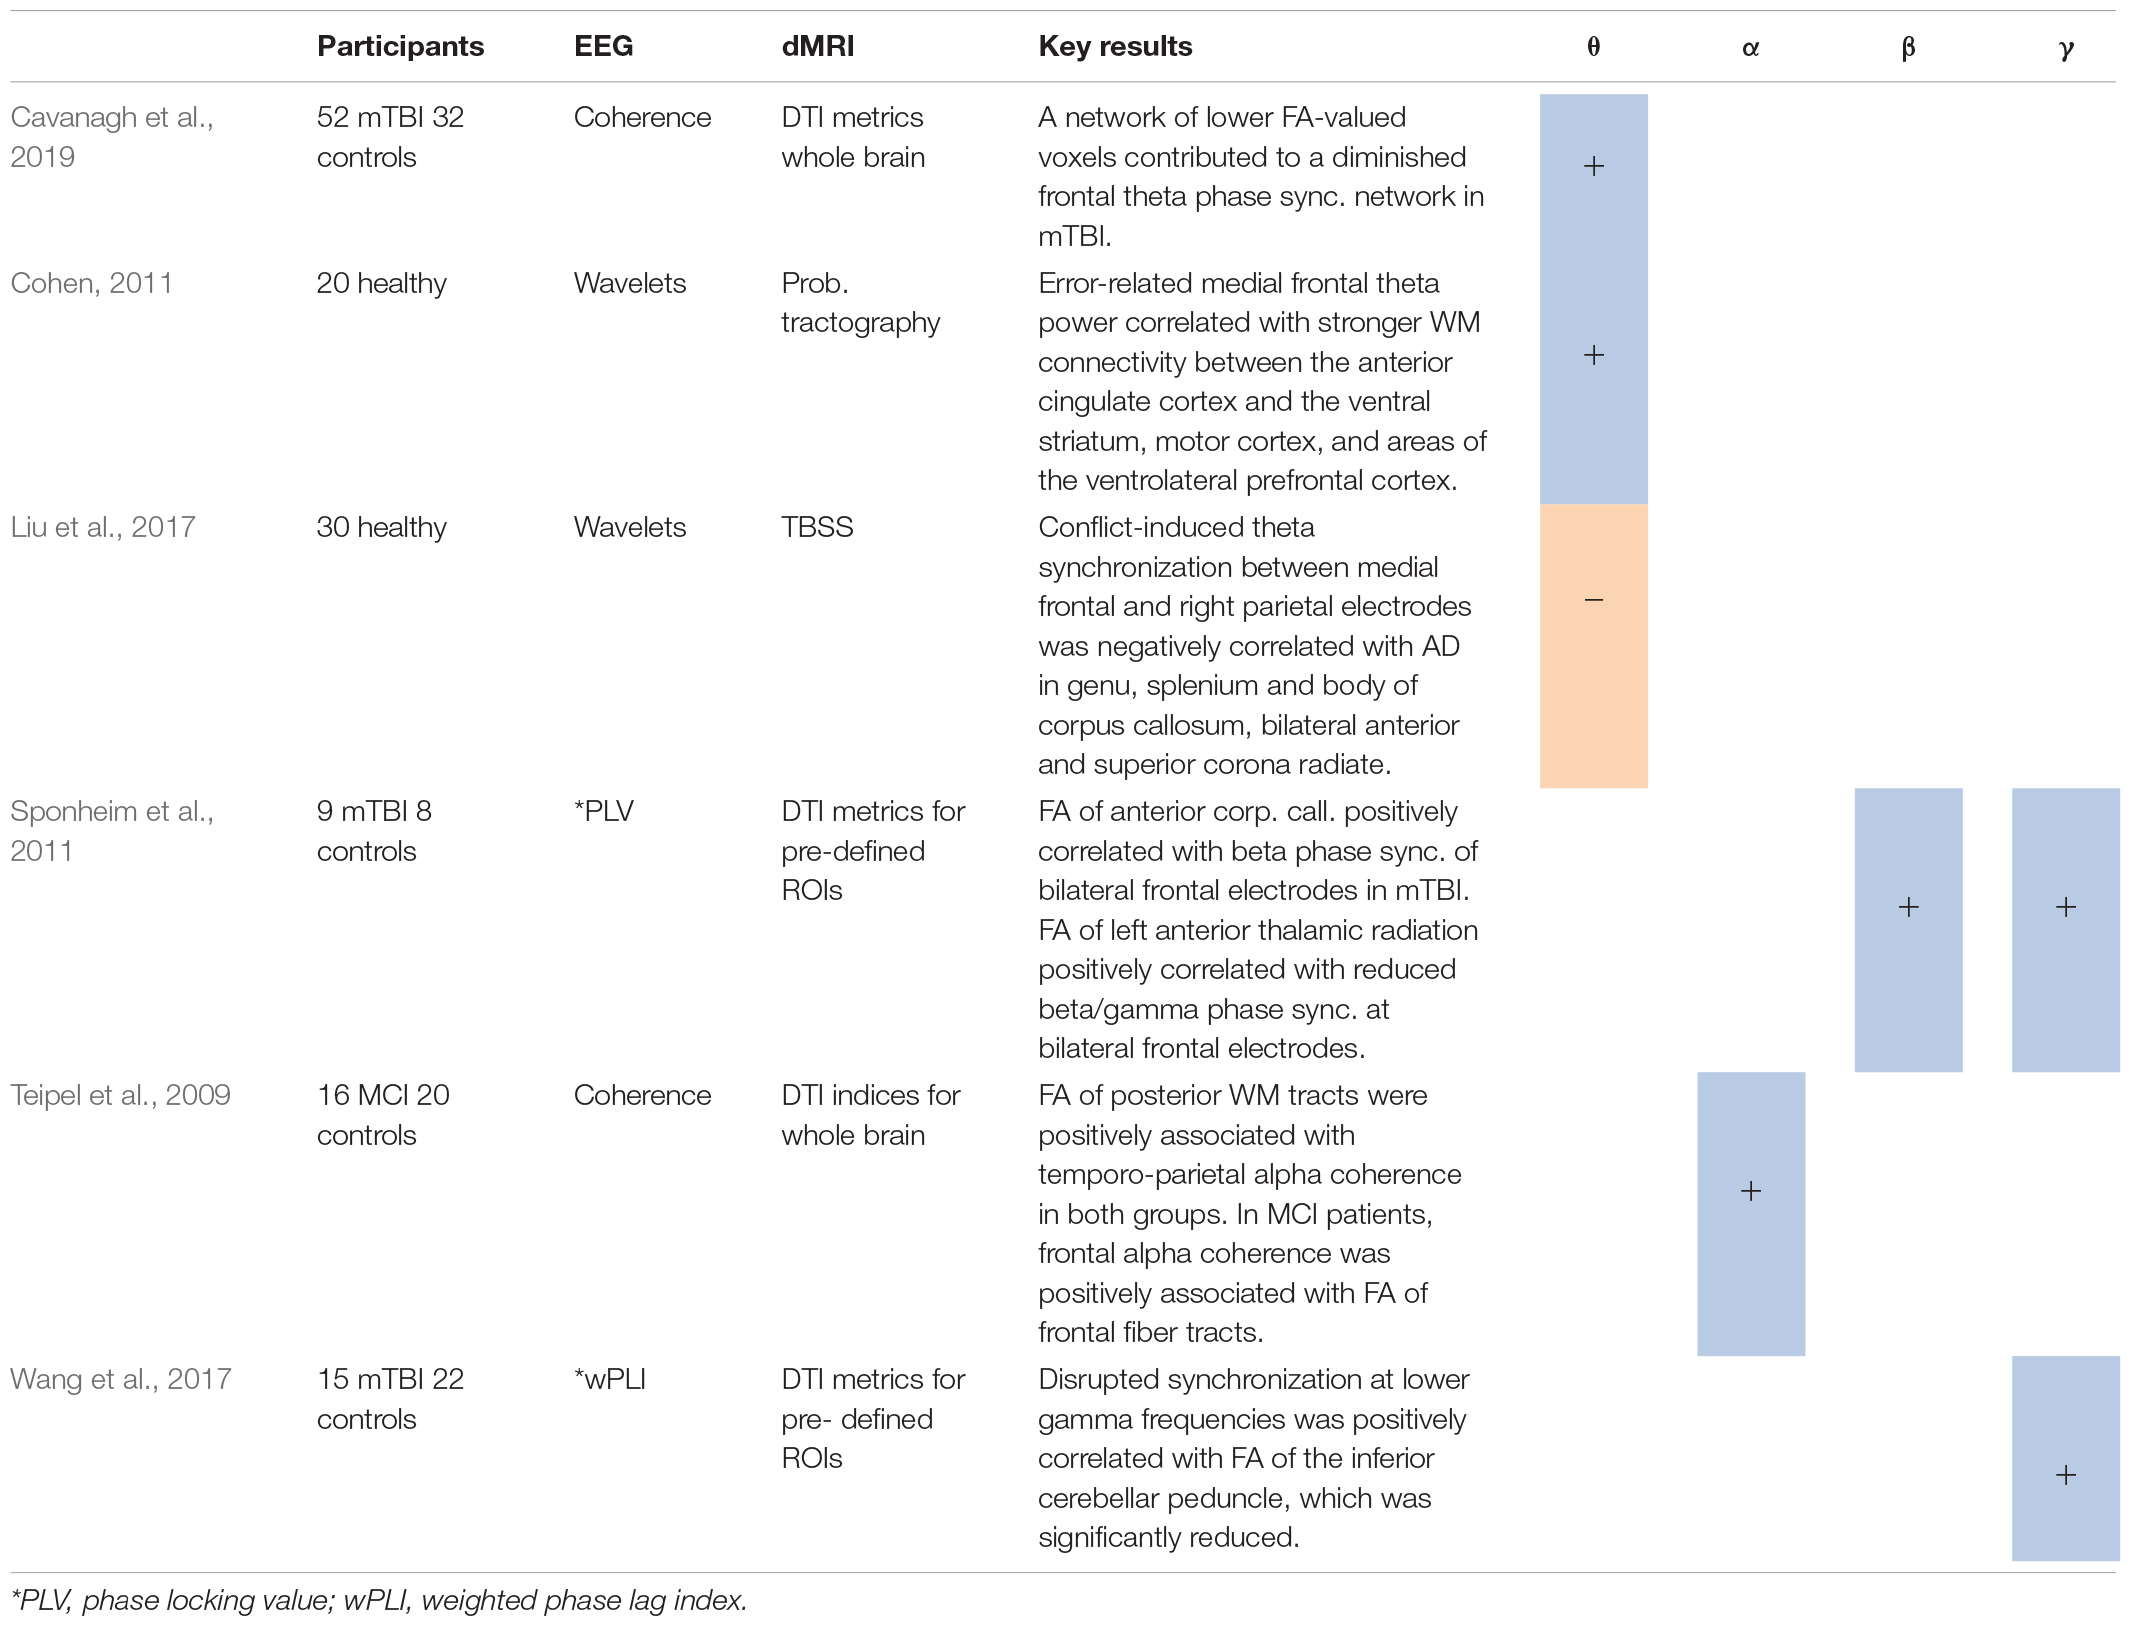
Table 3. Studies using synchronization analysis*, including positive (+) or negative (−) associations between measures for synchrony in several frequency bands and different DTI metrics.
An important aim of functional neuroimaging is to localize active brain regions. By now, there is a plenitude of methods available to estimate source activity potentially generating experimentally observed EEG. Inverse calculations yield virtual sensors or sources in the brain that may undergo analysis identical to what has been outlined in Sections “Event-Related Potentials,” “Spectral Analysis – Local Functional Connectivity,” and “Synchronization Analysis – Distant Functional Connectivity”.
Arrubla et al. (2017) investigated whether diffusivity and EEG sources are correlated with magnetic resonance spectroscopy (MRS) derived glutamate levels as recorded in posterior cingulate cortex. They hypothesized that glutamate is key to the excitation/inhibition balance in the brain. Glutamate concentration in the posterior cingulate cortex was recorded using single-voxel spectroscopy in a group of healthy adults during the eyes-closed resting state condition. EEG and fMRI were collected, and cortical locations of electrical neuronal generators were estimated. From the DTI data, MD maps were constructed. Across the default mode network, glutamate concentration was negatively correlated with source activities at high alpha and low beta frequencies but was positively correlated with low alpha. Glutamate concentration also showed negative correlations with MD values within the posterior cingulate cortex. All correlations were statistically significant. Apparently, both current densities (at alpha and beta frequencies) and structural properties in the posterior cingulate cortex, a critical node in the default mode network, are mediated by variations in glutamate.
In patients with epilepsy during eyes-closed resting state, Chu et al. (2015) determined EEG source activity (Hamalainen and Sarvas, 1989) for the junction point between GM and WM related to the digitized location of each scalp electrode. Functional networks based on coherence were shown to be shaped by underlying structural connectivity, especially in the gamma frequency band (cf. Table 4 for DTI processing). Additionally, increased functional connectivity between pairs of nodes in all frequency bands was significantly correlated with increased structural connectivity between the same nodes. In other words, within every patient, the functional connectivity between nodes that were structurally connected was significantly stronger than between nodes with zero structural connectivity. This was the case for all frequency bands.
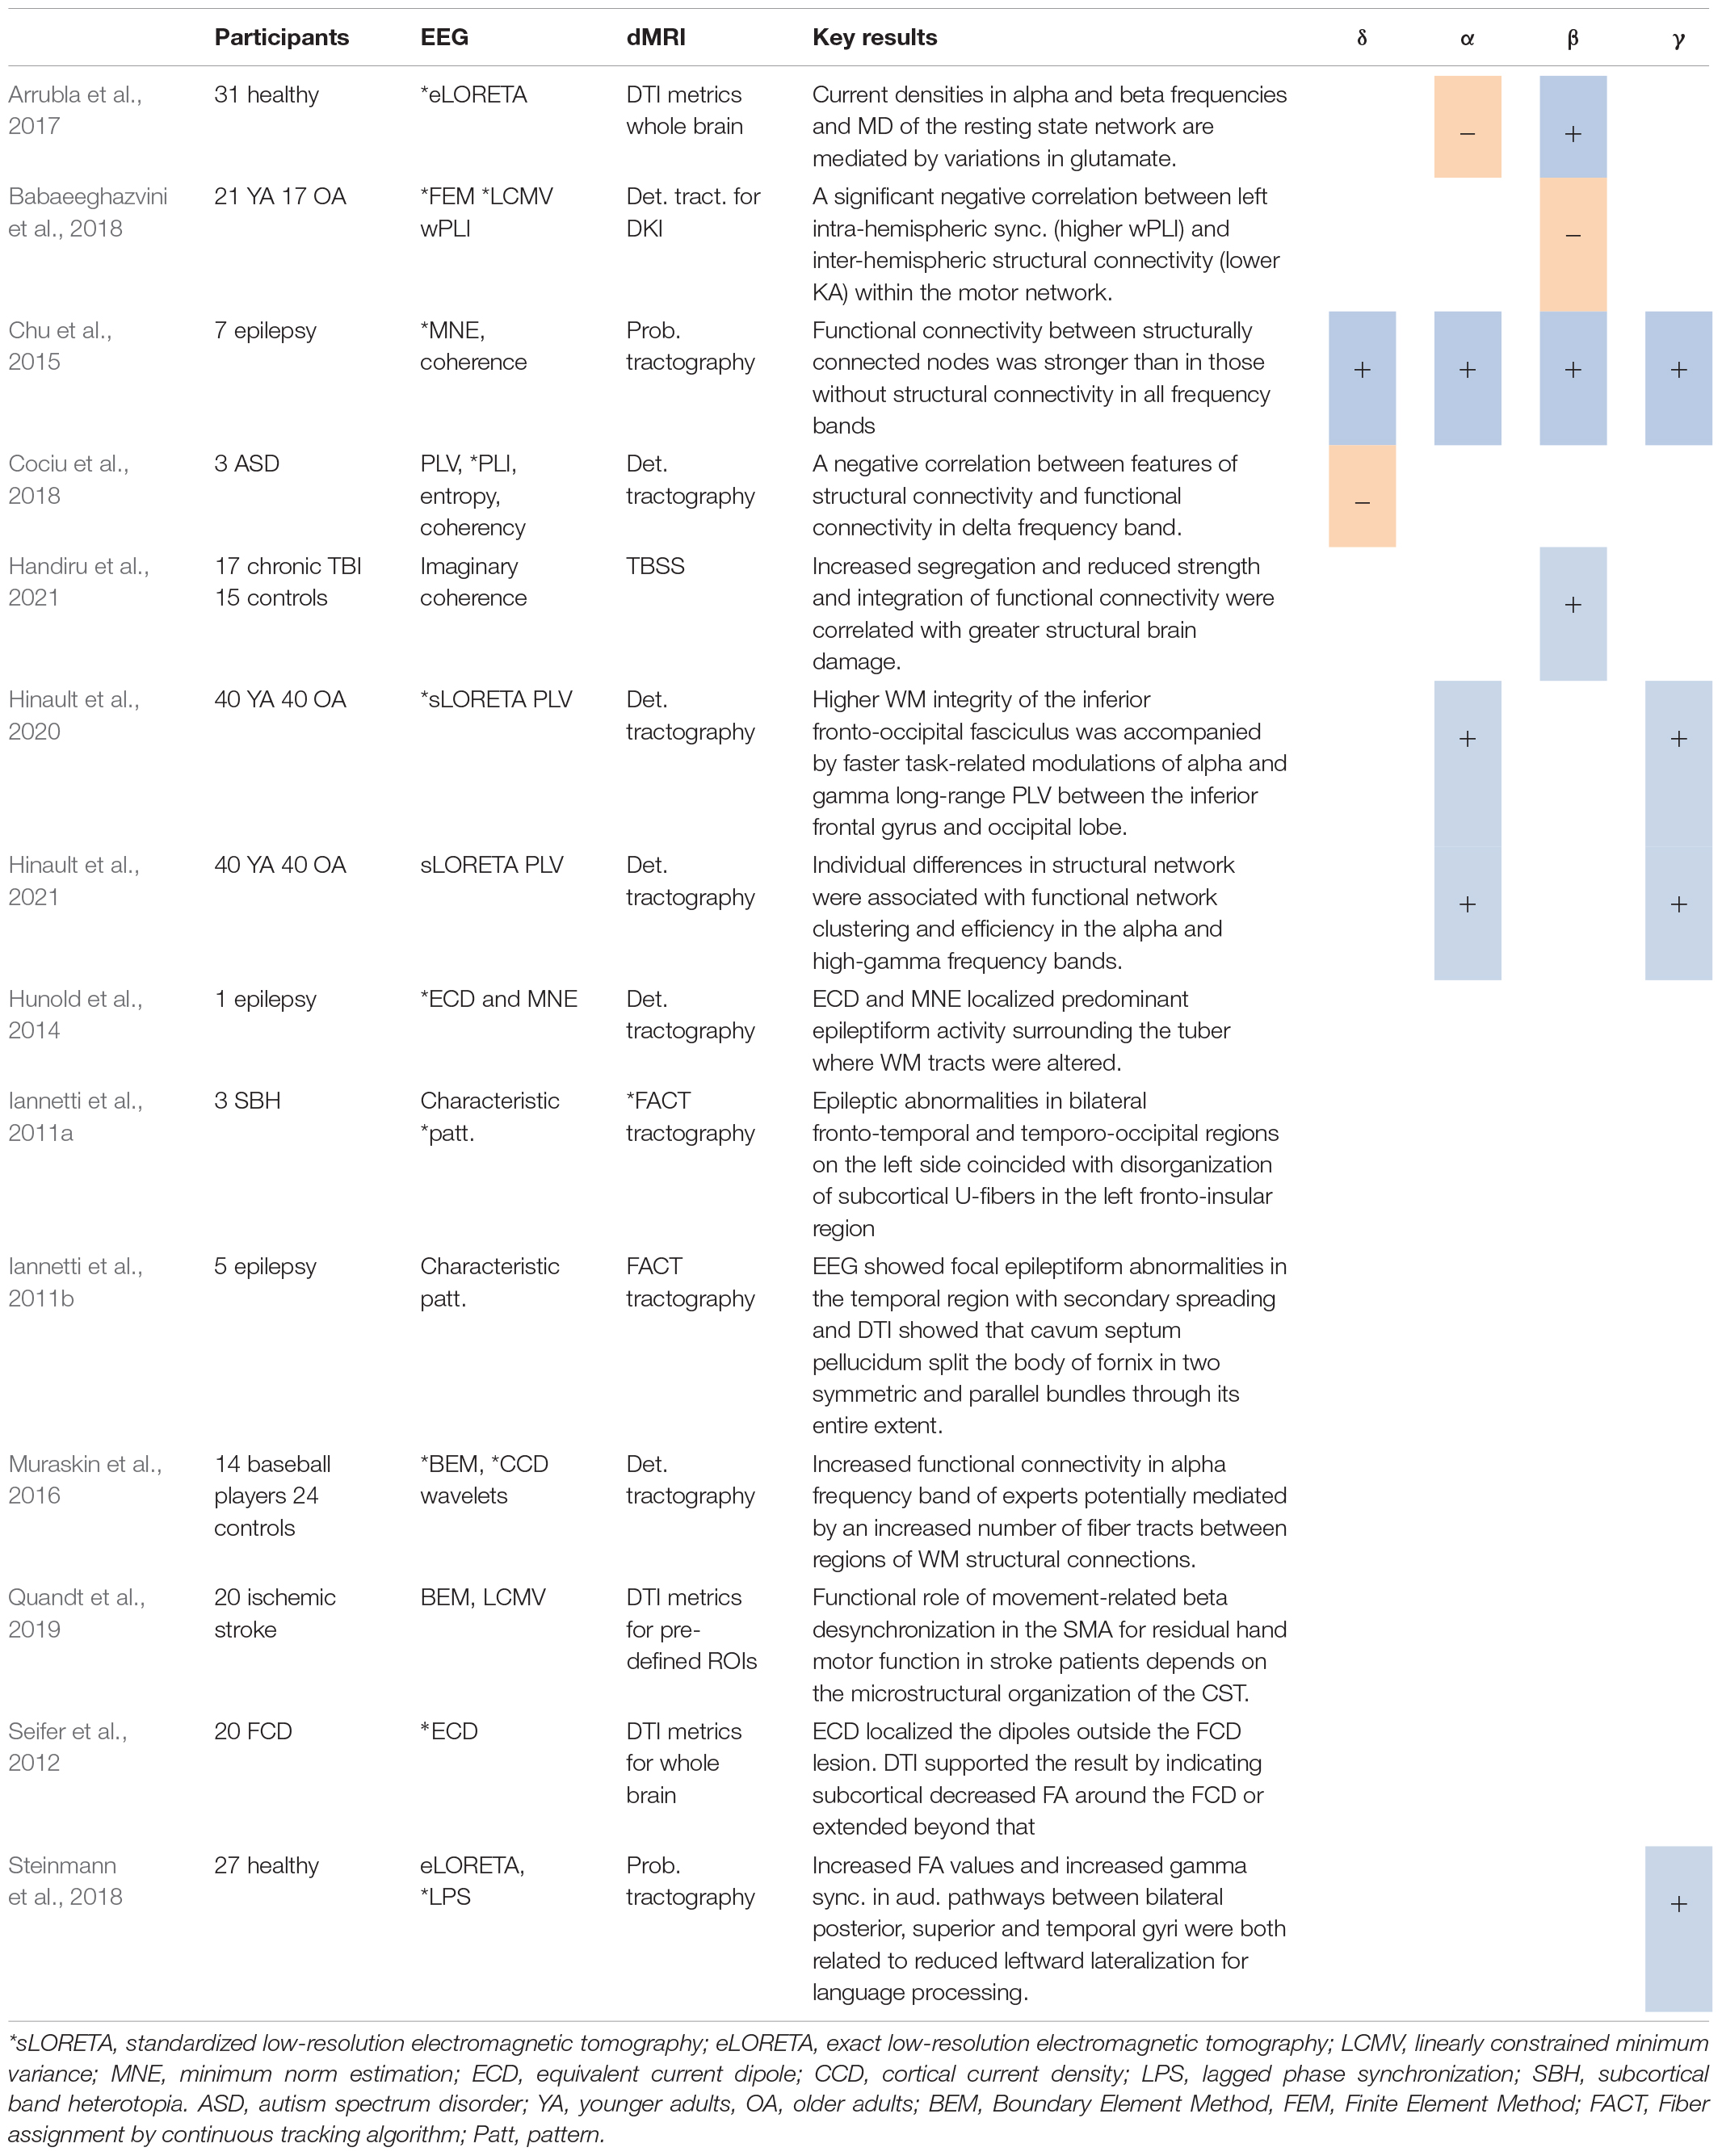
Table 4. Studies using source localization*, including positive (+) or negative (−) associations with different DTI metrics.
Seifer et al. (2012) targeted source locations of focal epileptogenic activities in patients with focal cortical dysplasia (FCD) during eyes-closed resting state. Equivalent current dipoles revealed neural sources of the EEG that were related to interictal spikes in regions around the focal cortical dysplasia lesion (as pre-detected by MRI). Next, DTI data were assessed using FA maps to detect WM areas with moderate or severe interhemispheric asymmetries in mean FA values. Areas with moderate or severe inter-hemispheric asymmetries were associated to the focal cortical dysplasia lesion and its surroundings. By the same token, patients with inter-hemispheric asymmetries showed decreased FA values in subcortical regions around the focal cortical dysplasia and even beyond the MRI-detected structural limits. This indicated epileptogenic zones in focal cortical dysplasia to be larger than the lesion in visible MRI. The results from EEG and DTI supported the notion that the epileptogenic zone in FCD is larger than the visible lesion in MRI, involving perilesional cortex.
Similar to the Seifer et al. (2012) study, Hunold et al. (2014) used both EEG and DTI techniques to identify the location of epileptiform activity in a single patient with tuberous sclerosis complex, which is a rare disorder of cortical tubers and is characterized by epileptic seizures. EEG signals were source localized during eyes-closed resting state, which revealed focal and extended sources of epileptiform activity in the vicinity of the calcified tuber, a disorganized area of the brain that contains abnormal cells. DTI metrics were estimated from the tracts passing through the tuber, the normal appearing WM (contralateral to the tuber), the set of adjacent dipoles within the epileptogenic zone, and the contralateral dipole cloud. This revealed changes in WM microstructural organization (lower FA and higher RD values) for the tracts passing through the region localized by equivalent current dipole, in the vicinity of the tuber. That is, epileptiform activity in tuberous sclerosis complex patients may ‘originate’ from an abnormally developed cortex around the tubers.
Iannetti et al. (2011b) evaluated the role of the cavum septum pellucidum and fornix in the generation of epilepsy and seizures. EEG during the eyes-closed resting state revealed focal epileptiform abnormalities in temporal regions with secondary spreading. DTI tractography showed that the cavum split the body of the fornix in two symmetric and parallel bundles through its entire extent. One may interpret this in that the septum inhibits the occurrence of epileptic discharges, and that the degeneration of this neural structure contributes to an increase in epileptic activity. The same research group also sought to characterize a rare condition called neuronal migration disorder, which is also known as subcortical band heterotopia and often characterized by epilepsy (Iannetti et al., 2011a). The disorder is a malformation of cortical development in which GM is bilaterally misplaced in WM parallel to the surface of the neocortex. In three patients, DTI data were analyzed via tractography (Mori et al., 2002) to reconstruct occipital and fronto-insular U-fibers. Eyes-closed resting state EEG recording showed spike and epileptic abnormalities in bilateral fronto-temporal and temporo-occipital regions, particularly on the left side. Tractography revealed a reduction and disorganization of subcortical U-fibers, particularly in the left fronto-insular region, and, in one patient, in the occipital region. Unfortunately, no subsequent correlation analysis was conducted. Yet, the results suggest that in the left hemisphere, the seizures arising from the heterotopic GM were accompanied by altered WM connectivity, leading to a functional isolation of the normotopic cortex with apoptotic processes.
Cociu et al. (2018) investigated aberrant neural information exchange in children with autism spectrum disorder. They estimated EEG sources both via ‘simple’ dipole fitting (Delorme et al., 2012) during eyes-open resting state. Functional connectivity was estimated between dipoles close to fMRI pre-localized regions including the precuneus, posterior cingulate cortex, left/right parietal cortex, superior frontal gyrus and medial prefrontal cortex, which all form part of the default mode network. Functional coupling based on various measures was estimated in various frequency bands between all pairs of sources. Volume, tract length and number of tracts were determined between the same pairs (see Table 4 for details). Cociu et al. (2018) could identify significant negative correlations between the phase locking value in the delta frequency band and tract length/volume between regions of the default mode network.
Babaeeghazvini et al. (2018) studied correlations between structural and functional connectivity and their association with bimanual coordination as a function of age. Sources were reconstructed with a focus on the beta frequency band (Van Veen et al., 1997) and unraveled significant contributions of bilateral primary motor cortex and dorsal premotor areas. From the resulting source signals, inter- and intra-hemispheric functional connectivity was estimated using the weighted phase-lag index. Kurtosis anisotropy values and the standard deviation of kurtosis (Poot et al., 2010) at the fiber tracts between the same atlas-based regions were determined (cf. Table 4). In older adults, phase-lag values between left/right dorsal premotor and left primary motor cortex were significantly correlated with KA values in bilateral primary motor cortices. Overall, older adults showed both increased functional connectivity and reduced structural connectivity for all connections when compared to younger adults. These results suggested a diminished structural connectivity to be associated with an increased functional one in older adults.
More recently, Hinault et al. (2020, 2021) studied the effects of age-related changes in the WM microstructural organization on dynamic functional coupling between brain regions during performance of an arithmetic verification task. They focused on the moment after a working memory cue for an arithmetic operation, the subsequent delay period, and the time around an arithmetic problem displayed on a screen. Hinault et al. (2020) estimated phase-locking values (Lachaux et al., 1999) between bilateral frontal-occipital fasciculi, superior longitudinal fasciculi, and the cingulum bundles. Later on, Hinault et al. (2021) extended the analysis to source reconstructed signals in the regions of the Desikan atlas (Desikan et al., 2006) to quantify whole-brain functional network organization using phase-locking values. Both studies performed DTI tractography between the same regions as used for functional coupling, however, the approach to assess structural-functional relationships differed. Hinault et al. (2020) performed a mediation analysis for the effect of task-relevant functional-structural couplings on behavioral performance, whereas Hinault et al. (2021) used graph theory to estimate individual structural clustering levels and their relationship to task-related functional networks. In the first study, they found a mediation effect of dynamic functional connectivity and WM microstructure in the tract connecting inferior frontal cortex and the occipital lobe over behavioral performance. In older adults, a relatively preserved WM microstructural organization was accompanied by earlier and greater frontoposterior functional coupling which together mediated lower interference effects on the arithmetic verification task. On the other hand, Hinault et al. (2021) found that lower structural clustering in older adults correlated with reduction in clustering and efficiency of task-related functional network in alpha and high-gamma frequency bands. Taking together, the results suggest that age-related changes in WM microstructure affect long-range dynamic functional coupling and stability of functional network.
Likewise recently, Handiru et al., 2021 investigated the graph-theoretical properties in functional connectivity estimated between EEG source signals in two groups of chronic TBI patients and controls during a balance perturbation task. They used the imaginary part of coherence in theta, alpha and beta frequency bands to measure the functional connectivity between ROIs. Graph-theoretical measures served to quantify global network properties. Higher FA and lower MD values were significantly associated with higher strength of functional connectivity in beta frequency band during a postural control task. The result is in line with study by Chu et al. (2015), who reported the association between structural connectivity and EEG source-based functional connectivity in higher frequency bands (beta and gamma); see above.
Muraskin et al. (2016) compared two groups of collegiate baseball players (experts) and novices (controls) searching for differences in both functional and structural connectivity. Participants performed a surrogate baseball pitch Go/No-Go task prior to an eyes-open resting state scan during which simultaneous fMRI-EEG and DTI data were collected. Using a cortical current density source model (He et al., 2011), alpha and beta power were estimated at source level in left and right supplementary motor areas (Muraskin et al., 2015). In addition, functional connectivity was estimated between alpha power from right supplementary motor area, as the seed region, and BOLD time series from source locations in non-supplementary motor area voxels (Muraskin et al., 2017), followed by deterministic tractography. Significant correlations were found between alpha power at the right supplementary motor area and the BOLD signal at left superior frontal gyrus and left insula. Correlations were negative in experts and positive in controls. There were also positive correlations in experts and negative ones in controls between alpha power at right supplementary motor area and BOLD at right middle temporal gyrus. And there was a negative correlation in experts (positive in controls) between beta power at right supplementary motor area and BOLD at left superior frontal gyrus. Moreover, experts displayed an increase in functional connectivity of alpha frequency between supplementary motor area and cerebellum. Compared to controls, experts exhibited a significantly larger number of structural connections (fiber tracts) between right superior frontal gyrus and left posterior cingulate, right inferior frontal gyrus and right cerebellum, and right precentral gyrus, and both left posterior cingulate and left insula. On the other hand, controls exhibited a significantly larger number of structural connections between right supplementary motor area and right inferior frontal gyrus and left superior frontal gyrus and left insula. Here, we would like to note that Muraskin et al. (2016) did not correct significant levels for multiple comparisons. We also note that Muraskin et al. (2016) failed to establish a direct structural connectivity between supplementary motor areas and the selected regions. Nonetheless, the observed functional relationships might be supported by indirect structural connections. In fact, Muraskin et al. (2016) suggested the functional connectivity relationship between alpha power in the supplementary motor area and the BOLD signal in the right cerebellum to be mediated by structural connections from right supplementary motor area to right inferior frontal gyrus, and then right inferior frontal gyrus to right cerebellum.
Steinmann et al. (2018) collected task-related EEG from healthy participants during a dichotic listening task to study the association between language lateralization and structural connectivity of interhemispheric auditory pathways, as well as gamma-band synchrony between bilateral auditory cortices. Two different consonant-vocal syllables were presented to each ear simultaneously and participants reported the best perceived syllable after each trial. EEG source reconstruction was performed (Pascual-Marqui, 2007) and functional connectivity was estimated as (lagged) phase synchronization in the gamma frequency band (30–100 Hz) between Heschl’s gyrus and posterior superior temporal gyrus (Pascual-Marqui et al., 1994). For the DTI, ROIs were chosen according to the ones used for functional connectivity, including Heschl’s gyrus, posterior superior temporal gyrus and the mid-sagittal mask of the corpus callosum. Probabilistic tractography served to extract inter-hemispheric auditory pathways by choosing right Heschl’s gyrus as seed mask and left Heschl’s gyrus as termination mask passing through the corpus callosum. The same procedure was applied to extract the tracts between left and right posterior superior temporal gyri. Mean FA values were determined for the obtained tracts. With this, Steinmann et al. (2018) found that increased FA values and increased gamma synchronization in inter-hemispheric auditory pathways between bilateral posterior superior temporal gyri were both related to a reduced leftward lateralization for language processing. However, the relationship between FA values of inter-hemispheric auditory pathways and lagged phase synchronization values in the gamma frequency band did not reach significance.
To investigate hand motor outcome in chronic stroke patients, Quandt et al. (2019) combined information of oscillatory changes during specific grasping movements and the microstructural organization of the corticospinal tract. Participants executed repetitive reaching and grasping movements with their affected hand under two conditions: (i) a pinch grip, where participants lifted a weight with their affected thumb and index finger; and (ii) a hand grip, where the weight was lifted with all fingers. EEG sources for primary motor cortex, ventral premotor cortex, and supplementary motor area were reconstructed (Van Veen et al., 1997). ROIs were pre-selected based on a previous fMRI study on hand grip in healthy older adults (Schulz et al., 2016). Spectral power was estimated in the theta, alpha and beta frequency bands during the pinch grip condition, whole mean FA values were determined for the left and right corticospinal tract from the mesencephalon to the cerebral peduncle. Linear regression revealed that beta power in the ipsilesional supplementary motor area and FA values of the corticospinal tract, on the same side, best explained residual motor function of the affected hand. The association between movement-related beta desynchronization in supplementary motor area and motor impairment suggests direct descending motor control from pyramidal neurons. The findings suggest that the microstructural organization of corticospinal tract determines the degree of the functional involvement of the supplementary motor area during motor performance in stroke.
The EEG source localization yields (virtual) brain activity at voxel level. When combined with dMRI one may estimate structural connectivity between the functionally active brain regions. This may reveal the underlying structural connectivity of the functional networks. For example, Cociu et al. (2018) found that structural connectivity agrees with resting state functional connectivity in the delta frequency band within the default mode network. EEG source localization also allows for estimating the regions with abnormal functional activity (e.g., epileptiform activity), which often agree with structural abnormalities as reflected in different dMRI outcome measures (Seifer et al., 2012; Hunold et al., 2014).
We reviewed a variety of studies that combined EEG with dMRI. Before discussing them, we would like to note that despite the considerable insights into the relationship between GM/WM microstructural organization and neural functioning, the combination of EEG and dMRI comes with many challenges, often involving defining details of the measurement procedure and the analysis. While there are several technical hurdles to take, one must realize that the major bottleneck in this field is that most studies are low-powered, sometimes covering only a handful of patients with a very specific phenotype. We highlighted this within the current review but realized that the generalizability of many findings remains limited and calls for more research. Yet, in the following we briefly recapitulate some of the insights gained from the here-reviewed studies and put them in a broader context of relating functional and structural properties of the brain.
With respect to studies using event-related designs, most of the findings can be explained by accounting for the conceptual differences in EEG outcome measures – latency vis-à-vis amplitude changes – and their relation to neural processing. In line with a mechanistic view (see Section “A Mechanistic View”), changes in the WM microstructural organization affect the rate of information transfer (e.g., visual and auditory information) between different brain regions. ERP latencies do address this information transfer directly. Hence, one may expect a close relationship between conduction delays and the structural properties of WM measured via dMRI (Cuypers et al., 1995; Kesselring, 1997). Apparently, a variation in WM microstructural organization is closely related to hemispheric timing differences during auditory or visual task performances. The Westerhausen et al. (2006) and Whitford et al. (2011a) studies confirmed this notion by showing a negative correlation between inter-hemispheric transmission time (difference between left and right P100 latencies at occipital electrodes) and MD values in the posterior corpus callosum and FA values in the callosal fibers. Occipital P100 peak latencies are related to primary visual information processing situated in the extrastriate cortex (Gomez Gonzalez et al., 1994; Di Russo et al., 2005). Interhemispheric connections between regions of the striate cortex are few and far between. As such, one may consider the P100 as the first visual processing step within the ipsilateral hemisphere.
Evstigneev et al. (2013) reported a negative correlation between decreased FA and increased latency of the P300 peak in the anterior quadrant of the epileptogenic hemisphere. Earlier ERP studies revealed that the P300 generation involves interhemispheric integration of sensory information (Knight et al., 1989; Yamaguchi and Knight, 1991, 1992). That is, P300 appears to be related to structural connectivity between the two cerebral hemispheres (Caminiti and Sbriccoli, 1985; Pandya and Seltzer, 1986). If true, the very fact that the corpus callosum is critical for interhemispheric transmission efficacy (Iacoboni and Zaidel, 1995; Nowicka et al., 1996) may explain why the P300 latency depends on the microstructural organization of the corpus callosum. The negative correlations between reduced hemispheric N1 latency differences and increased FA values in the posterior callosal third reported by Friedrich et al. (2017) support this interpretation: microstructural properties of the corpus callosum modulate the timing differences between hemispheres.
Changes in WM microstructural organization also affect amplitude of ERP components. Higher ERP amplitudes appear to be related to WM microstructure, as, e.g., shown by the positive correlation between N2 amplitudes and FA in the superior longitudinal fascicle linking the parietal and frontal cortices (Gao et al., 2017), or by a positive correlation between the (strengths of the) ERN amplitude and higher FA values in the posterior part of the left cingulum bundle reported by Westlye et al. (2009).
In contrast to the studies on event-related potentials, the findings on spectral EEG content are more diverse, as we found both positive and negative correlations, albeit not always significant. Slow wave power changes were often investigated in the context of neuropathology to identify associations between abnormal functional activity (in delta and theta but also low-alpha frequency bands) and structural abnormalities underlying a specific disorder. All studies claimed a relationship between neurodegeneration and spectral power, indicating that in combination with dMRI the spectral power may serve to identify structural disorder. For instance, the observed reduction of power across cortical areas which coincided with elevated MD in the thalamus and the cingulate cortex in a fatal familial insomnia patient (Gemignani et al., 2012) supports the importance of the thalamus in the generation of low-frequency events, at least during sleep (Contreras et al., 1996; Crunelli and Hughes, 2010). Cortico-thalamocortical cycles are known to relate to changes in alpha frequency (Contreras et al., 1996; Crunelli and Hughes, 2010). Interestingly, such associations also extend to even higher frequency bands. An example is given by Inoue et al. (2012), where DWI revealed anatomical connections between the lesioned thalamic site and premotor cortex, primary motor cortex and primary sensory area. Beta power increased in frontal, central and centroparietal electrodes related to the hand area of the sensorimotor cortex. The lesioned thalamic nuclei might thus be responsible for the abnormally increased beta activity in the sensorimotor cortex, as well as excessive cortical inhibition.
Valdés-Hernández et al. (2010) reported positive correlations between the alpha peak frequency and FA values in the posterior and superior corona radiate, and in the isthmus and tapetum of the corpus callosum. However, they also reported negative correlations in the splenium and the inferior part of the corpus callosum. The different sign in the correlation between alpha peak frequency and FA in the corpus callosum might be due to the dual inhibitory and excitatory role of the latter (Bloom and Hynd, 2005). Yet, it might also reflect a negative effect of fiber density on conduction velocity (Reutskiy et al., 2003) given that the splenium exhibits a high fiber density (Barazany et al., 2009). Either way, the elevated degree of FA values probably indicates a highly organized directionality of fiber bundles and axon density in the corona radiate, splenium of the corpus callosum, and major forceps (Mädler et al., 2008; Friedrich et al., 2020). Hence, the relationship between the alpha peak frequency and FA value underscores the importance of WM architecture for the emergence of alpha oscillations in the ROIs, at least in some cases.
Scrascia et al. (2014) reported strong correlations between decreased beta power in frontopolar and frontal regions and decreased FA values in frontal WM and anterior regions of the corpus callosum in patients with mild cognitive impairment and Alzheimer’s disease. The latter are indicative for early fronto-temporal structural disconnections due to the progression of Alzheimer’s disease (Delatour et al., 2004). Previous studies (Jeong, 2004; Babiloni et al., 2006) already reported a shift of the power spectrum to lower frequencies and a decrease in coherence of higher frequencies as the hallmark of electrophysiological abnormalities and a reflection of early and progressive structural damage.
The more recent studies on functional connectivity largely confirm the findings on local power changes. They demonstrate a close relationship between structural and functional connectivity both in resting state and during task execution. In mild cognitive impairment patients, frontal alpha coherence and FA values were positively correlated in frontal fiber tracts (Teipel et al., 2009), while in patients with mild traumatic brain injury a likewise positive correlation was found between beta phase synchronization in frontal regions and FA values in the anterior corpus callosum and in the left anterior thalamic radiation (Sponheim et al., 2011). The latter suggests a weak association with frontal function due to damaged WM tracts that is also manifested in a positive correlation between reduced phase synchronization at low gamma frequencies and reduced FA values in the right inferior cerebellar peduncle (Wang et al., 2017). This supports the role of gamma frequency in the integration of sensory processing and sensory-motor coordination (Womelsdorf and Fries, 2006; Senkowski et al., 2008). Increased conflict-induced theta synchronization between medial frontal and posterior parietal cortices was negatively correlated with reduced AD values in the genu, the splenium, the body of the corpus callosum, and the bilateral anterior and superior corona radiate (Liu et al., 2017). This may reflect a compensatory increase in functional connectivity due to a reduced microstructural organization (de Kwaasteniet et al., 2013). Recall here that an increased axonal diameter increases the conduction velocity of action potentials and this correlates positively with AD, referring to the magnitude of diffusion parallel to fiber tracts (Takagi et al., 2009).
While in many studies the EEG source localization merely served to select seed regions for DTI tractography (Chu et al., 2015; Muraskin et al., 2016; Cociu et al., 2018), it has also been applied to identify a direct relationship between current densities of different frequency bands and structural properties (Arrubla et al., 2017). The combination of EEG source localization with dMRI has been particularly fruitful in studies on pathology. They revealed the location with abnormal functional activity to be very close to the location where abnormal structural properties are reported. By this, Seifer et al. (2012) could identify epileptogenic zones to be larger than the visible lesion identified by MRI and Hunold et al. (2014) could conjecture that epileptiform activity in patients with tuberous sclerosis complex has its origin around the tubers.
Compared to fMRI, EEG has several advantages which may help for better understanding the relationship between structural and functional properties. First, EEG records electrophysiological activity at a high temporal resolution that can be crucial for monitoring rapid, functional changes. Second, EEG does not necessarily have to be recorded in a lab-setting. In fact, some current EEG systems are portable, which allows for recording functional brain activity during daily tasks (Bruijn et al., 2015; Park et al., 2015). Yet, it appears that many EEG and fMRI studies do converge when it comes to source localization and estimating functional connectivity. For example, EEG (Taylor et al., 2007; Cohen, 2011) and fMRI (Van Veen and Carter, 2002) studies agree when studying the involvement of anterior cingulate cortex in error processing and generation of event-related negativity. A similar agreement between EEG (Miltner et al., 2003; Debener et al., 2005; Wang et al., 2005; Cohen et al., 2008; Vocat et al., 2008) and fMRI (Van Veen and Carter, 2002; Mathalon et al., 2003) is visible when investigating pre-supplementary motor area or anterior cingulate cortex as the source of medial frontal theta activity. And, this extends to studies on the default mode network (Cannon et al., 2011) and resting state network (Samogin et al., 2020), where EEG coherence turns out to be consistent with (the spectral power of) BOLD (Ko et al., 2011). Both modalities have shown similar, age-related increases in functional connectivity (Solesio-Jofre et al., 2014; Babaeeghazvini et al., 2018). With respect to the link between functional and structural properties, both EEG (Westlye et al., 2009; Gao et al., 2017) and fMRI (Olesen et al., 2003; Seghier et al., 2004; Persson et al., 2006; Schlősser et al., 2007) studies show correlations between dMRI measures and functional activity during similar types of cognitive performance.
Increasing the resolution of data acquisition may lead to deeper insights into how functional and structural properties of the brain are coupled. Dense EEG arrays (i.e., 128 or even 256 electrodes) can improve source localization by increasing the signal-to-noise ratio to detect functional networks (Liu et al., 2018), potentially offering more reliable results about functional connectivity, if corrected for volume conduction effects. As for dMRI, high-angular multi-shell diffusion acquisitions may improve sensitivity and directional specificity. Such leveraging of multiple shells (i.e., b-values) with large numbers of diffusion directions can elicit differential tissue responses that are useful to model in greater detail WM microstructural organization. Interestingly, the impact of in-scanner motion on multi-shell measures of microstructure appears to be reduced, at least on a global level (Pines et al., 2019).
In addition, more advanced methods of analysis can greatly improve the accuracy of outcome measures. For example, even though the DTI model has clinical relevance, it is not suitable for complex fiber configurations, such as crossing and ‘kissing’ fibers (Jeurissen et al., 2013). Multi-compartment models like the composite hindered and restricted model of diffusion (Assaf and Basser, 2005) and the neurite orientation dispersion and density imaging model (Zhang et al., 2012), provide greater specificity when relating the diffusion signals to underlying WM microstructure and to functional connectivity (Horowitz et al., 2015; Deligianni et al., 2016). Furthermore, Jelescu et al. (2020) discussed different biophysical models for diffusion in brain tissue and their implications for clinical use. In recent years, WM tractography has also been improved, e.g., in better resolving multiple fiber crossings. Constrained spherical deconvolution (Tournier et al., 2004) better estimates fiber orientation distribution, and has led to the development of fiber bundle specific measures (Raffelt et al., 2017), such as apparent fiber density. The latter, so-called fixel-based analysis (FBA), can provide information about fiber density, fiber cross section and a combination of both measures.
In very recent years, an increasing number of studies extended the combination of encephalographic assessments and diffusion-based imaging with electrically or magnetically stimulating. This includes transcranial magnetic stimulation, direct current stimulation as well as deep brain stimulation. This field is rapidly growing and certainly worthwhile monitoring. For the sake of legibility, we provide a glance on this literature as a Supplementary Material – a glance because we cannot guarantee completeness.
A review entitled “Brain structural and functional connectivity” cannot ignore the developments on network assessments using graph theoretical approaches. The field is vast, and we consider a proper overview to be beyond the scope of our review. We summarized two recent studies employing graph theory (Handiru et al., 2021; Hinault et al., 2021), which has become particularly popular for quantifying connectivity (He and Evans, 2010; Sporns, 2011; Alexander-Bloch et al., 2013). Graph theory progressed toward the assessment of pathological changes, especially in functional networks (Bassett and Bullmore, 2009; Fornito et al., 2015). More recently, first steps have been taken to integrate two (or more) modalities (Guye et al., 2010; Glomb et al., 2020; Wirsich et al., 2021) also using multilayer networks (Boccaletti et al., 2014; Muldoon and Bassett, 2016; Lacasa et al., 2021). In fact, several studies that matched our original literature search criteria already followed this route but have been excluded here because they solely address the methodological advance. As such it seems just a matter of time that studies combining EEG with dMRI in ‘real’ experiments will capitalize more on the strengths of these powerful techniques.
Last but not least we would like to anticipate our plea for standardizing approaches and methods (see our general conclusions below). One step toward standardization is to provide open access to both data and analysis. Given the very nature of the topic under research, privacy-related issues may limit availability of data. Yet, there are quite recent initiatives to provide openly accessible data sets, like the Healthy Brain Network (HBN) (Alexander et al., 2017), OpenNeuro1, Brain Imaging Data Structure (BIDS)2 or John Richard’s neurodevelopmental MRI database3. This list could readily be extended, but again we consider digging deeper into these exciting developments beyond the scope of our current review. When it comes to analysis tools, the list is even longer, ranging from EEGLAB (Delorme and Makeig, 2004), Fieldtrip (Oostenveld et al., 2011), Statistical Parametric Mapping (Litvak et al., 2011), Brainstorm (Tadel et al., 2011), MNE-python (Gramfort et al., 2013), and NUTMEG (Hinkley et al., 2020) to ExploreDTI (Leemans et al., 2009), FMRIB Software Library (FSL) (Smith et al., 2004; Woolrich et al., 2009), and MRtrix (Tournier et al., 2019). We clearly advocate their use as they seem to converge in validity and reliability; see, e.g., (Jaiswal et al., 2020).
We reviewed various studies that combined EEG and dMRI assessments to relate functional activity with structural connectivity. The variety of techniques, methods and outcomes renders comparison a challenge, especially when it comes to the additive value of combining EEG with dMRI. Yet, the different ERP analyses revealed clear associations with dMRI measures. Apparently, the speed and strength of broadcasting between distant brain regions quantified by, e.g., ERP latencies and amplitudes can largely express the WM microstructural organization. This can be expected when adopting a simple mechanistic standpoint, i.e., that an increased WM microstructural organization and/or structural connectivity strength ‘simply’ facilitates neuronal information transfer. The EEG’s spectral power and synchronization appeared less sensitive unless used to assess the effects of neurodegenerative diseases. Nonetheless, when combined with dMRI, properties of the WM microstructural organization may eventually yield proper biomarkers for functional decline accompanying structural changes. Yet, the diversity of findings requires a very careful interpretation of the results and highlights the need to standardize EEG analysis. This is certainly true when searching for a more general relationship between functional and structural characteristics of the human brain, let alone when aiming for employing EEG-dMRI co-registration in the clinic.
PB and AD designed the study and reviewed all the included manuscript. LR-D reviewed in particular the EEG studies. JG and SS focussed on the dMRI studies. All authors wrote the manuscript.
The authors declare that the research was conducted in the absence of any commercial or financial relationships that could be construed as a potential conflict of interest.
All claims expressed in this article are solely those of the authors and do not necessarily represent those of their affiliated organizations, or those of the publisher, the editors and the reviewers. Any product that may be evaluated in this article, or claim that may be made by its manufacturer, is not guaranteed or endorsed by the publisher.
This work was part of the Move−Age joint doctorate program, which is funded by the European Commission as part of the Erasmus Mundus programme with grant number: 2014–0691/001–001–EMJD. It also received financial support from the Research Foundation – Flanders Research Grant (G089818N) and the Excellence of Science grant (EOS, 30446199, MEMODYN), a C1 grant from the KU Leuven Research Fund (C16/15/070), a Science Foundation Ireland grant (18/IF/6272), and from the European Union’s Horizon 2020 Research and Innovation Programme under the Marie Curie-Skłodowska grant agreement No. 893823. JG received finanical support via a fellowship from the Research Foundation Flanders (#12G3919N).
We would like to thank John. F. Stins for commenting on and proofreading the manuscript.
The Supplementary Material for this article can be found online at: https://www.frontiersin.org/articles/10.3389/fnhum.2021.721206/full#supplementary-material
Alexander, L. M., Escalera, J., Ai, L., Andreotti, C., Febre, K., Mangone, A., et al. (2017). An open resource for transdiagnostic research in pediatric mental health and learning disorders. Sci. Data 4:170181. doi: 10.1038/sdata.2017.181
Alexander-Bloch, A., Giedd, J. N., and Bullmore, E. (2013). Imaging structural co-variance between human brain regions. Nat. Rev. Neurosci. 14, 322–336. doi: 10.1038/nrn3465
Arrubla, J., Farrher, E., Strippelmann, J., Tse, D. H. Y., Grinberg, F., Shah, N. J., et al. (2017). Microstructural and functional correlates of glutamate concentration in the posterior cingulate cortex. J. Neurosci. Res. 95, 1796–1808. doi: 10.1002/jnr.24010
Assaf, Y., and Basser, P. J. (2005). Composite hindered and restricted model of diffusion (CHARMED) MR imaging of the human brain. NeuroImage 27, 48–58. doi: 10.1016/j.neuroimage.2005.03.042
Assaf, Y., Freidlin, R. Z., Rohde, G. K., and Basser, P. J. (2004). New modeling and experimental framework to characterize hindered and restricted water diffusion in brain white matter. Magn. Reson. Med. 52, 965–978. doi: 10.1002/mrm.20274
Aviyente, S., Bernat, E. M., Evans, W. S., and Sponheim, S. R. (2011). A phase synchrony measure for quantifying dynamic functional integration in the brain. Hum. Brain Mapp. 32, 80–93. doi: 10.1002/hbm.21000
Babaeeghazvini, P., Rueda-Delgado, L. M., Zivari Adab, H., Gooijers, J., Swinnen, S., and Daffertshofer, A. (2018). A combined diffusion-weighted and electroencephalography study on age-related differences in connectivity in the motor network during bimanual performance. Hum. Brain Mapp. 40, 1799–1813. doi: 10.1002/hbm.24491
Babiloni, C., Binetti, G., Cassetta, E., Dal Forno, G., Del Percio, C., Ferreri, F., et al. (2006). Sources of cortical rhythms change as a function of cognitive impairment in pathological aging: a multicenter study. Clin. Neurophysiol. 117, 252–268. doi: 10.1016/j.clinph.2005.09.019
Barazany, D., Basser, P. J., and Assaf, Y. (2009). In vivo measurement of axon diameter distribution in the corpus callosum of rat brain. Brain 132, 1210–1220. doi: 10.1093/brain/awp042
Barch, D. M., Berman, M. G., Engle, R., Jones, J. H., Jonides, J., MacDonald, A., et al. (2008). CNTRICS final task selection: working memory. Schizophr. Bull. 35, 136–152. doi: 10.1093/schbul/sbn153
Basser, P. J. (1995). Inferring microstructural features and the physiological state of tissues from diffusion-weighted images. NMR Biomed. 8, 333–344.
Bassett, D. S., and Bullmore, E. T. (2009). Human brain networks in health and disease. Curr. Opin. Neurol. 22, 340–347. doi: 10.1097/WCO.0b013e32832d93dd
Belger, A., Yucel, G. H., and Donkers, F. C. (2012). In search of psychosis biomarkers in high-risk populations: is the mismatch negativity the one we’ve been waiting for? Biol. Psychiatry 71, 94–95. doi: 10.1016/j.biopsych.2011.11.009
Bennett, I. J., and Rypma, B. (2013). Advances in functional neuroanatomy: a review of combined dti and fmri studies in healthy younger and older adults. Neurosci. Biobehav. Rev. 37, 1201–1210. doi: 10.1016/j.neubiorev.2013.04.008
Berger, H. (1929). Über das Elektrenkephalogramm des Menschen. Arch. Psychiatr. Nervenkr. 87, 527–570. doi: 10.1007/BF01797193
Bernardi, G., Cecchetti, L., Siclari, F., Buchmann, A., Yu, X., Handjaras, G., et al. (2016). Sleep reverts changes in human gray and white matter caused by wake-dependent training. NeuroImage 129, 367–377. doi: 10.1016/j.neuroimage.2016.01.020
Berti, S. (2013). The role of auditory transient and deviance processing in distraction of task performance: a combined behavioral and event-related brain potential study. Front. Hum. Neurosci. 7:352. doi: 10.3389/fnhum.2013.00352
Bloom, J. S., and Hynd, G. W. (2005). The role of the corpus callosum in interhemispheric transfer of information: excitation or inhibition? Neuropsychol. Rev. 15, 59–71. doi: 10.1007/s11065-005-6252-y
Boccaletti, S., Bianconi, G., Criado, R., del Genio, C. I., ómez-Gardeñes, J. G., Romance, M., et al. (2014). The structure and dynamics of multilayer networks. Phys. Rep. 544, 1–122. doi: 10.1016/j.physrep.2014.07.001
Brass, M., and von Cramon, D. Y. (2004). Selection for cognitive control: a functional magnetic resonance imaging study on the selection of task-relevant information. J. Neurosci. 24, 8847–8852.
Bruijn, S. M., Van Dieën, J. H., and Daffertshofer, A. (2015). Beta activity in the premotor cortex is increased during stabilized as compared to normal walking. Front. Hum. Neurosci. 9:593. doi: 10.3389/fnhum.2015.00593
Bruno, M. A., Fernández-Espejo, D., Lehembre, R., Tshibanda, L., Vanhaudenhuyse, A., Gosseries, O., et al. (2011). Multimodal neuroimaging in patients with disorders of consciousness showing functional hemispherectomy. Progr. Brain Res. 193, 323–333.
Bunge, S. A., Hazeltine, E., Scanlon, M. D., Rosen, A. C., and Gabrieli, J. D. E. (2002). Dissociable Contributions of Prefrontal and Parietal Cortices to Response Selection. NeuroImage 17, 1562–1571. doi: 10.1006/nimg.2002.1252
Calixto, M., Elena, C., Pedro, V., Trinidad, V., Francis, L., Jorge, B., et al. (2004). Assessing Acute Middle Cerebral Artery Ischemic Stroke by Quantitative Electric Tomography. Clin. EEG Neurosci. 35, 116–124. doi: 10.1177/155005940403500303
Caminiti, R., and Sbriccoli, A. (1985). The callosal system of the superior parietal lobule in the monkey. J. Comp. Neurol. 237, 85–99. doi: 10.1002/cne.902370107
Cannon, R., Kerson, C., and Hampshire, A. (2011). sLORETA and fMRI Detection of Medial Prefrontal Default Network Anomalies in Adult ADHD. J. Neurother. 15, 358–373. doi: 10.1080/10874208.2011.623093
Cavanagh, J. F., Rieger, R. E., Wilson, J. K., Gill, D., Fullerton, L., Brandt, E., et al. (2019). Joint analysis of frontal theta synchrony and white matter following mild traumatic brain injury. Brain Imag. Behav. 14, 2210–2223. doi: 10.1007/s11682-019-00171-y
Chu, C. J., Tanaka, N., Diaz, J., Edlowa, B. L., Wub, O., Hämäläinenb, M., et al. (2015). EEG functional connectivity is partially predicted by underlying white matter connectivity. NeuroImage 108, 23–33.
Clayson, P. E., and Larson, M. J. (2013). Psychometric properties of conflict monitoring and conflict adaptation indices: response time and conflict N2 event-related potentials. Psychophysiology 50, 1209–1219. doi: 10.1111/psyp.12138
Cociu, B. A., Das, S., Billeci, L., Jamal, W., Maharatna, K., Calderoni, S., et al. (2018). Multimodal functional and structural brain connectivity analysis in Autism: a preliminary integrated approach with EEG, fMRI, and DTI. IEEE Trans. Cogn. Dev. Syst. 10, 213–226. doi: 10.1109/TCDS.2017.2680408
Cohen, M. X. (2011). Error-related medial frontal theta activity predicts cingulate-related structural connectivity. NeuroImage 55, 1373–1383. doi: 10.1016/j.neuroimage.2010.12.072
Cohen, M. X., Ridderinkhof, K. R., Haupt, S., Elger, C. E., and Fell, J. (2008). Medial frontal cortex and response conflict: evidence from human intracranial EEG and medial frontal cortex lesion. Brain Res. 1238, 127–142. doi: 10.1016/j.brainres.2008.07.114
Colrain, I. M., Sullivan, E. V., Ford, J. M., Mathalon, D. H., McPherson, S. L., Roach, B. J., et al. (2011). Frontally mediated inhibitory processing and white matter microstructure: age and alcoholism effects. Psychopharmacology (Berl) 213, 669–679. doi: 10.1007/s00213-010-2073-7
Contreras, D., Destexhe, A., Sejnowski, T. J., and Steriade, M. (1996). Control of spatiotemporal coherence of a thalamic oscillation by corticothalamic feedback. Science 274, 771–774.
Crapse, T., and Sommer, M. (2008). Corollary discharge circuits in the primate brain. Current Opinion in Neurobiology. Neurobiology 18, 552–557.
Crunelli, V., and Hughes, S. W. (2010). The slow (<1 Hz) rhythm of non-REM sleep: a dialogue between three cardinal oscillators. Nat. Neurosci. 13, 9–17. doi: 10.1038/nn.2445
Cuypers, M. H., Dickson, K., Pinckers, A. J., Thijssen, J. M., and Hommes, O. R. (1995). Discriminative power of visual evoked potential characteristics in multiple sclerosis. Doc. Ophthalmol. 90, 247–257. doi: 10.1007/bf01203860
Damoiseaux, J. S., and Greicius, M. D. (2009). Greater than the sum of its parts: a review of studies combining structural connectivity and resting-state functional connectivity. Brain Struct. Funct. 213, 525–533. doi: 10.1007/s00429-009-0208-6
de Kwaasteniet, B., Ruhe, E., Caan, M., Rive, M., Olabarriaga, S., Groefsema, M., et al. (2013). Relation Between Structural and Functional Connectivity in Major Depressive Disorder. Biol. Psychiatry 74, 40–47. doi: 10.1016/j.biopsych.2012.12.024
Debener, S., Ullsperger, M., Siegel, M., Fiehler, K., von Cramon, D. Y., and Engel, A. K. (2005). Trial-by-trial coupling of concurrent electroencephalogram and functional magnetic resonance imaging identifies the dynamics of performance monitoring. J. Neurosci. 25, 11730–11737. doi: 10.1523/JNEUROSCI.3286-05.2005
Deco, G., Jirsa, V. K., and McIntosh, A. R. (2011). Emerging concepts for the dynamical organization of resting-state activity in the brain. Nat. Rev. Neurosci. 12, 43–56. doi: 10.1038/nrn2961
Delatour, B., Blanchard, V., Pradier, L., and Duyckaerts, C. (2004). Alzheimer pathology disorganizes cortico-cortical circuitry: direct evidence from a transgenic animal model. Neurobiol. Dis. 16, 41–47. doi: 10.1016/j.nbd.2004.01.008
Deligianni, F., Carmichael, D. W., Zhang, G. H., Clark, C. A., and Clayden, J. D. (2016). NODDI and Tensor-Based Microstructural Indices as Predictors of Functional Connectivity. PLoS One 11:e0153404. doi: 10.1371/journal.pone.0153404
Delorme, A., and Makeig, S. (2004). EEGLAB: an open source toolbox for analysis of single-trial EEG dynamics including independent component analysis. J. Neurosci. Methods 134, 9–21. doi: 10.1016/j.jneumeth.2003.10.009
Delorme, A., Palmer, J., Onton, J., Oostenveld, R., and Makeig, S. (2012). Independent EEG sources are dipolar. PLoS One 7:e30135. doi: 10.1371/journal.pone.0030135
Desikan, R. S., Ségonne, F., Fischl, B., Quinn, B. T., Dickerson, B. C., Blacker, D., et al. (2006). An automated labeling system for subdividing the human cerebral cortex on MRI scans into gyral based regions of interest. NeuroImage 31, 968–980. doi: 10.1016/j.neuroimage.2006.01.021
Di Russo, F., Pitzalis, S., Spitoni, G., Aprile, T., Patria, F., Spinelli, D., et al. (2005). Identification of the neural sources of the pattern-reversal VEP. NeuroImage 24, 874–886. doi: 10.1016/j.neuroimage.2004.09.029
Duru, A. D., Duru, D. G., Yumerhodzha, S., and Bebek, N. (2016). Analysis of correlation between white matter changes and functional responses in thalamic stroke: a DTI & EEG study. Brain Imag. Behav. 10, 424–436.
Duthoo, W., Abrahamse, E. L., Braem, S., Boehler, C. N., and Notebaert, W. (2014). The Congruency sequence effect 3.0: a critical test of conflict adaptation. PLoS One 9:e110462. doi: 10.1371/journal.pone.0110462
Eriksen, B. A., and Eriksen, C. W. (1974). Effects of noise letters upon the identification of a target letter in a nonsearch task. Percept. Psychophys. 16, 143–149.
Evstigneev, V. V., Kistsen, V. V. I, Bulaev, V., and Sakovich, R. A. (2013). The effect of structural white matter abnormalities on the clinical course of epilepsy. Adv. Clin. Exp. Med. 22, 529–537.
Ford, J. M., Gray, M., Faustman, W. O., Roach, B. J., and Mathalon, D. H. (2007). Dissecting corollary discharge dysfunction in schizophrenia. Psychophysiology 44, 522–529. doi: 10.1111/j.1469-8986.2007.00533.x
Ford, J. M., Mathalon, D. H., Heinks, T., Kalba, S., Faustman, W. O., and Roth, W. T. (2001). Neurophysiological evidence of corollary discharge dysfunction in schizophrenia. Am. J. Psychiatry 158, 2069–2071. doi: 10.1176/appi.ajp.158.12.2069
Fornito, A., Zalesky, A., and Breakspear, M. (2015). The connectomics of brain disorders. Nat. Rev. Neurosci. 16, 159–172. doi: 10.1038/nrn3901
Friedrich, P., Fraenz, C., Schlűter, C., Ocklenburg, S., Ma̋dler, B., Gűntűrkűn, O., et al. (2020). The relationship between axon density, myelination, and fractional anisotropy in the human corpus callosum. Cereb. Cortex 30, 2042–2056. doi: 10.1093/cercor/bhz221
Friedrich, P., Ocklenburg, S., Heins, N., Schluter, C., Fraenz, C., Beste, C., et al. (2017). Callosal microstructure affects the timing of electrophysiological left-right differences. NeuroImage 163, 310–318. doi: 10.1016/j.neuroimage.2017.09.048
Gao, S., Liu, P., Guo, J., Zhu, Y., Liu, P., Sun, J., et al. (2017). White matter microstructure within the superior longitudinal fasciculus modulates the degree of response conflict indexed by N2 in healthy adults. Brain Res. 1676, 1–8. doi: 10.1016/j.brainres.2017.09.008
Gehring, W. J., Goss, B., Coles, M. G. H., Meyer, D. E., and Donchin, E. (1993). A neural system for error detection and compensation. Psychol. Sci. 4, 385–390.
Gemignani, A., Laurino, M., Provini, F., Piarulli, A., Barletta, G., d’Ascanio, P., et al. (2012). Thalamic contribution to Sleep Slow Oscillation features in humans: a single case cross sectional EEG study in Fatal Familial Insomnia. Sleep Med. 13, 946–952. doi: 10.1016/j.sleep.2012.03.007
Glomb, K., Mullier, E., Carboni, M., Rubega, M., Iannotti, G., Tourbier, S., et al. (2020). Using structural connectivity to augment community structure in EEG functional connectivity. Netw. Neurosci. 4, 761–787. doi: 10.1162/netn_a_00147
Gomez Gonzalez, C. M., Clark, V. P., Fan, S., Luck, S. J., and Hillyard, S. A. (1994). Sources of attention-sensitive visual event-related potentials. Brain Topogr. 7, 41–51. doi: 10.1007/bf01184836
Gramfort, A., Luessi, M., Larson, E., Engemann, D. A., Strohmeier, D., Brodbeck, C., et al. (2013). MEG and EEG data analysis with MNE-Python. Front. Neurosci. 7:267. doi: 10.3389/fnins.2013.00267
Guye, M., Bettus, G., Bartolomei, F., and Cozzone, P. J. (2010). Graph theoretical analysis of structural and functional connectivity MRI in normal and pathological brain networks. Magn. Reson. Mater. Phys. Biol. Med. 23, 409–421. doi: 10.1007/s10334-010-0205-z
Hamalainen, M. S., and Sarvas, J. (1989). Realistic conductivity geometry model of the human head for interpretation of neuromagnetic data. IEEE Trans. Biomed. Eng. 36, 165–171. doi: 10.1109/10.16463
Handiru, V. S., Alivar, A., Hoxha, A., Saleh, S., Suviseshamuthu, E. S., Yue, G. H., et al. (2021). Graph-theoretical analysis of EEG functional connectivity during balance perturbation in traumatic brain injury: a pilot study. Hum. Brain Mapp. 42, 4427–4447. doi: 10.1002/hbm.25554
He, B., Dai, Y., Astolfi, L., Babiloni, F., Yuan, H., and Yang, L. (2011). eConnectome: a MATLAB toolbox for mapping and imaging of brain functional connectivity. J. Neurosci. Methods 195, 261–269. doi: 10.1016/j.jneumeth.2010.11.015
He, Y., and Evans, A. (2010). Graph theoretical modeling of brain connectivity. Curr. Opin. Neurol. 23, 341–350. doi: 10.1097/WCO.0b013e32833aa567
Herrmann, C. S., and Knight, R. T. (2001). Mechanisms of human attention: event-related potentials and oscillations. Neurosci. Biobehav. Rev. 25, 465–476.
Herrmann, M. J., Rommler, J., Ehlis, A. C., Heidrich, A., and Fallgatter, A. J. (2004). Source localization (LORETA) of the error-related-negativity (ERN/Ne) and positivity (Pe). Brain Res. Cogn. Brain Res. 20, 294–299. doi: 10.1016/j.cogbrainres.2004.02.013
Hinault, T., Kraut, M., Bakker, A., Dagher, A., and Courtney, S. M. (2020). Disrupted Neural Synchrony Mediates the Relationship between White Matter Integrity and Cognitive Performance in Older Adults. Cereb. Cortex 30, 5570–5582. doi: 10.1093/cercor/bhaa141
Hinault, T., Mijalkov, M., Pereira, J. B., Volpe, G., Bakke, A., and Courtney, S. M. (2021). Age-related differences in network structure and dynamic synchrony of cognitive control. NeuroImage 236:118070. doi: 10.1016/j.neuroimage.2021.118070
Hinkley, L. B. N., Dale, C. L., Cai, C., Zumer, J., Dalal, S., Findlay, A., et al. (2020). NUTMEG: open source software for M/EEG source reconstruction. Front. Neurosci. 14:710. doi: 10.3389/fnins.2020.00710
Honey, C. J., Sporns, O., Cammoun, L., Gigandet, X., Thiran, J. P., Meuli, R., et al. (2009). Predicting human resting-state functional connectivity from structural connectivity. Proc. Natl. Acad. Sci. U. S. A. 106, 2035–2040. doi: 10.1073/pnas.0811168106
Honey, C. J., Thivierge, J. P., and Sporns, O. (2010). Can structure predict function in the human brain? NeuroImage 52, 766–776.
Horowitz, A., Barazany, D., Tavor, I., Bernstein, M., Yovel, G., and Assaf, Y. (2015). In vivo correlation between axon diameter and conduction velocity in the human brain. Brain Struct. Funct. 220, 1777–1788. doi: 10.1007/s00429-014-0871-0
Horváth, J., Winkler, I., and Bendixen, A. (2008). Do N1/MMN, P3a, and RON form a strongly coupled chain reflecting the three stages of auditory distraction? Biol. Psychol. 79, 139–147. doi: 10.1016/j.biopsycho.2008.04.001
Hunold, A., Haueisen, J., Ahtam, B., Doshi, C., Harini, C., Camposano, S., et al. (2014). Localization of the epileptogenic foci in tuberous sclerosis complex: a pediatric case report. Front. Hum. Neurosci. 8:175. doi: 10.3389/fnhum.2014.00175
Iacoboni, M., and Zaidel, E. (1995). Channels of the corpus callosum. Evidence from simple reaction times to lateralized flashes in the normal and the split brain. Brain 118, 779–788. doi: 10.1093/brain/118.3.779
Iannetti, P., Papetti, L., Nicita, F., Castronovo, A., Ursitti, F., Parisi, P., et al. (2011b). Developmental anomalies of the medial septal area: possible implication for limbic epileptogenesis. Childs Nerv. Syst. 27, 765–770. doi: 10.1007/s00381-010-1322-8
Iannetti, P., Nicita, F., Spalice, A., Parisi, P., Papetti, L., and Verrotti, A. (2011a). Fiber tractography assessment in double cortex syndrome. Childs Nerv. Syst. 27, 1197–1202. doi: 10.1007/s00381-011-1491-0
Inoue, M., Kojima, Y., Mima, T., Sawamoto, N., Matsuhashi, M., Fumuro, T., et al. (2012). Pathophysiology of unilateral asterixis due to thalamic lesion. Clin. Neurophysiol. 123, 1858–1864.
Jaiswal, A., Nenonen, J., Stenroos, M., Gramfort, A., Dalal, S. S., Westner, B. U., et al. (2020). Comparison of beamformer implementations for MEG source localization. NeuroImage 216:116797. doi: 10.1016/j.neuroimage.2020.116797
Jann, K., Dierks, T., Boesch, C., Kottlow, M., Strik, W., and Koenig, T. (2009). BOLD correlates of EEG alpha phase-locking and the fMRI default mode network. NeuroImage 45, 903–916. doi: 10.1016/j.neuroimage.2009.01.001
Jann, K., Federspiel, A., Giezendanner, S., Andreotti, J., Kottlow, M., Dierks, T., et al. (2012). Linking brain connectivity across different time scales with electroencephalogram, functional magnetic resonance imaging, and diffusion tensor imaging. Brain Connect. 2, 11–20. doi: 10.1089/brain.2011.0063
Jelescu, I. O., Palombo, M., Bagnato, F., and Schilling, K. G. (2020). Challenges for biophysical modeling of microstructure. J. Neurosci. Methods 344:108861. doi: 10.1016/j.jneumeth.2020.108861
Jensen, J. H., and Helpern, J. A. (2010). MRI quantification of non-Gaussian water diffusion by kurtosis analysis. NMR Biomed. 23, 698–710. doi: 10.1002/nbm.1518
Jeong, J. (2004). EEG dynamics in patients with Alzheimer’s disease. Clin. Neurophysiol. 115, 1490–1505. doi: 10.1016/j.clinph.2004.01.001
Jeurissen, B., Leemans, A., Tournier, J. D., Jones, D. K., and Sijbers, J. (2013). Investigating the prevalence of complex fiber configurations in white matter tissue with diffusion magnetic resonance imaging. Hum. Brain Mapp. 34, 2747–2766. doi: 10.1002/hbm.22099
Johansen-Berg, H. (2012). The future of functionally-related structural change assessment. NeuroImage 62, 1293–1298. doi: 10.1016/j.neuroimage.2011.10.073
Kirino, E., Hayakawa, Y., Inami, R., Inoue, R., and Aoki, S. (2019). Simultaneous fMRI-EEG-DTI recording of MMN in patients with schizophrenia. PLoS One 14:e0215023. doi: 10.1371/journal.pone.0215023
Klimesch, W. (1996). Memory processes, brain oscillations and EEG synchronization. Int. J. Psychophysiol. 24, 61–100. doi: 10.1016/s0167-8760(96)00057-8
Knight, R. T., Scabini, D., Woods, D. L., and Clayworth, C. C. (1989). Contributions of temporal-parietal junction to the human auditory P3. Brain Res. 502, 109–116. doi: 10.1016/0006-8993(89)90466-6
Ko, A. L., Darvas, F., Poliakov, A., Ojemann, J., and Sorensen, L. B. (2011). Quasi-periodic fluctuations in default mode network electrophysiology. J. Neurosci. 31, 11728–11732. doi: 10.1523/JNEUROSCI.5730-10.2011
Koelsch, S., Vuust, P., and Friston, K. (2019). Predictive processes and the peculiar case of music. Trends Cogn. Sci. 23, 63–77.
Koshiyama, D., Kirihara, K., Tada, M., Nagai, T., Fujioka, M., Koike, S., et al. (2018). Association between mismatch negativity and global functioning is specific to duration deviance in early stages of psychosis. Schizophr. Res. 195, 378–384. doi: 10.1016/j.schres.2017.09.045
Krainik, A., Hund-Georgiadis, M., Zysset, S., and von Cramon, D. Y. (2005). Regional impairment of cerebrovascular reactivity and BOLD signal in adults after stroke. Stroke 36, 1146–1152. doi: 10.1161/01.STR.0000166178.40973.a7
Kubicki, M., McCarley, R., Westin, C. F., Park, H. J., Maier, S., Kikinis, R., et al. (2007). A review of diffusion tensor imaging studies in schizophrenia. J. Psychiatr. Res. 41, 15–30. doi: 10.1016/j.jpsychires.2005.05.005
Lacasa, L., Stramaglia, S., and Marinazzo, D. (2021). Beyond pairwise network similarity: exploring mediation and suppression between networks. Commun. Phys. 4:136. doi: 10.1038/s42005-021-00638-9
Lachaux, J. P., Rodriguez, E., Martinerie, J., and Varela, F. J. (1999). Measuring phase synchrony in brain signals. Hum. Brain Mapp. 8, 194–208.
Leemans, A., Jeurissen, B., Sijbers, J., and Jones, D. K. (2009). “ExploreDTI: a graphical toolbox for processing, analyzing, and visualizing diffusion MR data,” in ISMRM, 17th Scientific Meeting and Exhibition, (California: ISMRM).
Light, G. A., and Näätänen, R. (2013). Mismatch negativity is a breakthrough biomarker for understanding and treating psychotic disorders. Proc. Natl. Acad. Sci. 110, 15175–15176. doi: 10.1073/pnas.1313287110
Litvak, V., Mattout, J., Kiebel, S., Phillips, C., Henson, R., Kilner, J., et al. (2011). EEG and MEG data analysis in SPM8. Comput. Intellig. Neurosci. 2011:852961.
Liu, P., Yu, Y., Gao, S., Sun, J., Yang, X., Liu, P., et al. (2017). Structural integrity in the genu of corpus callosum predicts conflict-induced functional connectivity between medial frontal cortex and right posterior parietal cortex. Neuroscience 366, 162–171. doi: 10.1016/j.neuroscience.2017.10.017
Liu, Q., Ganzetti, M., Wenderoth, N., and Mantini, D. (2018). Detecting Large-Scale Brain Networks Using EEG: impact of electrode density, head modeling and source localization. Front. Neuroinform. 12:4. doi: 10.3389/fninf.2018.00004
Logothetis, N. K. (2008). What we can do and what we cannot do with fMRI. Nature 453, 869–878. doi: 10.1038/nature06976
Mädler, B., Drabycz, S. A., Kolind, S. H., Whittall, K. P., and MacKay, A. L. (2008). Is diffusion anisotropy an accurate monitor of myelination? Correlation of multicomponent T2 relaxation and diffusion tensor anisotropy in human brain. Magn. Reson. Imag. 26, 874–888.
Martikainen, M. H., Kaneko, K., and Hari, R. (2005). Suppressed responses to self-triggered sounds in the human auditory cortex. Cereb. Cortex 15, 299–302. doi: 10.1093/cercor/bhh131
Mathalon, D. H., Whitfield, S. L., and Ford, J. M. (2003). Anatomy of an error: ERP and fMRI. Biol. Psychol. 64, 119–141. doi: 10.1016/S0301-0511(03)00105-4
McCarthy, G., and Donchin, E. (1976). The Effects of Temporal and Event Uncertainty in Determining the Waveforms of the Auditory Event Related Potential (ERP). Psychophysiology 13, 581–590. doi: 10.1111/j.1469-8986.1976.tb00885.x
McFarlane, A., Clark, C. R., Bryant, R. A., Williams, L. M., Niaura, R., Paul, R. H., et al. (2005). The impact of early life stress on psychophysiological, personality and behavioral measures in 740 non-clinical subjects. J. Integr. Neurosci. 4, 27–40.
McLaughlin, K. A., Fox, N. A., Zeanah, C. H., Sheridan, M. A., Marshall, P., and Nelson, C. A. (2010). Delayed maturation in brain electrical activity partially explains the association between early environmental deprivation and symptoms of attention-deficit/hyperactivity disorder. Biol. Psychiatry 68, 329–336. doi: 10.1016/j.biopsych.2010.04.005
Miltner, W. H., Lemke, U., Weiss, T., Holroyd, C., Scheffers, M. K., and Coles, M. G. (2003). Implementation of error-processing in the human anterior cingulate cortex: a source analysis of the magnetic equivalent of the error-related negativity. Biol. Psychol. 64, 157–166. doi: 10.1016/s0301-0511(03)00107-8
Mori, S., Kaufmann, W. E., Davatzikos, C., Stieltjes, B., Amodei, L., Fredericksen, K., et al. (2002). Imaging cortical association tracts in the human brain using diffusion-tensor-based axonal tracking. Magn. Reson. Med. 47, 215–223. doi: 10.1002/mrm.10074
Mori, S., and van Zijl, P. (2007). Human White Matter Atlas. Am. J. Psychiatry 164, 1005–1005. doi: 10.1176/ajp.2007.164.7.1005
Muldoon, S. F., and Bassett, D. S. (2016). Network and Multilayer Network Approaches to Understanding Human Brain Dynamics. Philos. Sci. 83, 710–720. doi: 10.1086/687857
Mulkern, R. V., Davis, P. E., Haker, S. J., Estepar, R. S., Panych, L. P., Maier, S. E., et al. (2006). Complementary aspects of diffusion imaging and fMRI; I: structure and function. Magn. Reson. Imag. 24, 463–474. doi: 10.1016/j.mri.2006.01.007
Muraskin, J., Dodhia, S., Lieberman, G., Garcia, J. O., Verstynen, T., Vettel, J. M., et al. (2016). Brain dynamics of post-task resting state are influenced by expertise: insights from baseball players. Hum. Brain Mapp. 37, 4454–4471. doi: 10.1002/hbm.23321
Muraskin, J., Sherwin, J., Lieberman, G., Garcia, J. O., Verstynen, T., Vettel, J. M., et al. (2017). Fusing multiple neuroimaging modalities to assess group differences in perception-action coupling. Proc. IEEE Inst. Electr. Electron. Eng. 105, 83–100. doi: 10.1109/JPROC.2016.2574702
Muraskin, J., Sherwin, J., and Sajda, P. (2015). Knowing when not to swing: EEG evidence that enhanced perception-action coupling underlies baseball batter expertise. NeuroImage 123, 1–10. doi: 10.1016/j.neuroimage.2015.08.028
Myer, G. D., Yuan, W., Barber Foss, K. D., Smith, D., Altaye, M., Reches, A., et al. (2016). The Effects of external jugular compression applied during head impact exposure on longitudinal changes in brain neuroanatomical and neurophysiological biomarkers: a preliminary investigation. Front. Neurol. 7:74. doi: 10.3389/fneur.2016.00074
Näätänen, R. (2014). The mismatch negativity (MMN) — A unitary biomarker for predicting schizophrenia onset. Int. J. Psychophysiol. 94:120. doi: 10.1016/j.ijpsycho.2014.08.586
Näätänen, R., Paavilainen, P., Rinne, T., and Alho, K. (2007). The mismatch negativity (MMN) in basic research of central auditory processing: a review. Clin. Neurophysiol. 118, 2544–2590. doi: 10.1016/j.clinph.2007.04.026
Näätänen, R., Todd, J., and Schall, U. (2016). Mismatch negativity (MMN) as biomarker predicting psychosis in clinically at-risk individuals. Biol. Psychol. 116, 36–40. doi: 10.1016/j.biopsycho.2015.10.010
Nagai, T., Tada, M., Kirihara, K., Yahata, N., Hashimoto, R., Araki, T., et al. (2013). Auditory mismatch negativity and P3a in response to duration and frequency changes in the early stages of psychosis. Schizophr. Res. 150, 547–554. doi: 10.1016/j.schres.2013.08.005
Nager, W., Teder-Sälejärvi, W., Kunze, S., and Münte, T. F. (2003). Preattentive evaluation of multiple perceptual streams in human audition. Neuroreport 14, 871–874. doi: 10.1097/00001756-200305060-00019
Niedermeyer, E., and Lopes da Silva, F. H. (1993). Electroencephalography: Basic Principles, Clinical Applications and Related Fields, 3rd Edn. Baltimore, MD: Lippincott Williams & Wilkins.
Niedermeyer, E., and Lopes da Silva, F. H. (2004). Electroencephalography: Basic Principles, Clinical Applications, and Related Fields, 5th Edn. Philadelphia: Lippincott Williams & Wilkins.
Noesselt, T., Hillyard, S. A., Woldorff, M. G., Schoenfeld, A., Hagner, T., Jancke, L., et al. (2002). Delayed striate cortical activation during spatial attention. Neuron 35, 575–587. doi: 10.1016/s0896-6273(02)00781-x
Noori, R., Park, D. C., Griffiths, J. D., Bells, S., Frankland, P. W., Mabbott, D. J., et al. (2020). Activity-dependent myelination: a glial mechanism of oscillatory self-organization in large-scale brain networks. Proc. Natl. Acad. Sci. U. S. A. 117, 13227–13237. doi: 10.1073/pnas.1916646117
Nowicka, A., Grabowska, A., and Fersten, E. (1996). Interhemispheric transmission of information and functional asymmetry of the human brain. Neuropsychologia 34, 147–151. doi: 10.1016/0028-3932(95)00064-X
Nuwer, M. R., Jordan, S. E., and Ahn, S. S. (1987). Evaluation of stroke using EEG frequency analysis and topographic mapping. Neurology 37, 1153–1159. doi: 10.1212/wnl.37.7.1153
Oestreich, L. K. L., Randeniya, R., and Garrido, M. I. (2019). Auditory prediction errors and auditory white matter microstructure associated with psychotic-like experiences in healthy individuals. Brain Struct. Funct. 224, 3277–3289. doi: 10.1007/s00429-019-01972-z
Oknina, L. B., Wild-Wall, N., Oades, R. D., Juran, S. A., Röpcke, B., Pfueller, U., et al. (2005). Frontal and temporal sources of mismatch negativity in healthy controls, patients at onset of schizophrenia in adolescence and others at 15 years after onset. Schizophr. Res. 76, 25–41. doi: 10.1016/j.schres.2004.10.003
Olbrich, S., and Arns, M. (2013). EEG biomarkers in major depressive disorder: discriminative power and prediction of treatment response. Int. Rev. Psychiatry 25, 604–618. doi: 10.3109/09540261.2013.816269
Olesen, P. J., Nagy, Z., Westerberg, H., and Klingberg, T. (2003). Combined analysis of DTI and fMRI data reveals a joint maturation of white and grey matter in a fronto-parietal network. Cogn. Brain Res. 18, 48–57. doi: 10.1016/j.cogbrainres.2003.09.003
Oostenveld, R., Fries, P., Maris, E., and Schoffelen, J. M. (2011). FieldTrip: open source software for advanced analysis of MEG, EEG, and invasive electrophysiological data. Comput. Intell. Neurosci. 2011:156869. doi: 10.1155/2011/156869
Pajevic, S., Basser, P. J., and Fields, R. D. (2013). Role of myelin plasticity in oscillations and synchrony of neuronal activity. Neuroscience 276, 135–147. doi: 10.1016/j.neuroscience.2013.11.007
Pandya, D. N., and Seltzer, B. (1986). “The topography of commisural fibers,” in Two Hemispheres-One Brain: Functions of the Corpus Callosum, eds F. Lepore, M. Ptito, and H. H. Jasper (New York: Alan R. Liss, Inc), 47–73.
Park, J. L., Fairweather, M. M., and Donaldson, D. I. (2015). Making the case for mobile cognition: EEG and sports performance. Neurosci. Biobehav. Rev. 52, 117–130. doi: 10.1016/j.neubiorev.2015.02.014
Pascual-Marqui, R. D. (2007). Discrete, 3D Distributed, Linear Imaging Methods of Electric Neuronal Activity. Part 1: Exact, Zero Error Localization Mathematical Physics Biology Physics Neurons and Cognition, 710. Available online at: https://arxiv.org/abs/0710.3341 (accessed October, 2019).
Pascual-Marqui, R. D., Michel, C. M., and Lehmann, D. (1994). Low resolution electromagnetic tomography: a new method for localizing electrical activity in the brain. Int. J. Psychophysiol. 18, 49–65.
Patel, S. H., and Azzam, P. N. (2005). Characterization of N200 and P300: selected studies of the Event-Related Potential. Int. J. Med. Sci. 2, 147–154. doi: 10.7150/ijms.2.147
Persson, J., Nyberg, L., Lind, J., Larsson, A., Nilsson, L. G., Ingvar, M., et al. (2006). Structure-function correlates of cognitive decline in aging. Cereb. Cortex 16, 907–915. doi: 10.1093/cercor/bhj036
Picton, T. W. (1992). The P300 wave of the human event-related potential. J. Clin. Neurophysiol. 9, 456–479.
Pierpaoli, C., and Basser, P. J. (1996). Toward a quantitative assessment of diffusion anisotropy. Magn. Reson. Med. 36, 893–906.
Pines, A. R., Cieslak, M., Baum, G. L., Cook, P. A., Adebimpe, A., Dávila, D. G., et al. (2019). Advantages of Multi-shell Diffusion Models for Studies of Brain Development in Youth. BioRxiv [Preprint]. doi: 10.1101/611590
Poeppel, D. (2003). The analysis of speech in different temporal integration windows: cerebral lateralization as ‘asymmetric sampling in time. Speech Commun. 41, 245–255. doi: 10.1016/S0167-6393(02)00107-3
Poghosyan, V., Shibata, T., and Ioannides, A. A. (2005). Effects of attention and arousal on early responses in striate cortex. Eur. J. Neurosci. 22, 225–234. doi: 10.1111/j.1460-9568.2005.04181.x
Poot, D. H., den Dekker, A. J., Achten, E., Verhoye, M., and Sijbers, J. (2010). Optimal experimental design for diffusion kurtosis imaging. IEEE Trans. Med. Imag. 29, 819–829. doi: 10.1109/TMI.2009.2037915
Quandt, F., Bönstrup, M., Schulz, R., Timmermann, J. E., Mund, M., Wessel, M. J., et al. (2019). The functional role of beta-oscillations in the supplementary motor area during reaching and grasping after stroke: a question of structural damage to the corticospinal tract. Hum. Brain Mapp. 40, 3091–3101. doi: 10.1002/hbm.24582
Raffelt, D. A., Tournier, J. D., Smith, R. E., Vaughan, D. N., Jackson, G., Ridgway, G. R., et al. (2017). Investigating white matter fibre density and morphology using fixel-based analysis. NeuroImage 144, 58–73. doi: 10.1016/j.neuroimage.2016.09.029
Reutskiy, S., Rossoni, E., and Tirozzi, B. (2003). Conduction in bundles of demyelinated nerve fibers: computer simulation. Biol. Cyber. 89, 439–448. doi: 10.1007/s00422-003-0430-x
Sainio, K., Stenberg, D., Keskima̋ki, I., Muuronen, A., and Kaste, M. (1983). Visual and spectral EEG analysis in the evaluation of the outcome in patients with ischemic brain infarction. Electroencephalogr. Clin. Neurophysiol. 56, 117–124.
Samogin, J., Marino, M., Porcaro, C., Wenderoth, N., Dupont, P., Swinnen, S. P., et al. (2020). Frequency-dependent functional connectivity in resting state networks. Hum. Brain Mapp. 41, 5187–5198. doi: 10.1002/hbm.25184
Schafer, E. W., and Marcus, M. M. (1973). Self-stimulation alters human sensory brain responses. Science 181, 175–177. doi: 10.1126/science.181.4095.175
Schlősser, R. G., Nenadic, I., Wagner, G., Gűllmar, D., von Consbruch, K., Kőhler, S., et al. (2007). White matter abnormalities and brain activation in schizophrenia: a combined DTI and fMRI study. Schizophr. Res. 89, 1–11. doi: 10.1016/j.schres.2006.09.007
Scholz, J., Tomassini, V., and Johansen-Berg, H. (2009). “Chapter 11 - Individual Differences in White Matter Microstructure in the Healthy Brain,” in Diffusion MRI, eds H. Johansen-Berg and T. E. J. Behrens (San Diego: Academic Press), 237–249.
Schulz, R., Buchholz, A., Frey, B. M., Bőnstrup, M., Cheng, B., Thomalla, G., et al. (2016). Enhanced Effective Connectivity Between Primary Motor Cortex and Intraparietal Sulcus in Well-Recovered Stroke Patients. Stroke 47, 482–489. doi: 10.1161/STROKEAHA.115.011641
Scrascia, F., Curcio, G., Ursini, F., Trotta, L., Quintiliani, L., Migliore, S., et al. (2014). Relationship among diffusion tensor imaging, EEG activity, and cognitive status in mild cognitive impairment and alzheimer’s disease patients. J. Alzheimer’s Dis. 38, 939–950.
Seghier, M. L., Lazeyras, F., Zimine, S., Maier, S. E., Hanquinet, S., Delavelle, J., et al. (2004). Combination of event-related fMRI and diffusion tensor imaging in an infant with perinatal stroke. NeuroImage 21, 463–472. doi: 10.1016/j.neuroimage.2003.09.015
Seifer, G., Blenkmann, A., Princich, J. P., Consalvo, D., Papayannis, C., Muravchik, C., et al. (2012). Noninvasive approach to focal cortical dysplasias: clinical, EEG, and neuroimaging features. Epilepsy Res. Treat. 2012:736784. doi: 10.1155/2012/736784
Senkowski, D., Schneider, T. R., Foxe, J. J., and Engel, A. K. (2008). Crossmodal binding through neural coherence: implications for multisensory processing. Trends Neurosci. 31, 401–409. doi: 10.1016/j.tins.2008.05.002
Smith, S. M., Jenkinson, M., Johansen-Berg, H., Rueckert, D., Nichols, T. E., Mackay, C. E., et al. (2006). Tract-based spatial statistics: voxelwise analysis of multi-subject diffusion data. NeuroImage 31, 1487–1505. doi: 10.1016/j.neuroimage.2006.02.024
Smith, S. M., Jenkinson, M., Woolrich, M. W., Beckmann, C. F., Behrens, T. E. J., Johansen-Berg, H., et al. (2004). Advances in functional and structural MR image analysis and implementation as FSL. NeuroImage 23, S208–S219. doi: 10.1016/j.neuroimage.2004.07.051
Solesio-Jofre, E., Serbruyns, L., Woolley, D. G., Mantini, D. I., Beets, A., and Swinnen, S. P. (2014). Aging effects on the resting state motor network and interlimb coordination. Hum. Brain Mapp. 35, 3945–3961. doi: 10.1002/hbm.22450
Sponheim, S. R., McGuire, K. A., Kang, S. S., Davenport, N. D., Aviyente, S., Bernat, E. M., et al. (2011). Evidence of disrupted functional connectivity in the brain after combat-related blast injury. NeuroImage 54, S21–S29. doi: 10.1016/j.neuroimage.2010.09.007
Sporns, O. (2011). The human connectome: a complex network. Ann. N. Y. Acad. Sci. 1224, 109–125. doi: 10.1111/j.1749-6632.2010.05888.x
Steinmann, S., Amselberg, R., Cheng, B., Thomalla, G., Engel, A. K., Leicht, G., et al. (2018). The role of functional and structural interhemispheric auditory connectivity for language lateralization - A combined EEG and DTI study. Sci. Rep. 8:15428. doi: 10.1038/s41598-018-33586-6
Stejskal, E. O., and Tanner, J. E. (1965). Spin diffusion measurements: spin echoes in the presence of a time dependent field gradient. J. Chem. Phys. 42, 288–292. doi: 10.1063/1.1695690
Tadel, F., Baillet, S., Mosher, J. C., Pantazis, D., and Leahy, R. M. (2011). Brainstorm: a user-friendly application for MEG/EEG analysis. Comput. Intell. Neurosci. 2011:879716.
Takagi, T., Nakamura, M., Yamada, M., Hikishima, K., Momoshima, S., Fujiyoshi, K., et al. (2009). Visualization of peripheral nerve degeneration and regeneration: monitoring with diffusion tensor tractography. NeuroImage 44, 884–892. doi: 10.1016/j.neuroimage.2008.09.022
Taylor, S. F., Stern, E. R., and Gehring, W. J. (2007). Neural systems for error monitoring: recent findings and theoretical perspectives. Neuroscientist 13, 160–172. doi: 10.1177/1073858406298184
Teipel, S. J., Pogarell, O., Meindl, T., Dietrich, O., Sydykova, D., Hunklinger, U., et al. (2009). Regional networks underlying interhemispheric connectivity: an EEG and DTI study in healthy ageing and amnestic mild cognitive impairment. Hum. Brain Mapp. 30, 2098–2119. doi: 10.1002/hbm.20652
Tournier, D. J., Calamante, F., Gadian, D. G., and Connelly, A. (2004). Direct estimation of the fiber orientation density function from diffusion-weighted MRI data using spherical deconvolution. NeuroImage 23, 1176–1185. doi: 10.1016/j.neuroimage.2004.07.037
Tournier, J. D., Smith, R., Raffelt, D., Tabbara, R., Dhollander, T., Pietsch, M., et al. (2019). MRtrix3: a fast, flexible and open software framework for medical image processing and visualisation. NeuroImage 202:116137. doi: 10.1016/j.neuroimage.2019.116137
Tsvetanov, K. A., Henson, R. N. A., Tyler, L. K., Davis, S. W., Shafto, M. A., Taylor, J. R., et al. (2015). The effect of ageing on fMRI: correction for the confounding effects of vascular reactivity evaluated by joint fMRI and MEG in 335 adults. Hum. Brain Mapp. 36, 2248–2269. doi: 10.1002/hbm.22768
Valdés-Hernández, P. A., Ojeda-González, A., Martínez-Montes, E., Lage-Castellanos, A., Virués-Alba, T., Valdés-Urrutia, L., et al. (2010). White matter architecture rather than cortical surface area correlates with the EEG alpha rhythm. NeuroImage 49, 2328–2339.
Van Veen, B. D., van Drongelen, W., Yuchtman, M., and Suzuki, A. (1997). Localization of brain electrical activity via linearly constrained minimum variance spatial filtering. IEEE Trans. Biomed. Eng. 44, 867–880. doi: 10.1109/10.623056
Van Veen, V., and Carter, C. S. (2002). The timing of action-monitoring processes in the anterior cingulate cortex. J. Cogn. Neurosci. 14, 593–602.
van Wijngaarden, J. B., Zucca, R., Finnigan, S., and Verschure, P. F. (2016). The Impact of cortical lesions on thalamo-cortical network dynamics after Acute Ischaemic Stroke: a combined experimental and theoretical study. PLoS Comput. Biol. 12:e1005048. doi: 10.1371/journal.pcbi.1005048
Vaquero, L., Ramos-Escobar, N., Cucurell, D., François, C., Putkinen, V., Segura, E., et al. (2021). Arcuate fasciculus architecture is associated with individual differences in pre-attentive detection of unpredicted music changes. NeuroImage 229:117759. doi: 10.1016/j.neuroimage.2021.117759
Vocat, R., Pourtois, G., and Vuilleumier, P. (2008). Unavoidable errors: a spatio-temporal analysis of time-course and neural sources of evoked potentials associated with error processing in a speeded task. Neuropsychologia 46, 2545–2555. doi: 10.1016/j.neuropsychologia.2008.04.006
Wang, C., Costanzo, M. E., Rapp, P. E., Darmon, D., Nathan, D. E., Bashirelahi, K., et al. (2017). Disrupted Gamma Synchrony after Mild Traumatic Brain Injury and Its Correlation with White Matter Abnormality. Front. Neurol. 8:571. doi: 10.3389/fneur.2017.00571
Wang, C., Ulbert, I., Schomer, D. L., Marinkovic, K., and Halgren, E. (2005). Responses of human anterior cingulate cortex microdomains to error detection, conflict monitoring, stimulus-response mapping, familiarity, and orienting. J. Neurosci. 25, 604–613. doi: 10.1523/JNEUROSCI.4151-04.2005
Wang, Z., Chen, L. M., Negyessy, L., Friedman, R. M., Mishra, A., Gore, J. C., et al. (2013). The relationship of anatomical and functional connectivity to resting-state connectivity in primate somatosensory cortex. Neuron 78, 1116–1126. doi: 10.1016/j.neuron.2013.04.023
Weinstein, M., Green, D., Rudisch, J. I., Zielinski, M., Benthem-MuÒiz, M., Jongsma, M. L. A., et al. (2018). Understanding the relationship between brain and upper limb function in children with unilateral motor impairments: a multimodal approach. Eur. J. Paediatr. Neurol. 22, 143–154.
Westerhausen, R., Kreuder, F., Woerner, W., Huster, R. J., Smit, C. M., Schweiger, E., et al. (2006). Interhemispheric transfer time and structural properties of the corpus callosum. Neurosci. Lett. 409, 140–145. doi: 10.1016/j.neulet.2006.09.028
Westlye, L. T., Walhovd, K. B., Bjørnerud, A., Due-Tønnessen, P., and Fjell, A. M. (2009). Error-related negativity is mediated by fractional anisotropy in the posterior cingulate gyrus–a study combining diffusion tensor imaging and electrophysiology in healthy adults. Cereb. Cortex 19, 293–304.
Whitford, T. J., Kubicki, M., Ghorashi, S., Schneiderman, J. S., Hawley, K. J., McCarley, R. W., et al. (2011a). Predicting inter-hemispheric transfer time from the diffusion properties of the corpus callosum in healthy individuals and schizophrenia patients: a combined ERP and DTI study. NeuroImage 54, 2318–2329. doi: 10.1016/j.neuroimage.2010.10.048
Whitford, T. J., Kubicki, M., and Shenton, M. E. (2011b). Diffusion tensor imaging, structural connectivity, and schizophrenia. Schizophr. Res. Treat. 2011:709523. doi: 10.1155/2011/709523
Whitford, T. J., Mathalon, D. H., Shenton, M. E., Roach, B. J., Bammer, R., Adcock, R. A., et al. (2011c). Electrophysiological and diffusion tensor imaging evidence of delayed corollary discharges in patients with schizophrenia. Psychol. Med. 41, 959–969. doi: 10.1017/S0033291710001376
Winkler, I., Denham, S. L., and Nelken, I. (2009). Modeling the auditory scene: predictive regularity representations and perceptual objects. Trends Cogn. Sci. 13, 532–540. doi: 10.1016/j.tics.2009.09.003
Wirsich, J., Jorge, J., Iannotti, G. R., Shamshiri, E. A., Grouiller, F., Abreu, R., et al. (2021). The relationship between EEG and fMRI connectomes is reproducible across simultaneous EEG-fMRI studies from 1.5T to 7T. NeuroImage 231:117864. doi: 10.1016/j.neuroimage.2021.117864
Womelsdorf, T., and Fries, P. (2006). Neuronal coherence during selective attentional processing and sensory-motor integration. J. Physiol. Paris 100, 182–193. doi: 10.1016/j.jphysparis.2007.01.005
Woolrich, M. W., Jbabdi, S., Patenaude, B., Chappell, M., Makni, S., Behrens, T., et al. (2009). Bayesian analysis of neuroimaging data in FSL. NeuroImage 45, S173–S186. doi: 10.1016/j.neuroimage.2008.10.055
Yamaguchi, S., and Knight, R. T. (1991). Anterior and posterior association cortex contributions to the somatosensory P300. J. Neurosci. 11, 2039–2054.
Yamaguchi, S., and Knight, R. T. (1992). Effects of temporal-parietal lesions on the somatosensory P3 to lower limb stimulation. Electroencephalogr. Clin. Neurophysiol. 84, 139–148. doi: 10.1016/0168-5597(92)90018-7
Yeung, N., Botvinick, M. M., and Cohen, J. D. (2004). The neural basis of error detection: conflict monitoring and the error-related negativity. Psychol. Rev. 111, 931–959. doi: 10.1037/0033-295X.111.4.931
Zatorre, R. J., Belin, P., and Penhune, V. B. (2002). Structure and function of auditory cortex: music and speech. Trends Cogn. Sci. 6, 37–46. doi: 10.1016/S1364-6613(00)01816-7
Zatorre, R. J., Evans, A. C., Meyer, E., and Gjedde, A. (1992). Lateralization of phonetic and pitch discrimination in speech processing. Science 256, 846–849. doi: 10.1126/science.1589767
Keywords: diffusion-based magnetic resonance imaging (dMRI), electro-encephalography (EEG), white matter (WM) microstructural organization, functional connectivity, event-related potentials (ERPs), resting state, spectral analysis
Citation: Babaeeghazvini P, Rueda-Delgado LM, Gooijers J, Swinnen SP and Daffertshofer A (2021) Brain Structural and Functional Connectivity: A Review of Combined Works of Diffusion Magnetic Resonance Imaging and Electro-Encephalography. Front. Hum. Neurosci. 15:721206. doi: 10.3389/fnhum.2021.721206
Received: 06 June 2021; Accepted: 10 September 2021;
Published: 07 October 2021.
Edited by:
Vladimir Litvak, Queen Square Institute of Neurology, United KingdomReviewed by:
Mahmoud Hassan, University of Rennes 1, FranceCopyright © 2021 Babaeeghazvini, Rueda-Delgado, Gooijers, Swinnen and Daffertshofer. This is an open-access article distributed under the terms of the Creative Commons Attribution License (CC BY). The use, distribution or reproduction in other forums is permitted, provided the original author(s) and the copyright owner(s) are credited and that the original publication in this journal is cited, in accordance with accepted academic practice. No use, distribution or reproduction is permitted which does not comply with these terms.
*Correspondence: Andreas Daffertshofer, YS5kYWZmZXJ0c2hvZmVyQHZ1Lm5s
Disclaimer: All claims expressed in this article are solely those of the authors and do not necessarily represent those of their affiliated organizations, or those of the publisher, the editors and the reviewers. Any product that may be evaluated in this article or claim that may be made by its manufacturer is not guaranteed or endorsed by the publisher.
Research integrity at Frontiers
Learn more about the work of our research integrity team to safeguard the quality of each article we publish.