


- 1 Sackler Institute for Developmental Psychobiology, Weill Cornell Medical College, New York, NY, USA
- 2 Neuroscience Program, Weill Cornell Medical College, New York, NY, USA
- 3 Department of Child and Adolescent Psychiatry, University of Zurich, Zurich, Switzerland
- 4 Department of Psychology, Peabody College of Education, Vanderbilt University, Nashville, USA
The ability to learn second language speech sound categories declines during development. We examined this phenomenon by studying the mismatch negativity (MMN) to the /r/ – /l/ distinction in native English speakers and learners of English as a second language who are native speakers of Japanese. Previous studies have suggested that the MMN is remarkably plastic when evaluated as a waveform at a central electrode. We replicated this finding: analyses of the MMN at a typical electrode location (Fz) revealed only small, non-significant differences between groups, despite large behavioral differences in the ability to discriminate these sounds from one another. Topographic analyses, however, revealed reliable differences in lateralization of the MMN, such that native English speakers’ responses were left-lateralized relative to native Japanese speakers’ responses.
Introduction
Part of learning to speak and understand one’s native language (L1) is the development of expertise in perceiving and categorizing sounds from the “phonetic inventory” of that language. Very early in development, perceptual and attentional responses to speech are shaped by native language input, so that sounds that are contrastive – i.e., that can distinguish two words from one another, such as the first sounds in “lock” and “rock” for infants in an English-speaking environment – elicit different responses than sounds that are not – the same sounds for infants in a Japanese-speaking environment (e.g., Kuhl et al., 2006). Loss of sensitivity to foreign language (L2) contrasts not present in one’s native phonetic inventory can ultimately result in failures to achieve native-like speech perception and production even after many years of experience (see Werker and Tees, 2005 for a recent review). Here we examine electrophysiological responses to contrasts in a familiar L2 in which participants have been immersed for a long time – and in which they are relatively proficient – using a mismatch negativity (MMN) paradigm.
Electro- and magnetoencephalographic measures of brain responses to speech have made extensive use of passive mismatch paradigms in which auditory stimuli are presented repeatedly, with one stimulus (the “standard”) having a much higher frequency of occurrence than another (the “deviant,” Winkler et al., 1990; Näätänen et al., 2001). The difference between responses to deviant and standard, typically a negative-going difference wave starting between 100 and 200 ms after stimulus onset – the MMN – is proposed to index auditory change detection (Escera et al., 2000). The MMN to speech is influenced by language experience, such that responses to unfamiliar speech contrasts are weaker and less left-lateralized than responses to native speech sounds. For example, Näätänen et al. (1997) presented participants with stimuli drawn from a synthetic vowel continuum and found a larger MMNm (the equivalent of the MMN when measured with magnetoencephalography) for stimuli identified as members of different categories than for stimuli identified as members of the same category, even when the physical differences were larger for the within- than for the between-category contrast. Further, topographic analysis of the MMNm response revealed stronger activity on the left than the right for the native-language contrast, but a smaller difference between the two hemispheres for the non-native contrast.
Surprisingly, the MMN has rarely been measured in more experienced second language learners. One study that included both fluent and naïve L2 listeners suggested a surprising degree of plasticity: while naïve listeners produced a smaller MMN than native speakers and proficient adult learners, no difference was found between the fluent users of L2 and the native speakers (Winkler et al., 1999). The analyses in this study only considered a single fronto-central electrode (Fz), however, and thus were insensitive to possible differences in the topography of the response (Murray et al., 2008). In particular, if the native- and non-native speakers differ in the laterality of the MMN generators, this would not be observable by considering waveforms from the electrode at which it is typically analyzed (Maurer et al., 2003b).
The current study applies high-density EEG and topographic analysis of the MMN to native and familiar non-native speech sounds in order to examine the influence of early learning on different features of the MMN to L2 contrasts, using advanced topographic analysis techniques to explore differences in the laterality of this response between native and non-native listeners. We also apply source localization, in order to compare our results to fMRI studies that have examined change detection responses in left temporal and parietal regions that appear specific to native-language speech categories when compared to unfamiliar L2 sounds (Jacquemot et al., 2003; Callan et al., 2004). Differences in the MMN between the two groups may provide insights into Japanese speakers’ persistent difficulties in learning this contrast (Oyama, 1978; Bradlow et al., 1997).
Materials and Methods
Subjects
Twenty native Japanese speakers (12 female) and 20 native English speakers (seven female) participated in the study. Groups were matched for age (average 29.7 years for Japanese speakers, 30.1 years for English speakers, −1 < t < 1). All participants were right-handed, as ascertained by self-report. Non-native speakers had spent a mean of 7.5 years (SD = 6.2) in English-speaking countries before testing, and had a mean age of arrival (AOA) of 21 years (SD = 11.7). Scores for non-native speakers on a standard vocabulary test (Woodcock-Johnson III Reading Vocabulary subtest; Woodcock et al., 2001) reflect a mean age equivalence of 18.2 years, whereas English speakers were near ceiling on the test (age equivalence of 49 years; Woodcock-Johnson Scores were not acquired for three native English-speaking participants). This test involves providing spoken answers to written prompts for synonyms, antonyms, and analogies, and is used here to measure general language proficiency. Although they clearly differed from age-matched native English speakers, the Japanese speakers had vocabulary skills equivalent to young adult native English speakers.
Stimuli
Stimuli were edited natural speech produced by a native English speaker (Jason D. Zevin). One recording each of /ra/ and /la/ were selected to match for pitch and overall amplitude. Stimuli were then edited using Praat (Boersma, 1996/2001) software to match for duration (100 ms) and eliminate any remaining differences in amplitude (using the “Scale to Peak” function). Importantly, because the stimuli were naturally produced, they differed slightly in timbre and vowel quality (in particular the third formant, which was substantially lower for the /ra/ stimulus than for the /la/). Spectrograms and waveforms are presented in Figure 1.
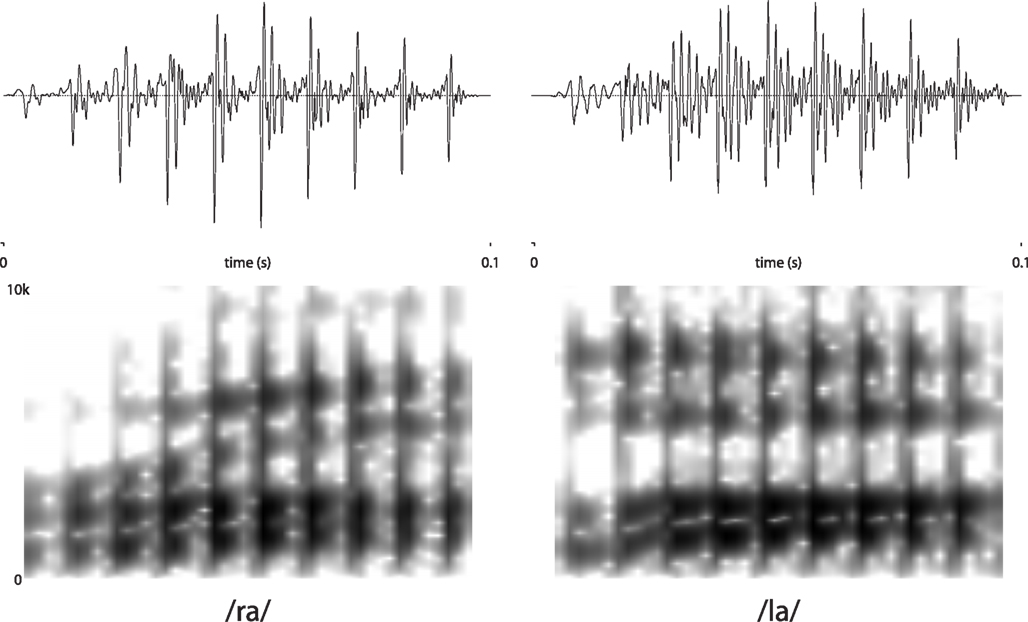
Figure 1. Spectrograms and waveforms of stimuli.
Procedure
Subjects were seated in a sound-attenuated, electrically shielded booth. E-Prime software (Psychology Software Tools, Pittsburgh, PA, USA) was used for stimulus presentation in both the behavioral and MMN paradigms, and for data collection in the behavioral paradigm.
Behavioral testing
Subjects’ ability to discriminate stimuli used in the MMN paradigm was assessed in a discrimination task, run after the EEG experiment. Stimuli were presented over headphones (Sony ECM-CS10) in sets of four – three repeated stimuli followed by a fourth stimulus which was either the same or different from the first three. Subjects were instructed to respond by pressing the “1” key if all four stimuli were the same, the “2” key if the last stimulus was different, or the “3” key if they were unsure. Each stimulus was presented 20 times in each of the four cells generated by crossing stimulus order (/ra/ or /la/ as “standard”) and condition (“same” or “different”). Stimulus order was randomized for each subject. In addition, three sets of filler stimuli (used in other studies) were presented during the same session, intermixed with stimuli used in the current study. Behavioral data were not obtained for three native English speakers because of scheduling errors.
MMN paradigm
Stimuli were played over a single free-field speaker positioned approximately 1 m from the subjects, placed toward the center of the room, on the floor. During stimulus presentation, subjects watched a DVD of their choice (without sound, but with subtitles on) on a portable DVD player with (SONY DVP-FX810, 8′′ diagonal LCD screen) positioned approximately 80 cm from them to minimize eye movements. A total of 1080 stimuli were played with a stimulus onset asynchrony (SOA) of 600 ms in each of two blocks. Deviant stimuli had an overall probability of 1:6, achieved by arranging stimuli into triplets of either three repeated standards or two standards followed by a deviant. This arrangement was opaque to subjects because of the constant SOA and randomization of trials (resulting in each deviant being proceeded by 2, 5, 8, or 11 standards), but allowed us to select a subset of the standard stimuli – with the same number (180) and the same distribution of preceding standards – for direct comparison with the deviants. Each stimulus as both Standard and Deviant, with block order counterbalanced across participants, so that half the participants heard a block with /ra/ as the Standard followed by a block with /ra/ as the Deviant, and the other half heard the blocks in the reverse order.
EEG recording and preprocessing
EEG was recorded using a 128-channel Hydrocel geodesic sensor net (EGI, Eugene, OR, USA) with a Cz reference. Data were sampled at 500 Hz/channel with hardware filter settings 0.1–100 Hz. Impedance was kept below 50 kΩ (Ferree et al., 2001) by reapplication of KCl solution when necessary.
Using BESA software (MEGIS Software, Gräfelfing, Germany), channels with consistent artifacts were spline interpolated (no more than 10% of channels per subject) and eye blinks were corrected (multiple source eye correction method; Berg and Scherg, 1994). The interpolated, corrected data were then bandpass filtered (0.3–30 Hz), segmented (−150 to 750 ms) to obtain event-related potentials (ERPs), and further artifacts rejected (±100 μV), before averaging. Using Brain Vision Analyzer software (Brain Products, Munich, Germany), the data were re-referenced to the average and filtered at 1 Hz before computing global field power (GFP) for each subject.
Waveform Analysis of the MMN
Grand means were computed for each condition (Standard, Deviant) and their difference for each group (native, non-native). Because many more Standard stimuli were presented than Deviants, a subset of these was sampled so that they had a similar distribution in time over the course of the experiment. The MMN was computed by subtracting the response to Standard stimuli from the response to Deviants at the electrode position corresponding to Fz in the 10/20 system (Luu and Ferree, 2000). Because the /la/ and /ra/ stimuli each served as both Standard and Deviant, we were able to compute an “identity” MMN (e.g., Pulvermüller and Shtyrov, 2006). Further, rather than consider Fz alone, we conducted two sets of waveform analyses; the first focusing on fronto-central electrodes at which maximal auditory evoked responses were observed and the second designed to look at differences in the laterality and timing of the response.
“Composite” Fz measures
We sought to reduce inter-subject differences in the topography of evoked responses to speech by considering waveforms from a “composite” electrode. The composite electrode was made by first finding the peak positive response during the P2 window (in the mean response all stimulus types, Standard and Deviant). This time window was selected because the P2 was the largest and most obviously “peaked” of the early obligatory responses, and had a highly consistent topography between participants. The mean of this electrode and its five nearest neighbors was then computed for each condition (Standard, Deviant) as well as the MMN. Figure 3 depicts the electrodes used in this analysis. MMNs were identified as the peak negativity in the subtraction wave (Deviant – Standard) between 120 and 270 ms post-stimulus onset inverting at a spatial average of posterior electrodes. Analyses of the MMN were conducted by determining the latency and amplitude of these peaks. Both latency and amplitude of the MMN were compared between groups with a two-tailed t-test. Results did not differ from analyses conducted using a single electrode, so only results from the spatial average are reported below.
ANOVA on F3/F4 and mastoids
In order to test for group differences in laterality and latency of the MMN, we conducted an ANOVA on time-binned data from four canonical electrode sites (based on the 10/20 system) in a repeated-measures test with five factors: Group (EL1 vs. JL1) × Standard-type (/ra/ vs. /la/) × Hemisphere (right vs. left) × Site (anterior electrodes F3/F4 vs. posterior electrodes LM/RM) × Time (100–300 ms in 20 ms bins). Such analyses typically include midline electrodes (e.g., Fz and Cz, Becker and Reinvang, 2007; Kirmse et al., 2008) but because our primary goal was to test for laterality differences, these were excluded. The particular frontal electrodes (F3/4) were selected because previous studies have produced robust MMNs in these channels (Tiitinen et al., 1994; Kwon et al., 2009; indeed, this is true in the current data as well), and the left and right mastoids (T9/10) selected because these typically show robust reversals (Yabe et al., 1997; Koelsch et al., 1999, see also Figures 5 and 6).
Topographic Analyses
Isolating time periods of interest with TANOVA
A major methodological issue in topographic analysis is the selection of a time period over which to compute topographies, particularly when comparing two groups. For the MMN, it is important to select a time window during which there is evidence for a mismatch response in both groups. This was accomplished by running separate TANOVAs (Strik et al., 1998) for “deviant” vs. “standard” in the two groups, and looking for periods of overlap between the two (following Maurer et al., 2003b). A TANOVA on raw maps detects all systematic amplitude differences between two maps based on a non-parametric randomization test (Holmes et al., 1996) on the GFP of difference maps (Lehmann and Skrandies, 1980; Lehmann et al., 1998). First, segments with significant differences (p < 0.01) were identified, then segments were collapsed if they were separated from one another only by time frames for which p < 0.05.
Centroid analysis
Centroids were computed (Lehmann, 1990) for each time segment identified in the TANOVA for the MMN. This method is purely topographic in that it disregards overall differences in signal intensity; centroid analysis treats the distribution of electrical activity at the scalp as a mass and attempts to find the “center of gravity” for both positive and negative poles in a three-dimensional space scaled to be compatible with Talairach coordinates (Talairach and Tournoux, 1988). These measures were compared between groups using a repeated-measures multivariate ANOVA with the three coordinate axes (left–right, anterior–posterior, and superior–inferior) as dependent measures and group (native vs. non-native) as the independent variable (Maurer et al., 2003a,b). Univariate tests were conducted in order to interpret interactions in the MANOVAs, and when a priori predictions about laterality were motivated by the existing literature.
Source Localization with Loreta
In order to identify potential cortical sources for the observed MMN, we conducted source localization with low resolution electromagnetic tomography software (LORETA; Pascual-Marqui et al., 1994, available at: http://www.unizh.ch/keyinst/) on the normalized, averaged difference maps for each group independently, based on the MMN time segment identified in the TANOVA. LORETA attempts to find gray matter sources based on a forward model of how brain activity can give rise to observed scalp potentials, and an additional smoothness constraint (to account for the fact that larger contiguous cortical activations are more likely to be observable at the scalp). These putative sources can then be mapped in Talairach space (Pascual-Marqui, 1999). In the current context, the goal of this analysis is to establish the potential sources of activation for scalp maps known to differ significantly between groups based on topographic analysis, rather than to establish a statistical difference between groups in source location.
Results
Behavioral Data
Whereas native English speakers were nearly perfect in discriminating the two sounds from one another, native Japanese speakers were much less accurate in the same/different judgment task (“not sure” responses accounted for less than 1% of all responses for both groups and were treated as errors). Each participant’s d′ was computed (with a correction of 0.0001 for values of 0 and 1, yielding a maximum value of 7.44). The distribution of d′ scores shown in Figure 2 shows that all but three native English speakers had near perfect sensitivity, whereas only three of 20 native Japanese speakers in this range, W = 274, p < 0.001, although all of the JL1 participants were well above chance.
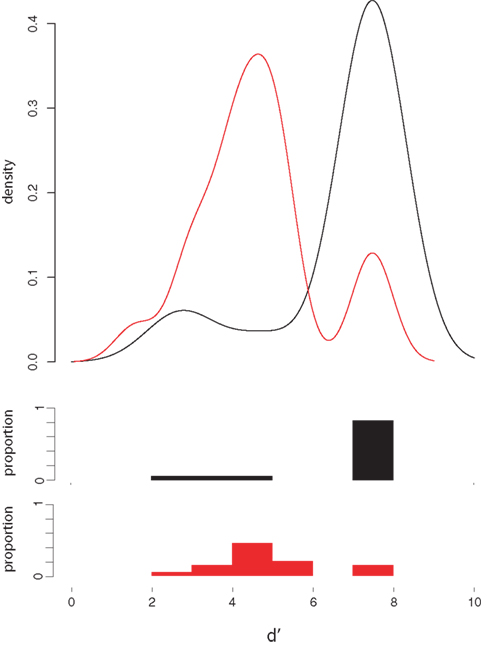
Figure 2. d′ Analysis of behavioral discrimination results. Density plots (top) and the corresponding histograms of d′ scores for native English speakers (black lines and bars) and native Japanese speakers (red lines and bars).
Mismatch Negativity
Waveform analyses using composite Fz
Figure 3 shows the grand mean waveforms at Fz (based on the mean of six electrodes, as described above) for native and non-native English speakers. A strong MMN was observed for both groups, which was slightly larger for native English speakers, and had a slightly earlier peak for native Japanese speakers. However, neither peak amplitude nor peak latency differed reliably between the two groups (ts < 1, see Figure 4 for distributions); there were also no differences in GFP, t < 1.
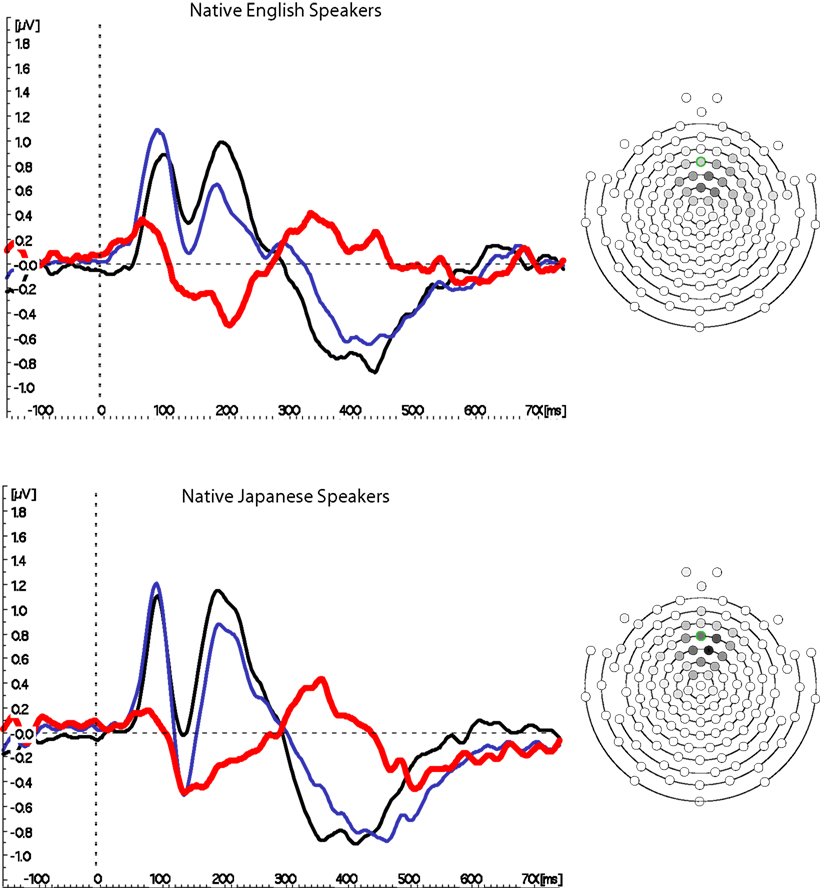
Figure 3. Mismatch negativity waveforms from Fz. Grand mean waves from fronto-central location Fz are shown on the left for the Standard (black) and Deviant (blue) conditions, as well as the difference between them (colored red) for native English and Japanese speakers. The MMN is clearly visible in the difference wave between 150 and 250 ms for both groups. A schematic diagram of the electrode array is shown on the right, with each electrode colored in grayscale to indicate the proportion of participants for whom it was used in the average. The electrode outlined in green is the nominal equivalent of Fz, according to measurements taken by Luu and Ferree (2000).
For Japanese subjects, correlations were examined between amplitude and latency of the MMN and AOA in the United States. No significant relationship was found in correlations of MMN latency or amplitude with AOA, length of residence, or percentage use. A significant correlation was found, however, between latency of the MMN and performance on the discrimination task (d′ measures, plotted in Figure 4), t(14) = 3.64, p < 0.005, such that longer MMN latencies were associated with greater selectivity in this task, even when two outlier participants with perfect d′ scores were excluded, t(12) = 2.275, p < 0.05.
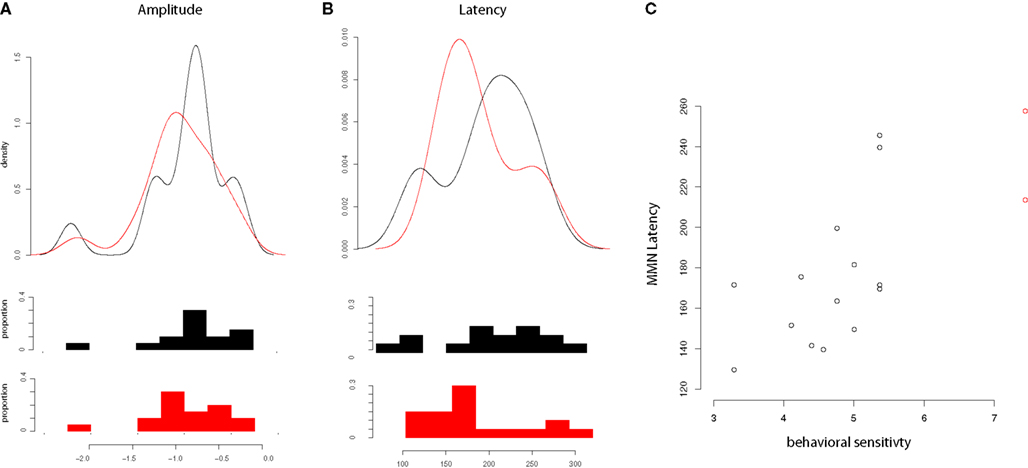
Figure 4. Mismatch negativity amplitude, latency and relationship of latency to d′. (A) Distributions of MMN amplitudes for English (black) and Japanese (red) speakers; (B) Distributions of MMN latencies for English (black) and Japanese (red) speakers; (C) Relationship of MMN latency to d′ (Japanese speakers only), with two outlying values of d′ labeled in red.
Latency and laterality effects in analyses with F3/F4 and mastoids
A three-way interaction of Group × Site × Time was observed, F(9,342) = 2.42, p < 0.05 driven by two features of the data: (1) an overall earlier MMN for native Japanese speakers, and (2) the reversal in polarity between frontal and mastoid electrodes (see Figure 5). An interaction of Site with Time was also observed, F(9,342) = 8.05, p < 0.001, also driven by the reversal in polarity between different levels of Site.
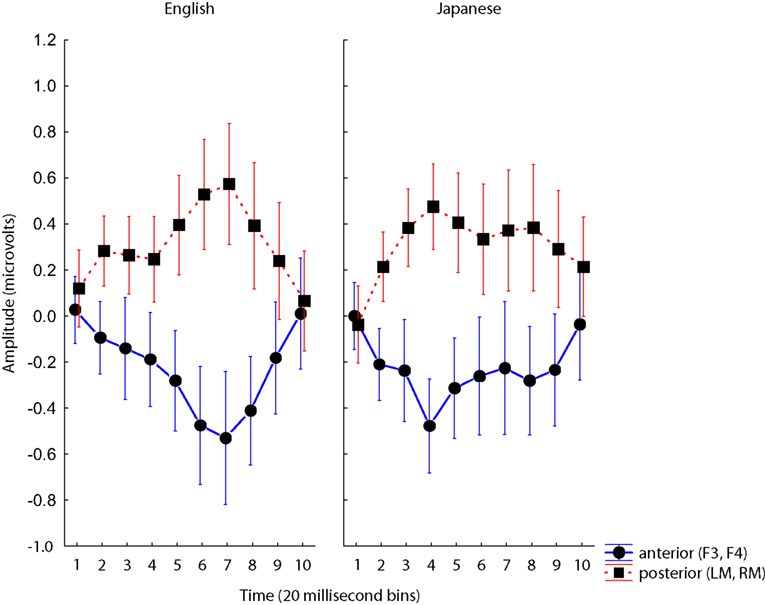
Figure 5. Group × Site × Time interaction for analyses of F3/4 and mastoids. Voltages at anterior (blue) and posterior (red) electrodes plotted for ten 20 ms time bins for each Group, and for each Standard. Error bars are standard error.
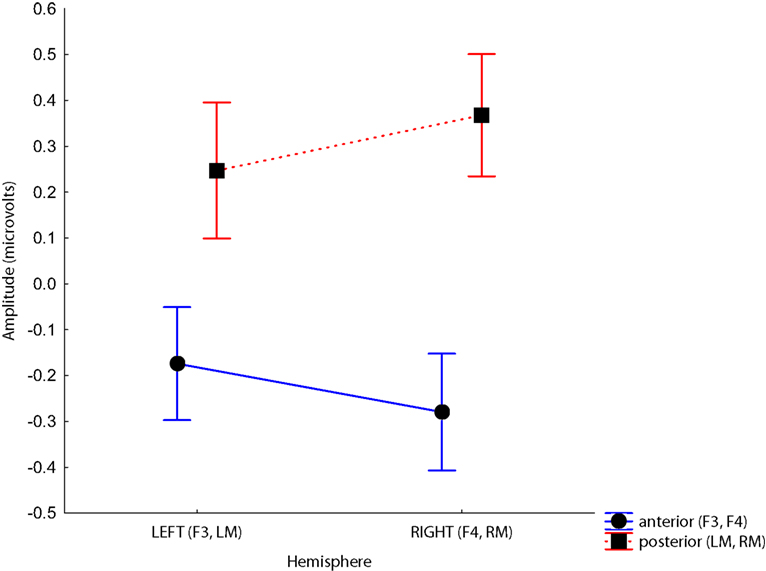
Figure 6. Site × Hemisphere interaction. Voltages at anterior sites are more negative, and voltages at posterior sites are more positive in the right hemisphere. Time bins represent post-stimulus times between 100 and 300 ms.
Although we predicted differences in laterality between groups, there were no significant interactions involving Hemisphere and Group. The only significant interactions involving Hemisphere were with Site, F(1, 38) = 21.84, p < 0.001, driven by the larger difference between the anterior and posterior sites on the right than the left, and Time, F(9,342) = 9.45, p < 0.001, which is difficult to interpret because it collapses negative frontal activity with positive activity observed at mastoids. These analyses were optimized to observe laterality differences by selecting electrode sites that cross the midline and are known to show the strongest MMN response (confirmed in our data, see Figures S1 and S2 in Supplementary Material for waveforms from a larger array of electrodes equivalent to the 10/20 system). These analyses consider only 4 of 128 electrodes from which data were collected, however. It is possible that a more sophisticated topographic analysis that takes the full spatial extent of the data into account would reveal differences that are invisible to this approach.
Topographic analyses
To identify time periods for topographic analysis of the MMN, a TANOVA was computed comparing topographies to standards and deviants. As shown in Figure 7, two overlapping windows were found during which there was a significant difference between deviant and standard stimuli for both groups, 130–264 ms, consistent with the MMN and 330–384 ms, consistent with a P3a component. Although there were no significant effects in the MANOVA, a planned univariate test on the centroid locations in the left–right dimension revealed a difference in lateralization during the earlier segment, F(1,38) = 5.288, p < 0.05. No group differences were significant for other dimensions, nor in a separate analysis of the later segment. No significant correlations were observed between laterality and biographical variables. Thus, the only significant difference between groups in the topographic analyses was a difference in the laterality of the MMN response. The centroid locations and topographies are consistent with bilateral, posterior generators for both groups, with a stronger response on the left than the right for native English speakers, and the opposite laterality for Japanese speakers. This was further investigated with source analyses using LORETA.
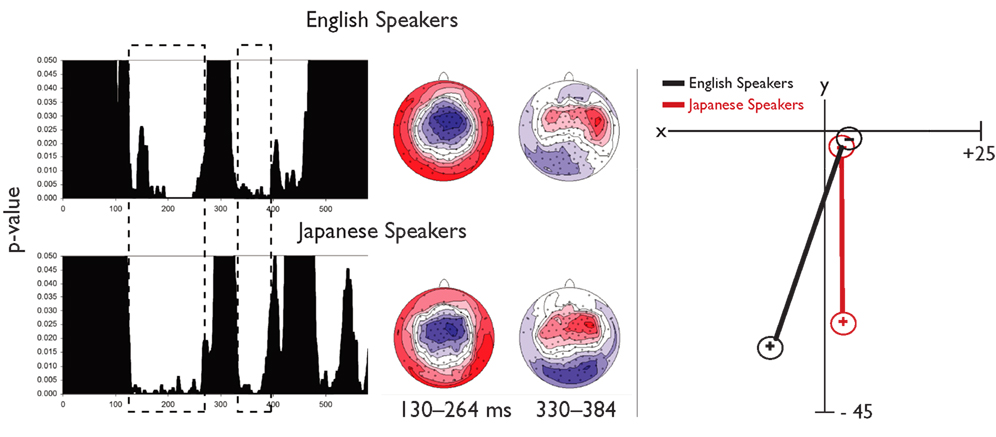
Figure 7. Topographic analyses of scalp EEG for the MMN. The left panel shows results from two TANOVAs (one each for native English speakers and native Japanese speakers) with dashed boxes indicating overlapping time periods during which a significant difference in topography between deviant and standard was observed for both groups. Topographies for the earliest time window (consistent with typical MMN) and the later time window (consistent with a P3) are also shown. In the right panel, results of the centroid analyses are plotted in two dimensions of Talairach space.
Source localization
The LORETA solution for the MMN time window for both groups, shown in Figure 8 reflects bilateral activity of the posterior superior temporal gyri. Different maximal sources were identified for the two groups: For native English speakers the peak activity was in left posterior STG (−59, −32, 15 in Talairach space), consistent with earlier studies localizing the phonetic MMN, whereas the solution for native Japanese speakers is more right-lateralized (60, −39, 8) consistent with localization of non-phonetic MMN.
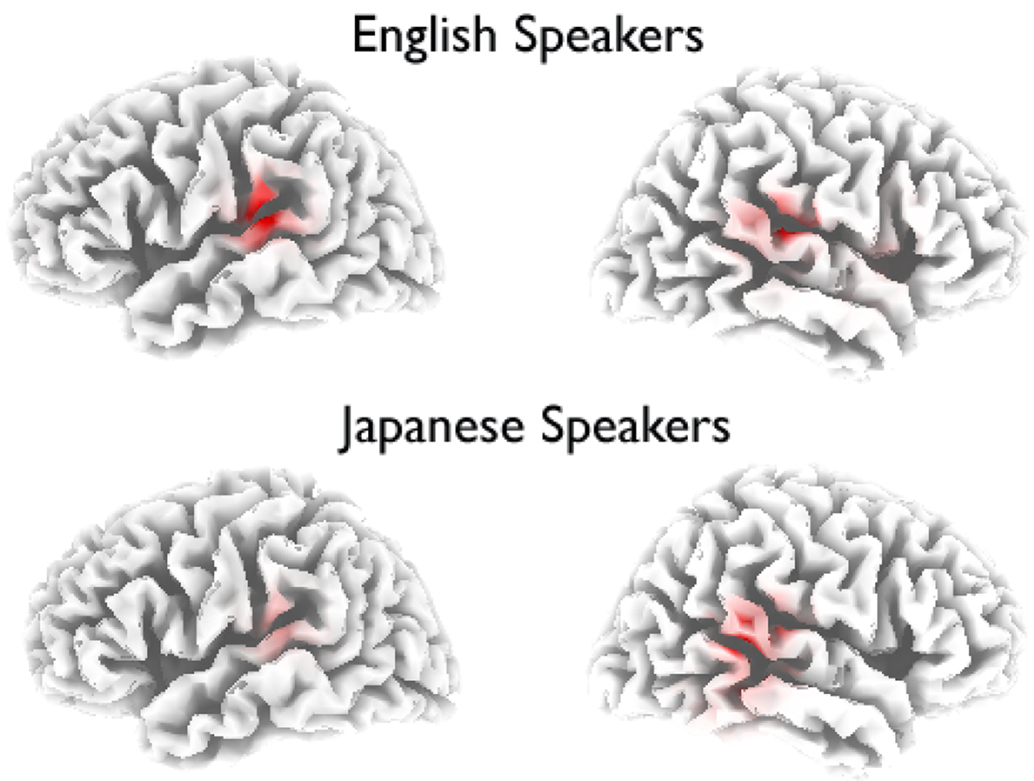
Figure 8. Source analysis of the MMN. LORETA solutions for native English speakers and native Japanese speakers, thresholded to p < 0.0005.
Discussion
Behavioral and electrophysiological responses to speech contrasts were influenced by early language experience. Native Japanese speakers were well above chance in discriminating /la/ from /ra/, but were nonetheless much less accurate than native English speakers, despite years of immersive exposure in an English-speaking environment, and relatively high proficiency with English overall. Interestingly, standard waveform analyses of the MMN did not reveal strong differences between groups, consistent with previous research suggesting that the MMN can be highly plastic (Winkler et al., 1999). This was true whether waveform analyses were conducted on single electrodes, using averages of multiple electrodes, selected to reflect the peaks of obligatory waves. When topographic analyses were conducted using canonical electrode locations (F3/4, mastoids), significant group differences in the timing of the MMN were revealed in an interaction between time and group – with a larger response earlier for the JL1 participants. When a more thorough topographic analyses topographic analysis was conducted, however, consideration of the full dense array of electrodes revealed small but consistent effects of language experience: MMN topographies suggested that the probable cortical sources for the English sounds /ra/ and /la/ were less left-lateralized for Japanese speakers than for native English speakers. This was confirmed using source analysis techniques.
Amplitude and Latency of the MMN
There were no differences in the size of the MMN between groups in any of the analyses. This is in contrast with what is widely observed for differences between unfamiliar non-native speech contrasts and native contrasts, i.e., large differences in amplitude measured at the fronto-central electrode Fz (Aaltonen and lang, 1997; Dehaene-Lambertz, 1997; Näätänen et al., 1997; Tremblay et al., 1997; Szymanski et al., 1999; Dehaene-Lambertz et al., 2000; Sharma and Dorman, 2000; Peltola et al., 2003; Shestakova et al., 2003; Peltola and Aaltonen, 2005; Ylinen et al., 2006; Rinker et al., 2010), but consistent with what has been observed for L2 speakers that have been immersed in their non-native language for significant periods of time (Winkler et al., 1999). One striking difference between the MMN for English and Japanese participants is that the peak is somewhat earlier for the non-native listeners. This effect is clearly visible in the Fz waveforms (Figure 3, see also distribution in Figure 4) and is supported by a group by site by time interaction in the four-electrode ANOVA. Latency differences have been inconsistent in previous studies; for example, Zhang et al. (2005) reported latency differences consistent with those reported here (for naïve Japanese listeners tested on the same contrast) whereas other studies have not found obvious latency differences in the MMN (e.g., Winkler et al., 1999; although note that we did not find effects when only peak latency was analyzed, as in that study). The correlation between MMN latency and selectivity in the behavioral task suggests that this difference may have some functional significance, however: having a later peak MMN was associated with higher accuracy in the behavioral task.
Laterality of the MMN
The gross topography – fronto-central negativity and posterior/temporal positivity – of the MMN was similar between native English and Japanese speakers. Subtle differences in laterality were observed, however, indicating a response with a positive pole on the left and a negative pole on the right for native English speakers and a more balanced, right-lateralized response for Japanese speakers. While this pattern is clearly visible in depictions of the data that take the full array of electrodes into account (Figure 7), and was significant in centroid analyses that are sensitive to patterns of activity that are diffused over a wide area, it was not detectable by analyses that relied on standard landmark electrodes, suggesting an important role for more comprehensive topographic analyses in evaluating differences in the MMN between language groups.
Using LORETA, we confirmed that the most likely sources for both EL1 and JL1 participants were bilateral superior temporal and inferior parietal cortices, and that the stronger source was likely on the left for EL1 participants, but on the right for JL1 participants. Source localization of the MMN and MMNm has previously revealed evidence for left lateralization for native-language speech contrasts (Alho et al., 1998; Maurer et al., 2003b; but see Jaramillo et al., 2001), in contrast to the MMN for non-speech stimuli, which is typically right-lateralized (Paavilainen et al., 1991; Levänen et al., 1996). Laterality differences are particularly striking in studies that directly compare speech and non-speech stimuli (Rinne et al., 1999; Shtyrov et al., 2000, 2005; Takegata et al., 2004; Becker and Reinvang, 2007; see Tervaniemi and Hugdahl, 2003 for review). Furthermore, studies that have directly contrasted the MMN elicited by native and unfamiliar non-native contrasts thus far suggest that the MMN for native contrasts is more left-lateralized (Näätänen et al., 1997; Shestakova et al., 2002; Zhang et al., 2005, Experiment 1, but see Experiment 2; Kirmse et al., 2008). Thus, the laterality differences observed between English and Japanese speakers in the current study may be interpreted as reflecting differences in the degree to which the speech contrasts are treated as phonetic during pre-attentive processing, although this inference could be strengthened in future research by direct within-subjects comparisons including non-speech or native-language contrasts for the Japanese speakers.
MMN, Metabolic Measures of Change Detection and the Temporal–Parietal Junction
One motivation for conducting source analysis is to facilitate comparison with results from metabolic imaging studies, and the sources identified in the current study are in fact similar to what has been observed in fMRI studies of phonemic change detection. A meta-analysis of fMRI and PET studies designed explicitly to observe passive responses similar to the MMN (Celsis et al., 1999; Tervaniemi et al., 2000; Jacquemot et al., 2003; Dehaene-Lambertz et al., 2005; Zevin and McCandliss, 2005; Joanisse et al., 2007) conducted by Zevin et al. (2010) revealed a consensus activation somewhat medial and superior (tal = −40, −33, 20) relative to the peak response identified in the current analyses of native English speakers. This difference is plausibly within the error that might be expected due to the inherently low spatial resolution of EEG data. A more serious difference between data from the two imaging modalities is that laterality is relative in MMN data (bilateral, but stronger on the left) whereas in fMRI studies, right hemisphere homologues of the left temporal–parietal change detection regions are rarely activated. This may be due to differences in the goals of data analyses undertaken in typical fMRI and source-localization studies, in particular, the relatively stringent criteria used to guard against false positives in fMRI analyses. Interestingly, functional connectivity analyses in Zevin et al. (2010) show strong correlation between regions identified in change-detection experiments and their right homologues. Finally, we note that the source analyses conducted here did not provide any evidence for a frontal generator, a finding that has been inconsistent in LORETA analyses of the MMN (see review in Deouell, 2007).
Conclusions
Because it begins so soon after stimulus presentation, and because it can be elicited in the absence of an overt task, the MMN is often treated as an index of perceptual abilities (Näätänen et al., 2001). Differences in properties of the MMN to the same stimuli between groups can be interpreted as reflecting differences in pre-attentive perceptual processes (Näätänen et al., 1997). Previous studies have, however, been inconclusive with respect to whether experienced, relatively proficient speakers of a second language differ from native speakers in the MMN to speech contrasts in that language (Winkler et al., 1999). The current data provide some insight into why this has been so. Although no differences were observed in waveform analyses of the MMN, topographic and source analyses of the same time window revealed clear differences between native and non-native speakers in the laterality of this response, demonstrating an advantage for topographic analyses in characterizing subtle population differences related to language experience, and suggesting an intriguing direction for further research.
Conflict of Interest Statement
The authors declare that the research was conducted in the absence of any commercial or financial relationships that could be construed as a potential conflict of interest.
Acknowledgments
This research was supported by the National Institute on Deafness and Communication Disorders (R01-DC007694), the McDonnell Foundation (Brain-CPR Network), and the Swiss National Science Foundation (Fellowship for Prospective Researchers: Urs Maurer). We thank Eva Hulse for her help with data collection and Alicia Granstein for her help with preprocessing for the waveform analyses.
References
Aaltonen, O., and Lang, A. (1997). The amplitude of mismatch negativity (MMN) reflects discrimination and categorization performance of complex auditory stimuli. Int. J. Psychophysiol. 25, 50.
Alho, K., Connolly, J., Cheour, M., Lehtokoski, A., Huotilainen, M., Virtanen, J., Aulanko, R., and Ilmoniemi, R. (1998). Hemispheric lateralization in preattentive processing of speech sounds. Neurosci. Lett. 258, 9–12.
Becker, F., and Reinvang I. (2007). Mismatch negativity elicited by tones and speech sounds: changed topographical distribution in aphasia. Brain Lang. 100, 69–78.
Berg, P., and Scherg, M. (1994). A multiple source approach to the correction of eye artifacts. Electroencephalogr. Clin. Neurophysiol. 90, 229–241.
Boersma, P. (1996/2001). Praat. Software freely available at: http://www.fon.hum.uva.nl/praat/.
Bradlow, A., Pisoni, D., Akahane-Yamada, R., and Tohkura, Y. (1997). Training Japanese listeners to identify English /r/ and /l/ 4. Some effects of perceptual learning on speech product. J. Acoust. Soc. Am. 101, 2299–2310.
Callan, D., Jones, J., Callan, A., and Akahane-Yamada, R. (2004). Phonetic perceptual identification by native- and second-language speakers differentially activates brain regions involved with acoustic phonetic processing and those involved with articulatory-auditory/orosensory internal models. Neuroimage 22, 1182–1194.
Celsis, P., Boulanouar, K., Doyon, B., Ranjeva, J. P., Berry, J., Nespoulous, I., and Chollet, F. (1999). Differential fMRI responses in the left posterior superior temporal gyrus and left supramarginal gyrus to habituation and change detection in syllables and tones. Neuroimage 9, 135–144.
Dehaene-Lambertz, G. (1997). Electrophysiological correlates of categorical phoneme perception in adults. Neuroreport 8, 919–924.
Dehaene-Lambertz, G., Dupoux, E., and Gout, A. (2000). Electrophysiological correlates of phonological processing: a cross-linguistic study. J. Cogn. Neurosci. 12, 635–647.
Dehaene-Lambertz, G., Pallier, C., Serniclaes, W., Sprenger-Charolles, L., Jobert, A., and Dehaene, S. (2005). Neural correlates of switching from auditory to speech perception. Neuroimage 24, 21–33.
Deouell, L. Y. (2007). The frontal generator of the mismatch negativity revisited. J. Psychophysiol. 21, 188–203.
Escera, C., Alho, K., Schröger, E., and Winkler, I. (2000). Involuntary attention and distractibility as evaluated with event-related brain potentials. Audiol. Neurootol. 5, 151–166.
Ferree, T., Luu, P., Russell, G., and Tucker, D. (2001). Scalp electrode impedance, infection risk, and EEG data quality. Clin. Neurophysiol. 112, 536–544.
Holmes, A. P., Blair, R. C., Watson, J. D., and Ford, I. (1996). Nonparametric analysis of statistic images from functional mapping experiments. J. Cereb. Blood Flow Metab. 16, 7–22.
Jacquemot, C., Pallier, C., LeBihan, D., Dehaene, S., and Dupoux, E. (2003). Phonological grammar shapes the auditory cortex: a functional magnetic resonance imaging study. J. Neurosci. 23, 9541–9546.
Jaramillo, M., Ilvonen, T., Kujala, T., Alku, P., Tervaniemi, M., and Alho, K. (2001). Are different kinds of acoustic features processed differently for speech and non-speech sounds? Cogn. Brain Res. 12, 459–466.
Joanisse, M. F., Zevin, J. D., and McCandliss, B. D. (2007). Dishabituation of the BOLD response to within- and between-category acoustic change. Cereb. Cortex 17, 2084–2093.
Kirmse, U., Ylinen, S., Tervaniemi, M., Schröger, E., and Jacobsen, T. (2008). Modulation of the mismatch negativity (MMN) to vowel duration changes in native speakers of Finnish and German as a result of language experience. Int. J. Psychophysiol. 67, 131–143.
Koelsch, S., Schroger, E., and Tervaniemi, M. (1999). Superior pre-attentive auditory processing in musicians. Neuroreport 10, 1309–1313.
Kuhl, P. K., Stevens, E., Hayashi, A., Deguchi, T., Kiritani, S., and Iverson, P. (2006). Infants show a facilitation effect for native language phonetic perception between 6 and 12 months. Dev. Sci. 9, F13–F21.
Kwon, M., Kujala, T., Huotilainen, M., Shestakova, A., Näätänen, R., and Hämäläinen, H. (2009). Preattentive auditory information processing under exposure to the 902 MHz GSM mobile phone electromagnetic field: a mismatch negativity (MMN) study. Bioelectromagnetics 30, 241–248.
Lehmann, D., and Skrandies, W. (1980). Segmentation of EEG potential fields. Electroencephalogr. Clin. Neurophysiol. 38, 27–32.
Lehmann, D., Strik, W., Henggeler, B., Koenig, T., and Koukkou, M. (1998). Brain electric microstates and momentary conscious mind states as building blocks of spontaneous thinking: I. Visual imagery and abstract thoughts. Int. J. Psychophysiol. 29, 11.
Levänen, S., Ahonen, A., Hari, R., McEvoy, L., and Sams, M. (1996). Deviant auditory stimuli activate human left and right auditory cortex differently. Cereb. Cortex 6, 288–296.
Luu, P., and Ferree, T. (2000). Determination of the Geodesic Sensor Nets Average Electrode Positions and Their 10–10 International Equivalents. Technical Note. Eugene, OR: Electrical Geodesics, Inc.
Maurer, U., Bucher, K., Brem, S., and Brandeis, D. (2003a). Altered responses to tone and phoneme mismatch in kindergartners at familial dyslexia risk. Neuroreport 14, 2245–2250.
Maurer, U., Bucher, K., Brem, S., and Brandeis, D. (2003b). Development of the automatic mismatch response: from frontal positivity in kindergarten children to the mismatch negativity. Clin. Neurophysiol. 114, 808–817.
Murray, M., Brunet, D., and Michel, C. (2008). Topographic ERP analyses: a step-by-step tutorial review. Brain Topogr. 20, 249–264.
Näätänen, R., Lehtokoski, A., Lennes, M., Cheour, M., Huotilainen, M., Iivonen, A., Vainio, M., Alku, P., Ilmoniemi, R., Luuk, A., Allik, J., Sinkkonen, J., and Alho, K. (1997). Language-specific phoneme representations revealed by electric and magnetic brain responses. Nature 385, 432–434.
Näätänen, R., Tervaniemi, M., Sussman, E., Paavilainen, P., and Winkler, I. (2001). “Primitive intelligence” in the auditory cortex. Trends Neurosci. 24, 283–288.
Paavilainen, P., Alho, K., Reinikainen, K., Sams, M., and Näätänen, R. (1991). Right-hemisphere dominance of different mismatch negativities. Electroencephalogr. Clin. Neurophysiol. 78, 466–479.
Pascual-Marqui, R. (1999). Review of methods for solving the EEG inverse problem. Int. J. Bioelectromagn. 1, 75–86.
Pascual-Marqui, R. D., Michel, C. M., and Lehmann, D. (1994). Low resolution electromagnetic tomography: a new method for localizing electrical activity in the brain. Int. J. Psychophysiol. 18, 49–65.
Peltola, M., Kujala, T., Tuomainen, J., Ek, M., Aaltonen, O., and Näätänen, R. (2003). Native and foreign vowel discrimination as indexed by the mismatch negativity (MMN) response. Neurosci. Lett. 352, 25–28.
Peltola, M. S., and Aaltonen, O. (2005). Long-term memory trace activation for vowels depends on the mother tongue and the linguistic context. J. Psychophysiol. 19, 159–164.
Pulvermüller, F., and Shtyrov, Y. (2006). Language outside the focus of attention: the mismatch negativity as a tool for studying higher cognitive processes. Prog. Neurobiol. 79, 49–71.
Rinker, T., Alku, P., Brosch, S., and Kiefer, M. (2010). Discrimination of native, and non-native vowel contrasts in bilingual Turkish–German and monolingual German children: insight from the mismatch negativity ERP component. Brain Lang. 113, 90–95.
Rinne, T., Alho, K., Alku, P., Holi, M., Sinkkonen, J., Virtanen, J., Bertrand, O., and Näätänen, R. (1999). Analysis of speech sounds is left-hemisphere predominant at 100–150 ms after sound onset. Neuroreport 10, 1113–1117.
Sharma, A. and Dorman, M. (2000). Neurophysiologic correlates of cross-language phonetic perception. J. Acoust. Soc. Am. 107, 2697–2703.
Shestakova, A., Brattico, E., Huotilainen, M., Galunov, V., Soloviev, A., Sams, M., Ilmoniemi, R., and Naïïanen, R. (2002). Abstract phoneme representations in the left temporal cortex: a magnetic mismatch negativity study. Neuroreport 13, 1813–1816.
Shestakova, A., Huotilainen, M., Ceponiene, R., and Cheour, M. (2003). Event-related potentials associated with second language learning in children. Clin. Neurophysiol. 114, 1507–1512.
Shtyrov, Y., Pihko, E., and Pulvermuller, F. (2005). Determinants of dominance: is language laterality explained by physical or linguistic features of speech. Neuroimage 27, 37–47.
Shtyrov, Y., Kujala, T., Palva, S., Ilmoniemi, R. J., and Näätänen, R. (2000). Discrimination of speech and of complex non-speech sounds of different temporal structure in the left and right cerebral hemispheres. Neuroimage 12, 657–663.
Strik, W., Fallgatter, A., Brandeis, D., and Pascual-Marqui, R. (1998). Three-dimensional tomography of event-related potentials during response inhibition: evidence for phasic frontal lobe activation. Electroencephalogr. Clin. Neurophysiol. 108, 406–413.
Szymanski, M., Yund, E. W., and Woods, D. L. (1999). Phonemes, intensity and attention: differential effects on the mismatch negativity (MMN). J. Acoust. Soc. Am. 106, 3492–3505.
Takegata, R., Nakagawa, S., Tonoike, M., and Naatanen, R. (2004). Hemispheric processing of duration changes in speech and non-speech sounds. Neuroreport 15, 1683–1686.
Talairach, J., and Tournoux, P. (1988). Co-planar Stereotaxic Atlas of the Human Brain. New York: Thieme Medical Publishers.
Tervaniemi, M., and Hugdahl, K. (2003). Lateralization of auditory-cortex functions. Brain Res. Rev. 43, 231–246.
Tervaniemi, M., Medvedev, S. V., Alho, K., Pakhomov, S. V., Roudas, M. S., Van Zuijen, T. L., and Naatanen, R. (2000). Lateralized automatic auditory processing of phonetic versus musical information: a PET study. Hum. Brain Mapp. 10, 74–79.
Tiitinen, H., Sinkkonen, J., May, P., and Naatanen, R. (1994). The auditory transient 40-hz response is insensitive to changes in stimulus features. Neuroreport, 6, 190–192.
Tremblay, K., Kraus, N., Carrell, T., and McGee, T. (1997). Central auditory system plasticity: generalization to novel stimuli following listening training. J. Acoust. Soc. Am. 102, 3762–3773.
Werker, J. F., and Tees, R. C. (2005). Speech perception as a window for understanding plasticity and commitment in language systems of the brain. Dev. Psychobiol. 46, 233–251.
Winkler, I., Kujala, T., Tiitinen, H., Sivonen, P., Alku, P., Lehtokoski, A., Czigler, I., Csepe, V., Ilmoniemi, R., and Näätänen, R. (1999). Brain responses reveal the learning of foreign language phonemes. Psychophysiology 36, 638–642.
Winkler, I., Paavilainen, P., Alho, K., Reinikainen, K., Sams, M., and Naïïanen, R. (1990). The effect of small variation of the frequent auditory stimulus on the event-related brain potential to the infrequent stimulus. Psychophysiology 27, 228–235.
Woodcock, R. W., McGrew, K. S., and Mather, N. (2001). Woodcock-Johnson III. Rolling Meadows, IL: Riverside Publishing.
Yabe, H., Tervaniemi, M., Reinikainen, K., and Naatanen, R. (1997). Temporal window of integration revealed by MMN to sound omission. Neuroreport 8, 1971–1974.
Ylinen, S., Shestakova, A., Huotilainen, M., Alku, P., and Näätänen, R. (2006). Mismatch negativity (MMN) elicited by changes in phoneme length: a cross-linguistic study. Brain Res. 1072, 175–185.
Zevin, J. D., and McCandliss, B. D. (2005). Dishabituation of the BOLD response to speech sounds. Behav. Brain Funct. 1, 4.
Zevin, J. D., Yang, J. F., Skipper, J. I., and McCandliss, B. D. (2010). Domain general change detection accounts for “dishabituation” effects in temporal–parietal regions in fMRI studies of speech perception. J. Neurosci. 30, 1110–1117.
Keywords: speech, second-language speech perception, mismatch negativity, sensitive period, change detection
Citation: Zevin JD, Datta H, Maurer U, Rosania KA and McCandliss BD (2010) Native language experience influences the topography of the mismatch negativity to speech. Front. Hum. Neurosci. 4:212. doi: 10.3389/fnhum.2010.00212
Received: 14 December 2009;
Accepted: 11 October 2010;
Published online: 17 November 2010.
Edited by:
Kenneth Hugdahl, University of Bergen, NorwayReviewed by:
Yury Y. Shtyrov, MRC Cognition and Brain Sciences Unit, UKJyrki Tuomainen, Åbo Akademi University, Finland
Copyright: © 2010 Zevin, Datta, Maurer, Rosania and McCandliss. This is an open-access article subject to an exclusive license agreement between the authors and the Frontiers Research Foundation, which permits unrestricted use, distribution, and reproduction in any medium, provided the original authors and source are credited.
*Correspondence: Jason D. Zevin, Sackler Institute for Developmental Psychobiology, Weill Cornell Medical College, 1300 York Avenue, Box 140, New York, NY 10065, USA. e-mail:amR6MjAwMUBtZWQuY29ybmVsbC5lZHU=