 Sujithra Raviselvam
 Peter Lovei
 Renee Noortman
 Thomas Olsson3
 Kaisa Väänänen
 Mathias Funk
- 1Industrial Design Department, Eindhoven University of Technology, Eindhoven, Netherlands
- 2Philips Design, Philips, Eindhoven, Netherlands
- 3Faculty of Information Technology and Communication Sciences, Tampere University, Tampere, Finland
Introduction: Data-enabled design (DED) is a design approach where research data is integrated with design praxis in an iterative and hands-on fashion, and it has been successfully applied to design for people in the healthcare domain. However, how to utilise DED as a more broadly applicable approach that facilitates design for larger populations in semi-public spaces remains an open question. Understanding the advantages and challenges of applying DED in various contexts is crucial to guide design researchers further and prevent methodological mismatch.
Methods: In this article, we report on applying DED in an open, semi-public context with a large population of visitors. Here, DED was applied in projects with student design researchers who had limited control over the data gathered from people in the context.
Results: We share the results of a two-week design workshop that involved sixteen student design researchers and was organised in collaboration with Särkänniemi, one of Finland’s largest theme parks. Using design proposals and reflections from five teams, we investigate the use of DED in this context, reporting on perceived challenges, barriers, successes and future directions for taking the DED approach into similar (semi-)public contexts.
Discussions: We conclude with reflections from the workshop organisers’ point of view and share the feedback from our industry collaborator, highlighting challenges and opportunities in translating the DED approach to a new domain.
1 Introduction
Data has become an inevitable part of the work of designers and design researchers, from designing new solutions in healthcare (Institute of Design, 2024), to mobility and vitality (Menheere et al., 2021; van Renswouw et al., 2021), to exploring data as a material for the design itself (Gomez Ortega et al., 2022; Lee-Smith et al., 2023). This work has taken different forms and approaches to achieve data-based insights and design research artefacts, from data-inspired or data-centric design to data-enabled and data-driven design, to name a few. Yet, we encounter areas that are new to involving data in design research, such as semi-public spaces that provide more open contexts that deal with diverse types of users. This manuscript probes into one such data design approach called Data-enabled Design (DED). DED is a design approach that uses everyday data as a creative material that informs and shapes the design process and its outcomes. van Kollenburg and Bogers (2019) framed DED as ‘a situated design approach that uses data as creative material when designing for intelligent ecosystems’. Although introduced in 2016 (Bogers et al., 2016), the applications of DED have thus far been within controlled spaces, especially in the healthcare domain, where it has been feasible to follow an individual and the people around them within a known context. The design team would, ideally, have the expertise and resources needed to build and deploy data collection probes and design interventions for this clearly scoped context. However, contexts like public spaces with multiple influencing factors are a relatively new application area for DED. A related example is the work by van den Heuvel et al. (2020), where the authors gathered data from a public playground using DED. They specifically discuss practical hurdles like vandalism, privacy, and technological challenges when collecting data in public spaces. In this paper, we look at applying DED in a semi-public space from a methodological perspective. We aim to address the knowledge gap in applying the DED approach to semi-public spaces guided by the following research questions (RQ):
RQ1: What factors influence design teams that apply DED in public spaces, especially in engaging with the context physically?
RQ2: What are the challenges and future opportunities for applying DED in semi-public spaces?
A summer school collaboration with Tampere University (TAU) and the Särkänniemi amusement park in Finland led to an opportunity to apply DED in a semi-public context. This manuscript shares insights from using the DED approach as part of that summer school, which was focused on fun, yet packed with deeper layers of technology, design, and emotional factors. We were interested in how different factors in a semi-public context with multiple stakeholders would influence the practical implementation of DED. The goal of the summer school was to use the amusement park as a case study to apply DED while using data from everyday contexts and visitor experiences at the park, thereby deriving innovative design directions that the amusement park can use. The summer school was designed closely around the semi-public context, requiring the student design teams (and the instructors) to be physically present in a dynamic context. This allowed us to study the context, experience it, and observe and interact with the people in it on a day-to-day basis. The two research questions focus on the application of data-enabled design as a design research approach in a new context of design and with new data collection and participatory engagement tools. In the remainder of the article, we will first explain the background of this work regarding data-enabled design as the chosen approach and the amusement park context. After that, we will discuss the study method, findings, and interpretation. We conclude this paper with a discussion of our findings and a summary of the results.
2 Background
While a majority of the global population either produces or consumes a huge amount of data on a day-to-day basis (Domo, 2024), only a fraction of the population appears to use that data to derive meaningful insights into life. Data-based design approaches like data-informed design (Huang et al., 2023), data-aware design (Churchill, 2012), data-driven innovation (Luo, 2023), and data-enabled design (van Kollenburg and Bogers, 2019) aim to use data on people, technology, and experiences to drive such meaningful insights (Funk et al., 2024). This section aims to provide a better understanding of data-based approaches, the role of DED and the stages it encompasses, its integration into education, and the context in which this summer school took place.
2.1 Data-* design approaches
Any approach, process, or framework has its intended purposes and aims. For example, data-driven innovation, as stated by Luo (2023), is a recent paradigm that uses big data to guide innovative design directions. Whereas data-aware design focuses more on the data and methods used to work with data and uses it to derive design directions (King et al., 2017). In contrast, data-centric design focuses on producing data either as part of the process or through products (Funk et al., 2024). On the other hand, data-informed design provides some information about the design opportunity (King et al., 2017). Figure 1, extracted from a recent chapter on DED published in the book titled Handbook of Human Computer Interaction (Funk et al., 2024), shows different data-* design methods in relation to each other on two axes: from probe to product and from exploring to informing. The chapter lists the methods on the left side as the ones that use data to support exploratory (stages of) design processes, while the methods on the right as the ones that use data to support design decisions. The methods in the lower half of the figure are aimed at probing experiences, where prototypes are created to understand experiences in a Research through Design manner, while the methods at the top are more suited for creating products with and from the data gathered. The chapter also explains how DED extends over three of the quadrants, where contextual explorations would be positioned at the bottom left quadrant, and more informed explorations move the approach towards the top right.
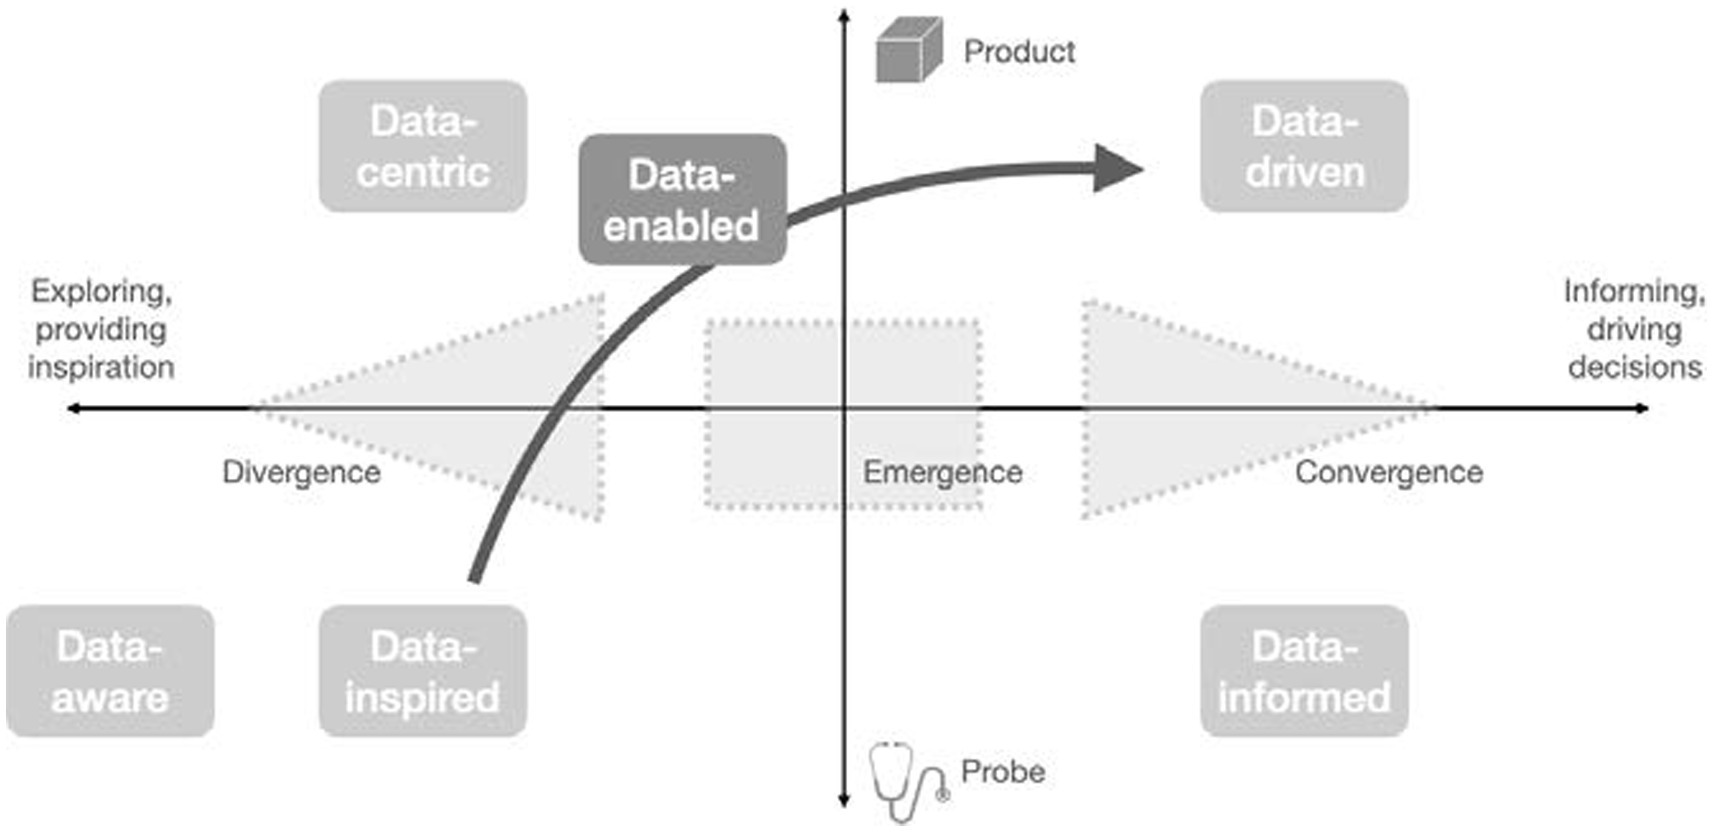
Figure 1. A map of how different data-based approaches can be distinguished. Funk et al. (2024) used with permission of the authors.
Among the approaches that apply data in design, we are more interested in the efforts made to humanise data and make them more than aggregated numbers (Funk et al., 2024). This holistic approach to data makes it, to an extent, a representation of the people who contributed to it and the contexts that shaped their experience (Lee and Ahmed-Kristensen, 2023). Past research shows that it is not a simple task to empathise with the lived experiences of people in a context (Lee and Ahmed-Kristensen, 2023). Hence, designers often choose to co-create with the types of people who may eventually use their designs. Co-creation, too, has its challenges, for instance, in ways to systematically engage people in the design process (Funk et al., 2024), let alone involve them in analysing or making sense of the data. Data-enabled design (DED) bridges this gap between people and design-relevant data. It uses data to communicate with people, prompt them, and facilitate an ongoing discussion of their perspectives.
2.2 Data-enabled design
As mentioned in the introduction, DED is a situated design research approach where data are collected and used for creative explorations that continuously inform and shape design decisions. van Kollenburg and Bogers (2019) proposed DED with eight stages that allow users and designers to collaborate meaningfully. The summer school discussed in this manuscript studies the practicality of adopting the eight stages of DED in a context that is filled with variables and factors that influence people’s experiences. Figure 2 shares the eight stages, starting with prototypes situated in everyday life, enabling users to share data with designers using sensors or smart devices that gather their daily experiences. The collected data inspires qualitative interviews with users. This rich dataset gives designers a complete picture of the design space, allowing them to gain insights continuously and remotely without influencing users. Derive insights into context, behaviour, and experience by working together with the users; the design team and users can decipher data patterns and behaviours using data visualisations motivated by personal and meaningful information. For Design synthesis, they identify specific focus areas worth addressing and inspire new ideas. Through designerly explorations with data as a creative material, the focus areas lead to modifications and updates to initial prototypes and more specific design directions. DED advocates for remote modifications by adapting situated prototypes that allow designers to interpret data from different perspectives, leading to more innovative and effective solutions. Finally, the two loops in the figure refer to the parallel yet tight connection between the situated research that gathers and interprets data and design research that derives insights and builds solutions.
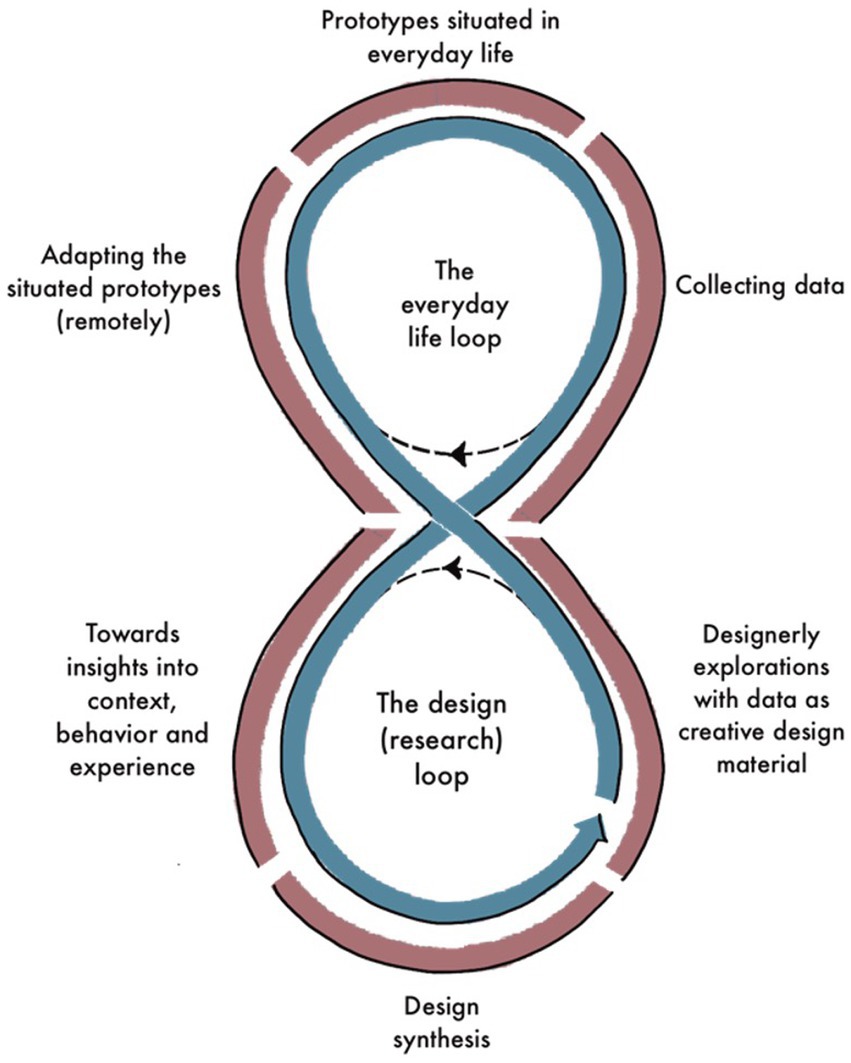
Figure 2. DED loop.
The data used in DED ideally comprises quantitative and qualitative data that provides in-depth contextual information on people’s experiences in that context. Unlike other data-* design approaches, DED leverages data derived from a smaller sample of participants. Qualitative data that emphasise anecdotal experiences and add a personal narrative to explain the outcomes observed in quantitative data are highly valued in DED. This also facilitates a meaningful co-creation with people in context. For example, one of the initial works in DED used a sensor sleeve attached to a baby feeding bottle to collect data on 183 feedings by five participants (Bogers et al., 2016). In addition to quantitative sensor data, the research team conducted 15 interviews and 10 diary studies that provided detailed qualitative input from the participants. Works in DED have thus far focussed on the innovative means of gathering data by building prototypes that adapt to the context (Van Bussel et al., 2022; Cheng et al., 2023) and function as intelligent ecosystems (Lovei et al., 2021; Khanshan et al., 2023). In addition to gathering and using data as a creative source that enables an iterative design approach, DED provides opportunities for meaningful co-creation with the people you design for (Marti et al., 2016). In this paper, we discuss the ways by which the teams at the summer school applied DED in a context where they had to consider the dynamic nature of the context and the diversity of people who experience the context.
3 Design research methodology
Data-enabled design as an approach to contextual design research requires a set of skills and knowledge that is commonly taught through a hands-on approach to data collection, analysis, and ways to use data as creative material for design. Prior knowledge in design research and technology prototyping is a welcome prerequisite for student working in teams for a mix of different skill sets, design backgrounds and individual learning goals. For the summer school, in collaboration with Tampere University (TAU), we adapted this programme and provided a DED experience within a short span of 2 weeks.
This section provides an overview of the summer school, which comprised 16 students grouped into five design teams and an industry client. The overview presents the methods and tools used, context, and structure followed during the summer school and details how they align with the DED approach. Please refer to Appendix C for a detailed breakdown of the schedule followed during summer school, divided based on the space (Studio or Everyday life) and numbered based on the sequence followed each day.
3.1 Study design: DED methods and tools
To apply DED, the students were introduced to a set of methods that were adapted to apply DED within the summer school context. This section provides a brief overview of these methods and tools, from data collection to interviewing with data and analysing opportunities, to finally, using AI for narrative approaches to presenting design interventions.
3.1.1 Data collection in the field
The five teams were introduced to a data infrastructure tailored to the application of data-enabled design in various contexts, Data Foundry.1 This infrastructure was developed at the Industrial Design Department of Eindhoven University of Technology in compliance with the European Union General Data Protection Regulation (GDPR). Data Foundry allows design researchers to collect, store and iterate on data faster and in a process-integrated manner. For this workshop, we explained the main components and functions of Data Foundry, and we introduced the teams to collecting preference data with self-designed mini-surveys, i.e., simple mobile HTML web pages containing a form or other tracked interactions, which would then store structured data into a dataset on the infrastructure. We also explained how the groups could use QR codes or other forms of link sharing to get park visitors to their mini-surveys. Depending on the skills of individual team members, they could either implement their group’s data collection as described above or design hybrid forms of collecting data, e.g., by using rich media intertwined with data collection elements.
Next to this primer on data collection, we also introduced the teams to simple data visualisation and charting tools embedded in the infrastructure. This allowed them to quickly visualise incoming data, monitor their data collection processes and adjust their approach once sufficient or diverging insights were gathered. This introduction session was scheduled for a single hour in the first week of the workshop, and most teams could proceed without any help in the days after.
3.1.2 Data-enabled interviews
Data-enabled interviews are used as a method to gather input from participants of the DED studies based on their collected data. This entails the upfront creation of data visualisations. Appendix B shares two examples of how the collected data could be used to derive insights during the interviews. Based on such visualisations, the design (research) team conducting the studies–the students in the course setup–came up with questions related to them. The visualisations are shared with the participants alongside asking the interview questions. The answers of the participants shed light on gaps in the data (e.g., revealing the circumstances why data are missing). Moreover, data triggers follow-up questions and leads to a more enhanced interview session.
3.1.3 Design methods for creative ideation using data
Drawing from earlier experiences in teaching data-enabled design (Noortman et al., 2022b), we anticipated that making sense of diverse data would be challenging without guidance. Therefore, we introduced techniques that were slightly tuned to the overall setting and to data sense-making.
One of them was mind mapping, which has been used to cohesively cluster, visualise, and link ideas as an interconnected network resembling how our thought process works (Davies, 2011; Zahedi and Heaton, 2016; Bae et al., 2020). Mind mapping can be an effective tool that helps individuals find associations between their ideas. For the summer school, we adapted mind mapping as a tool to guide a data-enabled ideation session among the teams. The aim was to evoke creative design interventions that are guided by data. Figure 3 shows the questions that guided the students. The questions were curated to focus on the data points to help students identify innovative design opportunities.
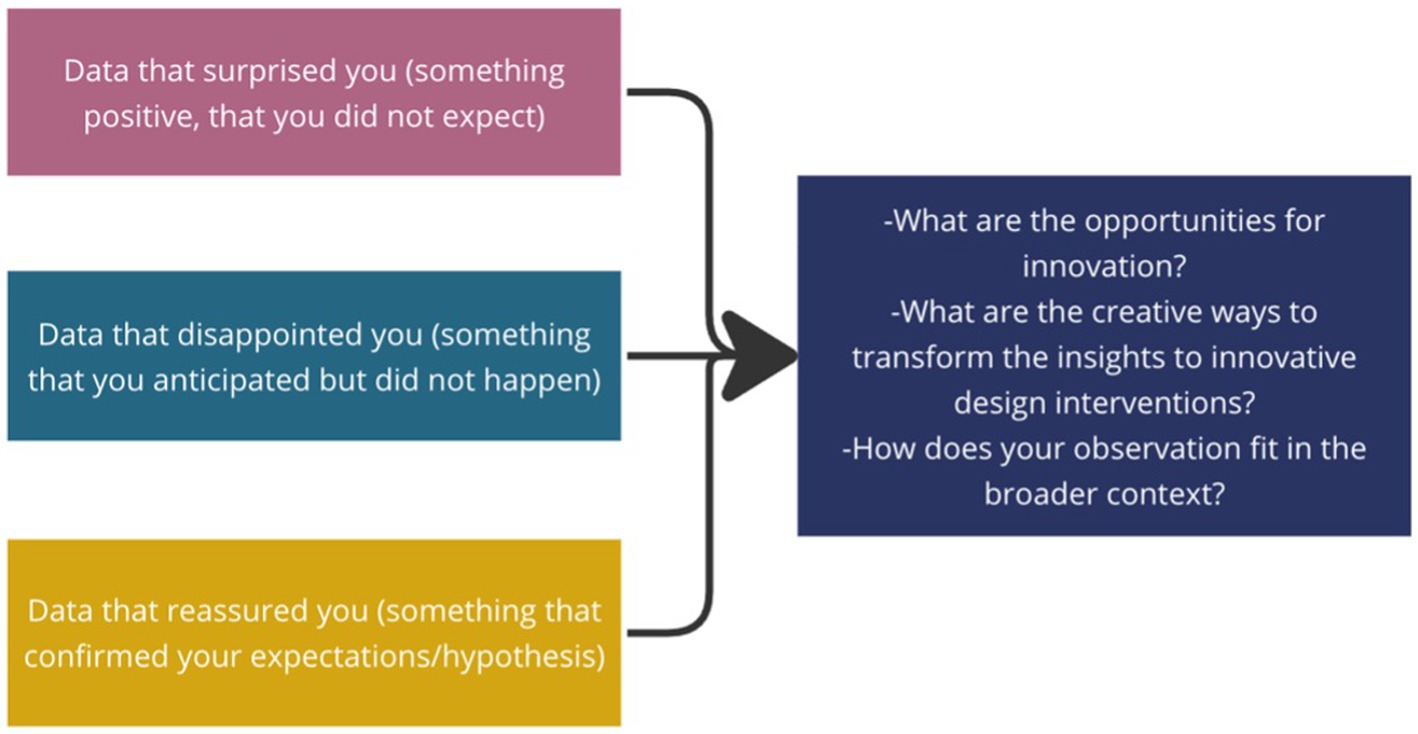
Figure 3. Mind mapping guided by data- adapted for DED.
A second technique was Real-Win-Worth, which is a strategic framework that helps evaluate ideas on their potential to succeed by revealing ‘faulty assumptions and possible risks’ (Lauff et al., 2023). Real-Win-Worth was adapted to strategically embed a data perspective that helps identify potentially successful ideas. Figure 4 shows the sequence of questions used as part of this framework. As shown in the figure, any concept that qualifies through all three lenses (Real, Win, and Worth) have a higher potential to be impactful.
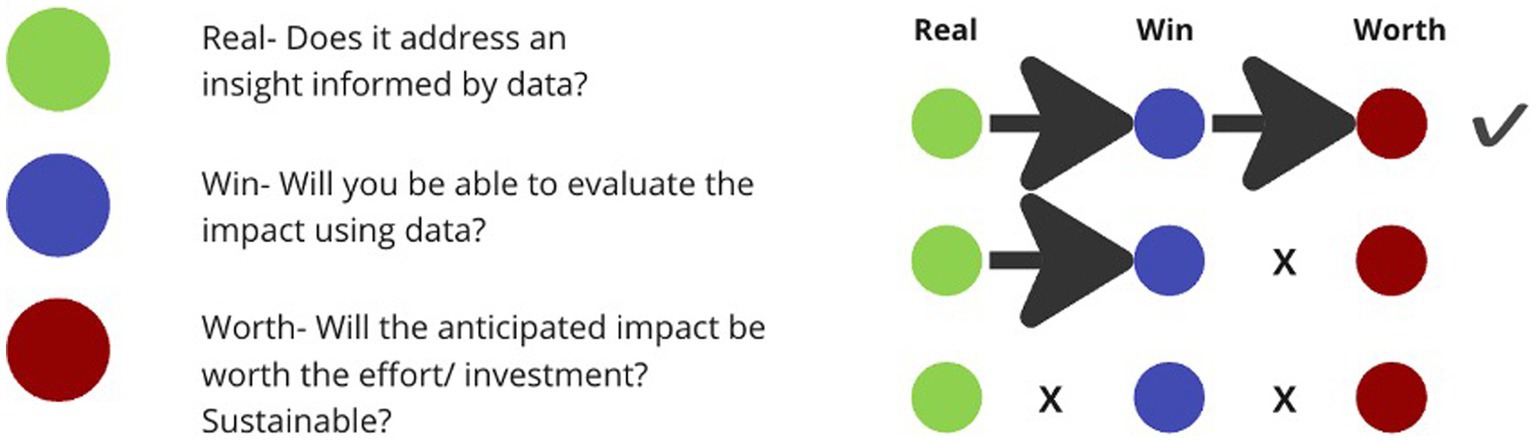
Figure 4. Real-Win-Worth guided by data- adapted for DED.
As a third technique, we introduced the students to data narratives and the use of AI tools in creating narratives. Data-enabled design as a method is largely driven by storeys and narratives that can be constructed based on insights into participants’ experiences inside the context. However, deciding which storeys to extract and emphasise is a subjective process and can be done in a multitude of ways. Van Kollenburg and Bogers have defined design narratives as follows: ‘A design narrative describes a specific storyline that runs through the situated design explorations. It describes a sequence of consecutive insights and design actions’ (van Kollenburg and Bogers, 2019, p. 156).
Besides telling the storeys of participants, narratives also play an important role in sketching scenarios for design interventions and describing future scenarios of how the context might adapt based on the insights. In the second week of summer school, students participated in a workshop about applying narrative techniques in the DED process. After a short lecture about different types of narratives and how to practically build them from collected data, they were invited to write their own narratives. To inspire them and let them think about their envisioned scenarios from new perspectives, they were also provided with a tailor-made AI tool based on OpenAI’s GPT API that assisted them in crafting engaging scenarios. Essentially, the tool allowed the student teams to create narratives in a step-by-step generative process. This splitting up of a single, larger AI-supported task into more manageable units is a common technique to leverage the capabilities of current GPTs more effectively (see Appendix D for a screenshot of the tool).
3.1.4 Design context: Särkänniemi amusement park
Located by the lake of Näsijärvi in Tampere, Finland, Särkänniemi is one of the largest amusement parks in Finland. Generally speaking, Särkänniemi plans to attract more visitors and increase their visitor diversity while retaining them across different seasons, thereby improving their overall revenue. In addition to improving the overall amusement park experience, the staff at Särkänniemi were keen on utilising the park facilities more effectively across all seasons. The CEO, CIO, and other staff members at the amusement park made themselves available for the students to reach out to and provided guidance when needed. The analytics experts at Särkänniemi leverage different forms of data in an advanced manner in making their day-to-day service design decisions, and they were curious about the possible outcomes of different teams applying data-enabled design. The 2-week-long workshop was organised as a summer school, and the participants were given complete access to the amusement park throughout the 2 weeks. They also received training to reach out to the visitors without disrupting their experience. The lectures and group activities were scheduled in the park, which allowed the students to stay close to people and their everyday experience at Särkänniemi. The team from Särkänniemi was present to provide feedback during the midway presentations at the end of week 1 and at the end of the second week for the final design proposals.
3.2 Summer school structure and participants
The summer school had 16 students from the Department of Human-Technology Interaction (HTI) at Tampere University (TAU). They were already familiar with Human-Centred Design (HCD) and related methods, and many of them have work experience in Information Technology (IT). While the participants of the summer school were pursuing a Master’s or PhD degree in HTI, some of them had a non-design background, like psychology and public relations. The TAU and Särkänniemi Amusement Park in Tampere, Finland, hosted the summer school. The overall duration of the summer school was 2 weeks, and the 16 students were divided into five teams comprising three to four students per team. During the summer school, the students learned the theory and practical implementation of data-enabled design (DED), and they also shared their feedback on adapting DED within the 2-week period.
At the beginning of Day 1, the students were informed about this study and requested to sign the consent forms if they were willing to participate. Students were assured they could continue with the summer school even if they were not interested in participating in the study. The students later introduced themselves and shared their expertise. The instructors grouped the students and ensured equal technical and non-technical expertise distribution in each team. The teams later picked a design opportunity based on a list of design opportunities decided by the instructors from TU/e, TAU, and the staff from Särkänniemi. The teams were given 30 min to pick their design opportunity on a first-come, first-serve basis. After this, the teams began their learning journey around data-enabled design in the context of the summer school.
In alignment with the DED approach (Figure 2), the lecture halls at Särkänniemi and Tampere University served as the ‘studio space’ for the students to learn concepts, analyse data, ideate, and iterate their design proposals. Naturally, the amusement park was the everyday life space from which the students collected data. The workshop organisers worked with each student team and walked them through the approach while making note of the challenges the students experienced. On Day 1, the instructors provided each team with a pre-built probe, shown in Figure 5, to record data manually. On the days that followed, the students were given the option to either build their own probes or use the pre-built probe to gather data.
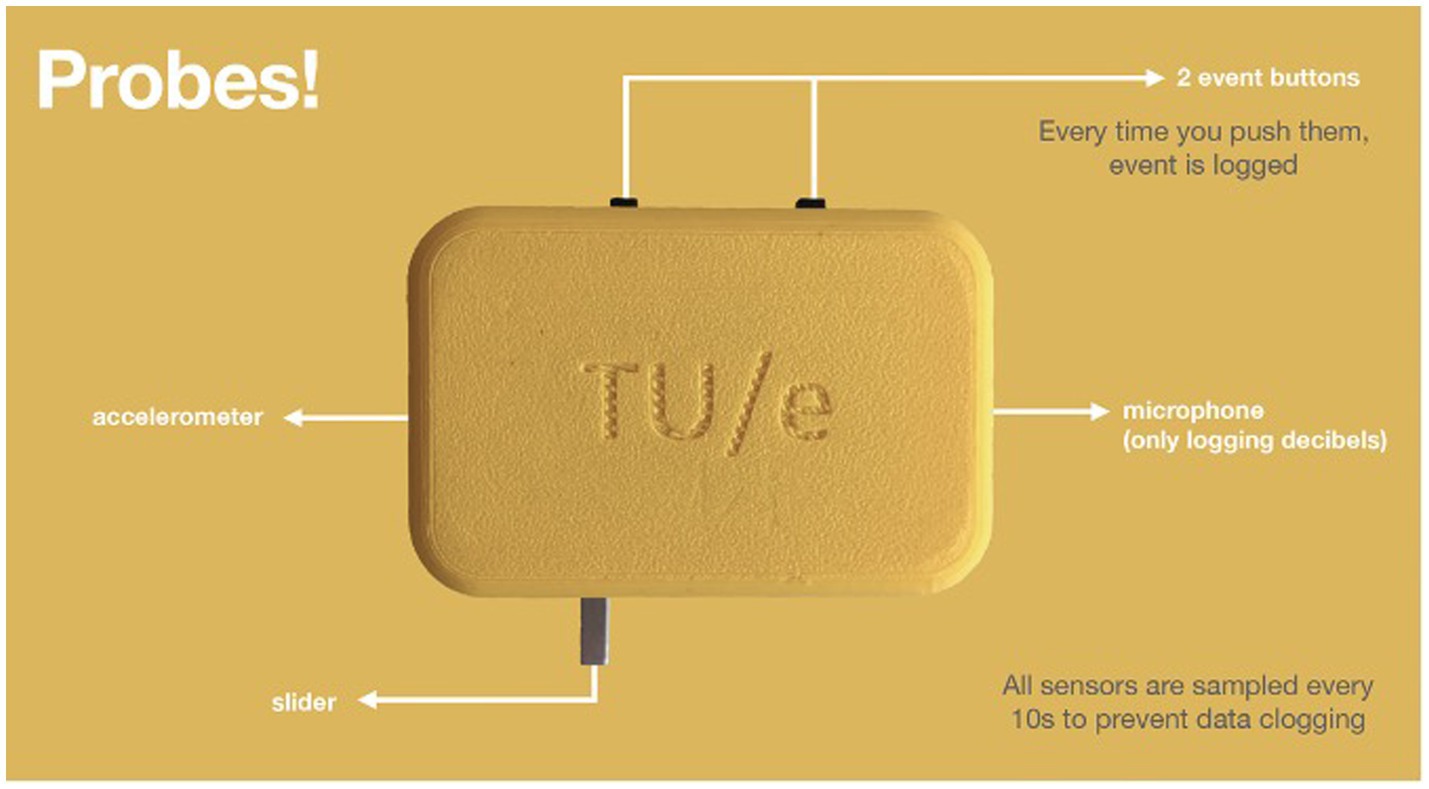
Figure 5. Pre-built probe used during the summer school.
After completing the 2-week summer school, the students were asked to answer an online questionnaire requesting feedback on different aspects of the summer school, like the contents shared, the summer school structure, and the overall takeaways. This included quantitative ratings provided using a five-point Likert scale for each aspect, followed by a more qualitative explanation of their ratings. Such feedback helped us understand the success factors and challenges experienced while implementing DED in the given context. This section shares the insights derived from the quantitative ratings supported by selected qualitative responses shared by the students regarding the DED contents shared at the summer school and the overall takeaways shared by the students.
4 Outcomes
This section shares the summer school outcomes in three sections: (1) five project results and role of data-enabled design, (2) student feedback received after completing the summer school, and (3) client’s reflections. Each section shares details on which data were collected, how it was analysed and which inferences were derived.
4.1 Project results
4.1.1 Design concepts and use of DED principles
4.1.1.1 Data
Each team applied multiple strategies to understand the experiences of the park visitors. For example, one team used data about visitor numbers throughout the year to set up survey questions to understand the reasons behind not visiting the park. Meanwhile, Team 4 explored the experience of international people in the park based on their own (international) experience of being unable to read the predominantly Finnish signs throughout the park. The teams used Mind Mapping and Real-Win-Worth methods to ideate their initial set of concepts. Figure 6 shares an exemplar Mind Map generated by one of the teams, and it shows how the teams explored diverse concepts before they decided on their final design concept. Appendix C shares the sequence and context in which data collection, analysis, and ideation happened during summer school.
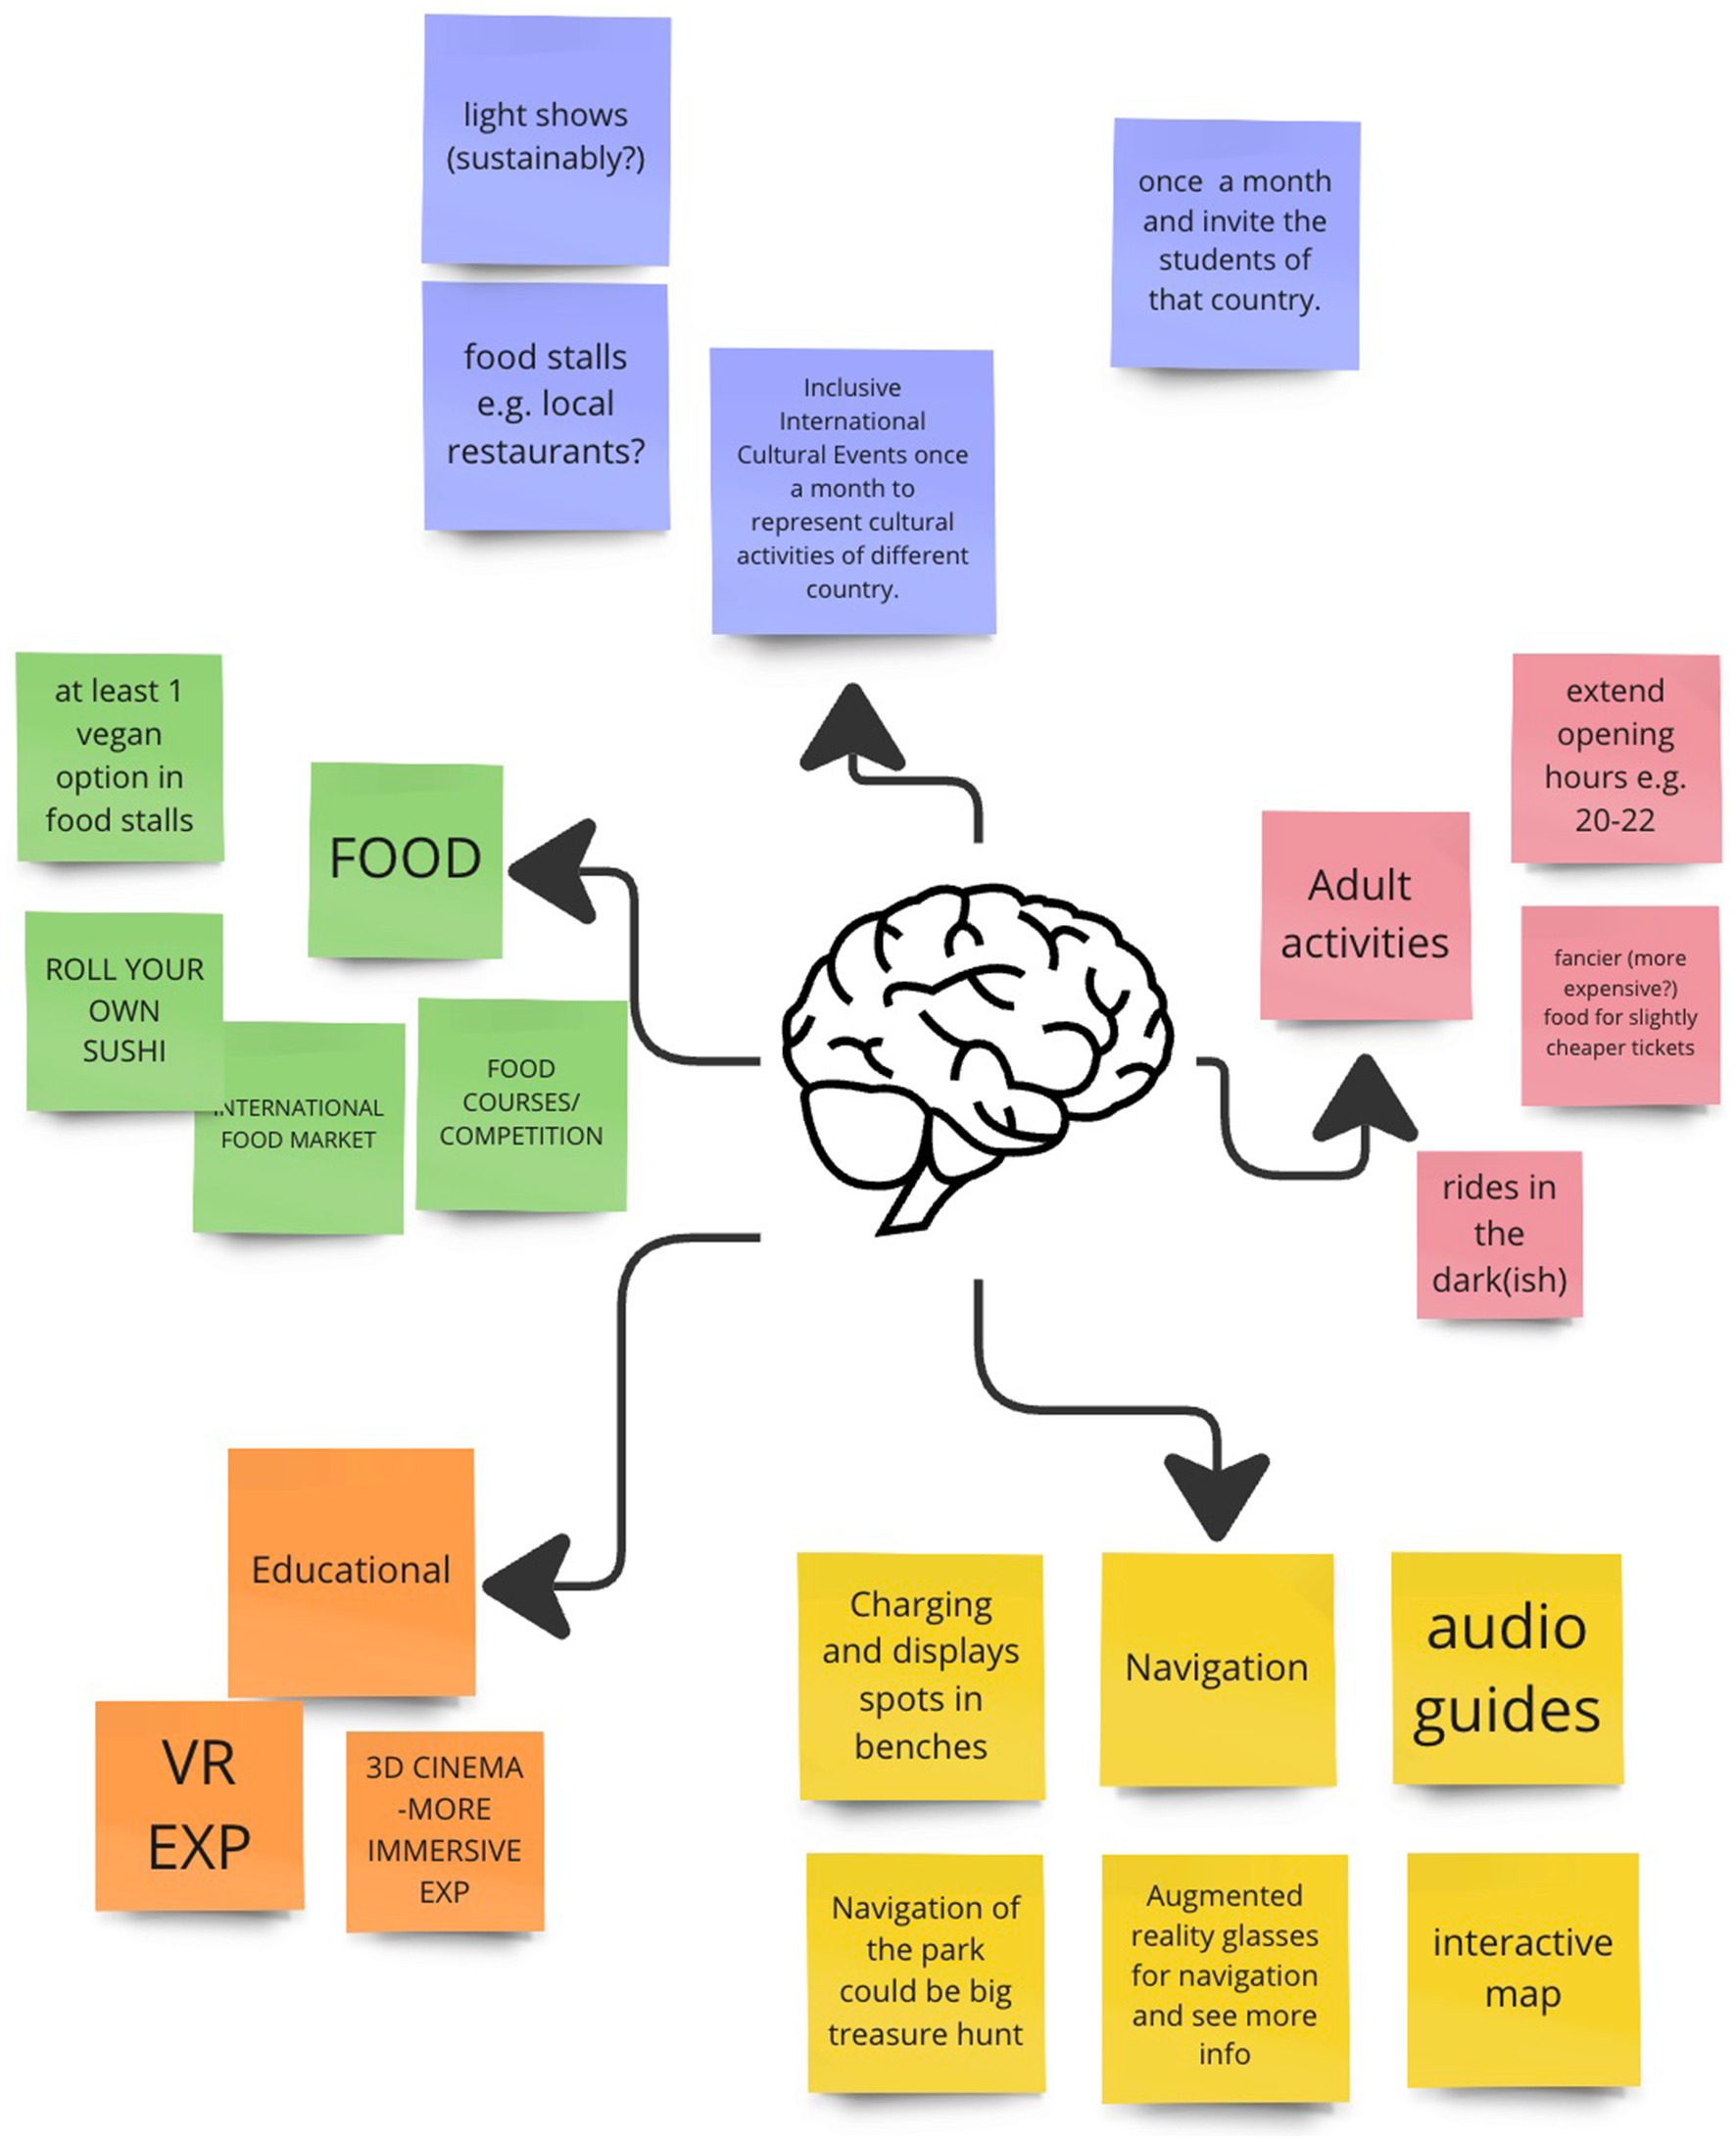
Figure 6. Exemplar Mind Map by one of the teams.
With their background in domains like social sciences, the students employed more ethnographic techniques and interviews than we previously saw, and there was less use of more technical tools such as probes. We also noticed that the students had little difficulty understanding and placing the role of data in their design processes; in some cases, the students found it more difficult to make a process-wise distinction between DED and Design Thinking. Ultimately, the five teams produced five design concepts the amusement park could develop and implement further. Table 1 shows which design opportunity each team chose and a short summary of the corresponding proposed concept. This manuscript refrains from sharing the specific details of the concepts generated by the teams to protect the intellectual rights of the design teams.
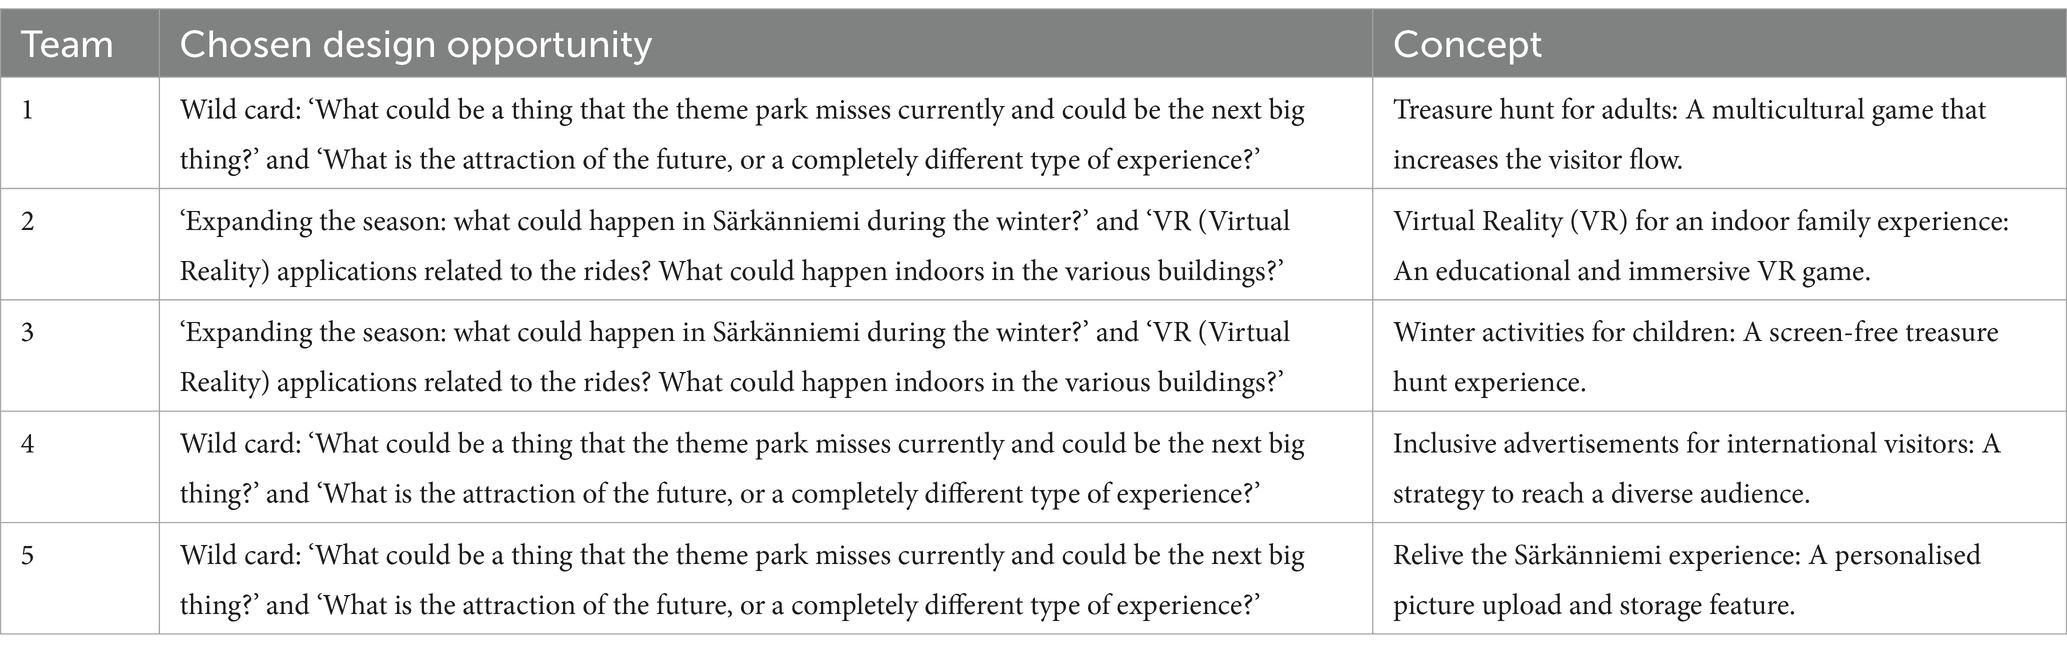
Table 1. Concept proposed by each team and their selected design opportunity.
4.1.1.2 Analysis
It was important for us to see the extent to which each team adapted DED throughout the summer school. As an approachable metric we chose the adoption and use of DED principles in the student teams’ work and processes. Appendix A shares 12 principles that highlight the unique aspects of DED. The 12 principles are derived based on the previous projects that applied DED (Funk et al., 2024). We use these Principles to understand the extent to which the teams adapted DED. Three researchers with expertise in DED (authors 1, 2, and 3) independently provided their rating for the principles implemented by each team. The researchers later discussed their disagreements, iterated on the codes, and attained inter-rater reliability (IRR) scores between 87 and 100% for each principle, as shown in Table 2. The number in each cell indicates the number of researchers who agreed to the given rating; the cells shaded grey indicate that at least two of the three raters agreed that a team applied the corresponding principle.
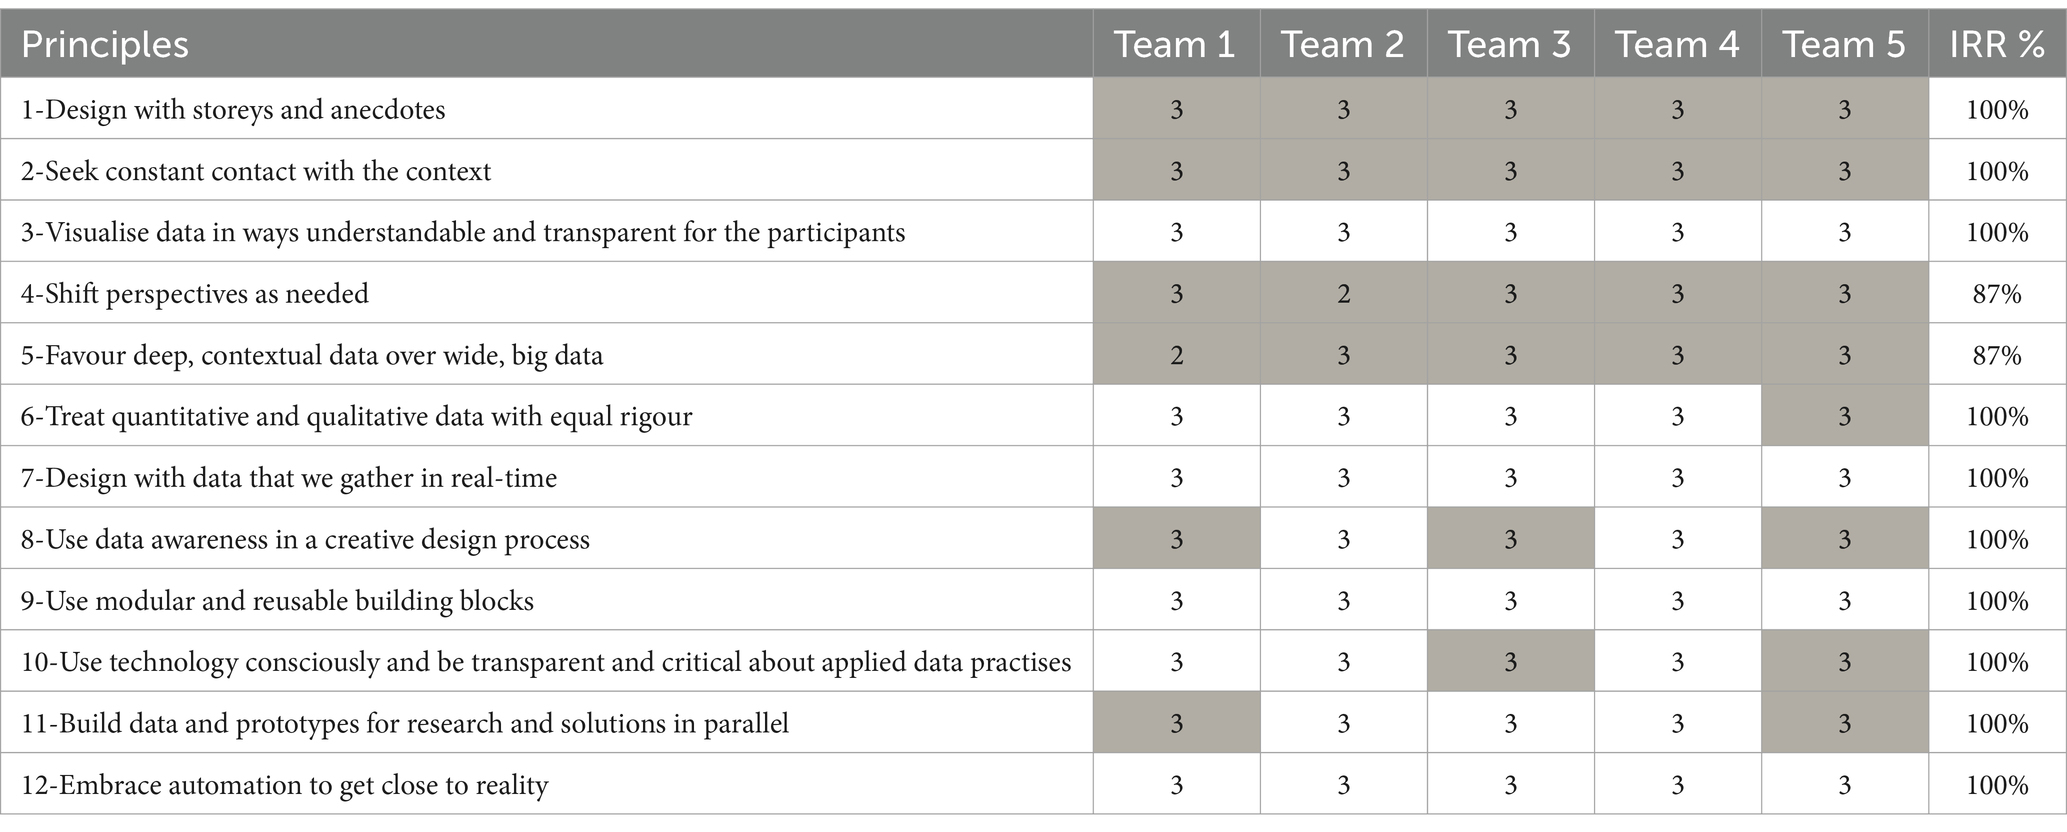
Table 2. DED principles and their prevalence within each team.
4.1.1.3 Inferences
It can be inferred from Table 2 that the teams did not adopt all the DED principles equally. It was interesting to see that some of the principles were prominent across all the teams. The prevalence of Principles 1, 2, 4, and 5 across all teams could imply that being immersed in the context helped the students connect better with the context and people in it. A majority of the teams missed out on principles that demand more time or technical skills needed to visualise data (Principle 3), analyse quantitative data (Principle 6), prototype probes and design interventions (Principles 7 and 9), and incorporate automation (Principle 12). It can also be seen that some of the teams managed to adopt the principles that were not adopted by the rest of the teams. Intriguing enough, the partially adopted principles were either value-based (Principle 10) or strategy-based (Principles 8 and 11). Understanding what influences this affinity towards a few principles would be interesting. For example, does it depend on a team’s background and skillset? Does it depend on the project? How do we ensure all teams adopt critical principles like Principles 3 and 10?
4.2 Student feedback
4.2.1 Summer school contents
4.2.1.1 Data
The exact question regarding the content shared at the summer school was: Please give a school grade (1–5) based on your overall experience of how the following things were organised and presented [followed by the topic presented at the summer school]. The quantitative ratings were recorded using a five-step Likert scale, with ‘1’ being the lowest and ‘5’ being the highest score. Figure 7 shows the average rating given by the students for each DED-related content taught during the summer school. To complement the ratings, the students were asked to comment on the rating they provided for the topics presented during the summer school.
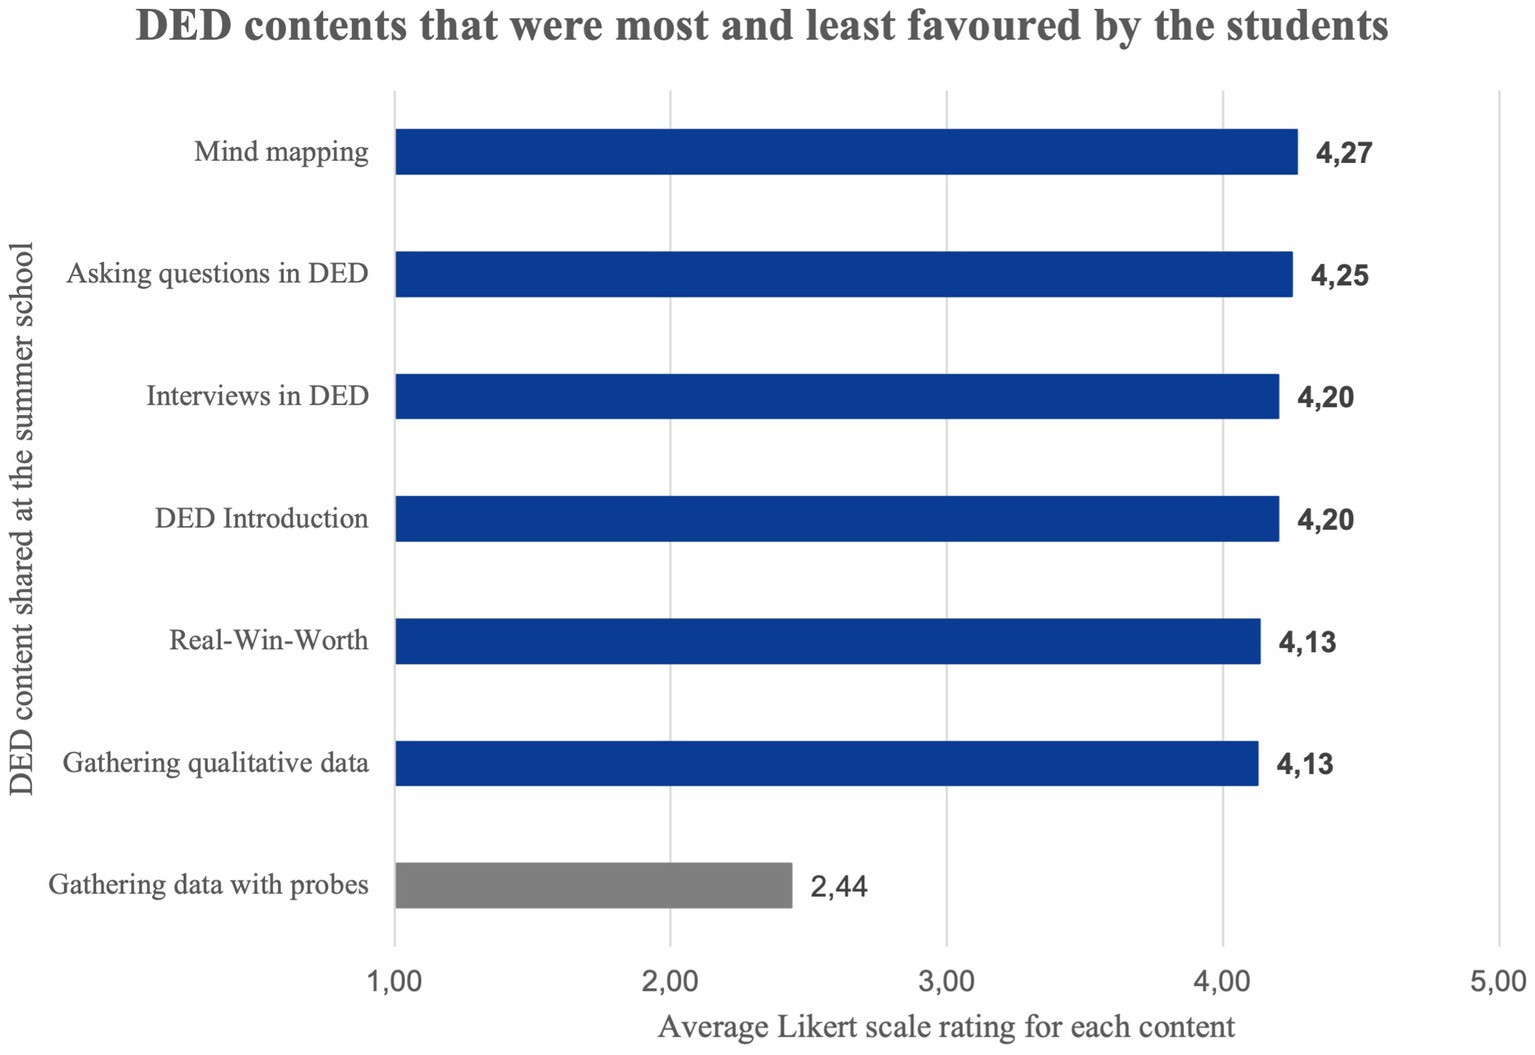
Figure 7. Average Likert scale rating given by the students for each DED content.
Students also answered an open-ended question that asked, ‘How would you summarise your key learnings? Please consider different viewpoints, such as design methodology, teamwork, creativity and problem-solving, working in an authentic context, interaction with users and stakeholders, and working with open-ended problems’.The received quantitative and qualitative data were analysed to understand the overall experience and unique takeaways from the summer school.
4.2.1.2 Analysis
To analyse the student feedback data, the qualitative reasoning provided by the students was used to interpret the quantitative ratings provided on a Likert scale. We used the feedback responses that referred to specific aspects of the summer school to understand how the students interpreted and used each topic that introduced different aspects of DED.
Finally, on the overall evaluation of the key learnings, we took a more involved approach where two researchers applied content analysis (Gheyle and Jacobs, 2017) to analyse the responses specific to this question. One primary researcher created the coding rules for each category listed in the question, and both independently rated all 16 responses based on the coding rules. The researchers discussed the initial disagreements and iterated the coding rules. Appendix E shares the final list of coding keys used by the researchers. Both researchers arrived at an agreement ranging from 81 to 88% for each category and had an average agreement of 86%. Values calculated based on the ratings provided by the primary researcher are used in this section. Figure 8 highlights the key learning outcomes that stood out the most and least among the students based on the proportion (percentage) at which they appeared in their responses.
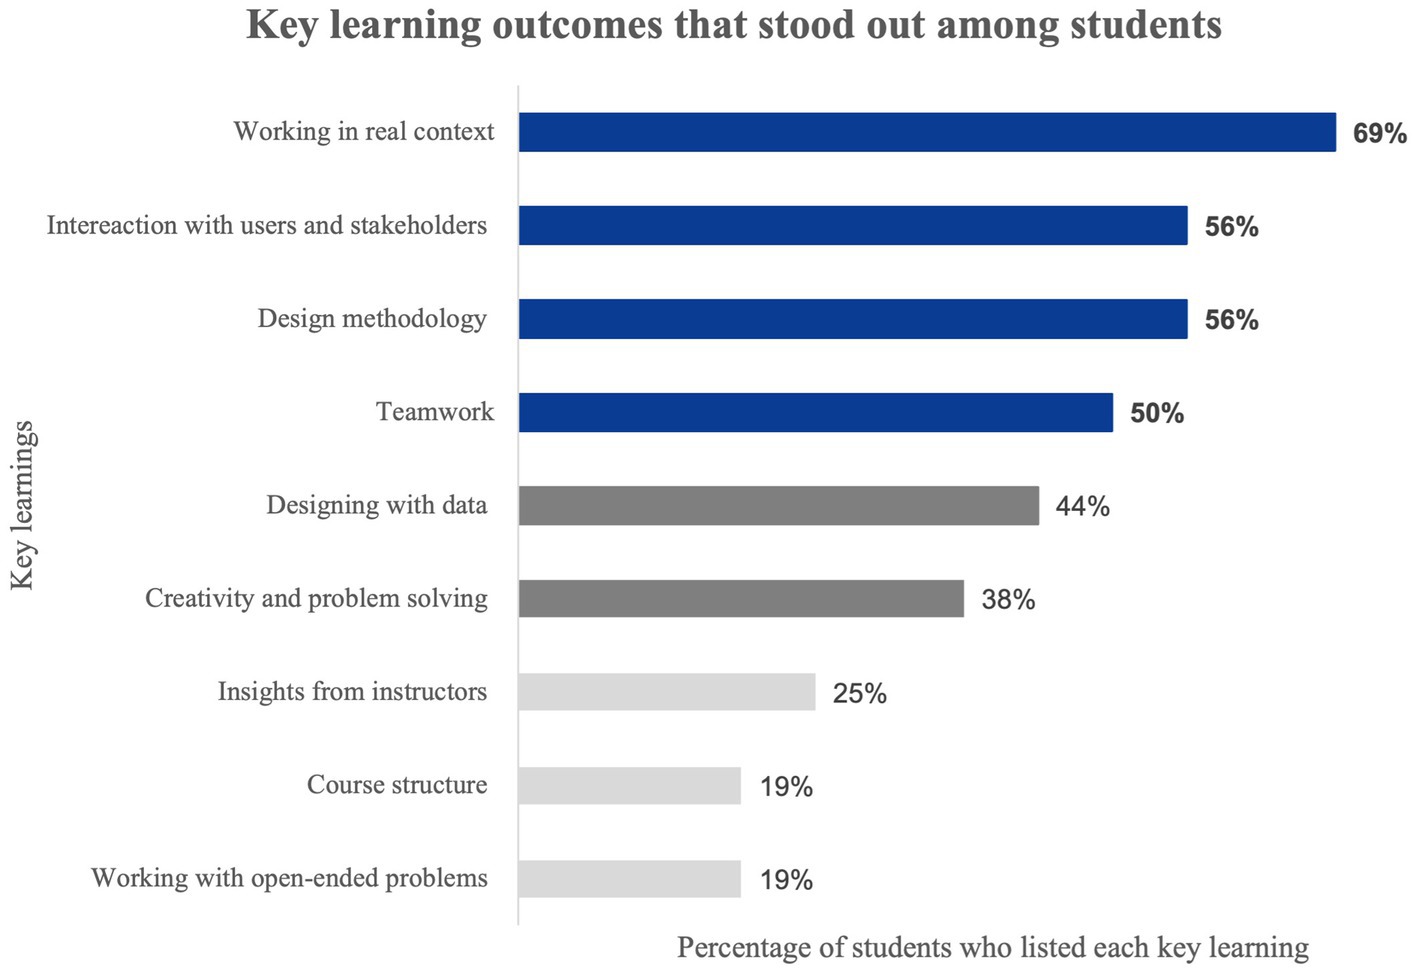
Figure 8. Percentage of students who listed each key learning outcome.
4.2.1.3 Inferences-overall experience
It can be observed from Figure 7 that ‘Gathering data with probes’ received the lowest rating from the students. The qualitative feedback received from the students adds background to understand the reason behind the low responses received for this aspect of the summer school. Regarding working with probes, the following statements highlight probe-related issues:
‘I would've liked to have a bit more time to go over instructions, the probes, challenges etc. Especially the first day felt quite overwhelming with information and the probes were a bit sudden, so a bit hard to properly include in anything’.
Given the short overall duration of the summer school, rather than building their own probes, the teams used the probes (Figure 5) provided by the instructors. Still, the probes required some configuration and setup, as well as getting used to this mode of contextual data collection. Indeed, we could observe a lack of time to get used to the probes in some of the teams. Teams often only scratched the surface of what could be achieved with probe-based data, e.g., not going through multiple iterations to explore logging different aspects of the amusement park experience, using all sensors of the probes, or letting multiple group members spend their time with the probes.
Another problem was probe malfunctioning, as one student stated:
‘I tried to gather quantitative data with the probes but not so effectively since there was some technically problem and I was a bit confused with its function initially. I hope to have more opportunities to use it in the future’.
Unfortunately, the probes used by two of the five teams had technical issues, and the teams used other data collection approaches, such as interviews and surveys, to delve deeper. In a way, the malfunctioning of the probes highlights the realistic technical challenges of collecting data using probes–and more so in a semi-public context that offers a variety of context switches, environmental conditions, and chance encounters. In addition, the student teams would not have sufficient equipment at hand in the park to directly analyse and fix technical problems; they would often only find out about the problem after returning from their explorations.
The qualitative feedback also showed that the students found most of the contents shared and activities programmed for the summer school to be useful overall. For example, the students appreciated working with data from a real context:
‘The things that helped me learn the most were the experiences I had at Särkänniemi theme park. Being there, talking to the park staff, and seeing how everything worked in real life gave me a better understanding than just learning in a classroom’.
Many students agreed that working with participants from a real-world context was one of the best aspects of the summer school. This was facilitated by easy and direct access to the amusement park, and most teams reported spending time exploring the park on most of the days of the summer school. This was not only supported by data, but also by photo and video footage from the park in their design proposals at the end of the summer school.
Working with data visualisations and ideations using data was another highlight for the teams:
‘Data visualisation workshops and brainstorming utilising probes were the most influential activity. They helped me improve my skills in converting raw data into appealing narratives and producing unique ideas based on user experiences by bridging theory and practise’.
While the teams took time to embrace an explorative stance to data collection and visualisation, they found their footing after a few days of seeing their peers benefit from working with data in visual ways. An interesting point is a seemingly contradicting statement about the work with probes being influential, while many teams reported problems in working with probes. On second sight, there is no contradiction: working with probes resulted in data for all teams, eventually, and even very little data helped them find new directions, motivate a second iteration of data collection or moving into more qualitative explorations. So, the probes sensitised the students in their explorations to look for interesting contextual artefacts and then how to capture them. While there were initial struggles, the students frequently appreciated working with data along the different stages of their data-enabled design processes.
The summer school provided a unique opportunity for the students to access the existing data collected by Särkänniemi. To learn about the role of such existing data, the students were asked to share their views on this opportunity by answering the question, ‘How was your experience working with the existing data and the data you collected on your own?’ The responses underscored three main aspects of working with different types of data and the relations between existing and self-collected data.
First, existing big data were used to acquire a frame of reference which prompted concrete data needs that the student teams could continue with:
‘The existing data arose a lot of why and how questions which we could not ask the participants, but the data we collected we could go deeper and ask why, how, what can be better. The data we collected helped us derive our insights better’. And ‘[t] he data from the park included details about visitors' experiences during winter, the activities they engaged in, and their plans. This also covered information about unused premises’.
In their feedback, students shared that they found existing quantitative data to be a good source of broader information that an individual could not answer. The students used existing data to connect to the information they received during the initial briefing and to understand the ‘big picture’ scope of the amusement park as an operational business entity. This background would allow them to embark on their own data collection journeys in the park and engage with visitors, essentially the commercial counterpart of the business.
Second, self-collected data were recognised as a source of context-specific information:
‘I believe that it was easier to work with our own data because we knew why we needed it and how people behaved, for instance, during our interviews’.
In contrast to the existing (big) data that the park’s data team provided, the students highlighted the advantages of the data they collected on their own. Specifically due to the details and depth missing in the existing data. They intuitively understood the difference between different views embedded in the different forms of data: on the one hand, an organisational, top-down view in the organisation data and metrics, the dashboards, and past and projected revenue figures. On the other hand, the visitor-level, bottom-up data that they could source themselves from the park. In a way, they were empowered to collect, materialise and curate data that would complement the organisational view and also would be specific to their design action. While not all teams showed this level of awareness, the statements showed their clear appreciation of the process and the agency of being able to work with data and act on their findings and intuition.
Third, the role of qualitative data was recognised for an in-depth understanding of the context of use: ‘I can say that although quantitative data may help us discover trends in human decision-making or behaviour, qualitative data can offer a more nuanced view of the same behaviours’. A majority of the students acknowledged the value of qualitative data in helping them build a better understanding towards their users. Given the relatively moderate successes of quantitative data collection around probes and other techniques, it was easy to see qualitative as a richer and ultimately more plentiful form of data. Yet, it is important to consider the mostly quantitative research background of most of the students. The experience of the summer school and being exposed to a rich context that primarily called for qualitative exploration gave them a different perspective on how to work with data in design.
4.2.1.4 Inferences-key learnings
Among all potential key learnings, ‘working in an authentic context’ was appreciated the most by the students (69%). One reason was that the students felt a sense of making a practical contribution. This can be observed in the comment: ‘Working in an authentic context gave me proper motivation that I am contributing to a cause that can be used as a practical solution’. The positive feedback towards working in a real context also resonated with the support provided by the industry collaborator; for example, a student mentioned: ‘It was exciting to see the internal processes in the park and to talk with the CEO of Särkänniemi and get the feedback from him’. This implies that a supportive industry expert also plays a key role in the successful implementation of DED.
Affirming some of our inferences from the principles adopted (Table 2), students also appreciated the opportunity to interact with the park visitors and stakeholders (56%). While the students seemed to have experienced challenges with their initial interactions with the park visitors, they eventually formulated ways to engage them as participants: ‘The interaction with users were difficult in person as both us as group members and users were very shy to talk to people. But it was easier to share the QR code to the users’. While such alternatives might come in handy for data collection, such reluctance might lead to less co-creation with the participants. This might have also been the reason that some of the teams did not apply Principle 3-Visualise data in ways understandable and transparent for the participants. The students also appreciated the multidisciplinary team structure (50%) followed during the summer school. It can be inferred from the student feedback that the difference in expertise helped obtain different perspectives over the given design opportunity: ‘The principle of group forming is another thing I appreciated as we could collaborate with people with a more technical background, design background and sociological background so each of us could give a unique perspective on the problem solution, after which we could come up to an agreement’. Other key learnings that were appreciated widely were the design methodology (63%) and the process of designing with data (44%).
The feedback also showed that one key element of DED did not receive enough attention among the students: Creativity and Problem-solving (38%). Nonetheless, a few students did recognise the role of creativity: ‘Balancing creativity with practicality was a constant theme’. ‘Creativity of our work was very surprising for me. I was amazed how we came up with creative design solutions in such a short time while enjoying our free rides’. Moving further, it would be useful to add emphasis on the important elements of DED, like creativity and participant engagement.
4.3 Client feedback from Särkänniemi
This set the data was not analysed due to the limited amount of feedback available to derive any overarching themes. We present the feedback as-is to present a client/collaborator’s perspective on adopting DED.
4.3.1 Data
As described earlier, staff from Särkänniemi, including top management, were involved throughout the summer school. They were stakeholders, hosts, and collaborators in some of the explorations. The park staff were also very transparent about failed experiments that they had done before, with clear explanations of why interventions were unsuccessful. For example, the CEO shared how a different Scandinavian amusement park had experimented with a fast lane for queues but had quickly stopped this experiment because it did not align with the egalitarian culture in Scandinavia.
Upon completion of the summer school, the staff shared their feedback on the summer school results and suggestions for future versions of the same. The staff acknowledged that the results were beyond what they had expected. They found that the summer school shed light on aspects that they had not realised or considered earlier. For instance, one group discovered foreigners as a potentially underserved visitor group and designed specifically for them. Although roughly 10% of the population in Finland are foreigners, their share of park visitors is much lower. This was acknowledged as a striking finding by the management team worthy of further investigation. At the same time, the feedback included suggestions for a future version of the summer school. The staff from Särkänniemi shared various types of input, i.e., concrete financial business data, historical information, anecdotes, practical information, and strategic plans about the park during different stages of the summer school. For the future, they suggested that it would be better if the students had a discussion with the staff at the very beginning of the summer school. This can include discussions on their vision, budget, and other aspects that may influence the implementation of the proposed projects. Another point was the range of design challenges: Although there were more design challenges available, three out of the five teams chose the wild card option and even picked a similar design opportunity. According to the staff, this limited the explorations and overall innovation potential of the summer school. Finally, when the teams presented their proposals, there was a suggestion that more focus should be placed on value creation for customers, visitors, and the park. This focus could be initiated and then reinforced in the future by sharing examples of value creation with the students; the more actionable, the better.
5 Discussion
The three types of outcomes discussed in the previous section helped us answer the research questions raised earlier. We use the project results and the feedback received from the students to discuss the factors that influenced the adaptation of DED to the given public context. We then delve into the challenges and future directions to apply DED in such contexts using the same set of outcomes in addition to the feedback received from the client.
5.1 RQ1: what factors influence design teams that apply DED in public spaces, especially in engaging with the context physically?
By comparing our experiences in the summer school and previous experiences in applying data-enabled design in other contexts (e.g., the clinical context), we found several factors that distinguish the application of DED in a semi-public entertainment context from previous applications in the home and clinical context. The influencing factors shared in this section showed a potential to impact the overall experience while working with the DED approach in a semi-public context.
5.1.1 First-hand access to context
As discussed in Section 4.2.1, working in the context was the second most listed (69%) learning outcome by the students. During the 2 weeks, the students had complete access to the amusement park during the park’s opening hours. This helped with observing the day-to-day behaviour of the park visitors. Most importantly, it enabled the students to be visitors themselves. The students used a combination of these two venues of experiential data as an input to the DED approach. This close integration with the context was easier to achieve in Särkänniemi than we experienced in other contexts due to the inherently open nature of an amusement park. In clinical and home contexts, this level of monitoring would be intrusive and would directly impact the results simply by the presence of the researchers. Noortman et al. (2022a) discuss this concern in their work that investigated the challenges of applying DED in a clinical context. While DED relies greatly on sensors and covert sensing to disrupt the context as little as possible (Lovei et al., 2021), this was less important as amusement parks already include regular interactions with strangers, where we saw that (informal) interviews had a lower threshold. This also explains the results observed in Table 2, where the principles of automation and real-time data collection were not observed in any of the projects. As they had direct contact with the context by being inside it, they could serve as their own sensors and actuators without needing more hidden sensor practises.
5.1.2 Direct interactions with park visitors
As seen in Figure 8, first-hand access to the park visitors and the stakeholders was acknowledged by 56% of the students. Each final design concept demonstrated how the anecdotal experiences shared by the park visitors shaped the design directions chosen by each team. While most teams did not explicitly report on it in their presentations, they also used the datasets presented by Särkänniemi staff and their own lived experiences inside the park to inform their interactions in the park. DED places importance on anecdotal experiences and personal narratives. Being at the park, the students could engage directly with the park visitors and have their perspectives on the inferences derived from the initial data set.
5.1.3 Having access to the bigger picture
An added advantage of working with an organisation like Särkänniemi was that the students had access to the vision for future expansion of the park (section 4.3). Sharing a big picture of the context by the CEO and other staff members helped the students understand how their contributions could add value to the park. Understanding the bigger context of the park within the existing culture helped the students to contribute more effectively to the organisation’s bigger agenda.
5.1.4 Switching perspectives
Finding missing data points and nuanced observations helped the students identify directions for an inclusive park expansion—such as inclusive design directions reflected in the projects by Teams 1, 2, and 4. The people who visit the amusement park are not the same every day, but there could also be people who seldom visit due to various non-obvious reasons. One pitfall of being immersed in the context could be that one might be biassed by one’s own perspectives (Liedtka, 2015), so it was good to see how the data collection inside the context still made students reflect on the bigger picture as well.
5.1.5 Diverse design team
Based on the results shown in Figure 8, the students appreciated and acknowledged working with their team, which was comprised of students from diverse backgrounds, as one of the key learning outcomes from summer school. As mentioned, the students came from different backgrounds and with different levels of expertise. Teams had a balanced number of students with and without technical backgrounds. Compared to previous experiences teaching DED (Noortman et al., 2022b), the students in the summer school had stronger profiles from social science and humanities. This was also apparent in their preference for ethnographic techniques and interviews and less so for technical probes.
5.1.6 Stakeholder engagement
Being an organisation that uses data every day, staff at Särkänniemi were actively involved in the planning and execution phases and provided the utmost freedom and support in implementing the summer school. Having the entire team at Särkänniemi, including the CEO, working with the instructors and students throughout the summer school positively impacted the students. Around 56% of the students (Figure 8) mentioned their interactions with the staff and users at the park in their key learning outcomes. The involvement of the people representing the entity they are designing for encouraged the students to take their contributions more seriously. This greatly influenced the teams’ involvement in understanding the context and their design proposals: the support from the staff at the amusement park. Looking at the entire summer school and its unique setup, input from the industry collaborator also highlighted the necessity to enhance the role of domain experts while working with DED. This aligns with the insights derived from working with experts in healthcare contexts, as we previously proposed in Noortman et al. (2022a), and reemphasises the need to give expert, domain, and practical knowledge space when applying DED in industry.
5.1.7 Data and contextual insights as catalysts of a process
Students widely appreciated data as introduced by the DED approach and also through the different perspectives that data and storeys would provide them with (Figures 7, 8). This included the concrete tools used to work with data, the creativity and openness of the design challenges, the iterative nature in which the summer school was planned, and the methods that were introduced and suggested at meaningful moments of personal and project development.
5.2 RQ2: what are the challenges and future opportunities for applying DED in semi-public spaces?
Introducing DED in the form of a 2-week summer school, with an opportunity to be immersed in the context while bringing together stakeholders and students from diverse backgrounds, did have its own challenges. In the following section, we list the challenges experienced during summer school, and each listed challenge is followed by a short discussion on how they could be addressed in the future.
5.2.1 Building prototypes
Student design teams were provided with a working and pre-configured probe that they could use to gather their initial set of data (refer to Figure 5 for an image of the probe with the key functionalities explained in annotations). Although the probes were initially intended to demonstrate the potential of tech prototypes, the teams continued to use them alongside a few more lightweight approaches to data collection. To prototype such probes that gather data and might even serve as building blocks for design interventions demands a certain level of technical expertise. Hence, building physical data collection prototypes was a prominent challenge experienced among students during summer school, especially those from non-technical backgrounds. While having a mix of students from technical and non-technical backgrounds helped to an extent, the 2-week period was still too short for all teams to produce functioning prototypes.
As mentioned before, DED works with data that reflect people’s day-to-day experiences in context. To introduce DED to diverse individuals with different backgrounds in the future, a range of interactive, non-technical prototyping options for data collection and design intervention would be desirable as data infrastructure. For example, materials as simple as sticky notes or physical clickers that count a particular number of instances could help as basic probes that gather data. Similar low-tech techniques like Wizard of Oz (Bernsen et al., 1994) could be used to test the design interventions. Students can make better-informed decisions on implementing more complex or sophisticated tools based on insights from these more lightweight techniques. It is important to distinguish between the education and professional application scenarios of DED. While the former aligns well with the proposed suggestions, an eventual practical adaptation of the approach benefits from developing appropriate technical skills with a team.
5.2.2 Malfunctioning probes
Even with ready-to-use probes, technical problems and malfunctioning can be an issue that impacts the overall experience. The probe shown in Figure 5 was developed for short tutorial (Noortman et al., 2024) formats similar to the summer school to let participants collect data out of the box after an initial setup. In previous instances, the probes were used for short data collection sessions that lasted 30 min to several hours. However, in the summer school setting, we wanted students to collect data for a longer period of time. This turned out to be a more challenging effort using the probes (Figure 7). One of the reasons was due to the limitation that collecting data in the semi-public space meant that the probes were not connected to the Internet. The probes would need to be brought back into a specific WIFI to offload their collected to the central data infrastructure. This also meant that the students could not see whether the probes were collecting data or not. Moreover, for some probes, the battery could not hold enough charge. Therefore, about half of the probes that were returned did not contain all or parts of the collected data.
Using these probes in the context of the summer school was successful in the sense that the participants would experience data collection in a first-hand, lived experience that informed their understanding of the context more than other means. At the same time, the probes were of limited utility for longer data collection sessions that lasted several hours. It is debatable whether the first explorative encounter with a new context should last this long or whether shorter data exploration sprints would be more advisable. For longer sessions, different technical solutions with intermediate synchronisation, mobile data links or even simple on-device data feedback mechanisms could be interesting to explore.
5.2.3 Real-time access to data
Real-time data are a valuable input to DED, but building systems that gather real-time data within a short period is a challenge, even for teams with technical backgrounds. This challenge is similar to the previous aspect and needs further exploration in terms of competence, tools and legal constructs. However, we also observed and realised how being inside the context made remote real-time data less urgent, as data could be collected from the context directly at any moment. Instead of using probes that gather real-time data, the students put themselves in the context and gathered data on a day-to-day basis.
Given the short duration of the summer school, being in the context helped balance the lack of probes that gathered structured, timed, and objective sensor data. Students reported a quite tangible shift from quantitative data as a framing of their explorative research (what they were used to) to a more qualitative exploration that would gain depth as time passed. Indeed, it would be interesting to test ways by which being in context could help balance the lack of reflective loops with objective data.
5.2.4 Use and application of DED principles
We observed from the summer school projects that the DED principles (Table 2) were adopted selectively by the teams. For instance, while the students did not have the time and resources to gather remote real-time data, they observed people in real-time while being part of the context. This reflects the nature of guiding principles that a DED team can bring in to support their process and individual needs for guidance. Indeed, we do not argue for including all principles, but knowing them and placing them in one’s DED toolkit. Nevertheless, it is interesting to better understand what motivates a team to adopt a given principle and per principle added value. This would then allow teams or individuals to decide which principles to adopt or not to adopt depending on the requirements of a project. It also shows how to best operationalise a given principle as a principle might have a different role in different contexts and in different team settings. This, in turn, would then help implement more conscious decisions in adopting the principles. Furthermore, students presuming a broad similarity between Design Thinking and DED approaches in emphasising problem or challenge development as a requirement of a subsequent (informed) design phase could be misleading. More in-depth differences might have evaded their attention. For instance, DED further challenges the designer to tie the to-be-developed challenge to a specific context, often by means of data, which is not a pronounced aspect of design thinking. In fact, several of the DED principles (see Table 2) illustrate DED as a very different approach. Future work could look into how we could emphasise on the distinctions to leverage a more data-enabled design outcome.
To summarise, we discussed the factors that influenced the summer school teams that applied DED in public spaces and shared the challenges and future opportunities for DED. This work, too, had its limitations. Due to the smaller sample size, we could not study the interrelationship between the factors. While DED looks for more in-depth anecdotal information, a detailed analysis of the impact of DED with a larger sample size could help build a concrete understanding of the approach. Hence, our next step will be to analyse a larger sample of projects that applied DED and contribute to a concrete understanding of the approach.
6 Conclusion
Data-enabled design (DED) has been shown to provide new perspectives in industrial design processes, especially in terms of new data-enabled viewpoints. Yet, DED is still a growing methodology with developing tools and infrastructure support. While DED has been applied predominantly in healthcare and the care context, new areas in high-tech systems and higher education are emerging. This paper reports on the challenges of adapting DED for a 2-week summer school that catered for students from both technical and non-technical backgrounds while being immersed in a semi-public context, the Särkänniemi amusement park. We analyse team results and their reflections and discuss problems and important aspects to consider when applying DED in similar contexts.
Data availability statement
The raw data supporting the conclusions of this article will be made available by the authors, without undue reservation.
Ethics statement
The studies involving humans were approved by the Ethical Review Committee of the Tampere Region. The studies were conducted in accordance with the local legislation and institutional requirements. The participants provided their written informed consent to participate in this study.
Author contributions
SR: Conceptualization, Formal analysis, Visualization, Writing – original draft, Writing – review & editing. PL: Conceptualization, Formal analysis, Methodology, Software, Writing – review & editing. RN: Conceptualization, Formal analysis, Methodology, Writing – review & editing. TO: Conceptualization, Resources, Writing – review & editing. KV: Conceptualization, Funding acquisition, Resources, Writing – review & editing. MF: Conceptualization, Funding acquisition, Methodology, Resources, Software, Supervision, Writing – review & editing.
Funding
The author(s) declare that no financial support was received for the research, authorship, and/or publication of this article.
Acknowledgments
The authors would like to thank the entire team at Särkänniemi amusement park and the students who participated in the summer school for their support and enthusiastic participation. We also want to express our deep gratitude to the Human-Technology Interaction department at Tampere University for their hospitality and involvement in the summer school. Lastly, our sincere thanks to the Särkänniemi amusement park, the Human-Technology Interaction department at Tampere University and the Industrial Design department at the Eindhoven University of Technology for their generous support towards this research.
Conflict of interest
PL was employed by Philips.
The remaining authors declare that the research was conducted in the absence of any commercial or financial relationships that could be construed as a potential conflict of interest.
Publisher’s note
All claims expressed in this article are solely those of the authors and do not necessarily represent those of their affiliated organizations, or those of the publisher, the editors and the reviewers. Any product that may be evaluated in this article, or claim that may be made by its manufacturer, is not guaranteed or endorsed by the publisher.
Supplementary material
The Supplementary material for this article can be found online at: https://www.frontiersin.org/articles/10.3389/fhumd.2024.1406974/full#supplementary-material
Footnotes
References
Bae, S. S., Kwon, O. H., Chandrasegaran, S., and Ma, K. L. (2020). “Spinneret: aiding creative ideation through non-obvious concept associations” in Conference on Human Factors in Computing Systems-Proceedings.
Bernsen, N. O., Dybkjær, H., and Dybkjær, L. (1994). Wizard of oz prototyping: How and when. CCI Working Papers Cognit. Sci./HCI.
Bogers, S., Frens, J., van Kollenburg, J., Deckers, E., and Hummels, C. (2016). “Connected baby bottle: A design case study towards a framework for data-enabled design” in DIS 2016—Proceedings of the 2016 ACM Conference on Designing Interactive Systems. Fuse, 301–311.
Cheng, Y. T., Funk, M., Liang, R. H., and Chen, L. L. (2023). Seeing through things: exploring the design space of privacy-aware data-enabled objects. ACM Trans. Comput. Hum. Interact. 30, 1–43. doi: 10.1145/3577012
Churchill, E. Z. F. (2012). From data divination to data-aware design. Interactions 19, 10–13. doi: 10.1145/2334184.2334188
Davies, M. (2011). Concept mapping, mind mapping and argument mapping: what are the differences and do they matter? High. Educ. 62, 279–301. doi: 10.1007/s10734-010-9387-6
Funk, M., Lovei, P., and Noortman, R. (2024). “Data-enabled design: Designing with data in contextual and informed explorations” in Handbook of Human Computer Interaction. eds. J. Vanderdoncktetal, (Cham, Switzerland: Springer Nature), pp. 1–32.
Gomez Ortega, A., Van Kollenburg, J., Shen, Y., Murray-Rust, D., Nedić, D., Jimenez, J. C., et al. (2022). “SIG on data as human-centered design material.” In CHI Conference on Human Factors in Computing Systems Extended Abstracts, pp. 1–4.
Huang, T., Fredericks, J., and Maalsen, S. (2023). Interior Media Architecture: Using Social Media as a Tool for Data Informed Design Solutions. In Proceedings of the 6th Media Architecture Biennale Conference (MAB ’23). New York, NY, USA: Association for Computing Machinery, 28–37.
Institute of Design (2024). ID action labs equitable healthcare. Available at: https://www.healthcare.lab.id.iit.edu/
Khanshan, A., Giling, L., Markopoulos, P., and Van Gorp, P. (2023). A case study of data-enabled design for cardiac Telemonitoring. In Proceedings of the European Conference on Cognitive Ergonomics 2023 (ECCE ‘23). New York, NY, USA: Association for Computing Machinery 19, 1–7. doi: 10.1145/3605655.3605679
King, R., Churchill, E. F., and Tan, C. (eds.) (2017). Designing With Data: Improving the User Experience With A/B Testing (first edition). Sebastopol, CA: O’Reilly Media.
Lauff, C., Yu Hui, W., See, A., Raviselvam, S., Collopy, A., Teo, K., et al. (2023). Design Innovation Methodology Handbook. 2nd Edn. Design Innovation Team, Design Z Centre: Singapore University of Technology and Design.
Lee, B., and Ahmed-Kristensen, S. (2023). Four patterns of data-driven design activities in new product development. Proc. Design Soc. 3, 1925–1934. doi: 10.1017/pds.2023.193
Lee-Smith, M. L., Benjamin, J. J., Desjardins, A., Funk, M., Odom, W., Oogjes, D., et al. (2023). “Data as a material for design: alternative narratives, divergent pathways, and future directions.” In Extended Abstracts of the 2023 CHI Conference on Human Factors in Computing Systems, pp. 1–5.
Liedtka, J. (2015). Perspective: linking design thinking with innovation outcomes through cognitive bias reduction. J. Prod. Innov. Manag. 32, 925–938. doi: 10.1111/jpim.12163
Lovei, P., Nazarchuk, I., Aslam, S., Yu, B., Megens, C., and Sidorova, N. (2021). “Designing Micro-intelligences for situated affective computing” in CEUR Workshop Proceedings, 2996.
Luo, J. (2023). Data-driven innovation: what is it? IEEE Trans. Eng. Manag. 70, 784–790. doi: 10.1109/TEM.2022.3145231
Marti, P., Megens, C., and Hummels, C. (2016). Data-enabled design for social change: two case studies. Future Internet 8:46. doi: 10.3390/fi8040046
Menheere, D., Van Hartingsveldt, E., Birkebæk, M., Vos, S., and Lallemand, C. (2021). “Laina: dynamic data physicalization for slow exercising feedback” in Proceedings of the 2021 ACM Designing Interactive Systems Conference. pp. 1015–1030.
Noortman, R., Lovei, P., and Funk, M. (2022b). “Teaching data-enabled design: student-led data collection in design education” in 8th International Conference on Higher Education Advances (HEAd'22). Editorial Universitat Politècnica de València, pp. 223–230.
Noortman, R., Lovei, P., Funk, M., Deckers, E., Wensveen, S., and Eggen, B. (2022a). Breaking up data-enabled design: expanding and scaling up for the clinical context. Art. Intellig. Eng. Design Analy. Manufactur. 36:e19. doi: 10.1017/S0890060421000433
Noortman, R., Lovei, P., Raviselvam, S., and Funk, M. (2024). “Data-enabled design: designing intelligent ecosystems through design plumbing and futuring” in Companion Proceedings of the 16th ACM SIGCHI Symposium on Engineering Interactive Computing Systems. pp. 111–112.
van Bussel, T., Van Den Heuvel, R., and Lallemand, C. (2022). “Habilyzer: empowering office workers to investigate their working habits using an open-ended sensor kit” in Conference on Human Factors in Computing Systems-Proceedings.
van den Heuvel, R., Lévy, P., Vos, S., and Hummels, C. (2020). “Exploring public playgrounds through a data-enabled design approach” in Companion publication of the 2020 ACM designing interactive systems conference, 1–6.
van Kollenburg, J., and Bogers, S. (2019). Data-enabled design: A situated design approach that uses data as creative material when designing for intelligent ecosystems. Available at: https://research.tue.nl/en/publications/data-enabled-design-a-situated-design-approach-that-uses-data-as-
van Renswouw, L., Vos, S., Van Wesemael, P., and Lallemand, C. (2021). “Exploring the design space of inter active urban environments: Triggering physical activity through embedded technology” in Proceedings of the 2021 ACM Designing Interactive Systems Conference. pp. 955–969.
Zahedi, M., and Heaton, L. (2016). “Mind mapping as a tool, as a process, as a problem/solution space” in DS 83: Proceedings of the 18th International Conference on Engineering and Product Design Education (E&PDE16).
Nomenclature

Keywords: data-enabled design, design innovation, prototypes, design methodology, collaboration
Citation: Raviselvam S, Lovei P, Noortman R, Olsson T, Väänänen K and Funk M (2024) Rollercoasters and research: applying data-enabled design to a semi-public context. Front. Hum. Dyn. 6:1406974. doi: 10.3389/fhumd.2024.1406974
Edited by:
Niko Männikkö, Oulu University of Applied Sciences, FinlandReviewed by:
Armağan Karahanoğlu, University of Twente, NetherlandsLiesbeth Huybrechts, University of Hasselt, Belgium
Copyright © 2024 Raviselvam, Lovei, Noortman, Olsson, Väänänen and Funk. This is an open-access article distributed under the terms of the Creative Commons Attribution License (CC BY). The use, distribution or reproduction in other forums is permitted, provided the original author(s) and the copyright owner(s) are credited and that the original publication in this journal is cited, in accordance with accepted academic practice. No use, distribution or reproduction is permitted which does not comply with these terms.
*Correspondence: Sujithra Raviselvam, cy5yYXZpc2VsdmFtQHR1ZS5ubA==