 Ayşe Özge Ağça
95% of researchers rate our articles as excellent or good
Learn more about the work of our research integrity team to safeguard the quality of each article we publish.
Find out more
ORIGINAL RESEARCH article
Front. Hum. Dyn. , 27 January 2025
Sec. Digital Impacts
Volume 6 - 2024 | https://doi.org/10.3389/fhumd.2024.1406364
This article is part of the Research Topic Data-Centric Design: Data as a Human-Centred Material View all 3 articles
Teenagers are increasingly concerned about clean energy and play a crucial role in driving energy transition. In this study, I investigate how teenagers understand energy consumption, how tangible data mapping through anthropological theories may increase their awareness, and what ideas they may have about how to change habits. I present an approach for designing new data physicalizations, shaping how to facilitate data interaction sessions, and analyzing data physicalization and interactions based on Ingoldian concepts such as the Life of Lines and Imagining for Real. The empirical material includes 1-h sessions in two secondary education schools with 30 teenagers and video-recorded explanations about their consumption habits. The teenagers completed a questionnaire, drew a layout drawing of their home, and built a physical model of their home with products and rooms representing their energy consumption. The data landscapes encouraged participants to explore the perceptual integrity of energy-consuming habits and identify ways to change them. The self-expressive sessions demonstrate that the three data-mapping techniques enable teenagers to recount their daily consumption patterns. In particular, the tangible mapping of Consumption Data Landscapes can open avenues for engagement to increase their awareness of energy consumption and spawn responsibility for a change of habits.
In the contemporary frame of sustainability research, understanding and mitigating the energy consumption patterns of teenagers has emerged as a pivotal challenge (Galende-Sánchez and Sorman, 2021; Ratriyana et al., 2021; Strzelecki, 2022). Global agencies like IEA (2020a,b) and IRENA (2021) highlight the urgent need for innovative methods to monitor, analyze, and influence energy usage in response to climate change and resource depletion. Youth are increasingly framed as inheriting the environmental challenges the generations before them created. They will be left with the physical and mental burden of meeting these challenges (Sanson et al., 2018; Sanson and Bellemo, 2021).
The significance of targeting young individuals in energy consumption research lies in their potential to enact long-term behavioral change. With the right insights and interventions, this demographic can play a key role in shaping a more sustainable future (Si et al., 2022). However, traditional data collection methods often fail to engage this group effectively and capture the nuanced, day-to-day energy use patterns essential for comprehensive analysis (IEA, 2020a). The OECD highlights that “new and digital technologies have been unlocking opportunities to collect, manage and analyse large amounts of data in a relatively cost-effective way,” suggesting that leveraging digital tools can enhance engagement with younger populations and provide more detailed insights into their energy consumption behaviors (IEA, 2020b).
Through my own experimentation and based on Ingold (2016, 2015) ‘Lines: A Brief History’ and ‘The Life of Lines’, I designed a novel data mapping set, the Tangible Consumption Data Landscape set. With these sets, I prepared two processual workshops, designed to focus on the dynamics of creating, reflecting, or exploring ideas and practices, rather than aiming solely at end results or explicit assumptions, based on Ingold (2022) ‘Imagining for Real’ with 36 teenagers from two different schools in Turkey. This research aims to capture, in real-time, the energy consumption habits of teenagers while increasing their awareness of their habits and creating opportunities for habit changes.
Ingold (2015, 2016) Lines concept represents movement, growth, or change paths that emerge through ongoing, lived experiences in social life extent. They emphasize the interconnectedness of people, places, and things, illustrating how meaning and identity are shaped through continuous journeys. Ingold (2022) imagines the interconnected reality in three phases. Creation theory emphasizes the process-driven nature of making, where individuals interact with materials without a predetermined plan. Attention is the receptive and responsive nature of individuals to their environment. At the same time, correspondences emphasize the ongoing, reciprocal relationships between individuals and their surroundings, where knowledge and understanding grow through continuous interaction and mutual influence.
I seek to accomplish several objectives: to elicit imaginary expressions and interactions with the world through line-like co-creation experiences, to provide an in-depth analysis of teenagers’ energy consumption patterns, and to evaluate the effectiveness of tangible data-gathering tools based on auto-ethnographic and anthropologic perspectives in capturing these behaviors. By focusing on tangible interactions and real-time data collection, this research not only contributes to the academic understanding of teenagers’ energy consumption behaviors but also opens new avenues for engaging young people in collaborative design conversations about sustainability and the future of energy.
Through this study, teenagers can move from thinking abstractly about energy consumption to creating concrete data objects; they are thinking about energy in real life and reflecting on and connecting with their data through physical action. This elicits a line-like progression from thinking to connecting and relating with data. The following sections will explore the realistic and theoretical background and methodology behind the data landscape set.
This study builds on research emphasizing youth engagement in sustainability and energy awareness through creative and participatory methods. Using Ingold’s concepts of imagining for real, and life of lines, it highlights the potential of tangible and visual methods like data visualization, physicalization, and co-design to connect abstract data with lived experiences. These approaches foster reflection and understanding of energy consumption while promoting awareness of human-material interconnectedness.
The contributions of teenagers, who comprise 16% of the world’s population, are undeniably important to future energy transformation and sustainability efforts (UNICEF, 2024). Globally, committed young individuals are taking significant steps to effect change through social media campaigns, civic activities, or demonstrations. Echoing the sentiments of the Fridays for Future (2023) youth climate movement sentiments, they declare that they are stepping up to improve the welfare of the world’s children and youth. Mebane et al. (2023) highlight the potential role of teenagers as sustainability advocates, pointing to their increasing environmental consciousness and calling for educational programs designed to engage teenagers in sustainable practices. Thomaes et al. (2023, 352) say that teenagers want to be part of a solution for climate change, although they are not in charge of it. To gain awareness about this critical reality and expect some positive outcomes for the future, these youth platforms need to explore beyond reality: the transition toward sustainable energy futures with new approaches and meaningful engagements (Earle and Faul, 2024; Jensen et al., 2024; Miller, 2018; UNESCO, 2021).
For many young people, energy is not directly observable until it transforms into an action or an object, making its existence comprehensible when it becomes physical (Detken and Brückmann, 2021). Therefore, teaching and learning energy can be done in various ways: philosophically informed teaching transformation (Papadouris and Constantinou, 2011), concept mapping (Chen et al., 2014), or simply energy games and icebreakers (The NEED Project, 2019). Also, energy consumption can be tracked through objects that consume energy, materials, toolkits, visualizations, and physicalizations that perform or represent actions with colors, textures, or shapes (Ambrose, 2020; Boucher et al., 2018; Jensen et al., 2024; Palm and Ambrose, 2023; Quintal et al., 2016). Hence, mastering the scientific idea of energy entails creating a conceptual framework for understanding what energy is, how it interacts with observable phenomena, and how it behaves (Detken, 2023).
Ingold (2000) characterizes real life as an ongoing, dynamic engagement with the world and introduces the concept of dwelling as the essence of living, arguing for a continuously interwoven life. This perspective challenges traditional dichotomies between nature and culture, emphasizing a holistic engagement with one’s surroundings. People perceive the world differently from each other. However, he starts to question imagination and the interplay between imagination and reality:
“A more generous understanding of reality would admit to a world that is not already precipitated out, into fixed and final objects, but launched in ever-flowing currents of formation; a more generous understanding of imagination would allow it continually to overspill the limits of conceptualisation and representation, into unmapped realms of conscience and feeling.” (Ingold, 2022, 4)
Imagination and reality should go beyond, touch, and join each other. He defines three properties of imagining for real: creation is a participatory journey where humans, materials, and the environment co-evolve, co-create, and influence each other’s becoming; attention is about the way individuals engage with, perceive, and come to know the world around them and an active process of becoming aware, noticing, and responding to the environment in a way that is both receptive and participatory; correspondence is about aligning oneself with the processes, rhythms, and patterns of the environment, leading to a form of knowledge and understanding that is experiential and embodied rather than abstract and detached.
Imagination is constantly growing and transforming by the forces of materials. It is “being alive.”
“An imagined landscape, then, is a landscape not of being but of becoming: a composition not of objects and surfaces but of movements and stillness, not there to be surveyed but unfolding in the current of time.” (Ingold, 2022, 36)
Ingold (2022) delves into the relationship between humans and their environment, proposing that our imaginative engagements help shape our understanding and treatment of the natural world. He argues that imagination is a powerful, active force that shapes our perception, actions, and interactions with both the social and material world. This perspective challenges the traditional boundary between imagination and reality, showing that our imaginative processes have significant, tangible impacts on the real world.
To understand these tangible impacts, Ingold (2016) examines the significance of lines, both literal and metaphorical, in human life and thought. He explores how lines form a fundamental part of the human condition, from writing and drawing to the paths we walk. The lines are not just tools for representing the world but are ways of understanding and engaging with it. This includes the idea of walking as knowing, where movement through space is a form of knowledge. There’s a focus on the materiality of lines - in storytelling, drawing, weaving, and shaping.
According to Ingold (2015, 2016), writing, hand drawing, or any skill that depends on body movements are forms of expressive line-making. He sees drawing not merely as depicting the world but as engaging with it, where the drawer discovers the world through the line.
Supporting the material agency idea, Bennett (2010) posits that the recognition of matter’s lively and dynamic role in political and ecological outcomes echoes themes of interconnectedness and the vitality of the material world. Lefebvre (1991) adds another approach and mentions the rhythms of urban spaces and the every day, examining how temporal and spatial rhythms interconnect and influence human experiences. Stewart (2007) supports his everyday spaces with everyday ordinary moments and the effects on shaping life experiences. Her approach to storytelling and ethnography highlights the fluid and emergent nature of experience, resonating with Ingold (2015, 2016), emphasis on life’s continuous becoming.
To imagine this continuous fluidity and interconnectedness, there are some elements that Ingold (2015) defines. The first things are blobs and lines: Blobs are volumed mass, material worlds that can expand or contract, bump each other and merge but not have any life inside; Lines are the opposite, have movements to be flexible, vivid, twisting (Figure 1A) He explains their differences like this: “They give us life. Life began when lines began to emerge and to escape the monopoly of blobs. Where the blob attests to the principle of territorialisation, the line bears out the contrary principle of deterritorialization” (Ingold, 2015, 4). While these lines come together, intersect, and tangle each other with knots (Figure 1B), they start to make meshworks (Figure 1C). The meshwork represents the dynamic interrelations of the natural and cultural world, a web of relationships mapped out of knots, where everything is interconnected and in constant flux. The process of correspondence is this web of meshwork; it is personal knowledge (Figure 1D) the individual gains with their own actions, movements, and skills of the lines and being alive between nonhuman and human worlds interactively (Ingold, 2015). I use these concepts to develop the Tangible Consumption Data Landscape and analyze the outcomes from workshops with them.
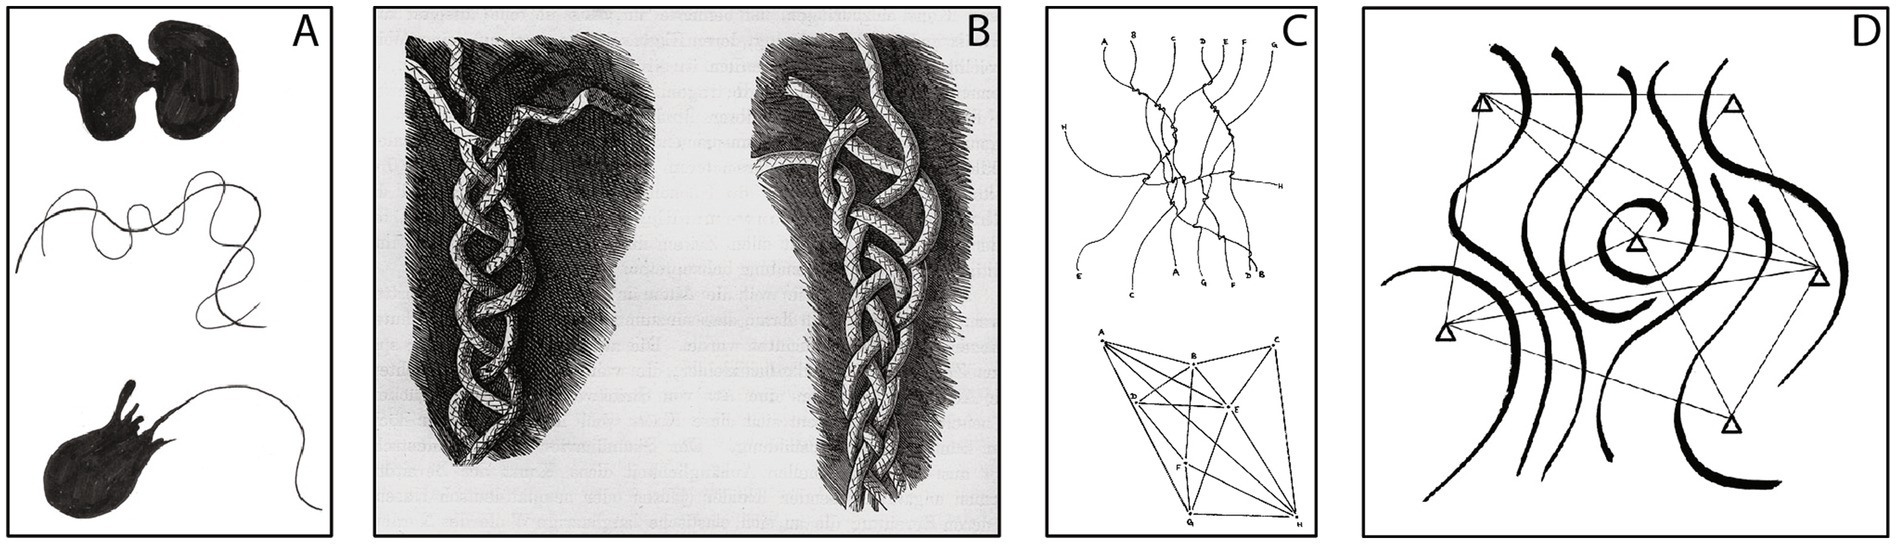
Figure 1. Ingold’s Blob and Lines (A) Knots (B) Meshworks (C) Personal knowledge (D) (Ingold, 2015:4, 14,149; 2016:82).
In recent studies, young people engage with their own data through creative processes such as workshops based on participatory design, co-design, or co-creations with the help of data visualization and physicalization techniques. There are different types of drawings and notations for data visualization, which is a fundamental method for Evergreen and Metzner (2013) and Unwin (2020), visually representing abstract data to enhance understanding among participants from various fields and knowledge levels by figuratively simple and contextually informative. However, McCosker and Wilken (2014) argue that concentrating solely on the outcome of data visualization overlooks the potential for generating knowledge during the process. To achieve the process of correspondence, Buur et al. (2021) emphasize the power of physical data artifacts that might inspire individuals to gain awareness about their own data and help to share their own experiences. Brandt et al. (2012) show the richness of the communication tools and techniques in Participatory Design by making something and telling and enacting stories with them. Jansen et al. (2015) explain data physicalization as another visualization technique, but physicalization also moves beyond visualization by increasing the quality of communication during the presentation. Through the interactive and embodied process, the individuals start to become self-reflective about their daily life, and this storytelling with tangible objects enriches the conversations (Karyda et al., 2021; Maria et al., 2020).
Based on this information, I will describe how I develop my methods based on auto-ethnography, design anthropology, research-through-design, and collaborative design perspectives in this order: the Tangible Consumption Data Landscape drawing on my own experiences, the workshop design and facilitation, the quantitative, visual and narrative data I obtained from these workshops, and finally, the analysis method in which I blend the information obtained from quantitative and qualitative data with Ingoldian theories. I prepared a diagram (Figure 2) to describe the methods’ overview and show the overall sequence of steps and how each step fed to the next.
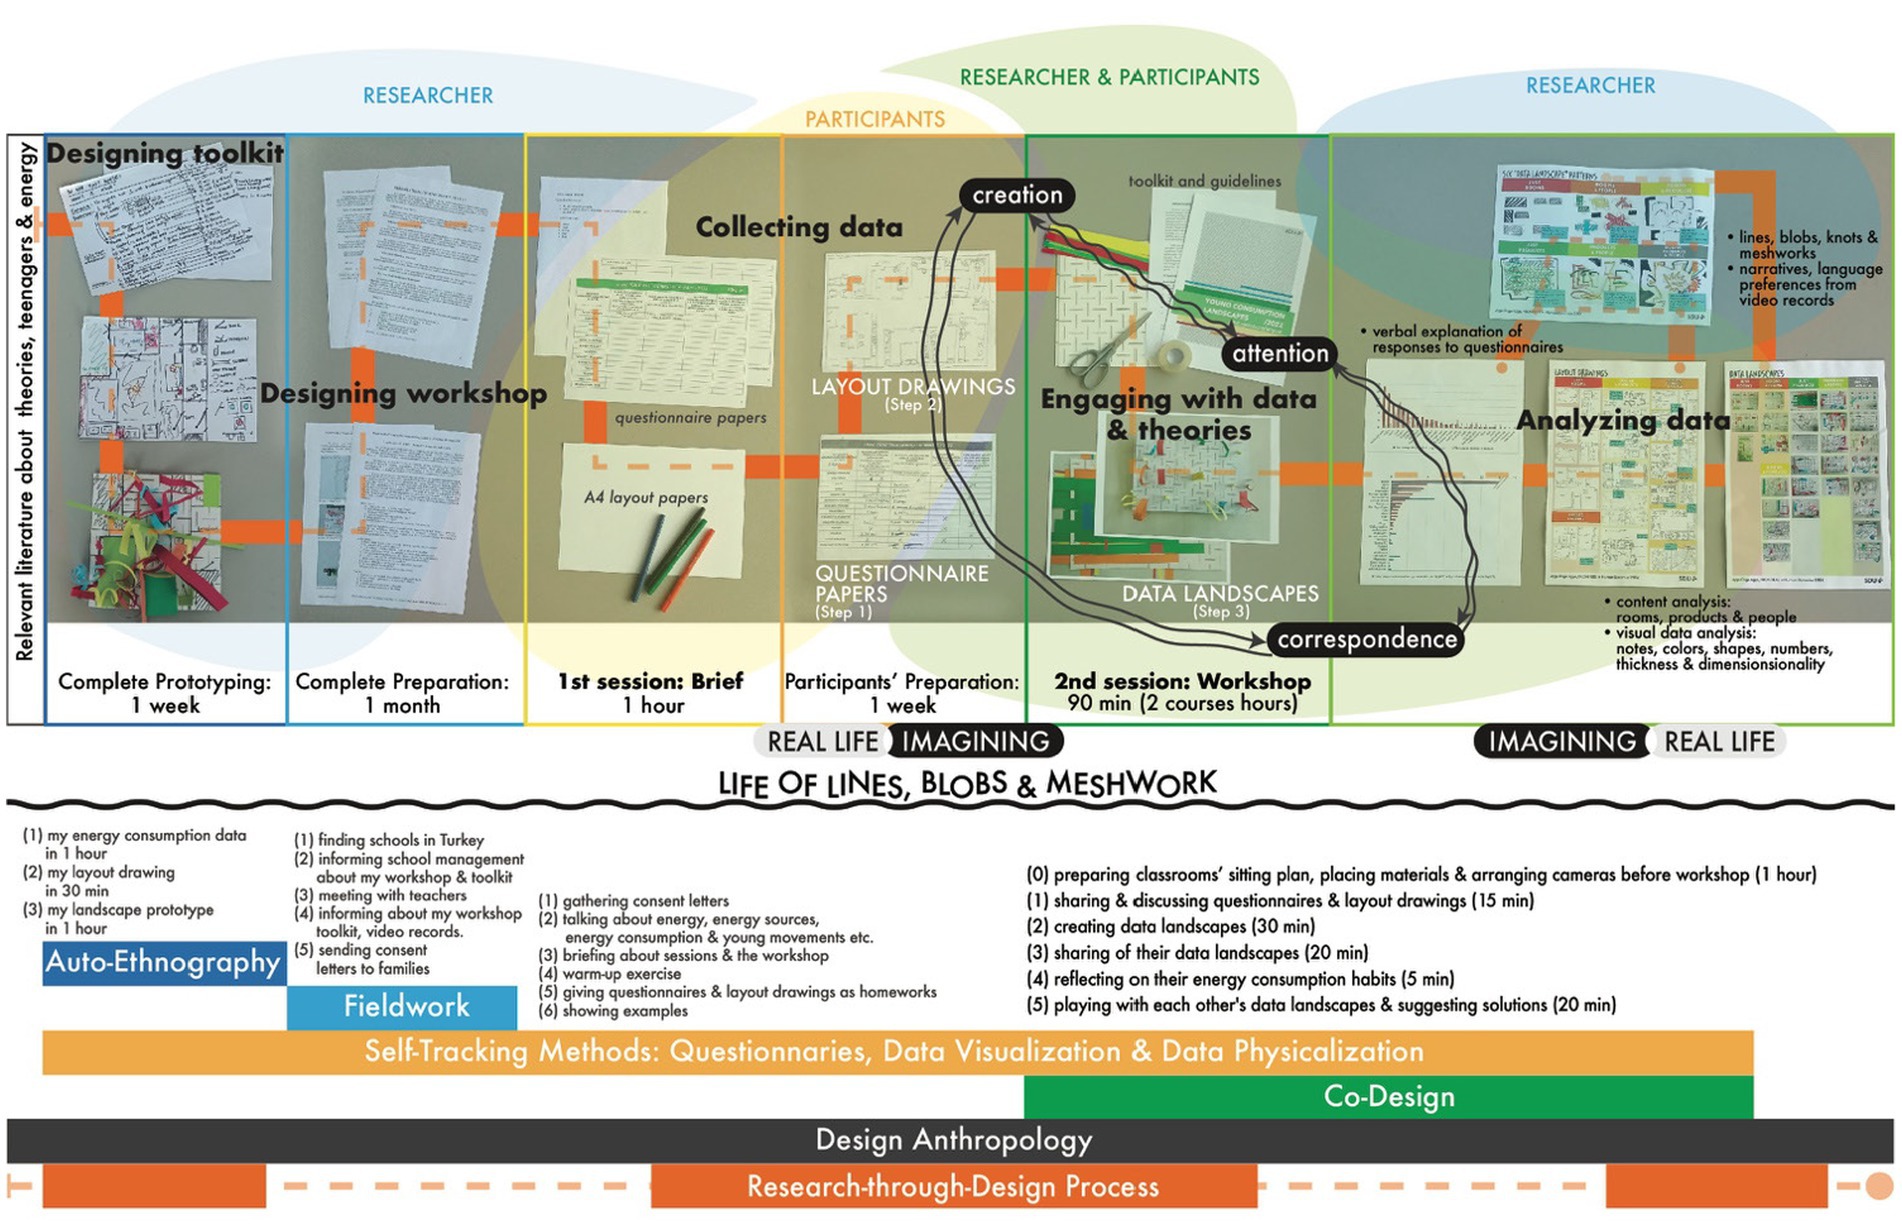
Figure 2. The overall sequence of methods.
Inspired by Ingold (2016, 2015) ‘Lines: A Brief History’ and ‘The Life of Lines’, I created a three-dimensional data map of energy consumption at home through products. To do this, I first mapped out my own home’s energy consumption (Figure 3).
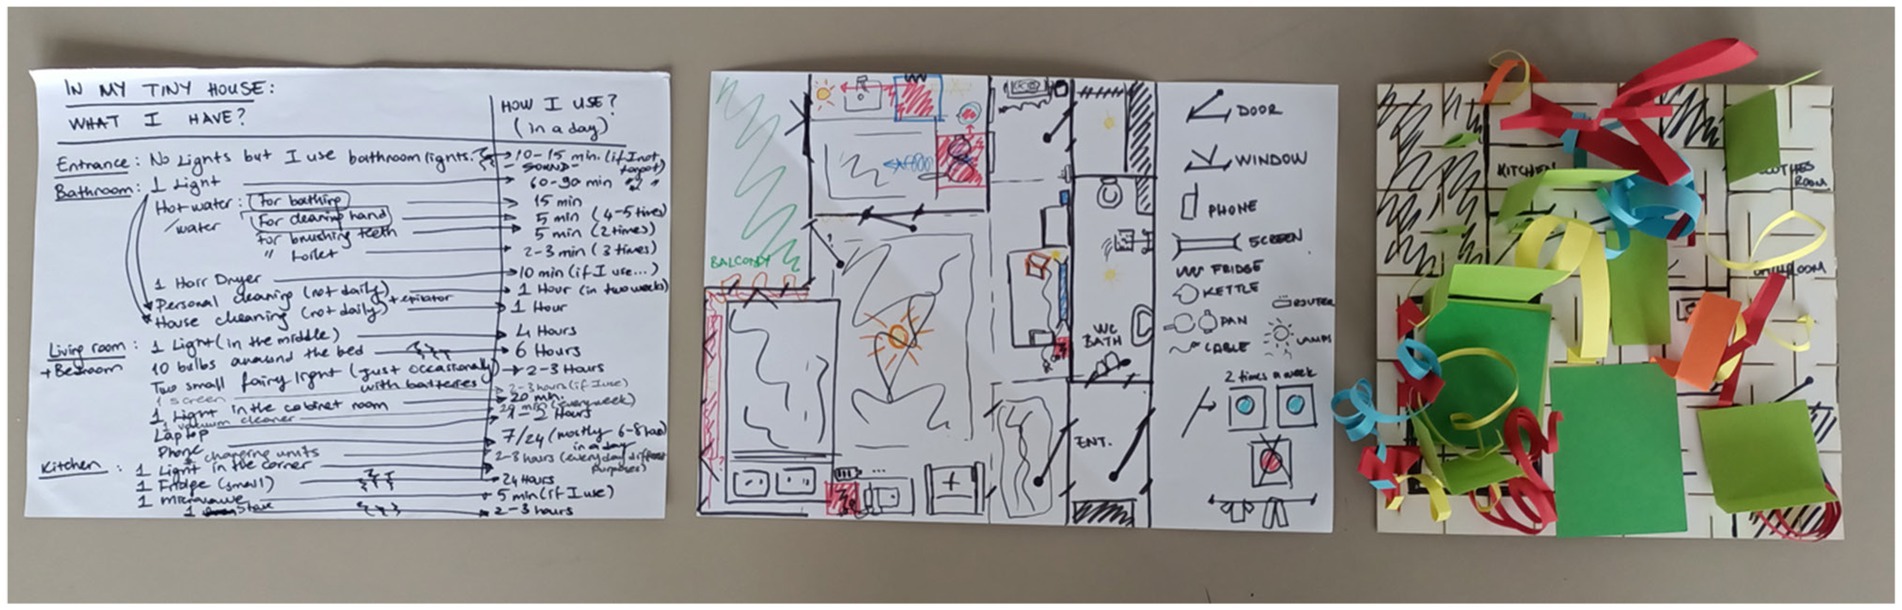
Figure 3. Mapping out energy consumption: the notation (Step 1); the layout drawing (Step 2); the tangible consumption data landscape (Step 3).
Michael and Gaver (2009) state that the home always has complex dynamics of being ordinary and unique, a connection through which it flows and gathers several signs and materials. Some of these flows are barely noticeable and invisible in daily life routines, such as heat, electricity, water, or waste. While Ambrose (2020) explores the existence of overcoming the invisibility of energy in participants’ homes, the participants also start to feel slightly embarrassed or surprised by their lack of awareness of how even energy enters their houses. I plan to co-design with teenagers who might have a similar lack of knowledge. So, while considering products that consume the most energy, I realized that I needed to start by taking notes from the entrance of my house and continue with the rooms in which they were located. This was especially true when I focused on what more there could be, how I used them, where they were positioned, and how my consumption habits affected their locations and usages. While noting the usage of some products in terms of hours and minutes, I observed that I used certain items weekly and others just two to three times a month (Figure 3, Step 1). I considered how to design the activity so that invisible activities become more apparent to young consumers.
To visualize my energy use, I created a rough layout of my studio apartment (Figure 3, Step 2). Drawing on Kjærsgaard and Larsen’s (2020) study, where Kjærsgaard positions herself as an auto-ethnographer by blending observation with personal experience, I approached my energy consumption similarly. While walking through my home, I engaged with surfaces (e.g., heaters), listened to my noisy refrigerator, and observed tangled charging cables. However, I found that undirected walking was ineffective for documentation, so I followed a sequence of daily movements (Jensen, 2007). This self-referential performance (Emunah, 2020; Pendzik et al., 2017; Pinto, 2022) helped me connect products and rooms while taking notes out loud. I defined each room by mapping dominant objects that either consumed energy or did not. For instance, my bed, desk, and couch were in my combined living and bedroom, while my refrigerator and stove were in the kitchen, and the toilet and sink were in the bathroom. Using colors like blue for the fridge, yellow for lighting, and red for the heating system, I highlighted energy consumption levels and marked areas of higher and lower energy use. Symbols and pictograms further detailed the layout on paper.
This performance reminded me of Ingold (2011, 148) wayfaring “to describe the embodied experience of this perambulatory movement”. He gives an example of a house where the lines of people who live there are knotted, and the trail beyond the house meshes with other places and knots. With this idea, my energy usage became alive as a line through my embodied experiences and walked with me. While wayfaring with my consumption, the next door also was drawing lines: as the people in my apartment, my city, and beyond my city. Therefore, my energy consumption line would be socially entangled with my participants’ consumption lines. In this sense, I would position myself as an auto-ethnographer even when I would make workshops with my participants, similar to the approach Kjærsgaard and Larsen (2020) took.
As shown in Figure 3 (Step 3), I physically mapped energy flows using precise measurements of my living space, cutting sections into cardboard-like parallels and meridians. Large green pieces represented non-energy-consuming “blobs,” as Ingold (2015) describes, such as beds, couches, and cabinets. Surrounding these were paper strips of varying thicknesses and colors, forming knots and lines to visualize energy consumption. The meshwork highlighted connections, such as my stove linking to my fridge during cooking, while thicker and longer lines denoted higher consumption, like my fridge, represented by a long red strip for its heat and noise. A curly blue line showed my stove’s inefficiency due to preheating. This data landscape physically expressed my energy habits, relationships, and feelings, identifying high-consumption areas and prompting reflections on potential changes.
I found that this process of physically representing my consumption elicited feelings and reflections that pushed my awareness beyond the conceptual understanding gained by drawing my home. For the workshops with teenagers, I developed my experiments in a set I named Tangible Consumption Data Landscape (see in detail in next section).
Quintal et al. (2016) outline four primary methods utilized in HCI research to promote sustainability through increased energy consumption awareness: (1) making comparisons between appliances, (2) employing a universal reference framework, (3) referencing the consumption of others, and (4) bringing attention to habitual behaviors and previous actions as a means of fostering accountability. In their study, they used eco-feedback technology to provide feedback on the participants’ habits with the goal of reducing energy consumption. Considering my participants’ age and social, cultural, and economic conditions, I planned to apply these four common methods in this order by giving feedback to each other. My own experience constitutes an example of this circular order. My workshop design has similarities with Schulte et al. (2016, 120) design fiction probe, “a narrative scenario used to elicit open-ended responses from viewers about the values, possibilities, and limitations of future technology developments.” Jensen et al. (2024) employ this approach, combining it with collaborative design and tangible interaction.
Building from my own experience, I redesigned the three steps of notating, drawing, and landscaping for workshops with 14- to 16-year-old teenagers in two different schools in Turkey. The school administration arranged for two art teachers to help me with the facilitation and organized the workshops into multiple sessions over two weeks. For the first day with the initial school group of 16 participants, I conducted a 20-min briefing to get to know each other and discuss what we would do together next week. This covered topics such as what energy is, the various types of energy, the energy sources we consume, and which products use energy. Following this, the participants engage in warm-up exercises involving colorful strips. I asked them to create one or two comic strips around the concepts of “youth,” “friendship,” “comfort,” and “home” and to explain their work. These activities were designed to help them express abstract topics like energy through tangible objects. This way, they would also gain familiarity with the material and get a sense of what kind of work we would engage in the following week.
For the next meeting, the school administration informed the participants’ parents in advance about the work and the video-audio-image recording and obtained the necessary permissions (Figure 3, left). I also gave them a questionnaire paper (Figure 4, middle, step 1) I prepared based on my consumption notations (Figure 3, step 1), along with documents I prepared to inform their families and asked participants to fill in the questions at home with their families for the second session.
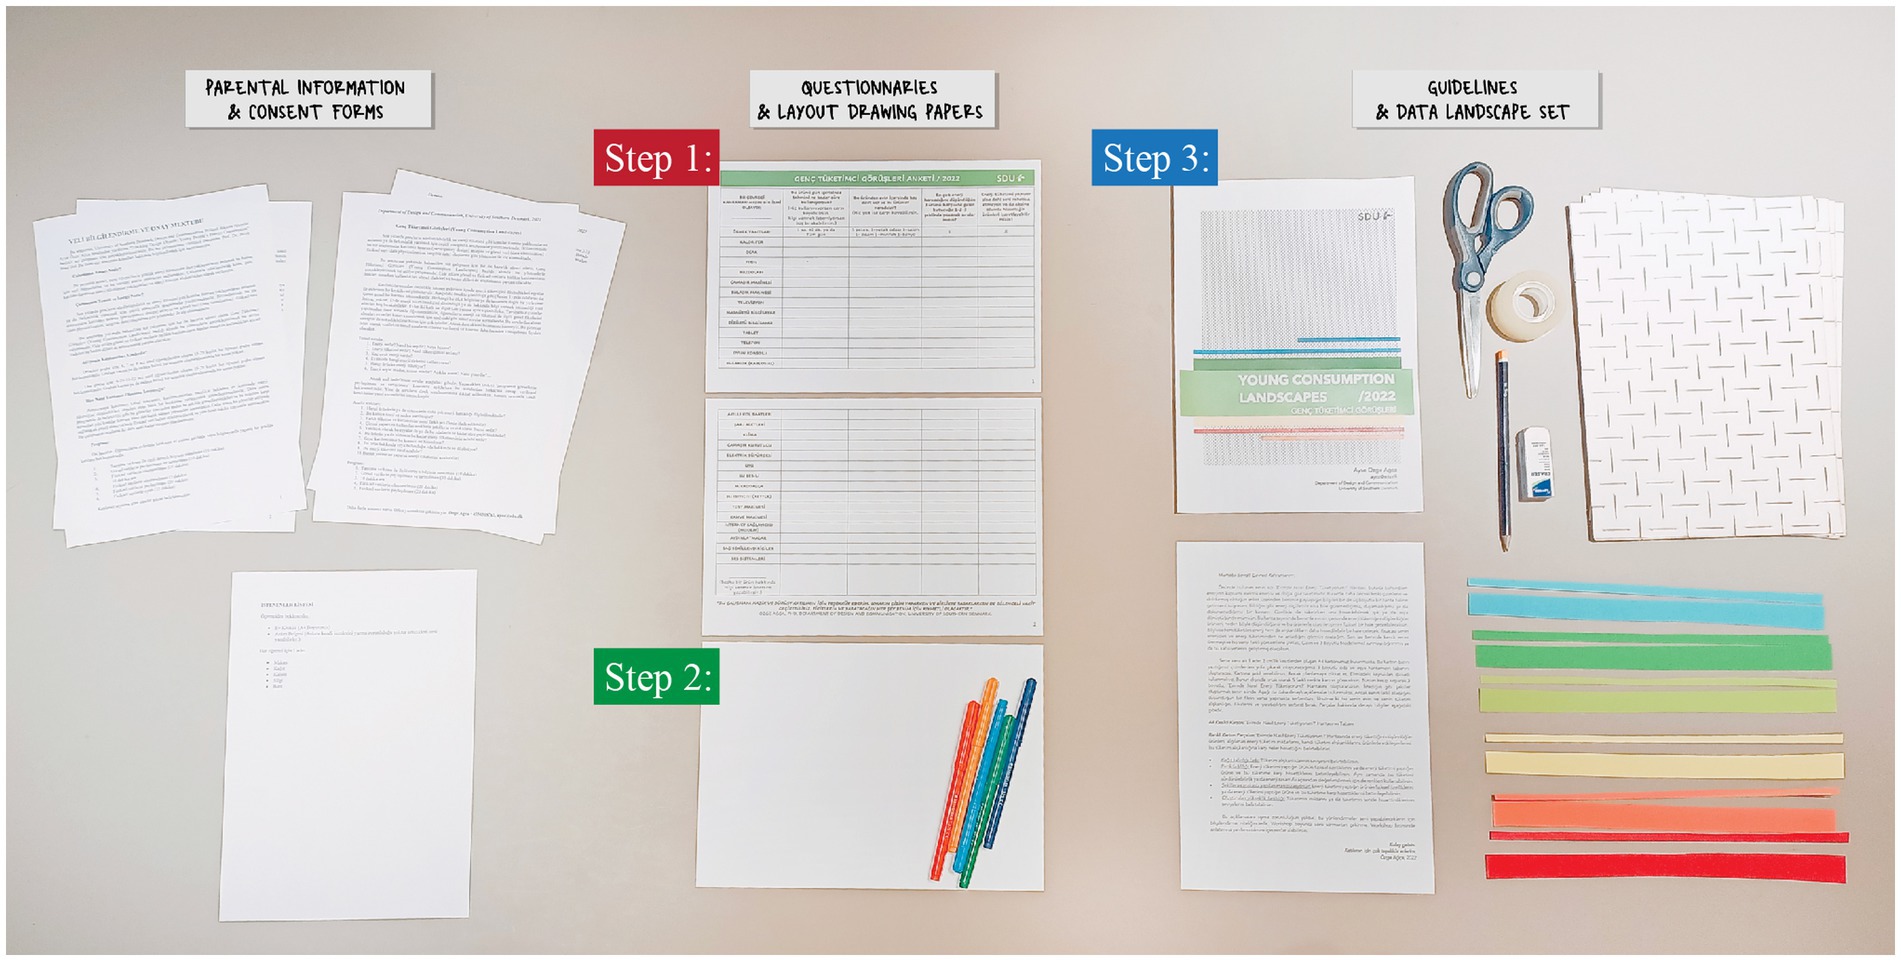
Figure 4. Mapping out energy consumption: parental information and consent forms (left); the questionnaire and layout drawing A4 paper (middle); the guidelines and data landscape set (right).
The questionnaires contained 28 different products in columns and 4 questions in rows, with example responses below. I informed them that if they do not have that product, to write ‘0’ or, if they have no idea, to leave it ‘blank’ for each question. Here’s a brief overview of the questions:
1. Approximately how long do you use this product during the day? [As hour(s) or minute(s)]
2. How many of these products are in the house? [From ‘0’ to ‘20’]
3. Would you list the 3 products you think consume the most energy by writing ‘1–2-3’ in the opposite box?
4. Would you mark the products that do not bother you, even if they consume energy, or that you feel optimistic about? [As ‘X’]
For the second session the following week, along with the questionnaire paper, as I explained in the information documents, I asked them to draw the layout of their homes on an A4 paper and to indicate the energy-consuming products in this drawing (Figure 4, middle, step 2). In Boucher et al. (2018) Energy Babble, participants use different visual representation methods. One of them is also a drawing of the layout for domestic energy practices in relation to particular emotions. While I initially wanted to provide specific examples of domestic products that could help define the room, I also wanted to see their improvisation for their house and product structures. Therefore, I left the drawing session more open than the Energy Babble examples (Michael, 2018, 28, 35). Still, even the drawings have some clues and direct the participants to engage them in a certain way; Michael (2018, 142, in the Energy Babble) mentions “the idea of opening the artefacts,” which led me to create effective opportunities later in the workshop by providing materials whose colors, shapes, and configurations could convey emotional responses to consumption “not fully disclose, emergent through the uncertainties of the experimental system.” I arranged the session into two class periods, by request from the school administration, and distributed the activities across these two class periods in the following way with regard to Ingold (2022) concepts from Imagining for Real, such as sharing and discussing questionnaires and layout drawings (real life), creating data landscapes (imagination and creation), sharing of their data landscapes (attention), gathering all material creations and feedback.
To facilitate the workshop, I prepared information and consent forms for families with the materials of the Tangible Energy Consumption Data Landscape set for each participant (Figure 4, right, step 3). With consent, I recorded videos and took pictures through the creating, sharing, and gathering part. I wrote them a letter as each participant is an environmental hero, incorporating input from their art teachers for young participants to explain the terms and definitions that do not yet have an equivalent in Turkish. Inside, there is an open-ended user guide. The information included in the guide in the shortened version is as follows:
Cut-Cardboard: The Base of the `How Do I Consume Energy in My Home?’: A4 cardboard with 2 cm sections. You can cut, fold, and add more cardboard with tape and other materials. Also, paper strips in 5 colors and 2 different thicknesses are included.
Colored Paper Stripes: On the ‘How Do I Consume Energy in My Home’ map: 5 colors and 2 different thicknesses. These paper strips may be shaped by hand, cut by scissors, tangled, joined, and placed into the cut-cardboard sections.
• Paper thickness difference: You can specify the level of your consumption habits.
• Color difference: You can describe the physical characteristics of the product you consume energy or your feelings about the product and this consumption. You can also use colors to evaluate this consumption regarding energy savings.
• Shapes and manipulations with/without scissors and tapes: You can describe the physical characteristics of the product that consumes energy or how you feel about this product or this consumption.
• The height difference created: You can specify the amount of consumption or the levels of how consumption makes you feel.
A similar process was followed with the second school. Still, during our second meeting, I let the participants played with each other’s data landscapes and questioned how they could change them towards better sustainability between the attention phase and reflection for the correspondence phase.
A total of 36 students from both schools participated in the study. In the first school, 16 preparatory high school students aged 15–16 participated. In the second school, 10 middle school students, aged 14, and 10 high school students, aged 16, joined the sessions. However, some students could not attend the second session, had to leave early, or forgot to submit their outputs. As in Table 1, I collected quantitative data from questionnaires as written documents from 29 participants and qualitative data through the video narratives while participants shared their 31 hand-drawn visualizations and 29 hand-shaped physicalizations in these sessions across both schools.
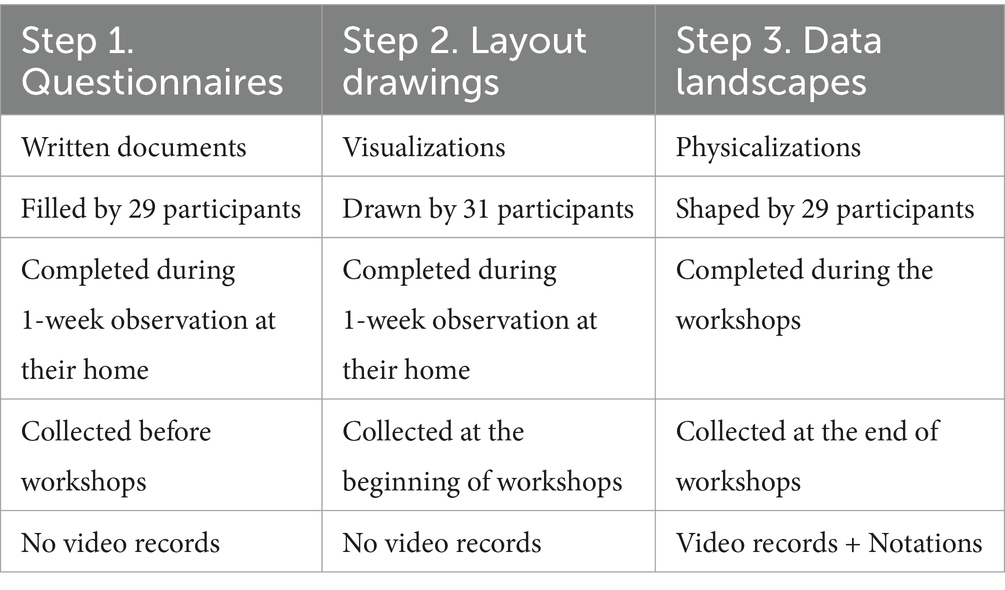
Table 1. Overview of data types and collection process.
I began by analyzing transcribed verbal explanations of questionnaire responses to understand how participants interpret data in real-life settings. These documents detailed the number, location, usage, and frequency of products in participants’ homes. Using numerical responses, including approximate values, I derived equivalents based on averages from Issi and Kaplan (2018) and Şahin and Köksal (2014) to validate observations from the quantitative analysis.
I subsequently added a visual analysis of the 2D layout drawings (Figure 5) and 3D data landscapes (Figure 6) to provide further information and details on teenagers’ energy practices and to see how the Ingoldian approach during the workshop affected their expressions and awareness with a tangible toolkit. From the drawings, I determined the primary groupings, organized by complexity. The base configuration and first grouping are based on rooms. The second groupings are organized by the elements drawn within these spaces, including products and users, along with their number, shapes, and positions related to the rooms. I labeled the groups with color codes similar to the data landscapes. However, beyond the focus on rooms, I specified separate color codes for what the data landscapes dominantly represent: rooms, products, and people. Ultimately, when the three elements of rooms, products, and people converged, I utilized a color code that represented a mixture of all these aspects.
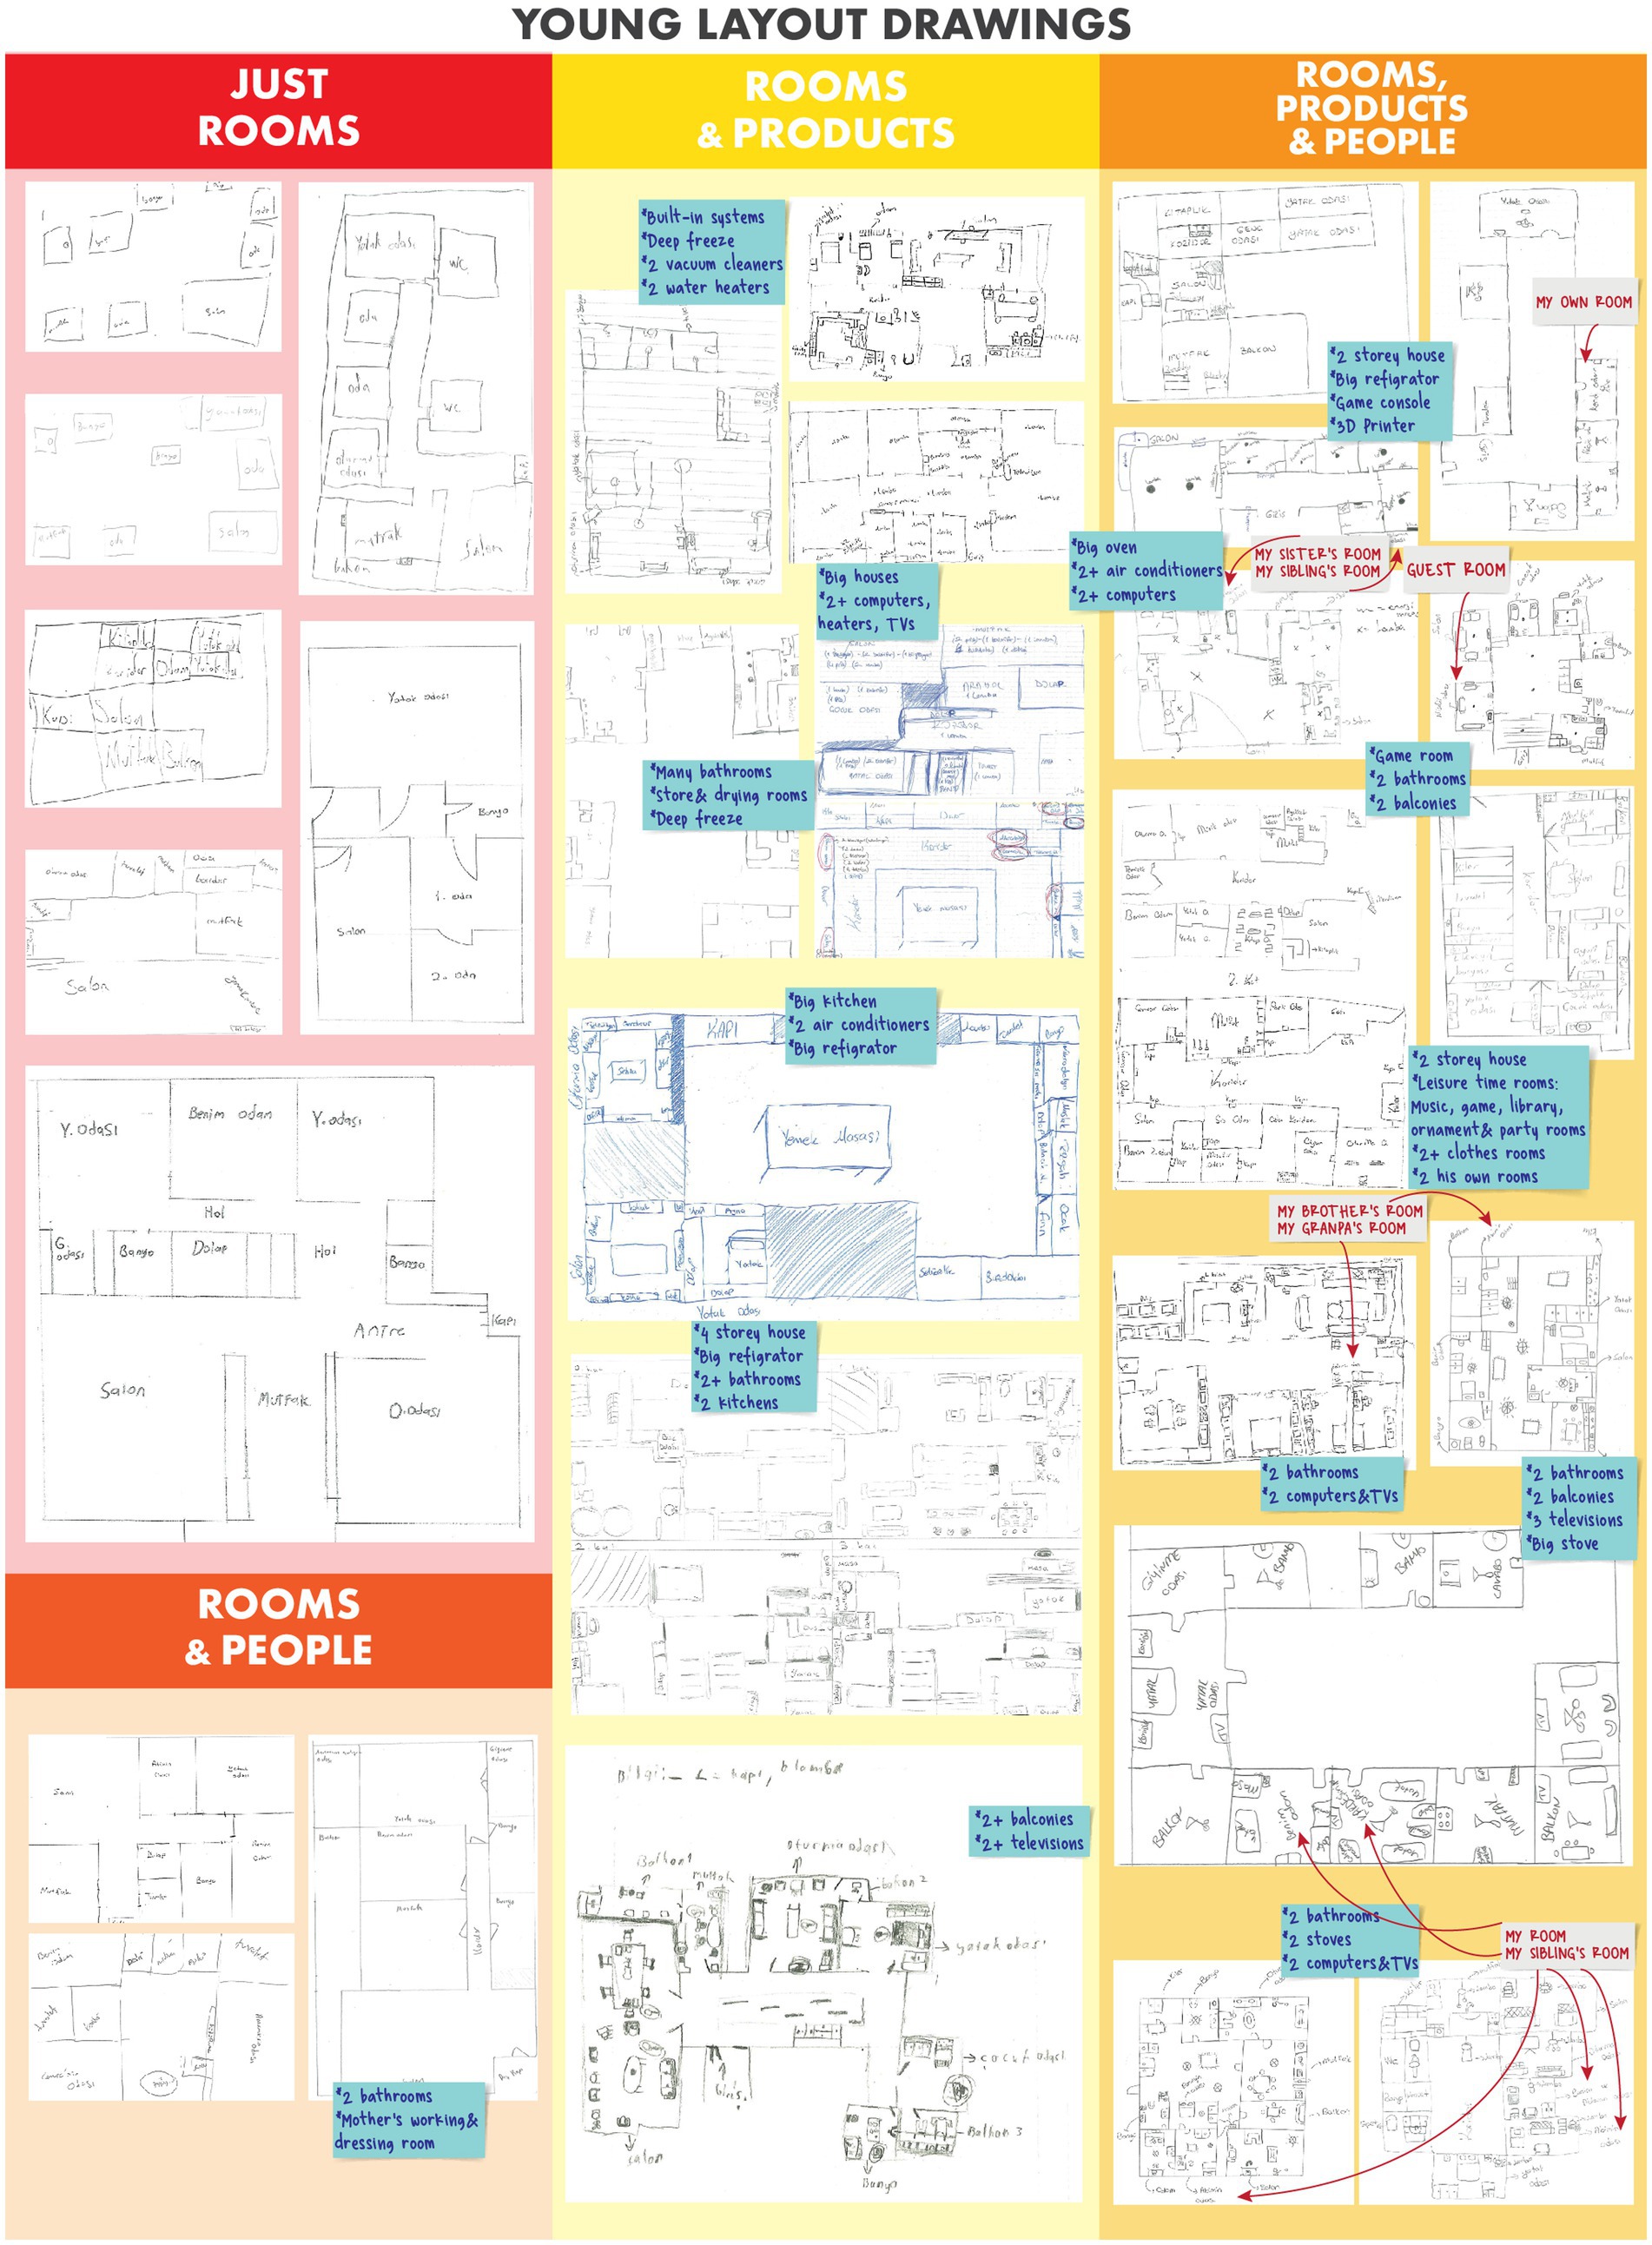
Figure 5. Four layout drawing groups.
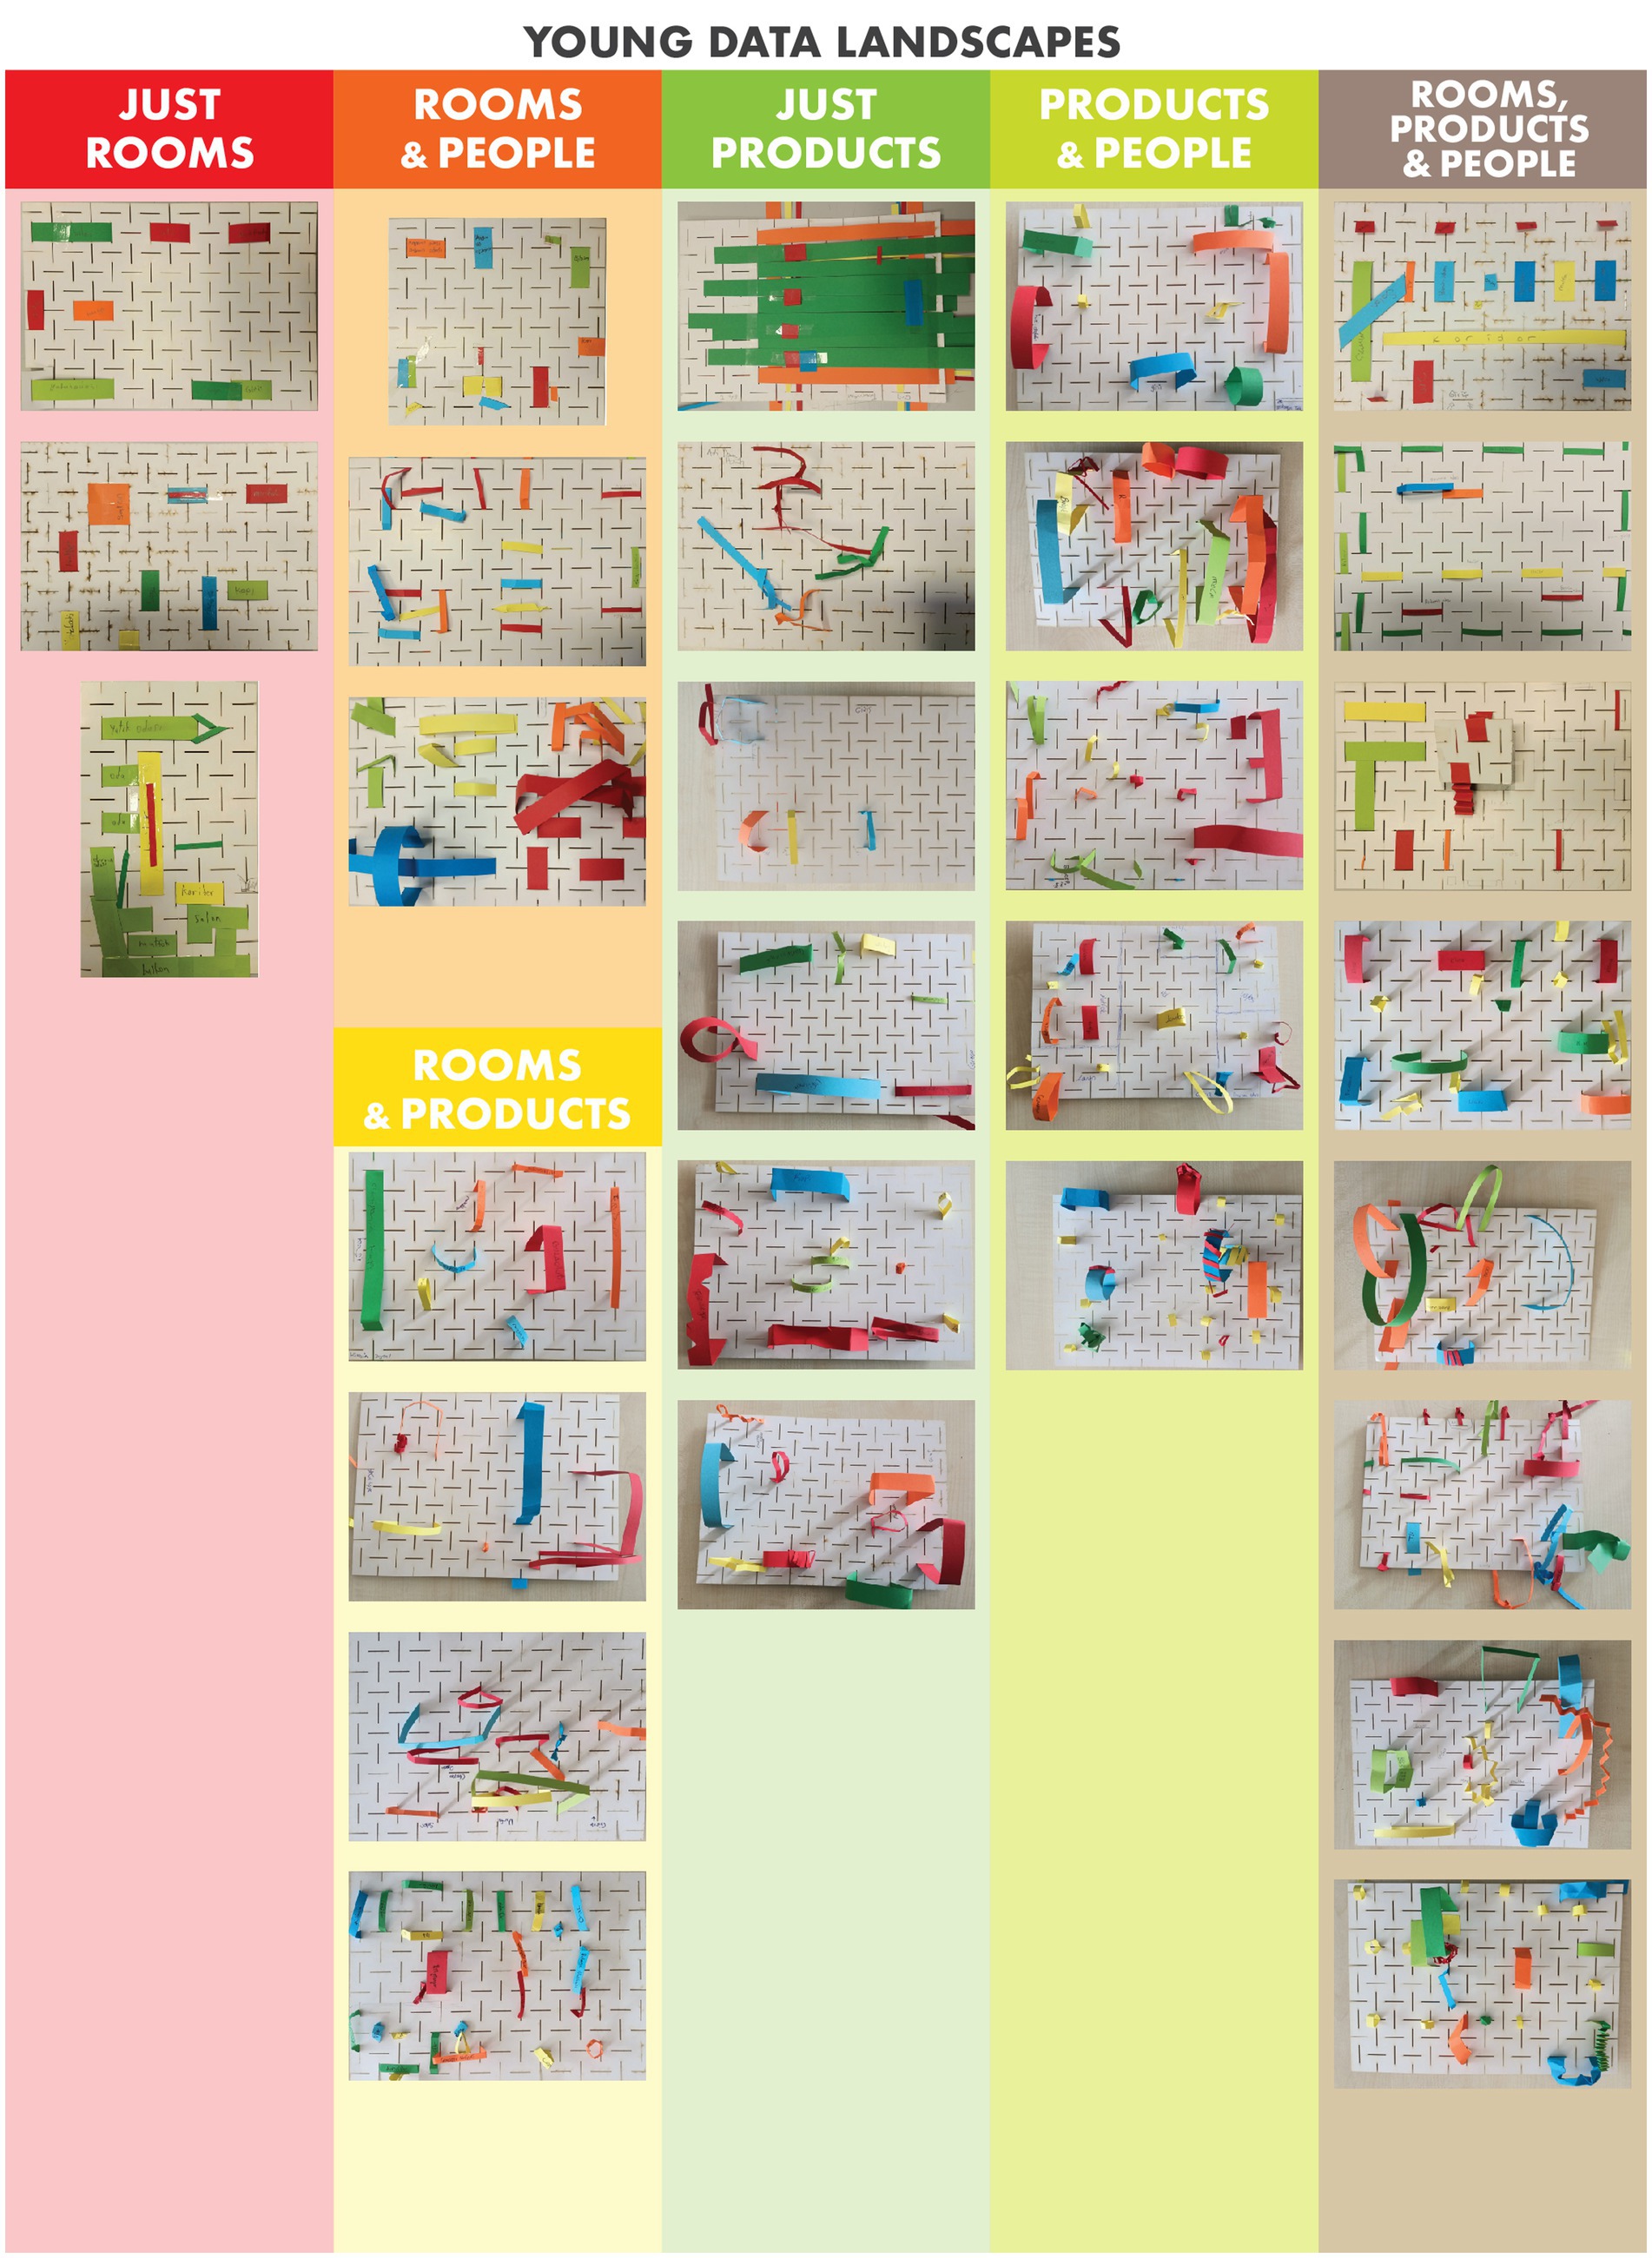
Figure 6. Six data landscape groups.
Building on Ingold (2016) definitions in ‘The Life of Lines’, I conducted a detailed visual analysis of selected data landscapes. Non-energy-consuming elements were marked in grey, while energy-consuming products were depicted with colored strips as defined by participants. Yellow lines symbolized movement and energy use, creating meshworks of lines that reflected intersections between reality and imagination, as Ingold describes. Six examples from each group were examined through this lens.
My analysis of the participants’ energy consumption, as presented in section 4, combines the quantitative analysis of the questionnaires with the visual analysis of the layout drawings. The visual analysis of the data landscapes and narrative analyses of the video recordings from the workshops are used to understand the participants’ habits and awareness, as well as their ideas for change, as presented in section 5.
The study’s core premise is to observe energy use, document it through environmental exploration, co-create energy consumption models, and share insights in workshops. The study provides a comprehensive view of energy practices by integrating auto-ethnography, design anthropology, research-through-design, and collaborative design. The Tangible Consumption Data Landscape transformed abstract energy patterns into concrete, visual, and physical forms. Questionnaires yielded structured quantitative data, while layout drawings and 3D landscapes revealed qualitative insights into spatial and emotional energy connections. Applying Ingoldian theories encouraged reflection on socially interconnected consumption practices, fostering awareness and opportunities for change.
I split my analysis into two themes: my deductions from contextual understanding and the teenagers’ own perception of energy consumption. Contextual understanding is required to grasp the nuanced, real-life environments, behaviors, and practices that shape participants’ experiences and interactions.
From the questionnaire, the layout drawings, and data landscapes, it is possible to deduce where energy is consumed in the home, by which household members, the size of the homes, and where certain products are located. This information also helped me to understand some drawings and catch some details on landscapes. The process allowed me to verify the consistency of the information they provided while also serving as an intermediate step for them to observe before transitioning to visualization and physicalization.
The questionnaire prompts participants to count how many rooms their homes have and describe what their homes look like. Particularly in the question about where the heaters are located, many participants answered with responses like “One in every room: 1 my room, 1 living room, 1 kitchen, 1 bedroom, 1 my sibling’s room, 1 guest room” which allows me to estimate the number of rooms. The layout drawings support this information visually and provide further details about the sizes and purposes of the rooms. The smallest home has four rooms (Figure 7, left), while the largest is four stories with eighteen rooms (Figure 7, right). Typically, each home has two toilets. Most have two bathrooms. The living rooms are 1.5 times larger than the other rooms. Some kitchens are larger because they include a dining table or a second small kitchen. Likewise, many homes have extra rooms such as guest rooms, dressing rooms, library, music room, and laundry room. Except for the examples with two- and four-story houses, the average home has six rooms, two bathrooms, and toilets.
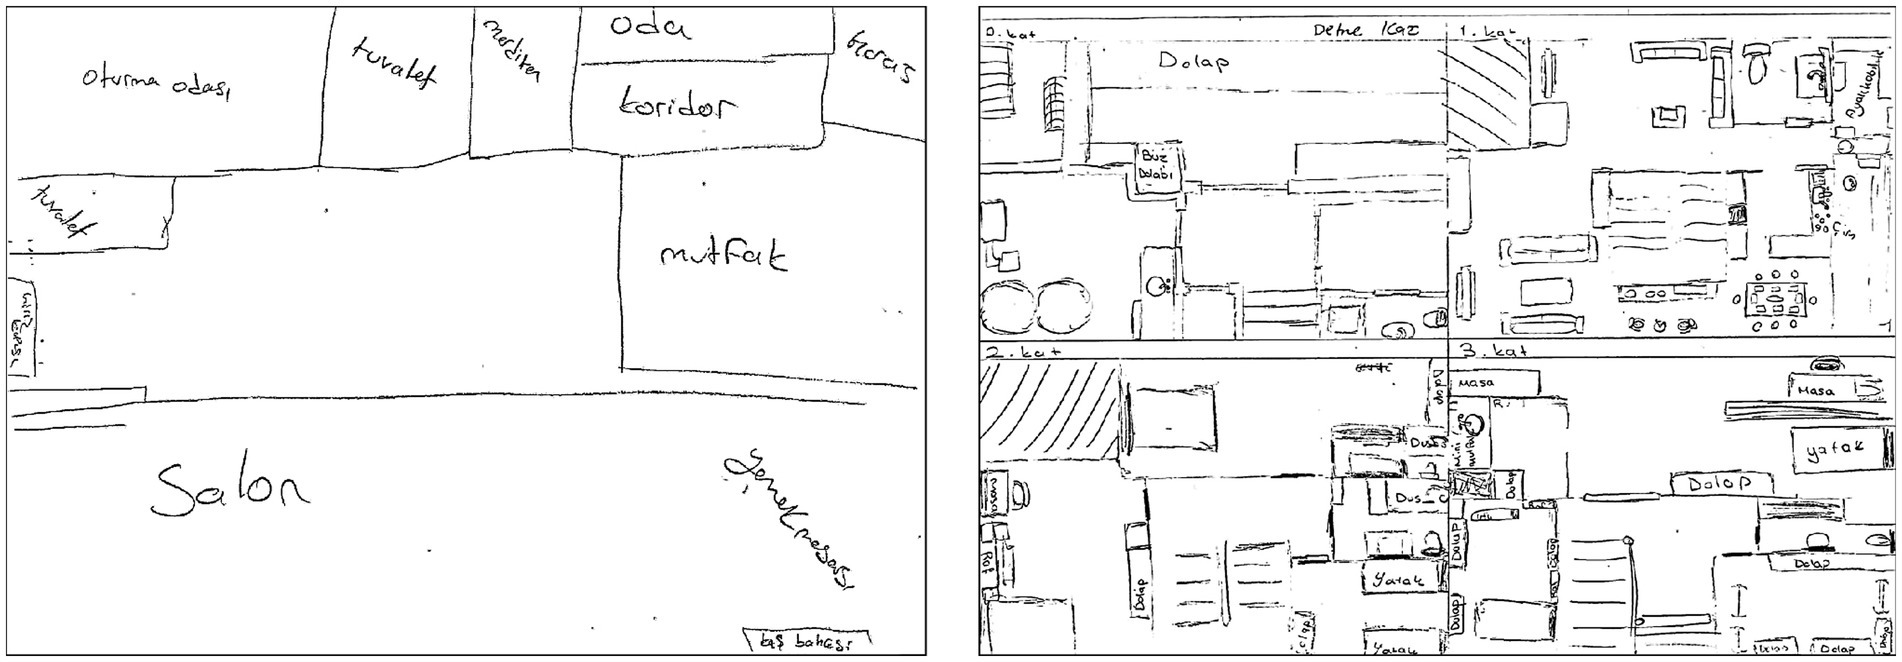
Figure 7. Four-room house (left) and a four-story house with eighteen rooms (right).
The layout drawings directly indicate the parents’ and children’s rooms, even if the questionnaires do not provide that information. Moreover, these drawings provide more detailed information about who these individuals are, their gender, their age groups, and the products and rooms they use. Participants describe the occupants of the home by naming rooms such as “my room, my parent’s room, my mother’s dressing room, my brother’s room, my grandfather’s room, play room” thus identifying the residents of the home and the purposes of the rooms. The families range from 3 to 6 members, with a typical household in this dataset consisting of five members: the participant, a mother, a father, a sibling, and a senior family member.
The second question of the questionnaire provides insights into the products present in participants’ households, their quantities, and placements. Layout drawings and data landscapes reveal common product locations, such as fridges in kitchens, washing machines in laundry rooms, and heaters in living or personal rooms. In Figure 8 (pink bars) I calculate the average number of each product type in a home, highlighting that lighting fixtures, chargers, heaters, and telephones are the most prevalent, while clothes dryers, water dispensers, and microwaves are less commonly found. Some larger households include higher quantities of certain products, although participant responses occasionally need more precision or complete sections instead of the answers like “unknown, not in use, or broken.” To address this, a baseline assumption of at least one unit per product is made for analysis.
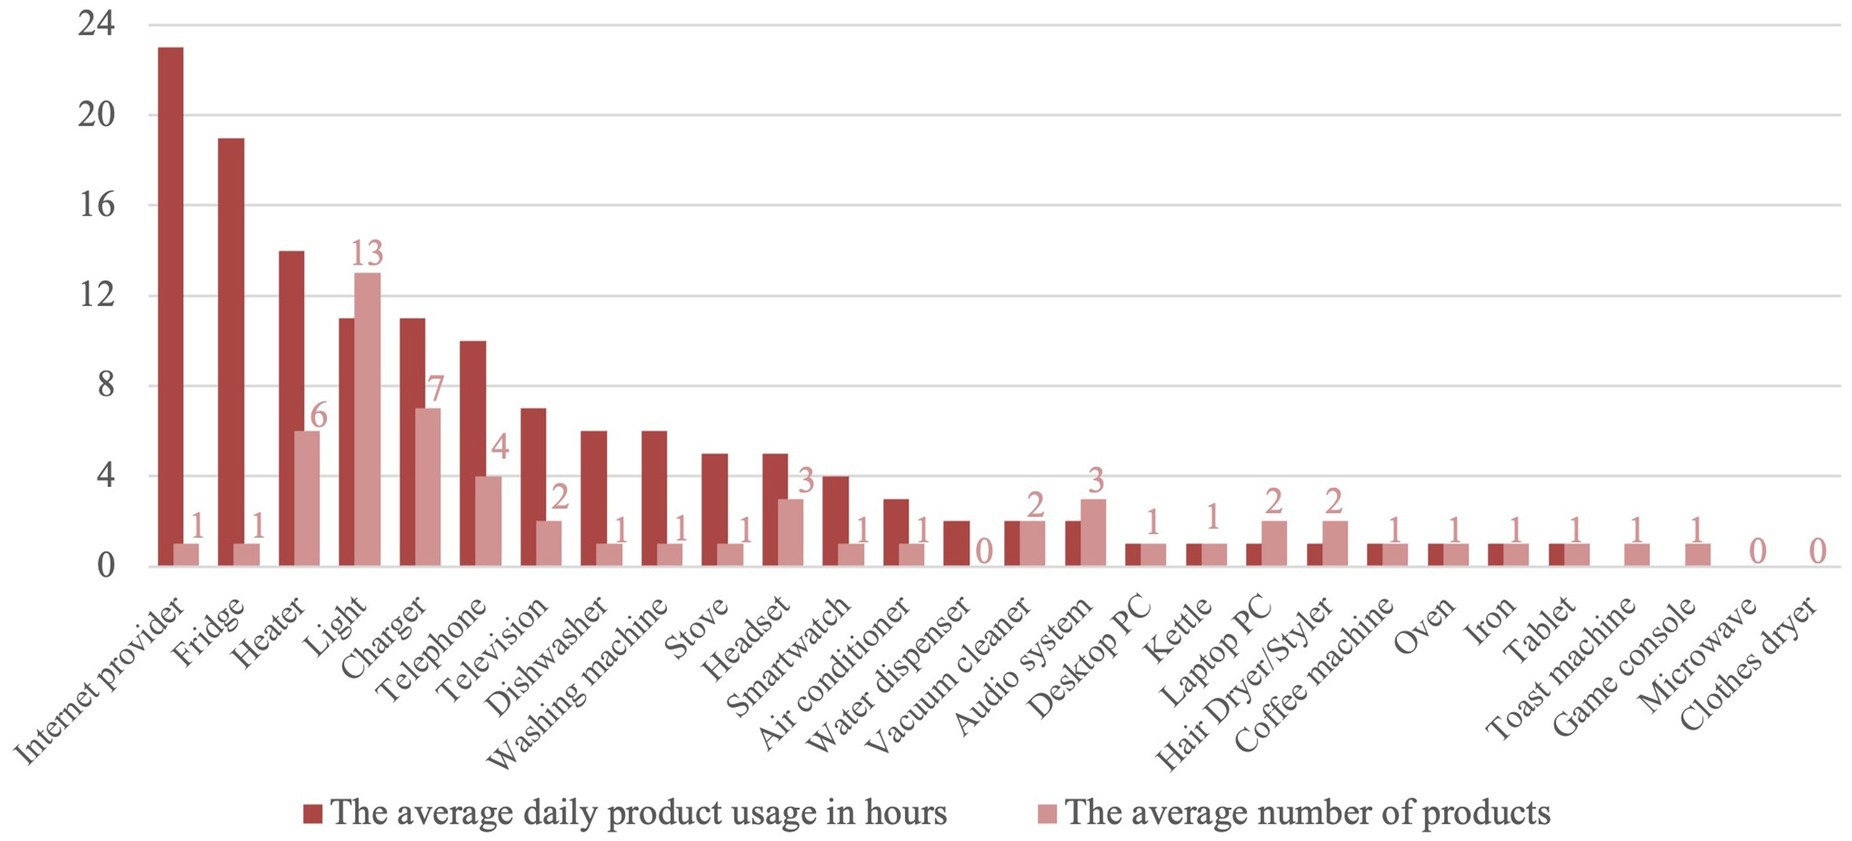
Figure 8. The comparison of the average numbers and usages of products.
Personal items, such as phones, chargers, and headphones, often exceed the number of household members, reflecting variations in individual ownership. Drawings suggest that lighting fixtures are abundant, while other products like radiators, televisions, and computers indicate significant energy consumption. Participants emphasize these items as focal points of home energy use.
The first question, “Approximately how long do you use this product during the day?” generates data on average daily product usage (Figure 8: red bars), with internet providers, refrigerators, radiators, lights, and chargers emerging as the most used items. Conversely, products like irons, tablets, and gaming consoles see less frequent use. Usage data sometimes reflects individual rather than household-wide perspectives. Non-numeric responses, such as “all day” or “in the evenings,” are converted into approximate values (e.g., 24 h or 6 h) to maintain consistency in analysis. While these approaches offer a general understanding of energy use, they highlight the contextual dependence of teenagers’ predictions about energy consumption patterns.
Some participants respond with more general statements about time in the questionnaires. For example: “During the summer, just in winter, every evening, weekends 2 h” etc. Some answers focus on how they use it or even their habits rather than how long they use it. These are like “sometimes, occasionally, very rarely, every moment, every second, about 1 h.” In their data landscapes, they sometimes use the thickness, sizes, and colors of paper strips to express how long they consume energy.
Analyzing the responses to the third question, “Would you list the 3 products that you think consume the most energy by writing ‘1–2-3′ in the box opposite?” I aim to understand how much energy they consume. This is challenging due to the not-so-clear ranking by the participants. However, if we consider each numeration in the products as a unit, the daily highest energy-consuming products within the household are fridges, washing machines, heaters, phones, stoves, and dishwashers. Smartwatches, sound systems, hair dryers, water dispensers, tablets, and gaming consoles are the least-energy-consuming products. There appears to be a consistent relationship in Figure 9 between the usage processes and the number of products in the home.
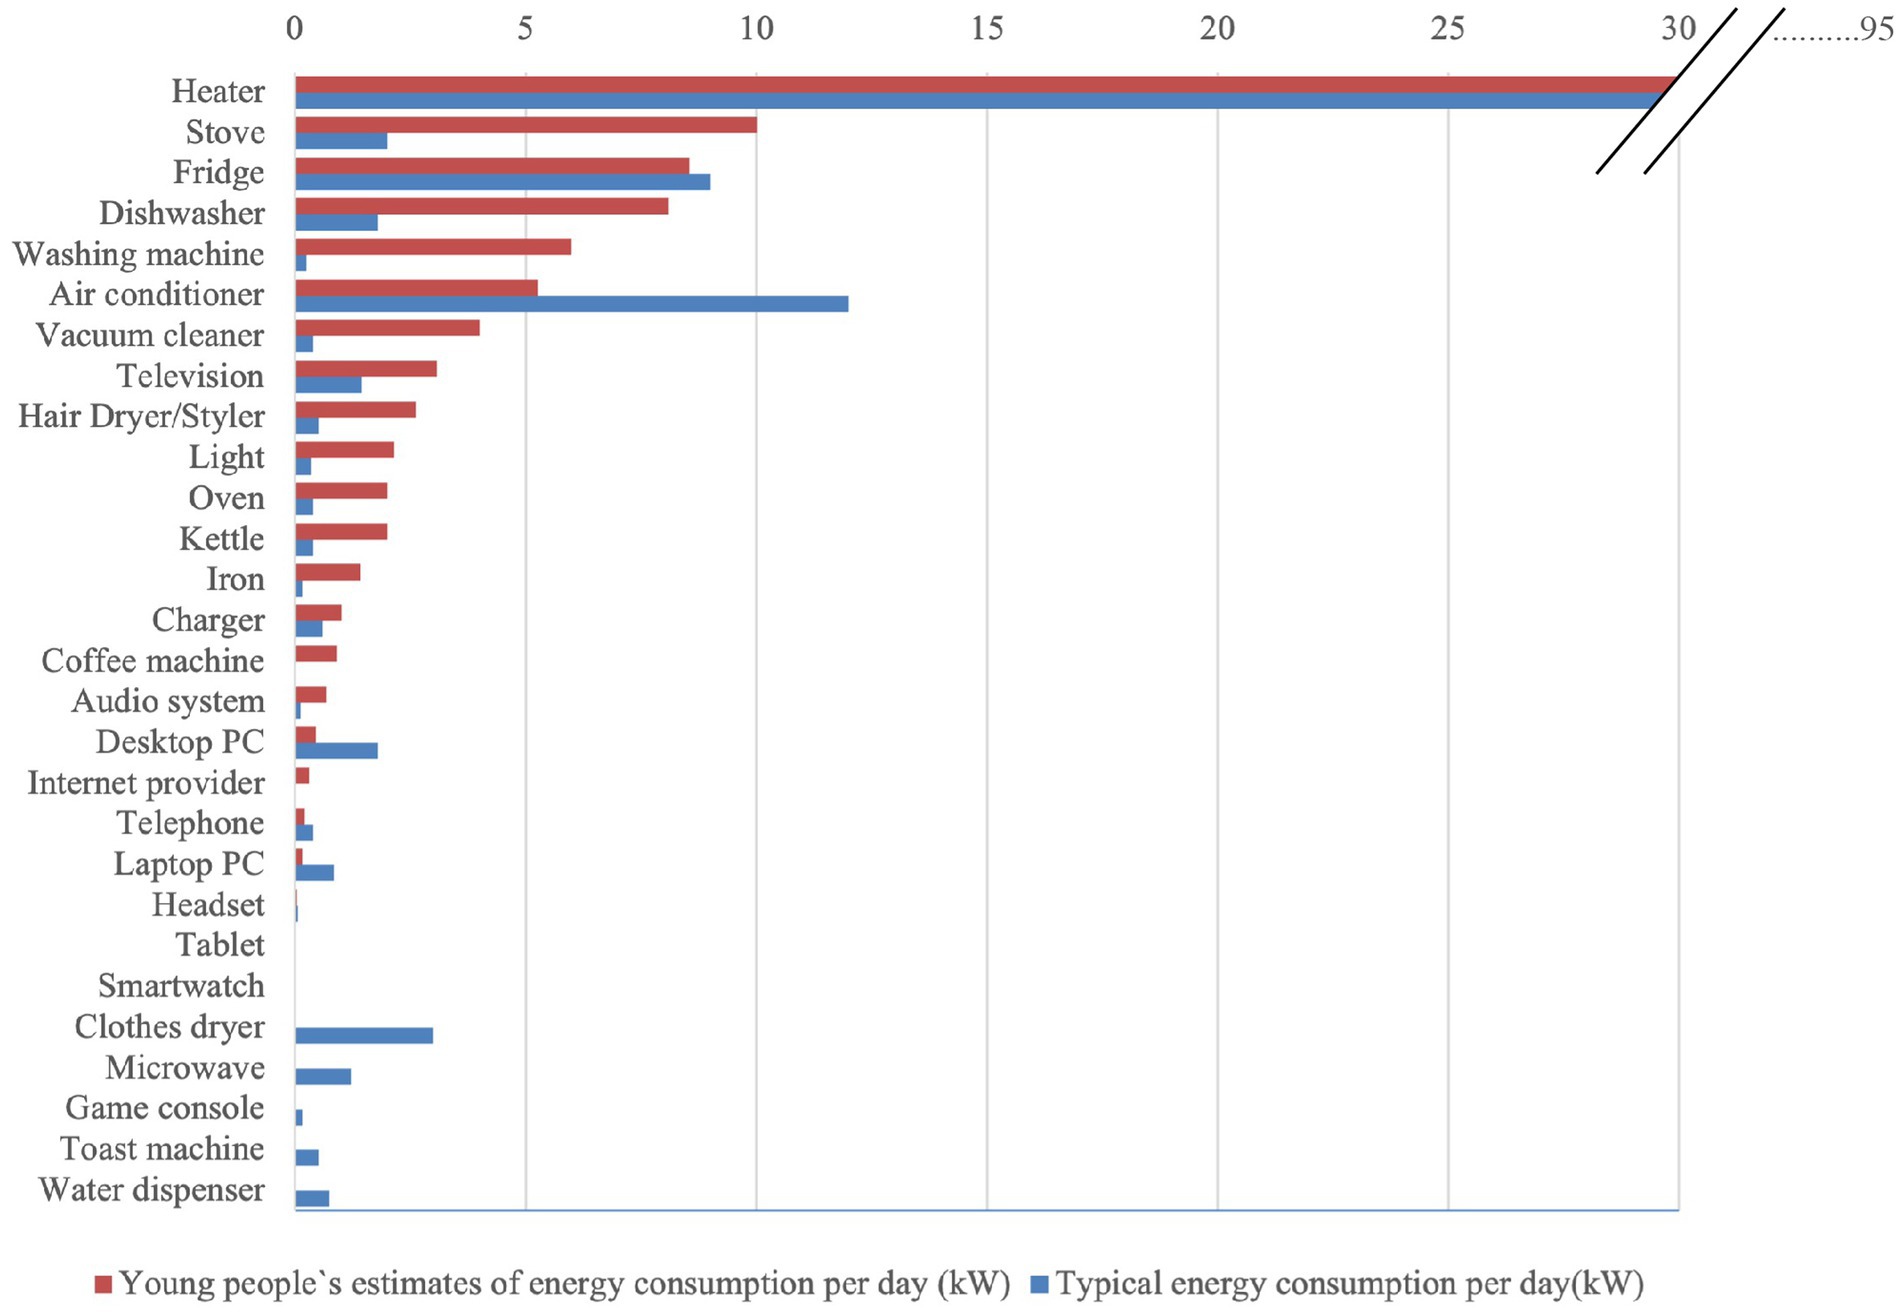
Figure 9. Estimated versus calculated energy consumption.
If I am true to the teenagers’ own reporting on energy consumers’ and products’ numbers and hours in operation, I can calculate the ranking of energy consumption in Figure 9. I reach the values containing the estimated numbers of teenagers (Figure 8) by multiplying their values with the hourly power ratings [Energy Usage Calculator (n.d.)]. I compare this value with a four-person family’s average daily energy consumption data. I triangulate data from different sources (Issi and Kaplan, 2018; Marsh, 2023; Rosin et al., 2012; Şahin and Köksal, 2014).
While the teenagers’ estimates of their household energy consumption are not entirely off the mark, it is evident that their perception of energy consumption is somewhat egocentric. For example, the mismatch in the number of mobile phones and household members is likely an oversight. Likewise, many participants underestimate the energy used to power the clothes dryer, likely because they have limited direct interaction with this product. It seems that teenagers are more aware of their energy consumption when it relates to their own personal use of the products. It is important to understand how the participants’ perceptions of energy consumption may affect their capacity to change their habits.
From the debriefings and workshops, it is possible to make inferences about the participants’ daily product use and energy consumption habits. At the end of the second workshop, I encourage the teenagers to make suggestions about how they may change some consumption habits in concrete ways while discussing each other’s data landscapes.
To kick off the questionnaire and drawing activity, I challenge the teenagers to discuss energy and energy sources with their teacher. The first group says they use electricity and natural gas at home, while the second group includes solar energy along with electricity and natural gas in their response. Inquiring how to tell if an electronic device is working or not, they describe sensory warnings:
“The light turns on, like the red light on a television,”
“(…) it probably makes noise,”
“(…) on the stove, for instance, it heats up and even flames burn.”
After distributing the questionnaires and introductory guide, I invite the participants to do a five-minute exercise. I give them paper strips in four colors and ask them to create a figure that symbolizes the energy used in their homes. This is a warm-up exercise for thinking through tangible things about a very abstract topic: energy with abstract concepts: lines. Since they are unsure about what criteria to base their creations on, they ask questions like:
“Is blue a better color or green?”
“If red is hot, then blue is cold.”
“Can I directly make something that represents the electricity my computer consumes?”
“If I make lamps, it would take too long.”
“Should it represent the entire home’s electricity?”
Here, the participants start connecting the materials they have and the products that consume energy. Many of them try to describe their energy consumption through their own electronic devices, such as phones, tablets, and computers. When I ask them about usage times and mainly when they check their screen times, their habits regarding the use of these products begin to emerge more clearly:
“My phone is very important to me. It’s wherever I am. Actually, it can be everywhere in the home.”
“I have a computer and a 3D printer. I run them every evening for three hours.”
“I look at my tablet for at least three hours.”
I ask them while they are still sharing their energy consumption stories if they can reduce their usage of energy where they like to start:
“I normally do not have much time to look at my phone, but it shows at least five hours despite that. So it is not easy to reduce exposure. Because one message comes and you spend fifteen minutes on it, just opening it once already accounts for an hour and a half.”
“I thought I used it for at least four hours. Then I clicked on this app and looked at it a lot at night, and it turned out to be nine or ten hours.”
They grab their phones from their pockets and automatically check their screens immediately. They are considering reducing their phone usage time. Although I convey to them that manipulating the material in terms of color, thickness, length, height, and shape can provide information about energy consumption, most initially use color coding. However, as they focus more on their favorite objects, they invest more time considering shapes. Initially, there was no distribution based on rooms, but as they conversed with each other and asked me questions, the strips’ positioning and relationships also changed. They place the lamps and large household items in the drawings according to their locations. However, they show less understanding of lamps or these large household appliances at home:
“The dishwasher, I think, uses much water and electricity. It runs 1–2 times every day at home.”
“I think the lamps consume the most electricity (…) There are three or four in the house. There’s one in every room.”
I noticed that this participant did not include the bathroom, toilet, and balcony lamps when mentioning the four rooms in her home. After the briefing and the mini exercise, according to the participants, the products that consume the most energy at home turn out to be the refrigerator, television, Wi-Fi modem, washing machine, alarm systems, and lights. After one week, when the participants finish their data landscapes at the end of the workshop, they share their daily home habits about energy and product usage:
“(…) I made it orange because the washing machine in the kitchen is used more often there.”
“(…) I made a vacuum cleaner here and twisted its cord a bit because we do not use it much during the week.”
Furthermore, in more complex and formal examples, they provide more detailed explanations about their habits:
“(…) I made the television in the next room red because it’s constantly watched. These are the lights that consume the most energy at night in both rooms. These other lights are in the corridor, this kitchen, this is in my bedroom, and this is on the balcony next to my bedroom (yellow lights). This computer, I made short and green because it’s hardly ever used, almost never.”
“Here is the entrance of the house. I made a hair straightener here. I made its color orange because I use it a lot. Here, I made the television (blue paper strip).”
While they are sharing, they start to notice the overuse of energy by considering the other products that do not have any energy source but might make a ground for it:
“I made lamps for rooms here that aren’t really necessary, like parental bathroom, closets, storage rooms (…) Yes, they are not turned on much, but when left on, they are forgotten because they are not used much.”
“(…) there is L-shaped sofa here, we are mostly sitting here. And cables all around. Because while we are watching TV, here, everyone is charging their phone and plays here.”
Since these habits are typical and traditional family-gathering behaviors, they may not be easily noticeable compared to others. Still, it seems necessary for the entire family to do something to change this situation.
Participants tend to share more personal habits, and their shared experiences are closer to reality but are also more self-centered. However, as they engage in data about more products, people, and rooms, they begin to share about other household members, their usage patterns, and even habits they were unaware of. While some of this information may be dissimilar from reality, the process allows for sharing more data and facilitates extended conversations.
The final part of the data landscape workshop, ‘Playing each other’s data landscapes’, encourages participants to discuss ideas for changing their habits. After presenting their data landscapes, each participant examined and interpreted the data landscape made by the next participant. A participant notices his friend’s data landscape does not have any electrical connections, but she is still talking about how her family forgot to turn off the lights:
“I created the star model to show all the cables and sockets in the house.”
He adds a star-shaped, big, and yellow strip, which may represent a signal that her family, and offers a solution to forgetting to turn off the lights (Figure 10, left). Another participant added an orange curled strip as cable when she considered her friend’s grandfather’s old, rarely used television, which might still be plugged in (Figure 10, middle):
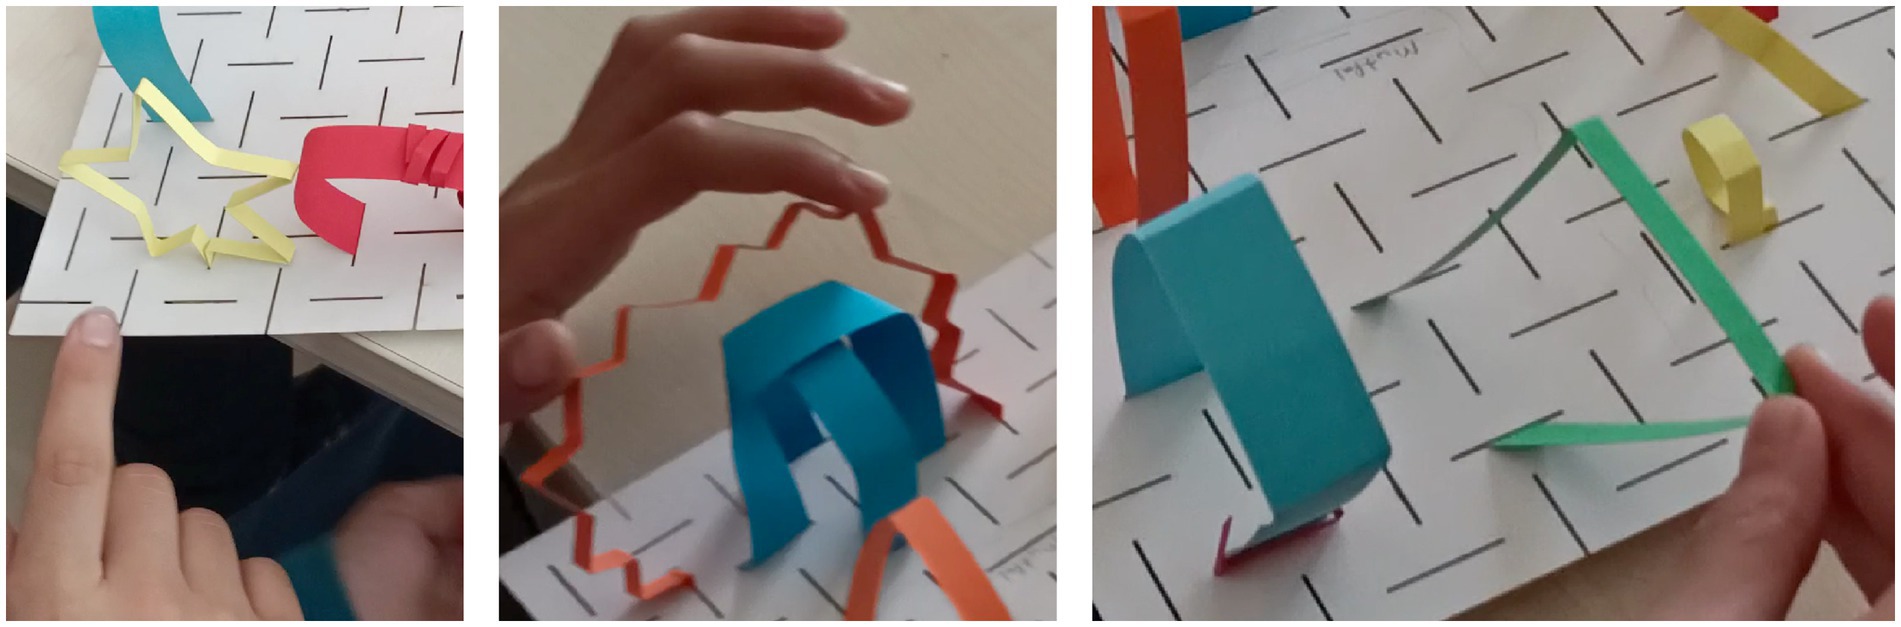
Figure 10. Power cables (left), television cable (middle) and new fridge (right).
“They do not use their televisions (two blue strips knotted in the form of a blue box); for example, if they are not used, they do not use electricity either. There is no need to keep it plugged in. So, I unplugged it and made the plug orange. I think it is important.”
For a slightly more radical solution, one participant suggested her friend call a repairer for a broken refrigerator or buy a new, more energy-saving one. She demonstrated this by removing the previous thick and high blue strip and replacing it with a thinner green strip (Figure 10, right).
I find this last part to be quite effective in terms of them listening to each other’s narratives and gaining different insights. Although most changes involve adding lights, chargers, computers, or kitchen appliances or leaving them out of their models, some interpretations are quite interesting.
We can see that the narratives from these three methods allowed some participants to “step out of their comfort zones by assuming the positions of decision-makers and bringing in deeply personal experiences” (Akimenko and Kuure, 2017, 7). Focusing on the narratives from Data Landscape sessions, we notice some similarities and differences in the 6 groups of Figure 6. Akama and Ivanka (2010, 12) say: “The design tools, as scaffolds, enable people to express their thoughts, feelings, and dreams.” To understand how the scaffolding helps the participants make sense of their habits, I analyze the data landscapes further using the Ingoldian concepts of lines, blobs, and knots and noticing the concrete wordings in the participants’ video narratives. I deepen the 6 previous examples in Figure 11.
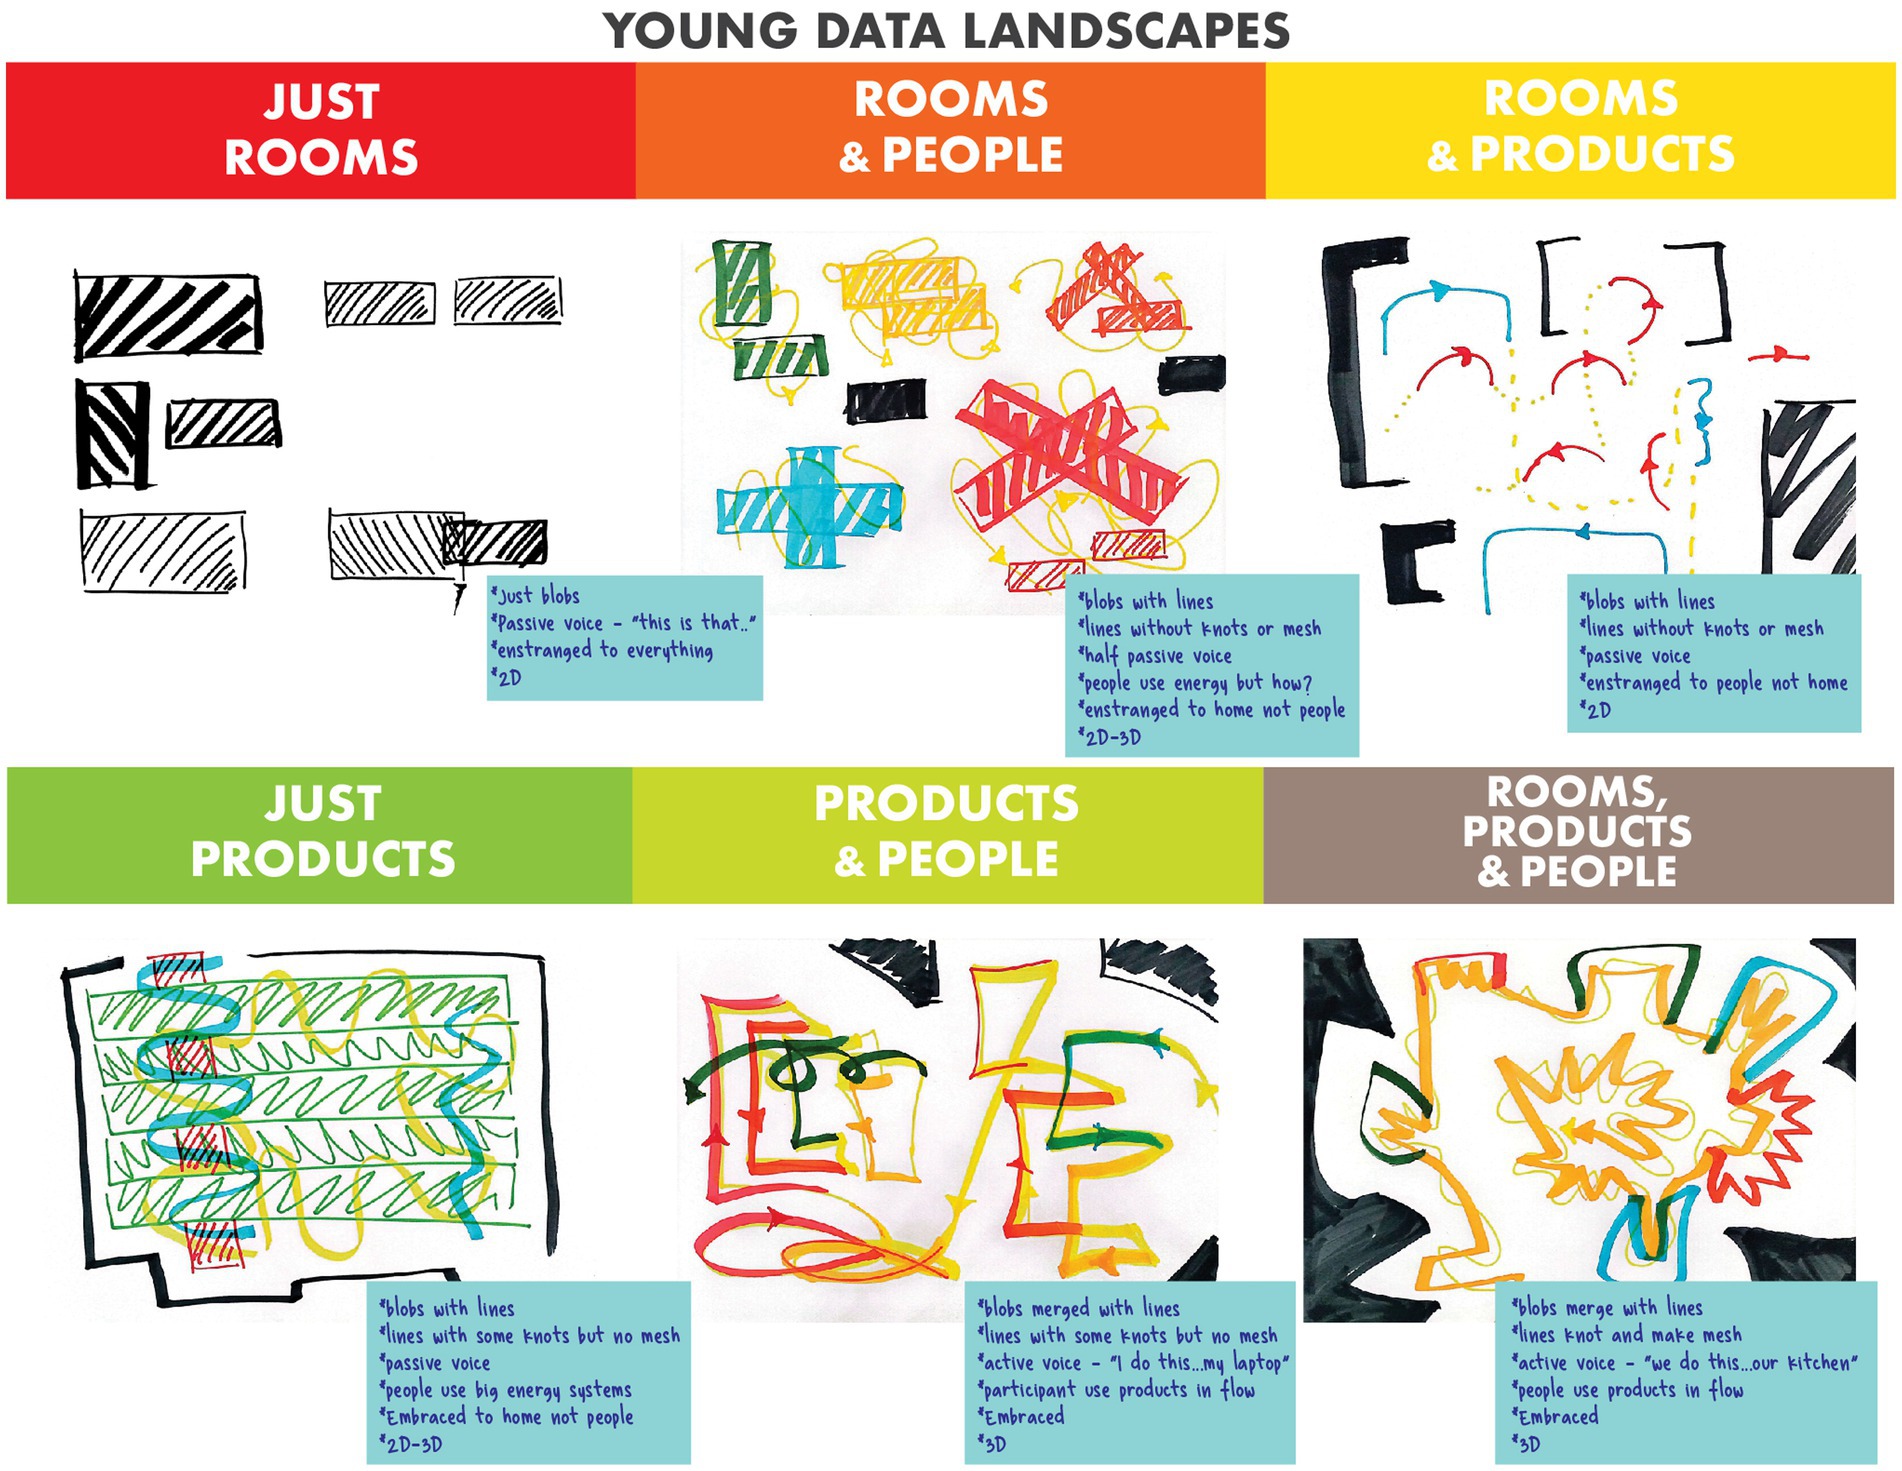
Figure 11. Ingoldian examination of data landscapes.
Based on the explanations in the participants’ video presentations of the data landscapes, I align each physical representation with a particular group. As we move from left to right in the groups in Figure 6, we might notice a change in the participants’ verbal expressions. In presentations featuring only rooms or rooms and people, the youth use passive observer-like expressions such as “(…) this is the kitchen, and this is the children’s room.” However, when we come to groups with just products and products and people, the “this is” language is sometimes replaced by active-voice sentences such as “I am” or “we are.” Moving left to right, we also gain more detailed information about to whom the rooms or items belong. They even discuss the frequency of use of these items, their locations within the home, and even how these locations affect usage. For this reason, we can see that the diversity of shapes and colors increases, and consequently, the details shared and the variety of data also increase. In other words, as participants move from left to right, they transition from being strangers to a reality to becoming more embraced in that reality.
In the groups, as one moves down from the top, the works transition from two-dimensional to three-dimensional. As I specified in the instructions I distributed to the participants, they are discussing whether their energy consumption is “less or more” and “good or bad” and whether they “like or dislike” using the products by manipulating the papers at different heights levels or thicknesses, or whether this consumption has any “positive or negative” effect on them. The complex flat shapes, on the other hand, provide us with general information about the shapes of the products. For example, lamps are generally represented as small, crumpled yellow shapes, while products such as televisions, refrigerators, and washing machines are expressed in more rectangular forms.
Characterized by their colors, heights, thicknesses, and shape codes, data landscapes (Figure 6) transition from the inanimate world of materials from a blob-like experience to a lively line-like experience where people and products intersect, expressed with specific lines (Christensen, 2020). I explain these experiences through visual analyses in Figure 11 according to Ingold’s terms (2015, 2016) and my narrative analyses before. While they were sharing their line-like experiences through this co-creation process, I noticed that some participants gained more awareness of their daily energy consumption. In the last example of Figure 11 from the group of Rooms, Products, and People, the participant tells of her fluidity and vivid experiences:
“We enter the house from here. There is a kitchen here. There is a dishwasher in the kitchen. I chose to make it green because we use it occasionally. I did not make it red because we did not use it that exaggeratedly. Naturally, there is also a large lamp in the kitchen. Then there are two toilets. Maybe it seems a bit much, but one has a shower, and the other has only a sink. I wanted to make them blue just because of the water usage. There is a washing machine in the corridor between the two. We use the washing machine frequently, so naturally it is red. There is a lounge here. We have air conditioning in the living room. Since the room is a little big, we must use two lamps. We all watch TV there together. Since we often use air conditioners, I chose to make them red. We have a modem here. It is the most used thing at home anyway. Because we need the internet a lot while studying, etc. I have my room here, with an air conditioner and a lamp. The bedroom has an air conditioner and a lamp for my mother and father.”
She embraces her experience as if she is walking around the house with an energy consumption line and touching all products with the other house members. The more she uses materials in different shapes, colors, or sizes, the more she maps the people, weaves complex mesh, and finally enriches her personal knowledge.
As the life of lines is continuous and generative, I observe that the enrichment of awareness about the expression ways and energy consumption knowledge in their house are also open-ended and continuous, and the methods are fertile. Like Gaver et al.’s cultural probes (Gaver et al., 1999, 2004), the energy lines of teenagers became playful and evocative, embracing the uncertainty of invisible connections in meshwork around their bodies, other people’s bodies, house appliances, and rooms.
Data Landscape sessions enable participants to demonstrate how reality and imagination come together. Ingold points to three properties of imagining for real: “the promise of creation, the quality of attention, and the relations of correspondences” (Ingold, 2022, 5). With questionnaires and layout drawings, I notice that participants provide examples of these three properties as they go through the data landscape workshop steps. I try to signify these properties with two examples of data landscapes and explain how the Ingoldian way of imagining assists them in gaining awareness and knowledge about energy consumption.
In my first example, the creation process of the participant who writes “Lumos” (a wizarding spell that can make the tip of a wand emit light from the Harry Potter series), where I ask the participants to write their environmentalist pseudonym on the questionnaire and layout drawing paper, is quite interesting. For example, in her survey, she responded to the use of the heater as “all day in winter,” the use of the refrigerator as “all day,” and the use of telephone and television as “almost all day” (Figure 12, left). The same participant depicted household electrical appliances and lighting that consume energy, exactly as I informed in the layout drawing. Although it does not provide information about other family members in the house, the rates of rooms and the sizes of products look quite right. She drew some products that are rare in the other drawings. Moreover, her home includes completely different products. For example, instant water heaters, built-in appliances, and deep freezers (Figure 12, middle).
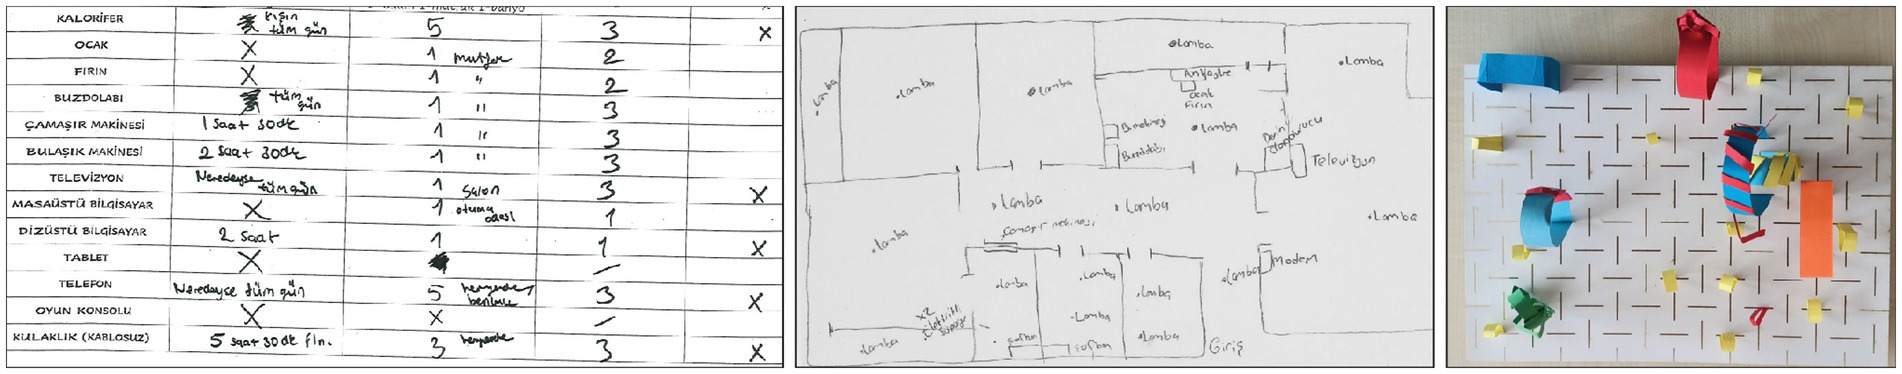
Figure 12. Lumos weaves energy meshworks: her questionnaire (left), layout drawing (middle), data landscape (right).
While Lumos’s layout drawing is in the Rooms and Products group, her data landscape is in the Products and People group. Lumos sometimes talked about the household and energy consumption, which she did not mention in the drawing, with we-language (Figure 12, right):
“We have yellow lamps everywhere. I made it small because I do not believe our lamps consume much energy since they work with low voltage.”
While trying to express electrical energy in technical terms, she talks about the color, size, and thickness differences of the products by storytelling:
“I made orange for TV orange because it is on a lot at home in the evenings. That’s why I made the TV a little bigger. I added a small modem here. Since the volume of the modem is small, I made it small, but I made it red because the modem is always on. I made a green vacuum cleaner here. I made two because I have two vacuum cleaners at home. But of course, they do not always work. I built the dishwasher here. It is blue because the dishwasher is wasting water even if it is hot. Of course, I added electrical energy in yellow. There is a stove and oven here. The reason I made them red is because they emit high heat while working. They use high energy for this much heat. I added red for the refrigerator here because the refrigerator is constantly working. I put the washing machine here (on the other blue thick strip).”
As we know from her drawing, the water is probably heated by solar energy, and she also mentions the two cleaning robots in her drawing. She finds ways to make the levels of energy consumed physically visible, not just in color or thickness but with another strip tangled around products. When I ask what exactly are those red twisted paper strips, she explains:
“I show the energy levels we spend. For example, I brought it up to seven (played with the red strip on the refrigerator). Three for the washing machine. Because we do not spend that much energy on washing machines. It is more water….”
When I examine her data landscape with Ingold’s terms, the energy lines, which she makes invisibly with words but visibly with strips, and the blobs, which are the products at her home, support this awareness and personal knowledge visually and physically. While she compares the products’ energy consumption levels, she knits them all together with an electrical energy meshwork. She creates a narrative and visual electricity line where she and her family consume electricity by simply following lamps and entering rooms if the lights are on.
Beyond this, we can see that her creation process is a continuous act “driven by creativity” (Ingold, 2022:5). She is questioning, drawing by gathering lines and blobs and shaping by knotting, knitting, or weaving. Ingold explains this process as “Creation, like laughter, exists only in the act. And if it has its reasons, they are reasons that think themselves out in the creative process itself, rather than preceding it…” (2021b:16). She wants to express energy consumption at her home and this maybe not a reason but a purpose, in her creative process and evolves her skills during each method and increases her awareness.
In the first sessions in both schools, some participants could not pay enough attention to the context of activities, struggled to complete the questionnaire, or answered questions differently. In my second example, I noticed that one of the anonymous participants focused on more and different points with each method. In the beginning, he answers the questionnaire generally, such as “in summer once in a week” or “2–3 times” (Figure 13, left). In his layout drawing, we can see the lights; he is the only one who uses two colors, but the other house appliances are not as clear as the lights (Figure 13, middle). It is more oriented to all products and room separations in the house. He may be an only child because he wrote his room as “my room”; there is no trace of the other people. Because of this, his layout drawing belongs to the group of Rooms and Products.
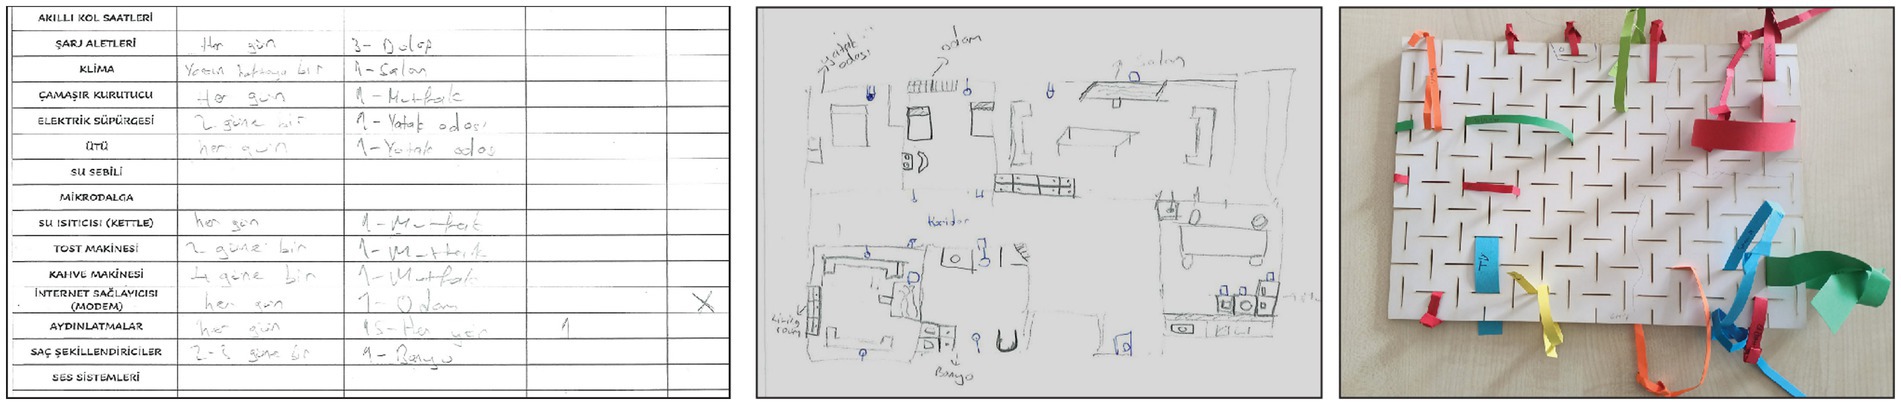
Figure 13. Anonymous environmentalist knots energy lines: his questionnaire (left), layout drawing (middle), data landscape (right).
The exciting part is that his layout drawings (Figure 13, right) and his data landscape match each other. He turns every detail in his 2D drawing similarly to material creations on his 3D landscape. However, we are getting more information about the products, which was not apparent before in his video presentation. In his data landscape:
“This is the house’s entrance; there is a refrigerator here; it is big because it is used all the time, but this is not a problem for me since it keeps the food cold. That’s why I made it green. There is a dishwasher here, too; it has curves because it is used a lot and is orange. There is a washing machine here too, and it is curved and long because it is used regularly once a day.”
While he shows energy consumption levels with colors, sizes, and thickness, he also adds another way of shaping, like Lumos: knotting strips. More knots and curls in lines means more energy consumption. Further than this, he talks about his approaches and feelings to the main TV at home and his phone and computer usage:
“There is television here, too. The television is always on in our house. That’s why I wanted to make it red and thick. The small, red, and thin ones are the lamps. They are usually on. This is my phone; I wanted to make it green because it is not a problem for me to use it, and I am happy when I use it. Here, my computer, it’s just as green and small.”
His data landscape is in the group of Rooms, Products, and People because he talks about his family, too:
“Here is my mother and father’s bedroom and my room. There are combi boilers and orange because we only run them in the winter. My grandfather has a television here, we do not usually use it much. Again, the small room (Grandfather’s room) has only one chandelier, and we do not use it often. I wanted to make it yellow because of that.”
If I address his data landscape considering Ingold (2015, 2016) terms, he is knitting the energy lines on the products. He also walks through the house room by room and knows the environment by paying more attention. To Ingold (2022), attention has two sides: perceptual attunement and a stance of submission. In another way, the participants attended by perceiving the environment and adjusting to the changes. He is gaining knowledge by developing new skills or adapting to them.
Ingold (2022, 6) says, “Attention opens a way for an imagination that does not oppose but reaches into and joins with, the real”, and this achieves correspondence. To him, “social life is a long correspondence,” which is “a process, dialogic and open-ended” (Ingold, 2021, 11), and “correspondence is about living together in differences” (Ingold, 2022, 6). For Ingold, when participants start to share their adjustments with each other’s perceptions of their energy consumption, as in Figure 11, their dialogical correspondence increases their knowledge.
I analyze data landscapes by exploring the togetherness of imagination and reality with creation, attention, and correspondence processes. These processes not only endow participants with different types of awareness patterns, other people’s energy consumption stories, and ideas about habit changes but also enable us to comprehend this pattern.
Most people consider energy a tangible resource. We can perceive energy through the numbers on electricity bills and meters or as sensory stimuli, such as the heat and light emitted from lamps and the sound of the refrigerator. Still, these are the concrete data of monthly energy consumption and how we consume energy through products. We need to measure each item individually to know numerically how much energy each product consumes. Moreover, this expression is a numerical expression and is also an abstract concept.
While conducting this study with teenagers, I see that they struggled with questions similar to those of adults, such as “What is energy?” and “How to consume it?” However, the more they give vague answers at the beginning, the more they increase the value of the awareness they reach in the ongoing process.
Moreover, the variety of layout drawings and data landscapes might differ from other groups. The participant’s and their families’ ages, country, culture, and socioeconomic situations can affect the outcomes. Palm and Ambrose (2023) propose that engaging marginalized groups, such as specific immigrant communities, may require alternative communication methods and tools. Considering their precarious and complex daily lives, tailoring events to address critical everyday challenges and tasks could make these initiatives more meaningful and relatable for individuals navigating such complexities. As mentioned before, these collaborative workshops considering sustainability and the future of energy resources are quite new for teenagers in Turkey. Even though teenagers were aware of high prices and the energy crisis, in some content, they looked confused about how to take action or position while we were talking about young people’s energy movements in recent years. In the subsequent years, I repeated this study with 10 master students in Denmark, but I got less creative data landscapes. They were aware of the real consumption values and understood the Ingoldian Lines concept, but they did not go beyond the guidelines and created similar groups. Also, according to Palm and Ambrose (2023), many people experience a psychological and social detachment from energy, which might leave them without the understanding needed to recognize ways they could get involved or the reasons for engaging with energy-related issues.
Another limitation could be the need for more facilitators relative to the number of participants. Although the teachers had a background in art, their unfamiliarity with Ingold’s concepts and data physicalization methods made it challenging to work individually with each participant within the defined time and collaborate with participants. Additionally, in one session, the classroom seating arrangement created difficulties for participants in establishing communication.
All participants engage immediately with the materials of the Tangible Consumption Data Landscape set. The materials are simple and easily accessible, producible, and applicable for a chance to re-make in the future. They make the most of the differences in color, thickness, and length and weave, knot, or knit onto the checkered cardboard base.
Participant’s preparation process and the co-design workshop method, as the way I suggested above, and the 3 steps it includes: the Questionnaire, the Layout drawing, and the Data landscape, have a powerful influence on the teenagers to become aware of their own consumption habits and to express this as creatively as possible, thus enabling them to acquire more sustainable habits.
The Questionnaire helps them recognize what kind of products consume energy and allows us to deduce factual assumptions about the number of people, products, and rooms in a teenager’s home. Together, this step allows us to compare the predicted daily energy consumption per product in a teenager’s home with the daily energy consumption per product in a typical home.
The Layout Drawing shows which products and rooms are the most energy-intensive. It also provides more information about the rooms and the products, such as size, type, and family members.
The Data Landscape encourages teenagers to explore their perception of the environment, gain personal knowledge about certain energy-consuming habits, and identify methods for modifying those habit patterns. This step challenges them to express themselves with their own tangible data design.
Moving from the questionnaires to the layout drawings and the data landscapes corresponded with a movement from generalized thinking to concrete spaces and situations to emotional and connected reflection about energy consumption. As teenagers explore from the conceptual to the visual and eventually to the physical, their consumption stories become more detailed and contextualized. Furthermore, the tangible interaction with data landscapes facilitated thinking beyond descriptions to imaginings of changing habits. Their language changes from the passive imperative voice, “There are 6 lamps,” e.g., that indicates an estrangement from consumption habits to a more personal active voice, “We are watching TV here,” which indicates a more vivid awareness of habits and an embracement of their data. I suggest that creating data landscapes and attributing qualities to consumption data allows participants to move from respondents in data collection to a more active position in data creation.
As in Ingoldian imagination, Ambrose (2020) states that research methods that incorporate social learning, are contextually embedded, engage both body and mind and consider experiential contexts have the potential to go beyond mere data collection, fostering deeper emotional and cognitive engagement that could lead to lasting changes in habits. This study has implications for engaging teenagers in sustainability initiatives: By making data personal, tangible, arguable, and open for possibilities, the teenagers acquire more agency in the sensemaking and habit change processes. Boucher et al. (2018, 146) emphasize “a mutual promising: a putting together forward.” With this collaborative promise and holistic Ingoldian approach, while the facilitator creates a new data physicalization toolkit for workshops, teenagers play an active role by collecting and analyzing their consumption data with those unique and open-ended techniques, understanding energy, increasing awareness about their energy consumption, and sharing new ideas to change their habits.
While Ingold (2022, 97) asks, “From where, then, comes the light we see, that saturates our awareness?”, we can say the answer is in the togetherness of imagination and reality, which the Data Landscapes scaffold. The participants corresponded with the products, environments, and people by creating and paying attention to them in a flow.
The original contributions presented in the study are included in the article, further inquiries can be directed to the corresponding author/s.
The requirement of ethical approval was waived by two private school administrations under the Turkish Ministry of Education for the studies involving humans because As students of a private school, participants in the study had already obtained consent from their families for video and visual recordings through the school administration for activities conducted by the school. Nonetheless, for this study, families were re-informed and their consent was re-verified. Only students who read the study information form and whose participation was approved were included in the study. The study does not disclose any participant’s name, family, age, ethnic background, or academic or social life information, nor does it share any photographs that could make them identifiable. The photographs in the study only show their hands or specific parts of their bodies. The studies were conducted in accordance with the local legislation and institutional requirements. Written informed consent for participation in this study was provided by the participants’ legal guardians/next of kin.
AA: Conceptualization, Data curation, Formal analysis, Investigation, Methodology, Visualization, Writing – original draft, Writing – review & editing.
The author(s) declare that no financial support was received for the research, authorship, and/or publication of this article.
I would like to thank students and teachers for participating in sessions at both schools and for letting us record their performances during the workshops. I acknowledge the use of Grammarly (https://app.grammarly.com/) in helping me to review my writing at the final stage of preparing my assessment. I used the Domain features as Academic. I reviewed the feedback generated by Grammarly critically and, based on this, revised the writing using my own words and expressions. I would like to acknowledge the use of ChatGPT (https://chat.openai.com/) to paraphrase some of my own sentences and paragraphs.
The author declares that the research was conducted in the absence of any commercial or financial relationships that could be construed as a potential conflict of interest.
All claims expressed in this article are solely those of the authors and do not necessarily represent those of their affiliated organizations, or those of the publisher, the editors and the reviewers. Any product that may be evaluated in this article, or claim that may be made by its manufacturer, is not guaranteed or endorsed by the publisher.
Akama, Yoko, and Ivanka, Tania. (2010). “What community? Facilitating awareness of 'community' through playful triggers”. In Proceedings of the 11th Biennial Participatory Design Conference (PDC '10). Association for Computing Machinery, New York, NY, USA, 11–20.
Akimenko, D., and Kuure, E. (2017). ““Narrative identities in participatory art and design cases”” in Nordes 2017: Design + Power. eds. D. Stuedahl and A. Morrison (Norway: Oslo School of Architecture and Design), 1–9.
Ambrose, A. (2020). Walking with energy: challenging energy invisibility and connecting citizens with energy futures through participatory research. Futures 117:102528. doi: 10.1016/j.futures.2020.102528
Bennett, J. (2010). Vibrant matter: A political ecology of things. Durham: Duke University Press, 50–65.
Boucher, A., Gaver, B., Kerridge, T., Michael, M., Ovalle, L., and Plummer-Fernnandez, M. (2018). Energy Babble. Mattering Press. 26–39. doi: 10.28938/9780995527720
Brandt, E., Binder, T., and Sanders, E. B.-N. (2012). “Tools and techniques: ways to engage telling, making and enacting” in Routledge international handbook of participatory design (New York: Routledge), 145–181.
Buur, J., Sorenson, J., and Cooper, C. M. (2021). Big data and small beginnings – how people engage with data physicalizations, in Brandt, E., Markussen, T., Berglund, E., Julier, G., Linde, P. (eds.), Nordes 2021: Matters of Scale, 15–18 August, Kolding, Denmark.
Chen, R. F., Eisenkraft, A., Fortus, D., Krajcik, J. S., Neumann, K., Nordine, J. C., et al. (2014). Teaching and learning of energy in K-12 education. Sci. Educ. 25, 235–239. doi: 10.1007/978-3-319-05017-1
Detken, F. (2023). Young Children’s ideas of energy compared with the scientific energy concept: results of a video study with interviews about Children’s own drawings. Front. Educ. 8, 1–17. doi: 10.3389/feduc.2023.1035066
Detken, F., and Brückmann, M. (2021). Accessing young Children’s ideas about energy. Educ. Sci. 11:39. doi: 10.3390/educsci11020039
Earle, Carolina R., and Faul, Moira V. (2024). “Meaningful youth engagement: time to deliver”. Policy insights #05. Norrag. Available at: https://resources.norrag.org/resource/view/895/475 (Accessed November 6, 2024).
Emunah, R. (2020). Acting for real: Drama therapy process, technique, and performance. 2nd Edn. Geneva, Switzerland: Routledge: Taylor and Francis Group.
Energy Usage Calculator. (n.d.). “Calculate electricity usage - Electrical Usage Calculator.” Available at: https://energyusecalculator.com/calculate_electrical_usage.htm (Accessed January 9, 2025).
Evergreen, S., and Metzner, C. (2013). Design principles for data visualization in evaluation. N. Dir. Eval. 2013, 5–20. doi: 10.1002/ev.20071
Fridays for Future. (2023). “Fridays For Future Is an International Climate Movement Active in Most Countries and Our Website Offers Information on Who We Are and What You Can Do.”Available at: (Accessed March 3, 2024 https://fridaysforfuture.org/).
Galende-Sánchez, E., and Sorman, A. H. (2021). From consultation toward co-production in science and policy: a critical systematic review of participatory climate and energy initiatives. Energy Res. Soc. Sci. 73:101907. doi: 10.1016/j.erss.2020.101907
Gaver, W., Boucher, A., Pennington, S., and Walker, B. (2004). Cultural probes and the value of uncertainty. Interact. Funol. 11, 53–56. doi: 10.1145/1015530.1015555
Gaver, W., Dunne, T., and Pacenti, E. (1999). Design: Cultural probes. Interactions 6, 21–29. doi: 10.1145/291224.291235.
IEA. (2020a). “Energy end-use data collection methodologies and the emerging role of digital technologies – Analysis - IEA.” Available at: https://www.iea.org/reports/energy-end-use-data-collection-methodologies-and-the-emerging-role-of-digital-technologies (Accessed November 6, 2024).
IEA (2020b). Energy end-use data collection methodologies and the emerging role of digital technologies: Statistics report. Paris: OECD Publishing.
Ingold, T. (2000). “Dwelling” in the perception of the environment: Essays on livelihood, dwelling and skill. London: Routledge, 153–175.
Ingold, T. (2011). Being alive: Essays on movement, knowledge and description. 1st Edn. London: Routledge.
IRENA. “Global Youth Call for a Just Energy Transition at IRENA Eleventh Assembly.” (2021). Available at: https://www.irena.org/news/articles/2021/Jan/Global-Youth-Call-for-a-Just-Energy-Transition-at-IRENA-Eleventh-Assembly (Accessed January 28, 2021).
Issi, F., and Kaplan, O. (2018). The determination of load profiles and power consumptions of home appliances. Energies 11:607. doi: 10.3390/en11030607
Jansen, Y., Dragicevic, P., Isenberg, P., Alexander, J., Karnik, A., Kildal, J., et al. (2015). “Opportunities and challenges for data Physicalization” in Proceedings of the 33rd annual ACM conference on human factors in computing systems (CHI '15) (New York, NY, USA: Association for Computing Machinery), 3227–3236.
Jensen, M. V. (2007). Tangible interaction in industrial plants.” PhD Dissertation. The Mads Clausen Institute, Sønderborg, Denmark University of Southern Denmark.
Jensen, V. V., Christensen, E., Hansen, N. B., and Jensen, R. H. (2024). A year in energy: imagining energy community participation with a collaborative design fiction. Nordic Conf. Human-Comp. Interact. 14, 1–15. doi: 10.1145/3679318.3685355
Karyda, M., Wilde, D., and Kjarsgaard, M. G. (2021). Narrative Physicalization: supporting interactive engagement with personal data. IEEE Comput. Graph. Appl. 41, 74–86. doi: 10.1109/mcg.2020.3025078
Kjærsgaard, M. G., and Larsen, H. (2020). “Time and the writing of personal narratives in organizational ethnography” in The Routledge international handbook of organizational autoethnography. ed. A. F. Herrmann (London: Routledge), 457–469.
Maria, K., Ryöppy, M., Buur, J., and Lucero, A. (2020). “Imagining data-objects for reflective self-tracking.”In Proceedings of the 2020 CHI Conference on Human Factors in Computing Systems (CHI ‘20) New York, NY, USA: Association for Computing Machinery, 1–12.
Marsh, J. (2023). “How Many Watts Does It Take to Run a House?” EnergySage. Available at: (Accessed March 3, 2024 https://www.energysage.com/electricity/house-watts/).
McCosker, Anthony, and Wilken, Rowan. (2014). “Rethinking “big data” as visual knowledge: the sublime and the diagrammatic in data visualisation”. Visual Studies 29. Taylor & Francis: 155–164.
Mebane, M. E., Benedetti, M., Barni, D., and Francescato, D. (2023). Promoting climate change awareness with high school students for a sustainable community. Sustain. For. 15:11260. doi: 10.3390/su151411260
Michael, M., and Gaver, W. (2009). Home Beyond Home: Dwelling With Threshold Devices. Space and Culture, 12, 359–370. doi: 10.1177/1206331209337076
Michael, M. (2018). ‘The stuff of method: Open things and closed objects’, in Energy Babble. Manchester: Mattering Press, pp. 141–148.
Miller, R. (2018). Transforming the future: Anticipation in the 21st century. 1st Edn. London: Routledge.
Palm, J., and Ambrose, A. (2023). Exploring energy citizenship in the urban heating system with the ‘walking with energy’ methodology. Energ. Sustain. Soc. 13:11. doi: 10.1186/s13705-023-00393-5
Papadouris, N., and Constantinou, C. (2011). A Philosophically Informed Teaching Proposal on the Topic of Energy for Students Aged 11–14. Science & Education. 20, 961–979. doi: 10.1007/s11191-010-9305-4
Pendzik, S., Emunah, R., and Johnson, D. R. (2017). The self in performance: autobiographical, self-revelatory, and autoethnographic forms of therapeutic theatre (1st edn.). London: Palgrave Macmillan.
Pinto, R. M. (2022). “Autoethnographic playwriting and performance for self-healing and advocacy” in Social work research using arts-based methods. eds. E. Huss and E. Bos (Bristol: Bristol University Press), 45–54.
Quintal, F., Jorge, C., Nisi, V., and Nunes, N. (2016). "Watt-i-see: a tangible visualization of energy." In Proceedings of the International Working Conference on Advanced Visual Interfaces (AVI ‘16). New York, NY, USA: Association for Computing Machinery, 120–127.
Ratriyana, I. N., Setiawan, L. D., and Yudarwati, G. A. (2021). Development communication for youth empowerment in Indonesia’s renewable energy projects. Asian J. Commun. 32, 290–308. doi: 10.1080/01292986.2021.2007273
Rosin, A., Auväärt, A., and Lebedev, D. (2012). Analysis of operation times and electrical storage dimensioning for energy consumption shifting and balancing in residential areas. Elektronika Ir Elektrotechnika 120, 15–20. doi: 10.5755/j01.eee.120.4.1444
Şahin, M. Ç., and Köksal, M. A. (2014). Standby electricity consumption and saving potentials of Turkish households. Appl. Energy 114, 531–538. doi: 10.1016/j.apenergy.2013.10.021
Sanson, A., and Bellemo, M. (2021). Children and youth in the climate crisis. BJP Sych. Bulletin 45, 205–209. doi: 10.1192/bjb.2021.16
Sanson, A. V., Wachs, T. D., Koller, S. H., and Salmela-Aro, K. (2018). “Young People and Climate Change: The Role of Developmental Science,” in Developmental Science and Sustainable Development Goals for Children and Youth. Social Indicators Research Series. eds. Verma, S., Petersen, A. (Cham: Springer), 115–137.
Schulte, B. F., Marshall, P., and Cox, A. L. (2016). “Homes for life: a design fiction probe” in NordiCHI 2016: Proceedings of the 9th Nordic conference on human-computer interaction: Game-changing design, Vol. 80 (New York, NY, USA: Association for Computing Machinery), 1–10.
Si, H., Ze, Y., Qi, J., Yimeng, S., Wenwen, H. W., and Xiaoyan, Lv. W. (2022). Better future with better us: Exploring young people’s energy-saving behavior based on norm activation theory. Frontiers in Public Health, 10:1042325. doi: 10.3389/fpubh.2022.1042325
Strzelecki, B. (2022). Youth engagement in the multilateral energy space in 2019–2021. Development 65, 48–53. doi: 10.1057/s41301-022-00328-1
The NEED Project. (2019). “Energy games and icebreakers.” Energy Games and Icebreakers. Available at: (Accessed November 6, 2024https://www.need.org/wp-content/uploads/2020/03/Energy-Games-And-Icebreakers.pdf).
Thomaes, S., Grapsas, S., van de Wetering, J., Spitzer, J., and Poorthuis, A. (2023). Green teens: understanding and promoting adolescents’ sustainable engagement. One Earth 6, 352–361. doi: 10.1016/j.oneear.2023.02.006
UNESCO. “Education, international commission on the futures of. Reimagining our futures together.” Unesco Publishing, (2021). (Accessed March 3, 2024https://unesdoc.unesco.org/ark:/48223/pf0000379707.locale=en).
UNICEF. “Adolescents statistics - UNICEF Data,” (2024). Available at: https://data.unicef.org/topic/adolescents/overview/ (Accessed March 3, 2024).
Keywords: personal data, participatory design, tangible interaction, data-mapping, energy consumption
Citation: Ağça AÖ (2025) Tangible consumption data landscapes of teenagers. Front. Hum. Dyn. 6:1406364. doi: 10.3389/fhumd.2024.1406364
Edited by:
Mathias Funk, Eindhoven University of Technology, NetherlandsReviewed by:
Fiona Shirani, Cardiff University, United KingdomCopyright © 2025 Ağça. This is an open-access article distributed under the terms of the Creative Commons Attribution License (CC BY). The use, distribution or reproduction in other forums is permitted, provided the original author(s) and the copyright owner(s) are credited and that the original publication in this journal is cited, in accordance with accepted academic practice. No use, distribution or reproduction is permitted which does not comply with these terms.
*Correspondence: Ayşe Özge Ağça, YXlvekBzZHUuZGs=
Disclaimer: All claims expressed in this article are solely those of the authors and do not necessarily represent those of their affiliated organizations, or those of the publisher, the editors and the reviewers. Any product that may be evaluated in this article or claim that may be made by its manufacturer is not guaranteed or endorsed by the publisher.
Research integrity at Frontiers
Learn more about the work of our research integrity team to safeguard the quality of each article we publish.