 Allison P. Plaxco1
 Jane S. Hankins2,3
 Robert Davis4Judy Dudley5
 Amanda J. Young6Ayesha Mukhopadyay1Yvonne Carroll3
 Maria del Pilar Aguinaga7Clifford M. Takemoto3Vikki G. Nolan8Meredith A. Ray1Andrew Wiese5Tobi Amosun9William O. Cooper5
 Matthew P. Smeltzer1*
- 1Division of Epidemiology, Biostatistics, and Environmental Health School of Public Health, University of Memphis, Memphis, TN, United States
- 2Department of Global Pediatric Medicine, St. Jude Children’s Research Hospital, Memphis, TN, United States
- 3Department of Hematology, St. Jude Children’s Research Hospital, Memphis, TN, United States
- 4Center for Biomedical Informatics, The University of Tennessee Health Science Center, Memphis, TN, United States
- 5Department of Health Policy, Vanderbilt University Medical Center, Nashville, TN, United States
- 6Department of Communication and Film, University of Memphis, Memphis, TN, United States
- 7Department of Internal Medicine, Meharry Sickle Cell Center, Meharry Medical College, Nashville, TN, United States
- 8Department of Epidemiology and Cancer Control, St. Jude Children’s Research Hospital, Memphis, TN, United States
- 9Division of Population Health, Tennessee Department of Health, Nashville, TN, United States
Introduction: The Sickle Cell Data Collection Program (SCDC) is a multi-state initiative utilizing multiple data sources to estimate population prevalence of Sickle Cell Disease (SCD) with the goal of improving quality of life and health outcomes among those affected. SCDC in Tennessee operates as a multi-site, interdisciplinary team using multiple sources of data to learn more about SCD in Tennessee.
Methods: This analysis characterizes the number, demographics, and proximity to specialty care of individuals living with SCD in Tennessee who have been covered by Medicaid or identified by newborn screening. We compared demographic patterns of individuals with SCD living in rural areas with those living in urban areas, as well as those living in counties contributing more than 50 individuals to the cohort, respectively, to demographic patterns of individuals with SCD in the rest of the state, using Chi-Square or Fisher’s exact tests.
Results: Findings show that overall, 66.1% of all SCD patients identified through newborn screening were residents of Davidson and Shelby counties at the time of birth, and 81.8% of those identified through Medicaid claims lived in Davidson, Hamilton, Knox, Madison, Montgomery, Rutherford, or Shelby County. In total, 8.6% of the cohort lived in rural settings and 91.4% in urban settings. Of the 95 counties in Tennessee, 75 (78.9%) had at least 1 to 40 residents with SCD, yet of these 75 counties, less than half had a hematology/oncology trained provider practicing within them.
Discussion: This analysis brings us closer to understanding how many people with SCD live in rural areas of Tennessee and the challenges they face in seeking the care needed to adequately manage their disease. Acute healthcare utilization remains highest in the young adulthood years. This analysis provides insight into how healthcare utilization patterns among individuals with SCD vary by age group and over time.
Introduction
Sickle cell disease (SCD) is a hereditary condition affecting the shape and structure of the red blood cells causing anemia and risk for pain, infection, and organ disfunction and leading to pain, serious health problems (1), shortened life expectancy (2), and vast increases in the need for acute healthcare relative to those without SCD (3). Although SCD is most common among people whose ancestry is from regions where malaria is or has been common (4), sickle cell trait affects people from many racial and ethnic backgrounds, and it is most common among people of African, Hispanic, South Asian, white from southern Europe, and Middle Eastern descent (5). In the US, the Centers for Disease Control and Prevention (CDC) estimate that roughly 100,000 persons live with SCD (4). Nationally, birth prevalence for SCD is estimated to be about 1 in 365 live births among individuals who are Black (4). In Shelby County, the most populous county in Tennessee, however, the estimates from 2002-2012 data are approximately 1 in 287 live births among individuals who are Black (6). While regional SCD prevalence data may be available for some areas in the US, current national prevalence estimates are subject to several limitations, including lack of nationally representative data and use of surveillance definitions that have not been fully validated and may vary by region.
The lack of complete understanding of the burden of SCD in the US contributes to ongoing gaps in care and disparities in care access and delivery for individuals with SCD, especially as persons with SCD need specialized care by experts for optimal outcomes. In addition, notable disparities exist with respect to SCD, which is significantly more prevalent in individuals who are Black compared to other racial groups in the US (7, 8). The CDC Sickle Cell Data Collection (SCDC) program is a multistate initiative that collects data from multiple sources to characterize how many people live with SCD in the United States and to understand better their health outcomes and their healthcare utilization patterns to improve health, quality of life, and life expectancy of those who are living with SCD (9). Using the SCDC data infrastructure in Tennessee (TN), we evaluated the numbers of individuals born or living with SCD in TN between 2008 and 2019 and describe their characteristics and proximity to specialty care. We assess county-wise differences between areas with high SCD prevalence with respect to demographics and access to care. We also report demographic and care access differences between rural and urban settings in TN.
Methods
The SCDC team in Tennessee (SCDC-TN) operates as an interdisciplinary collaboration with the Tennessee Department of Health (TDH), Vanderbilt University, University of Tennessee Health Science Center, University of Memphis School of Public Health, Meharry Medical College, The Sickle Cell Foundation of TN, and St. Jude Children’s Research Hospital (SJCRH) (10). To construct the SCDC-TN, we have merged Tennessee Medicaid claims with newborn screening (NBS) records, birth records, and mortality data of individuals affected by SCD in Tennessee to assemble the surveillance observational cohort. SCDC-TN is a population-based retrospective observational cohort study updated annually. Our approach uses data from multiple sources, including state NBS records, NBS laboratory confirmation data, all-payer claims data, and state mortality data. Medicaid data sources include enrollment, pharmacy, inpatient, and outpatient records. The following data sources comprise the SCDC-TN cohort:
● NBS and Confirmatory Data: For children born in Tennessee, the first screening for SCD is done at birth and analyzed at the Public Health Laboratories by the State’s NBS program utilizing high-performance liquid chromatography of dried NBS blood samples. If dried blood specimens are positive for hemoglobinopathies, including SCD or trait, notification for confirmatory testing is sent to the parents, the child’s primary care provider, and the State designated sickle cell center for the region. Fresh blood samples are collected for confirmatory testing, and once confirmed, these data are deposited into a database housed by the NBS Follow-Up and Childhood Lead Poisoning Prevention Program within the TDH. Meharry Sickle Cell Center in Nashville, TN is the confirmatory and reference laboratory for hemoglobinopathies for the TDH’s Newborn Screening Program.
● State Vital Statistics: All information related to births and deaths in TN, i.e., dates, demographics, and cause of death are collected by the TN vital statistics program under the TDH and linked to cases in the cohort.
● Medicaid enrollment records: The Medicaid enrollment file, a central registry of all enrollees, includes identifiers (Medicaid ID, social security number, name, address), date of birth, sex, race, county of residence, beginning and ending dates of each enrollment period, and the Medicaid managed care organization.
● Medicaid outpatient file: The outpatient file consists of records for emergency department visits, hospital outpatient departments, and outpatient surgical facilities. Each record includes recipient ID, facility ID, date of visit, primary and secondary diagnoses (ICD-9- or ICD-10-CM), and procedure codes (CPT codes).
● Medicaid inpatient file: The inpatient file contains records of hospitalizations. This record includes recipient ID, hospital ID, admission and discharge dates, primary and secondary diagnoses (ICD-9-CM or ICD-10-CM), and up to six surgical procedures (ICD-9-CM or ICD-10-CM).
● Medicaid physician file: The physician file consists of records for physician encounters in all settings. Each record includes recipient ID, physician ID, date of visit, primary and secondary diagnoses (ICD-9- or ICD-10-CM), and procedure codes (CPT codes).
Data linkage and de-duplication
Claims data from the files mentioned above are combined into healthcare “encounters”, using the from and through dates on the claims. For example, all facility and professional claims occurring within a certain time period are combined to create a single hospitalization encounter. For each study year, a flag is set if there are healthcare encounters that align with the SCDC probable case definition. A flag is also set indicating if there were any encounters (SCD or non-SCD) in the previous year, the year itself, and/or the following year.
TennCare enrollment records are then obtained for each potential cohort member and an enrollment flag is set for each study year indicating enrollment in the previous year, the year itself, and/or the following year. Finally, a recipient is included in the cohort for a given study year if the SCD flag is set and there were any encounters (including non-SCD encounters) and/or enrollment in that year or both the previous and following years. Non-SCD encounters are included as a means to provide confirmation that the individual still resides in Tennessee, even if they do not have a SCD-specific encounter in that timeframe. These data sources have been used extensively by members of our team in other work, including SCD-related studies (11–15).
Confirmed and probable case definition
We identify individuals with confirmed and probable SCD for each year of data covered by SCDC based on NBS results and Medicaid claims data. SCDC-TN currently identifies confirmed cases of SCD as those who have Clinical Laboratory Improvement Amendments (CLIA)-certified laboratory result of SCD reported by a state newborn screening program with confirmatory testing. The SCDC confirmed case definition also includes those who have a clinical diagnosis by a physician with documented confirmatory CLIA-certified laboratory testing after the newborn period. These data will be added to the SCDC-TN database in the future but are not currently available, so individuals who meet this criteria for a confirmed case are assessed and included in the cohort based on their alignment with the probable case definition. Probable cases are defined as those who do not have a laboratory-confirmed diagnosis available in the dataset but have three or more inpatient, emergency department (ED), or outpatient healthcare encounters including ICD-9 or ICD-10 diagnosis codes indicating SCD within a 5-year period of each applicable report year (16). (Specialty care providers were identified through the National Provider Identifier (NPI) Registry as hematology-oncology trained providers listing a self-identified hematology-related taxonomy code (207RH0000X, 207RH0003X, or 2080P0207X) and a business practice location in Tennessee).
Statistical analysis
Using analytical datasets containing data through 2019 created through the process described above, we included in the 12-year analysis all individuals identified by NBS or covered by Medicaid and meeting the probable or confirmed case definition between 2008 and 2019. We report demographic characteristics of the cohort, including sex, race, ethnicity, age, location (rural/urban defined using county Rural-Urban Continuum Codes (RUCC) (17); urban counties defined by RUCC = 1-3, and rural counties defined by RUCC > 3), and proximity to specialty care. Results are reported for the entire cohort and separately for the cohort identified through NBS and the cohort identified through Medicaid records. For the Medicaid cohort, we report demographic variables for the entire cohort stratified by age group and reported for the adult Medicaid cohort (age 18 +) and the pediatric cohort. For both the NBS cohort and the Medicaid cohort, the counties contributing more than 50 individuals to each cohort were analyzed separately and demographic patterns are compared statistically to the rest of the state. We compared demographic patterns of individuals with SCD in the respective county to demographic patterns of individuals with SCD in the rest of the state, excluding those in the respective county, using Chi-Square tests and Fisher’s exact tests, where necessitated by small cell sizes (18). Similar analyses compare demographic patterns of SCD patients living in rural areas with those living in urban areas. P-values are reported and evaluated using an alpha level of 0.05. All analyses were conducted in SAS Version 9.4 (Cary, NC). The SCDC-TN cohort is compiled, maintained, and analyzed with approval of the institutional review board of the Tennessee Department of Health and the Division of TennCare.
Results
From 2008 to 2019, the SCDC-TN cohort included 3,439 individuals with SCD in Tennessee. Of all cases identified through the most recent year they met the case definition for cohort inclusion, 33.8% (N = 1,164) were children under 18 (pediatric), and 66.2% (N = 2,275) were adults. Among pediatric cases, 50.3% were female, 92.4% were Black, and 98.1% were non-Hispanic or of unknown ethnicity, and among adults, 60.6% were female, 92.0% were Black, and 60.6% were non-Hispanic ethnicity.
From NBS, we identified 552 infants born with SCD in Tennessee from 2008 to 2019. Of these, 53.6% were female, over 95% were Black, and 92.9% were non-Hispanic (Table 1). In the same period, 3,334 confirmed and probable SCD cases were identified across all age groups via Medicaid claims data. Of these cases, 57.3% were female, 92.1% were Black, 80.9% were of unknown ethnicity. Of the 552 individuals diagnosed through NBS, 447 (81.0%) were also included in Medicaid over the timeframe assessed. Table 2 shows the number of infants with SCD identified through NBS in Tennessee annually from 2008 to 2019. Of 3,334 cohort members with medical claims records available from 2008 to 2019, 1,995 (59.8%) last met the case definition for cohort inclusion in 2019, 220 (6.6%) last met the case definition for cohort inclusion in 2018, and 78.2% last met the definition in 2015 or later, collectively. Supplementary Table 1 shows cohort members by most recent year of inclusion.
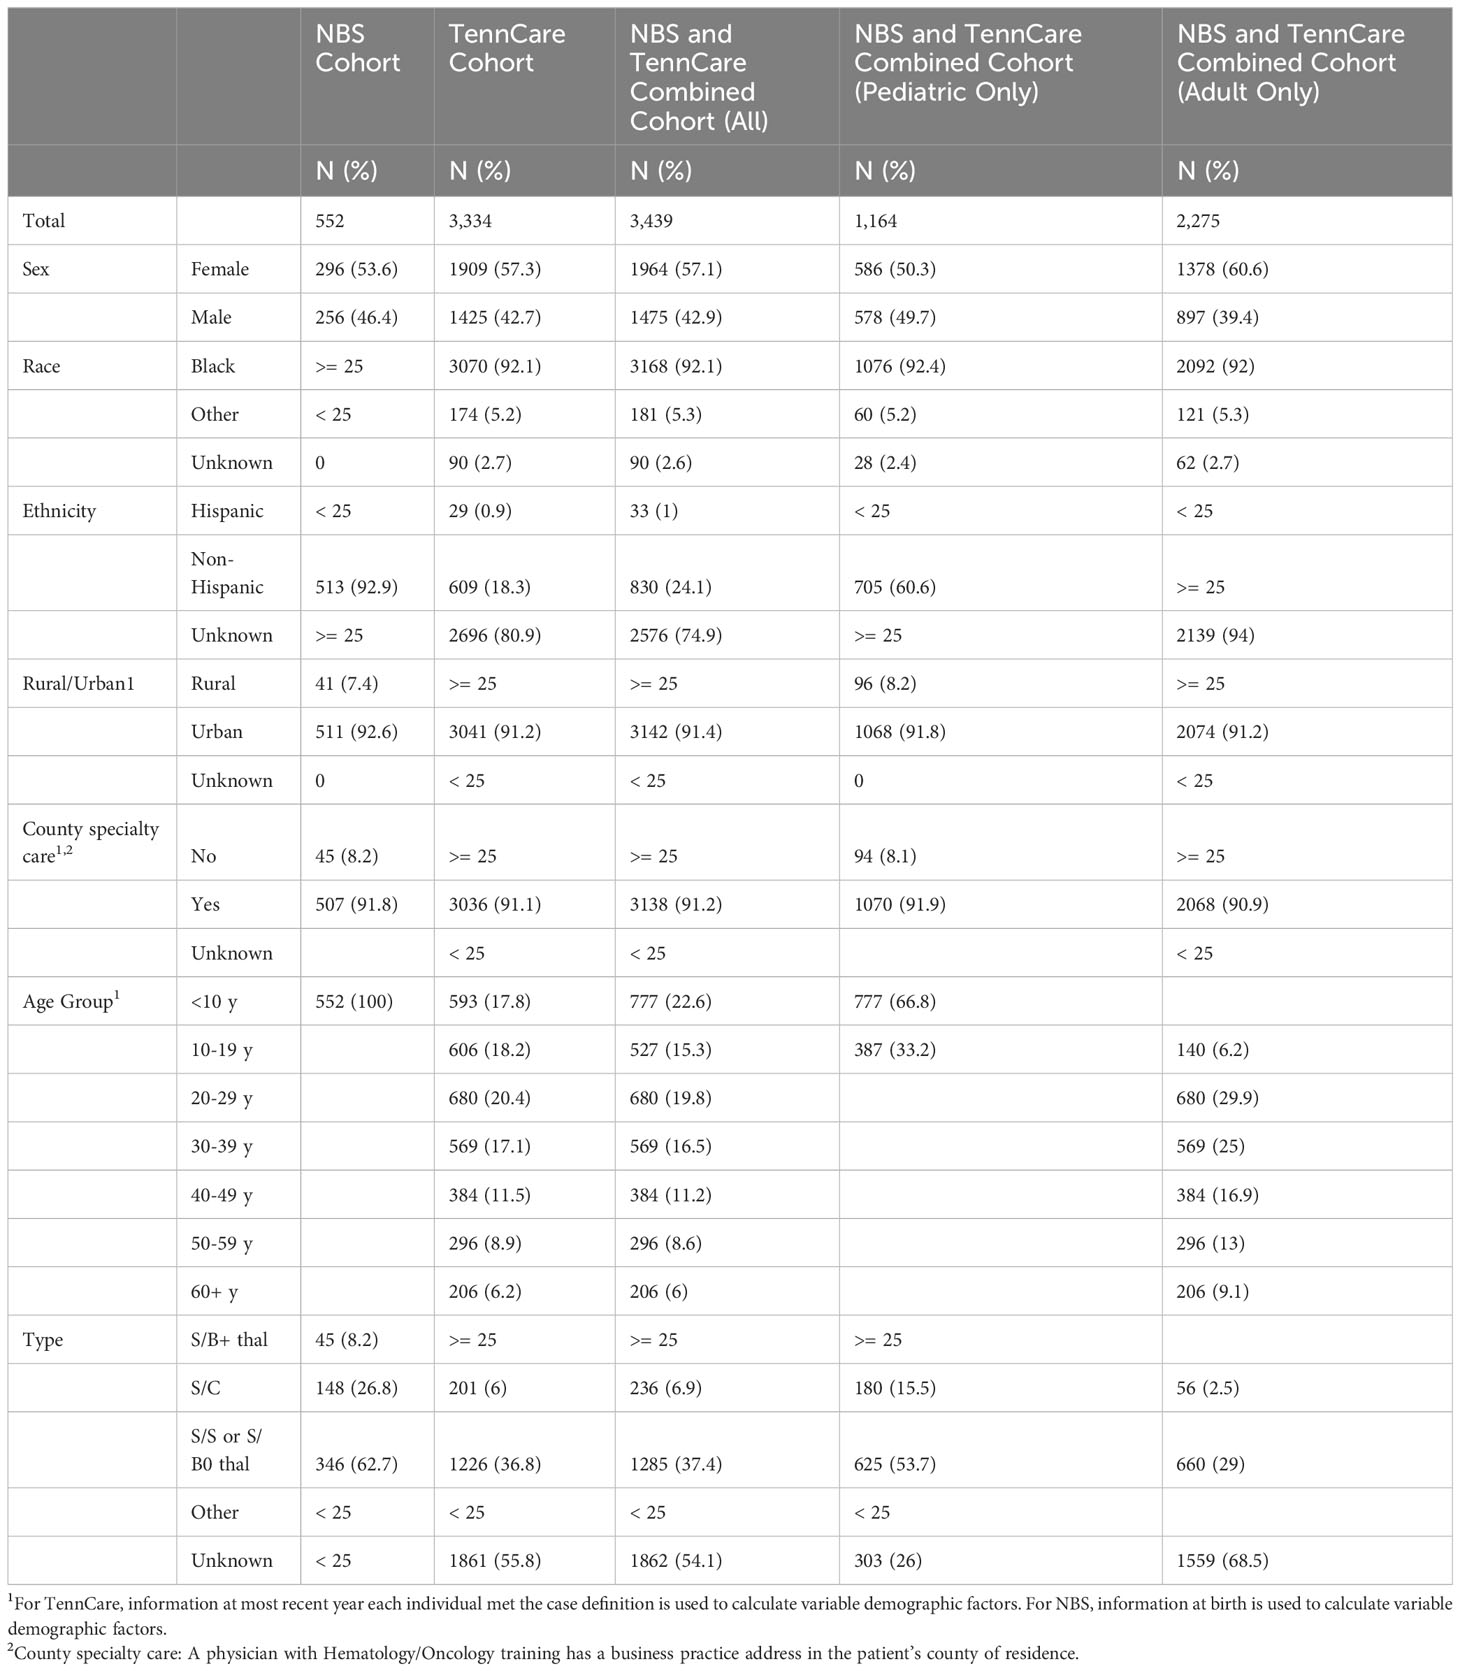
Table 1 Individuals with SCD identified via NBS and TennCare (2008 – 2019).
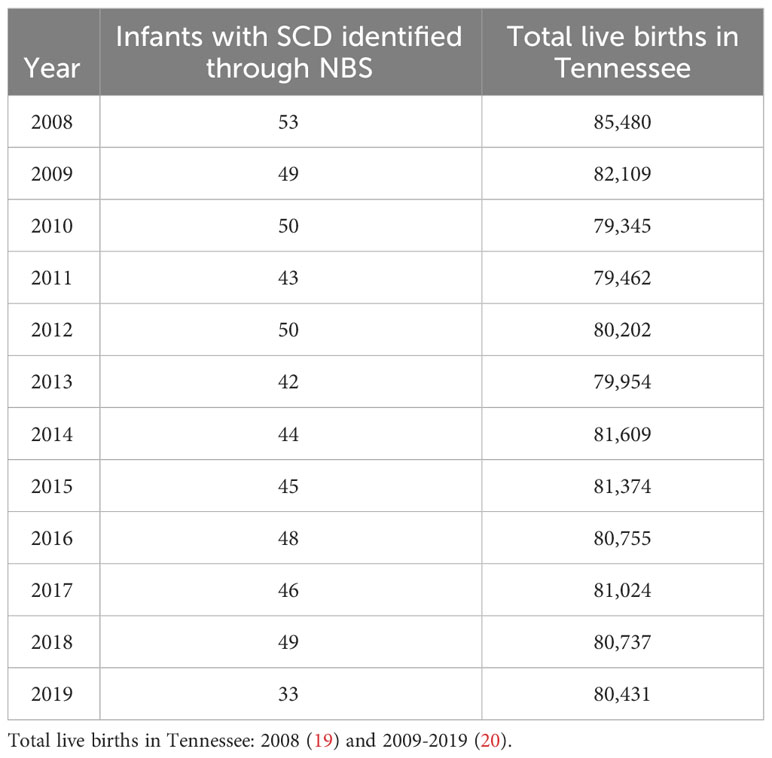
Table 2 Infants with SCD identified through NBS per year.
Cases by county
We identified and mapped the numbers of individuals by county in the full cohort and separately for NBS and Medicaid (Figure 1, Supplementary Figures 1, 2). Overall, 66.1% of all SCD patients identified through NBS from 2008 to 2019 were residents of Davidson and Shelby counties at the time of birth (Supplementary Table 2). The demographic makeup of individuals with SCD residing in Davidson and Shelby Counties identified through NBS was similar to that of the rest of the state, except for the distribution of the race of the cohort in Shelby County, the distribution of SCD type in Davidson County, and the distribution of rural versus urban location in both counties, as shown in Supplementary Table 3. In Shelby County, a higher proportion of the cohort was Black compared to the overall NBS cohort, though both were over 95% (p-value = 0.0091). In Davidson County, 50% of the cohort was SCD type HbS/S or HbS/B0-thalassemia, compared to 62.7% in the overall NBS cohort (p-value = 0.012), and in both Davidson and Shelby counties, 100% of the cohort lived in urban areas, compared to 92.6% in the overall NBS cohort (p-values = 0.0012 and <0.0001, respectively). Of all individuals identified through Medicaid claims from 2008 to 2019, 81.8% lived in the following seven counties at the time of their most recent cohort inclusion: Davidson, Hamilton, Knox, Madison, Montgomery, Rutherford, and Shelby (Supplementary Table 4). These counties contain the 6 most populous cities in Tennessee (21). The demographic makeup of SCD patients identified via Medicaid in these seven key counties is shown in Supplementary Table 5. Several demographic differences were seen in these key counties compared to the Medicaid cohort across the entire state. In the overall cohort, 5.2% of patients were of a race other than Black, whereas more than 10% of individuals were of races other than Black in Knox (p-value = 0.0282) and Montgomery (p-value = 0.0006) counties, and less than 2% (p-value < 0.0001) of patients were of races other than Black in Shelby County. Differences also exist with respect to age of the cohort at the last year of inclusion. In the overall cohort, 56.4% of patients were under the age of 30, compared to 67.0% (p-value = 0.0345) in Madison County. Further differences exist with respect to rurality, where in the overall Medicaid population, 91.51% lived in urban areas compared to 100% in each of the 7 key counties with p-values ranging from < 0.0001 to 0.002.
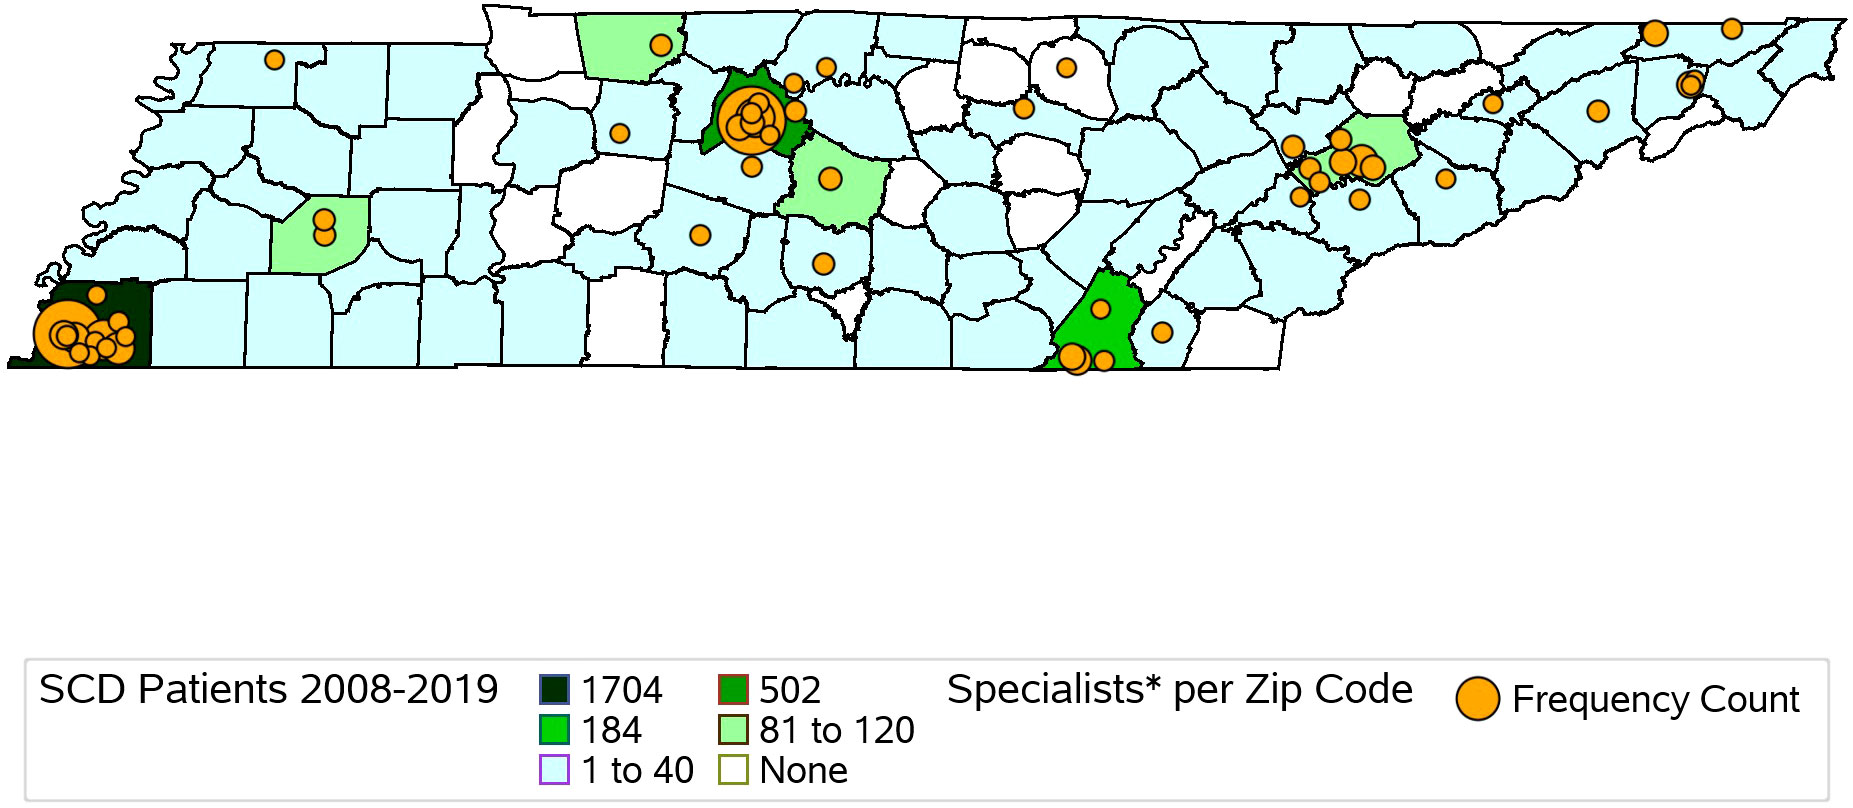
Figure 1 Map of Hematology/Oncology Trained Providers and SCD Patients Identified via TennCare Claims and Newborn Screening Records from 2008-2019 in Tennessee by County. Hematology/Oncology providers identified via NPI registry.
Rural vs. urban residence
In addition to differences in demographic patterns in key counties compared to the rest of the state, differences also exist in the cohort with respect to residential location, delineated as rural or urban. In total, 8.6% of the cohort lived in rural settings and 91.4% in urban settings. Among those identified through Medicaid claims, 91.2% lived in urban areas, and among those identified via NBS, 91.6% lived in urban areas.
Of cohort members identified through NBS and Medicaid claims records, 83.4% of patients in rural areas were Black, compared to 92.9% in urban areas (p-value < 0.0001), and 51.5% of the patients in rural areas were under the age of 30, compared to 58.3% in urban areas (p-value = 0.0242). Additionally, access to physicians with training in hematology-oncology differs substantially between urban and rural settings. In the rural setting, 69.2% lived in a county with no practice locations of physicians who are trained in hematology-oncology, compared to only 3.0% of those who lived in urban settings (p-value < 0.0001) (Table 3).
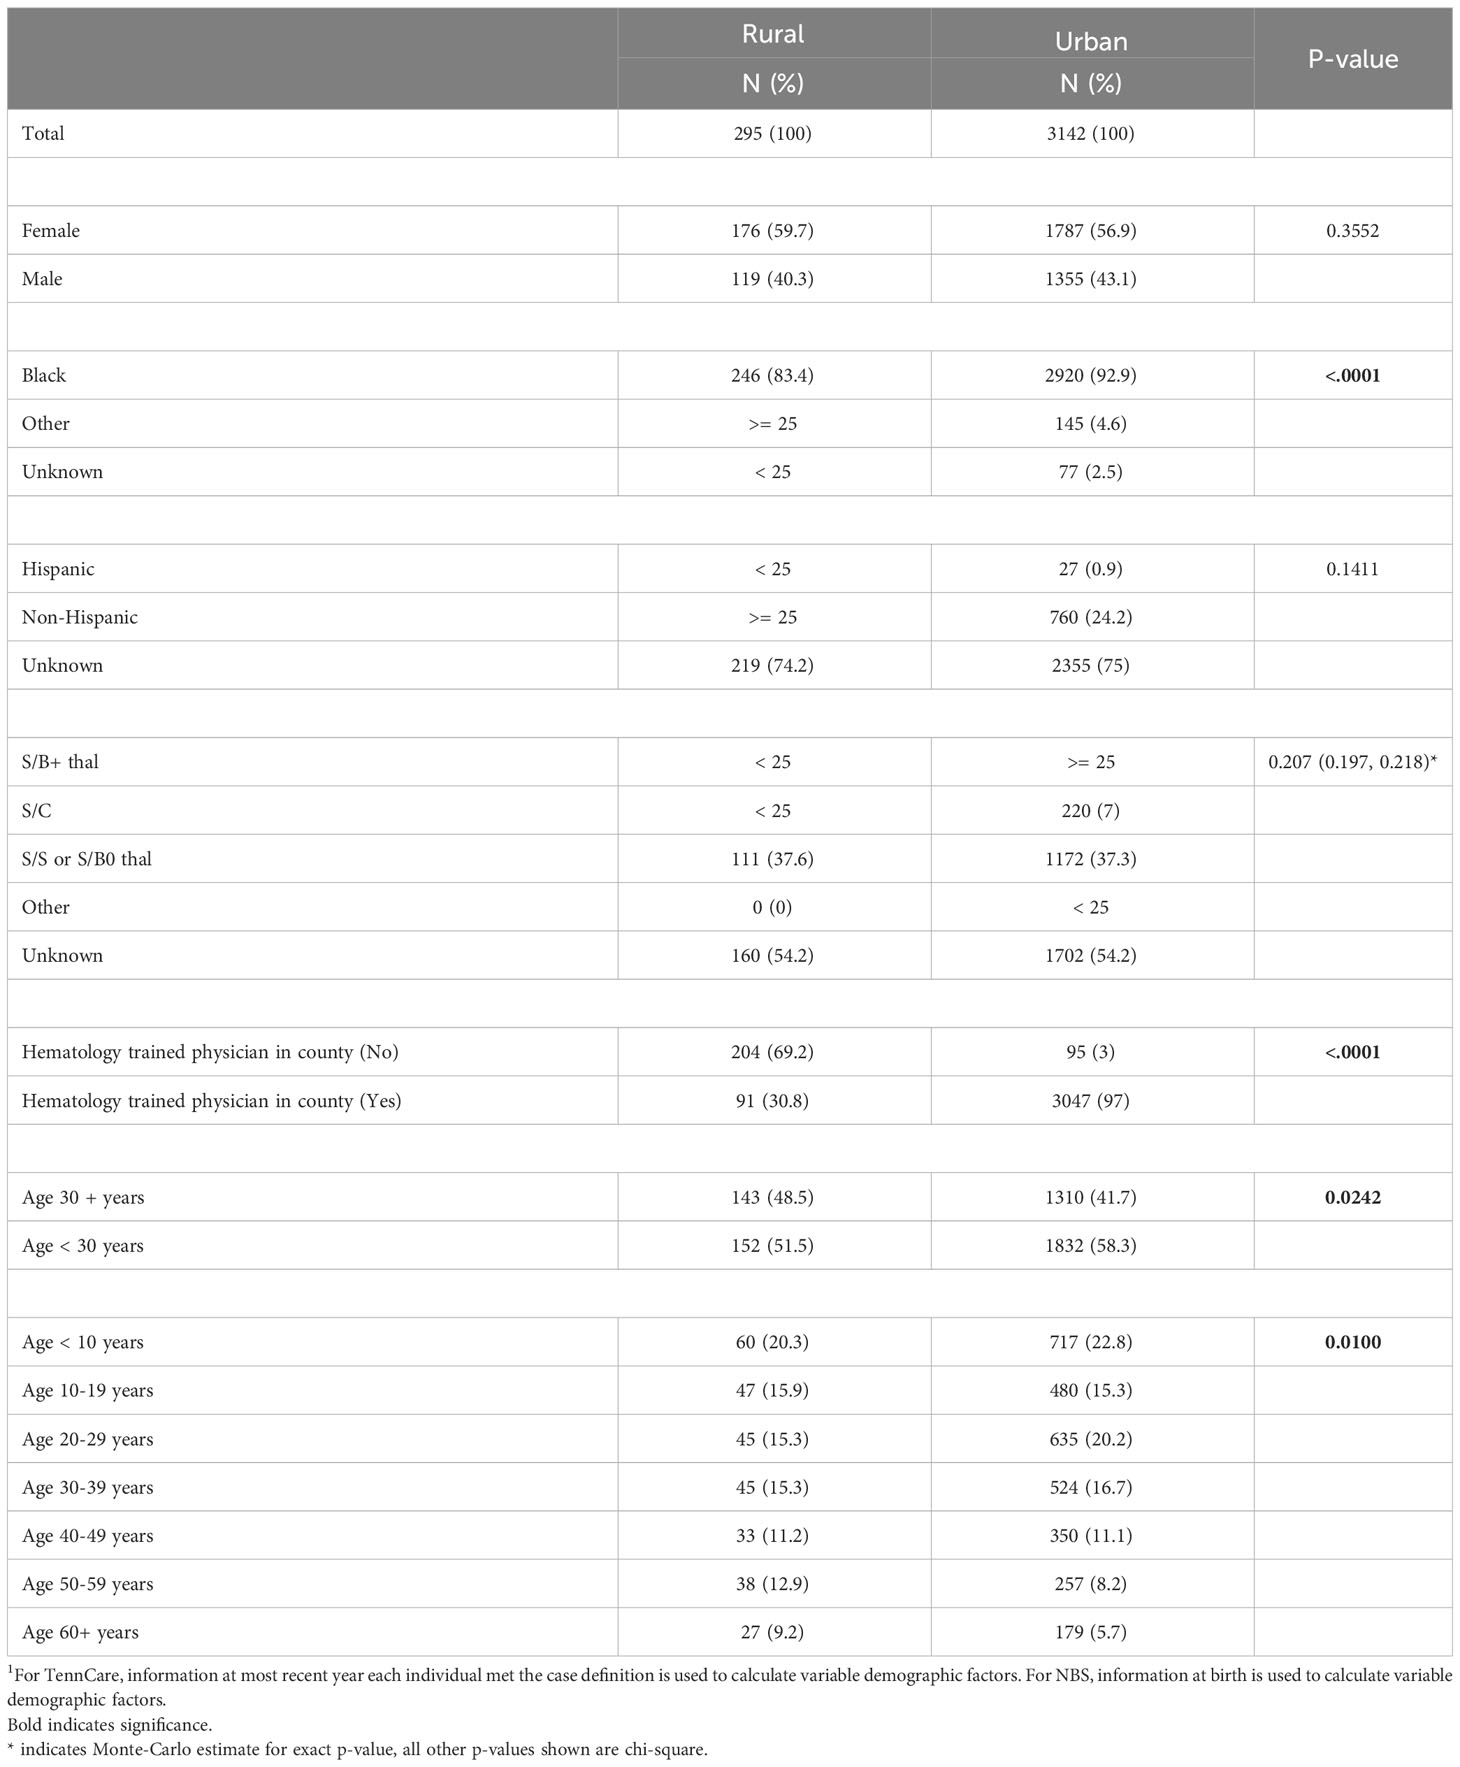
Table 3 Individuals with SCD identified via TennCare and newborn screening (2008 – 2019) by rurality1.
Specialty care providers
We identified 431 hematology/oncology specialty care providers, practicing in 34 counties in Tennessee. Providers practiced in urban counties (96.8%, N = 417) more frequently than rural counties (3.2%, N = 14). Specialty care provider locations by zip code center are descriptively compared with SCDC-TN cohort members’ county of residence in Figure 1, demonstrating that 75 of the 95 counties in Tennessee (78.9%) had at least 1 to 40 residents with SCD over the study period, yet of these 75 counties, less than half had a hematology/oncology trained provider practicing within them.
Emergency department and hospital utilization
These 3,334 individuals incurred 63,788 emergency department treat-and-discharge (EDTD) visits and 36,360 hospital admissions from 2008 to 2019. From 2008 - 2019, the cohort averaged between 2.54 and 3.21 EDTD visits and 1.41 and 1.73 hospital admissions per person per year (Table 4). Marked differences are seen by age group with respect to annual acute healthcare utilization. Both ED utilization and hospitalization were generally highest among cohort members in their 20s and 30s and acute healthcare utilization trends by age group were generally consistent across time (Figures 2, 3). Over the period from 2008 through 2019, the annual percentage of the Medicaid cohort that did not have any acute healthcare claims ranged from 20.2% in 2009 to 25.7% in 2018 (Table 4).
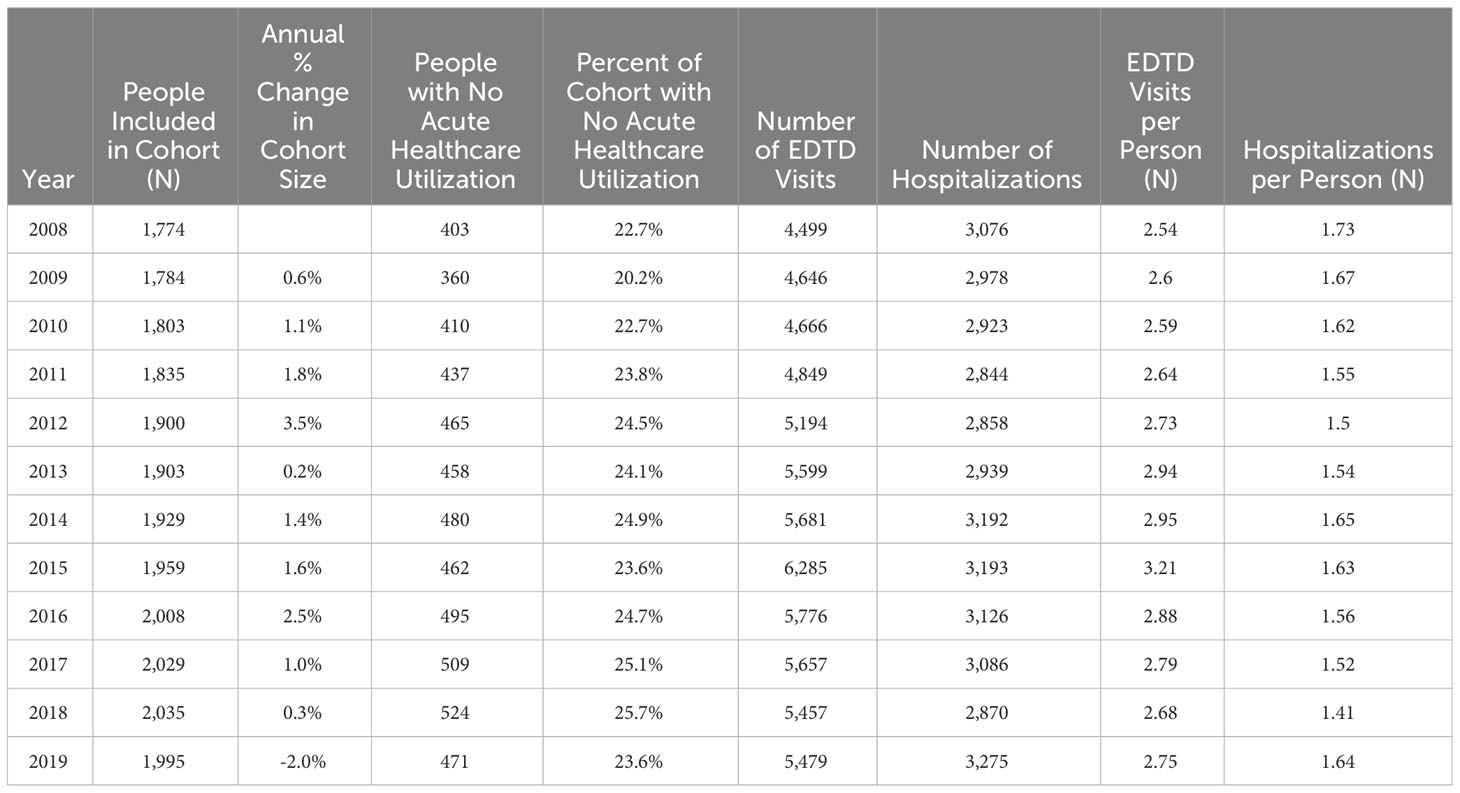
Table 4 Total people included in Medicaid cohort, Emergency Department Treat and Discharge (EDTD) visits, and hospital admissions per year.
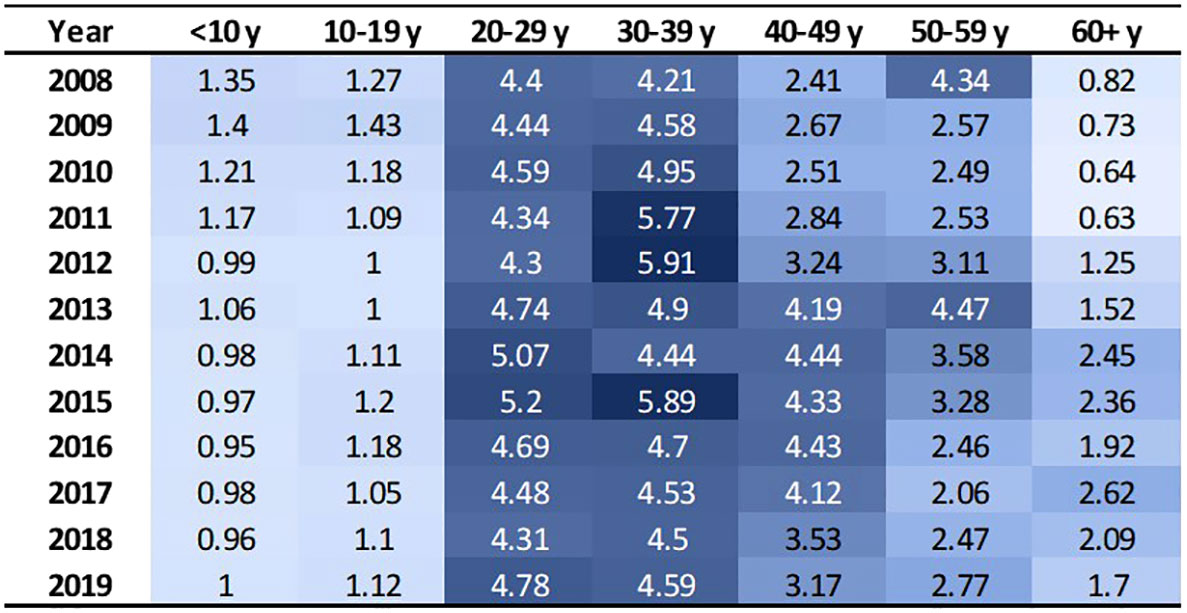
Figure 2 EDTD visits per person by age group and year. Cells are shaded based on value. Darker shade denotes higher value.
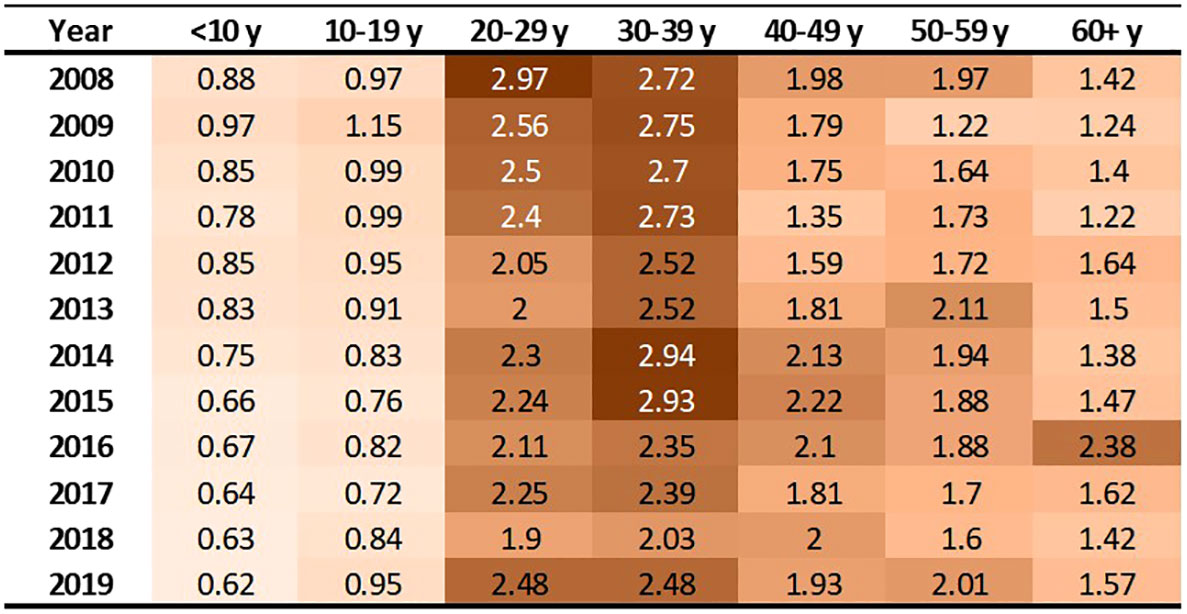
Figure 3 Hospitalizations per person by age group and year. Cells are shaded based on value. Darker shade denotes higher value.
Discussion
Using a validated algorithm and established data infrastructure, the SCDC-TN program identified 3,439 individuals living with SCD (2008 to 2019) and demonstrated important differences in access to specialty care and demographic make-up of the population living with SCD by county compared to the state overall. Differences in demographic characteristics and access to care also exist between the population living with SCD in rural and urban settings in Tennessee. Out of the 95 counties in Tennessee, 75 (78.9%) had at least 1 – 40 people with SCD living within them over the study period, yet the majority of counties with residents affected by SCD do not have hematology-oncology trained providers practicing within them. Our findings align with previously published estimates of prevalence of SCD in Tennessee (22). Of those identified as having SCD in Tennessee, more than 65% of rural SCD patients do not have hematology-oncology trained providers practicing in their home county. Improving access to appropriate specialty care for those with SCD across the state and especially in rural areas could improve health outcomes in this population.
Lack of access to healthcare providers in rural areas is not a problem that is unique to those living with SCD in Tennessee. More than 75% of America’s rural counties are considered health professional shortage areas (23), and Americans living in rural settings are more likely to be older, uninsured or underinsured, and living in poverty, compared to those who live in urban settings (23, 24). These factors, along with increased travel required to reach the nearest health facilities compared to their urban counterparts (23), contribute to poorer health outcomes among rural Americans (23, 25), including increased risk of death due to heart disease, cancer, unintentional injury, chronic lower respiratory disease, and stroke (25). Increasing access to specialty care appropriate to SCD in rural areas could be an opportunity to improve SCD-related health outcomes in Tennessee.
Various strategies have been employed by state governments and universities (26) for incentivizing physicians to practice in rural settings, including loan repayment programs, J-1 visa waivers, and scholarships (27). However, these incentive programs tend to focus more on recruiting new physicians to underserved areas than on retaining existing physicians and are often not combinable; for example, a physician who is under obligation to practice in an underserved area in connection to a scholarship program is generally not eligible to receive loan repayment assistance through a state loan repayment program, or other available incentives, applicable to the area of practice at the same time (27). A recent systematic review of factors associated with physicians practicing in physician shortage areas found positive associations with financial factors, including scholarships, loan repayment programs, and funding exposure from other streams (28). However, mixed associations were reported with respect to educational debt. Differences in income between urban and rural settings may drive this mixed result, given that physicians who are not committed due to scholarship programs they received during their education may be weighing loan repayment packages offered in exchange for work in healthcare shortage areas with those offered in the private sector (27). Prior research has shown that growing up or training in a rural setting is associated with practicing in rural settings (28, 29), and that high prices for malpractice insurance are a factor that may lead physicians who have practiced in rural settings to leave (29). To increase the catchment and retention of physicians, including specialty physicians trained in hematology/oncology, to rural settings, existing programs should be expanded to allow physicians practicing in rural areas to benefit from all available incentive programs offered in that area. This should include extending incentives designed for recruitment to physicians already practicing in rural areas. Beyond immediate incentives to capture physicians currently practicing, increased efforts should be made to recruit children from rural areas to college and medical school and to train more physicians in the rural setting. Additional incentives for physicians practicing in rural areas may also be needed, to offset high prices of malpractice insurance to improve retention.
This analysis found that acute care utilization, including EDTD visits and hospital admissions, in the SCD cohort was consistently highest among those aged 20-29 and 30-39 years old. These findings are consistent with prior research related to acute care utilization in SCD patients using data from 2005-2006 in Arizona, California, Florida, Massachusetts, Missouri, New York, South Carolina, and Tennessee which found that over 30% of the patients with healthcare encounters related to SCD were age 18-30 years old and that rates of ED visits and inpatient stays per year were highest in the 18-30 year old age group (ED = 1.59 (95% CI: 1.50-1.68) and admissions = 2.02 (1.94-2.10)) followed by the 31-45 year old age group (ED = 1.29 (1.20-1.38) and admissions = 1.65 (1.55-1.75)) (30). Additionally, a recent 3-year study of 449 hospitalizations among 63 patients that investigated vaso-occlusive pain in SCD found that the median age at first hospitalization in the study window was 26 years (interquartile range: 22, 29) (31). Acute healthcare utilization is drastically higher for those with SCD than for the general public. In the general US population in 2019, ED visit rates were highest for infants under 1 year old at 1.23 visits per infant (32). Children aged 1–17 years had 0.43 visits per person, and adults aged 18–44 had 0.47 visits per person. The ED utilization rate was lowest among the 45–74 year old group at 0.41 visits per person, and the ≥75 years group had 0.66 visits per person. Among our study cohort, annual EDTD visits were highest in those aged 20 – 39, ranging from 4.21 – 5.91 visits per person and usually lowest in those 19 and younger, ranging from 0.95 – 1.43 visits per person. In our study cohort, annual EDTD visits in those aged 60 and older ranged from 0.63 visits to 2.62 visits per person. In 2015, rates of non-neonatal, nonmaternal inpatient stays among the general population were highest among those aged 65 and older at 0.26 stays per person and decreased sequentially with age, at 0.10 per person among those age 45-64, 0.04 per person among those aged 18-44, and 0.02 per person among those less than 18 years old (33). As with EDTD, annual hospitalizations in our study cohort are also highest among those aged 20 – 39, ranging from 2 - 2.97 stays per person and lowest among those under age 19, ranging from 0.62 – 1.15 stays per person. Among those aged 60 and older, annual hospital stays ranged from 1.22 – 2.38 visits per person.
As part of the SCDC program, collaborative projects with other SCDC state programs have been established allowing for investigation of more specific questions beyond the scope of standard surveillance. We have established a common data model for SCDC (16), designed to strengthen our distributed data network by standardizing and streamlining analysis and reporting of results, for both surveillance activities and specific projects, across multiple states. Utilization and extension of the common data model will allow us to increase capacity to expand analyses like this to include and compare results across multiple SCDC states, to better understand the burden of SCD and patterns of health care utilization among those affected by the disease, nationally. We work with the Sickle Cell Foundation of Tennessee to disseminate our findings, in layman’s terms, with the SCD community. These efforts include a website, a newsletter, periodic webinars, and other methods.
A limitation of this study is that those included in the cohort are identified only through newborn screening results or through Medicaid claims records from 2008 through 2019. For that reason, it is not inclusive of all individuals living with SCD in Tennessee as it does not capture those who do not have Medicaid enrollment history. Further, in addition to those identified via NBS, the SCDC confirmed case definition also includes those with a clinical diagnosis by a physician with documented confirmatory CLIA-certified laboratory testing after the newborn period. Because these data are not currently available, individuals who would meet this criteria to be considered a confirmed case are assessed and included in the cohort based on their alignment with the probable case definition. This analysis brings us closer to understanding the prevalence of SCD and the population cohort of people living with SCD in Tennessee, but the total number of people living with SCD in Tennessee has not been fully determined. Hospital and clinic-based electronic medical records are not currently included but we designed the SCDC-TN cohort to incorporate these data in the future. Incorporating these data sources will bring us closer to estimating the true prevalence of SCD in Tennessee. An additional limitation of this study is that specialty care provider locations were geocoded based on zip code using SAS’s built-in geocoding references and functionality, in which locations are plotted based on the center of the zip code referenced. Because it is not uncommon for zip codes to be split between county lines, plotted locations of specialists shown in map Figures do not perfectly reflect the actual physical locations (including county in some cases) of their business practice.
Conclusion
SCDC-TN merges data from multiple sources to better understand the number of people with SCD who are living in TN, their demographics, their geographic distribution across the state, and their health care utilization patterns with the goal of improving the quality of life of those who suffer from SCD in our state. This analysis brings us closer to understanding how many people with SCD live in rural areas of TN and the challenges they face in seeking the care needed to adequately manage their disease. Acute care utilization remains highest in the young adulthood years. This analysis also provides insight into how healthcare utilization patterns among individuals with SCD vary by age group and over time.
Data availability statement
The data analyzed in this study is subject to the following licenses/restrictions: Data use agreements do not allow sharing of individual level data used for this study. Requests for aggregated data related to this analysis should be directed to bXNtbHR6ZXJAbWVtcGhpcy5lZHU=.
Ethics statement
The studies involving humans were approved by institutional review board of the Tennessee Department of Health and the Division of TennCare. The studies were conducted in accordance with the local legislation and institutional requirements. Written informed consent for participation was not required from the participants or the participants’ legal guardians/next of kin in accordance with the national legislation and institutional requirements.
Author contributions
AP: Conceptualization, Formal Analysis, Investigation, Methodology, Software, Visualization, Writing – original draft. JH: Conceptualization, Funding acquisition, Writing – review & editing. RD: Formal Analysis, Funding acquisition, Writing – review & editing. JD: Validation, Writing – review & editing, Data curation, Formal Analysis, Software, Supervision. AY: Supervision, Writing – original draft, Writing – review & editing. AM: Conceptualization, Formal Analysis, Writing – original draft, Writing – review & editing. YC: Funding acquisition, Writing – review & editing. MdPA: Data curation, Writing – review & editing. CT: Resources, Writing – review & editing. VN: Conceptualization, Formal Analysis, Supervision, Validation, Writing – review & editing. MR: Formal Analysis, Supervision, Writing – review & editing. AW: Formal Analysis, Writing – review & editing. TA: Writing – review & editing. WC: Conceptualization, Formal Analysis, Supervision, Writing – original draft, Writing – review & editing. MS: Conceptualization, Formal Analysis, Funding acquisition, Supervision, Writing – original draft, Writing – review & editing.
Funding
The author(s) declare financial support was received for the research, authorship, and/or publication of this article. This work was supported by the Centers for Disease Control and Prevention’s National Center on Birth Defects and Developmental Disabilities (Grant number CDC-RFA-DD20-2003: Sickle Cell Data Collection Program).
Conflict of interest
MS has worked as a paid research consultant for the Association of Community Cancer Centers. JH has received consulting fees from Global Blood Therapeutics.
The remaining authors declare that the research was conducted in the absence of any commercial or financial relationships that could be construed as a potential conflict of interest.
Publisher’s note
All claims expressed in this article are solely those of the authors and do not necessarily represent those of their affiliated organizations, or those of the publisher, the editors and the reviewers. Any product that may be evaluated in this article, or claim that may be made by its manufacturer, is not guaranteed or endorsed by the publisher.
Supplementary material
The Supplementary Material for this article can be found online at: https://www.frontiersin.org/articles/10.3389/frhem.2023.1277548/full#supplementary-material
References
1. Sickle Cell Disease (SCD). What is Sickle Cell Disease?. Cdc.gov. Available at: https://www.cdc.gov/ncbddd/sicklecell/facts.html (Accessed February 5, 2022).
2. Lubeck D, Agodoa I, Bhakta N, Danese M, Pappu K, Howard R, et al. Estimated life expectancy and income of patients with sickle cell disease compared with those without sickle cell disease. JAMA Netw Open (2019) 2(11):e1915374. doi: 10.1001/jamanetworkopen.2019.15374
3. Wilson-Frederick S, Hulihan M, Mangum A, Khan T, Geibel M, Malsberger R, et al. Medicaid and CHIP Sickle Cell Disease report, T-MSIS Analytic Files (TAF) 2017. Baltimore, MD: Center for Medicaid and CHIP Services, Division of Quality and Health Outcomes, Centers for Medicare and Medicaid Services (2021). Available at: https://www.medicaid.gov/medicaid/quality-of-care/downloads/scd-rpt-jan-2021.pdf.
4. Sickle Cell Disease (SCD). Data & Statistics . Cdc.gov. Available at: https://www.cdc.gov/ncbddd/sicklecell/data.html#:~:text=In%20the%20United%20States&text=SCD%20affects%20approximately%20100%2C000%20Americans,sickle%20cell%20trait%20(SCT) (Accessed January 30, 2023).
5. Sickle Cell Trait. Hematology.org. Available at: https://www.hematology.org/education/patients/anemia/sickle-cell-trait (Accessed May 26, 2023).
6. Smeltzer MP, Nolan VG, Yu X, Nottage KA, Davis BA, Yang Y, et al. Birth prevalence of sickle cell trait and sickle cell disease in shelby county, TN. Pediatr. Blood Cancer. (2016) 63(6):1054–1059-1059. doi: 10.1002/pbc.25936
7. Reeves SL, Jary HK, Gondhi JP, Kleyn M, Spector-Bagdady K, Dombkowski KJ. Incidence, demographic characteristics, and geographic distribution of sickle cell trait and sickle cell anemia births in Michigan, 1997-2014. Mol Genet Genomic Med (2019) 7(8):e795. doi: 10.1002/mgg3.795
8. Centers for Disease Control and Prevention (CDC). Incidence of sickle cell trait – United States, 2010, 2014. MMWR morb mortal wkly Rep. (2014) 63(49):1155–8.
9. SCDC Report. Data to Action. Cdc.gov. Available at: https://www.cdc.gov/ncbddd/hemoglobinopathies/data-reports/2018-summer/index.html (Accessed Jan 30, 2023).
10. Smeltzer M, Hodges T, Whartenby J, Hankins J, Davis R, Cooper W. Three Wishes for Sickle Cell Disease: Results from a multi-stakeholder vision-casting project in Tennessee. Clin. Health Promotion. (2021) 11, e21014–1. doi: 10.29102/clinhp.21014
11. Mathias JG, Nolan VG, Klesges LM, Badawy SM, Cooper WO, Hankins JS, et al. Hydroxyurea use after transitions of care among young adults with sickle cell disease and tennessee medicaid insurance. JAMA network Open (2021) 4(10):e2128971. doi: 10.1001/jamanetworkopen.2021.28971
12. Shankar SM, Arbogast PG, Mitchel E, Cooper WO, Wang WC, Griffin MR. Medical care utilization and mortality in sickle cell disease: a population-based study. Am. J. Hematol. (2005) 80(4):262–70. doi: 10.1002/ajh.20485
13. Warren MD, Arbogast PG, Dudley JA, Kaltenbach L, Ray WA, Wang WC, et al. Adherence to prophylactic antibiotic guidelines among Medicaid infants with sickle cell disease. Arch Pediatr Adolesc Med (2010) 164(3):298–9. doi: 10.1001/archpediatrics.2009.286
14. Eckrich MJ, Wang WC, Yang E, Arbogast PG, Morrow A, Dudley JA, et al. Adherence to transcranial Doppler screening guidelines among children with sickle cell disease. Pediatr. Blood Cancer. (2013) 60(2):270–4. doi: 10.1002/pbc.24240
15. Sox CM, Cooper WO, Koepsell TD, DiGiuseppe DL, Christakis DA. Provision of pneumococcal prophylaxis for publicly insured children with sickle cell disease. JAMA. (2003) 290(8):1057–61. doi: 10.1001/jama.290.8.1057
16. Smeltzer MP, Reeves SL, Cooper WO, Attell BK, Strouse JJ, Takemoto CM, et al. Common data model for sickle cell disease surveillance: considerations and implications. JAMIA Open (2023) 6(2):ooad036. doi: 10.1093/jamiaopen/ooad036
17. Rural-Urban Continuum Codes. Ers.usda.gov. Available at: https://www.ers.usda.gov/data-products/rural-urban-continuum-codes.aspx (Accessed Jan 20, 2023).
18. Derrick B, Dobson-Mckittrick A, Toher D, White P. Test statistics for comparing two proportions with partially overlapping samples. J Appl Quantitative Methods (2015) 10(3):1842–4562.
19. Tennessee Department of Health Division of Health Statistics. Tennessee Vital Statistics Summary Resident Data 2008. Tennessee Department of Health (2010). Microsoft Word - COVER08.doc (tn.gov).
20. General Health Data: Birth Statistics. tn.gov. Available at: https://www.tn.gov/health/health-program-areas/statistics/health-data/birth-statistics.html (Accessed September 14, 2023).
21. Certified Population for Tennessee Municipalities . Mtas.tennessee.edu. Available at: https://www.mtas.tennessee.edu/cities_bypopulation (Accessed July 31, 2023).
22. Hassell KL. Population estimates of sickle cell disease in the U.S. Am. J. Prev. Med. (2010) 38(4 Suppl):S512–21. doi: 10.1016/j.amepre.2009.12.022
23. Improving Rural Health: State Policy Options for Increasing Access to Care. Ncsl.org. Available at: https://www.ncsl.org/health/improving-rural-health (Accessed May 25, 2023).
24. CMS Rural Health Strategy. Cms.gov. Available at: https://www.cms.gov/About-CMS/Agency-Information/OMH/Downloads/Rural-Strategy-2018.pdf (Accessed May 25, 2023).
25. About Rural Health. Cdc.gov. Available at: https://www.cdc.gov/ruralhealth/about.html (Accessed May 25, 2023).
26. Fedyanova Y. Incentivizing young doctors to practise in underserved areas. CMAJ: Can. Med. Assoc. J. (2018) 190(7):E203. doi: 10.1503/cmaj.109-5563
27. Arredondo K, Touchett HN, Khan S, Vincenti M, Watts BV. Current programs and incentives to overcome rural physician shortages in the United States: A narrative review. J. Gen. Intern. Med. (2023) 38(Suppl 3):916–22. doi: 10.1007/s11606-023-08122-6
28. Goodfellow A, Ulloa JG, Dowling PT, Talamantes E, Chheda S, Bone C, et al. Predictors of primary care physician practice location in underserved urban or rural areas in the United States: A systematic literature review. Acad Med (2016) 91(9):1313–21. doi: 10.1097/ACM.0000000000001203
29. Pepper CM, Sandefer RH, Gray MJ. Recruiting and retaining physicians in very rural areas. J. Rural Health (2010) 26(2):196–200. doi: 10.1111/j.1748-0361.2010.00282.x
30. Brousseau DC, Owens PL, Mosso AL, Panepinto JA, Steiner CA. Acute care utilization and rehospitalizations for sickle cell disease. JAMA (2010) 303(13):1288–94. doi: 10.1001/jama.2010.378
31. Rodday AM, Esham KS, Savidge N, Parsons SK. Patterns of healthcare utilization among patients with sickle cell disease hospitalized with pain crises. EJHaem. (2020) 1(2):438–47. doi: 10.1002/jha2.84
32. QuickStats: Emergency Department Visit Rates, by Age Group — United States, 2019–2020. Cdc.gov. Available at: https://www.cdc.gov/mmwr/volumes/71/wr/mm7142a5.htm#:~:text=The%20ED%20visit%20rate%20for,2020%20were%20not%20statistically%20significant (Accessed May 25, 2023).
Keywords: sickle cell, surveillance, SCDC, newborn screening (NBS), Medicaid
Citation: Plaxco AP, Hankins JS, Davis R, Dudley J, Young AJ, Mukhopadyay A, Carroll Y, Aguinaga MdP, Takemoto CM, Nolan VG, Ray MA, Wiese A, Amosun T, Cooper WO and Smeltzer MP (2023) Descriptive epidemiology of sickle cell disease in Tennessee: population-based estimates from 2008 to 2019. Front. Hematol. 2:1277548. doi: 10.3389/frhem.2023.1277548
Received: 22 August 2023; Accepted: 28 September 2023;
Published: 08 November 2023.
Edited by:
Guillemette Fouquet, Centre Hospitalier Sud Francilien, FranceReviewed by:
Martin Colard, Université libre de Bruxelles, BelgiumImo J. Akpan, Columbia University, United States
Copyright © 2023 Plaxco, Hankins, Davis, Dudley, Young, Mukhopadyay, Carroll, Aguinaga, Takemoto, Nolan, Ray, Wiese, Amosun, Cooper and Smeltzer. This is an open-access article distributed under the terms of the Creative Commons Attribution License (CC BY). The use, distribution or reproduction in other forums is permitted, provided the original author(s) and the copyright owner(s) are credited and that the original publication in this journal is cited, in accordance with accepted academic practice. No use, distribution or reproduction is permitted which does not comply with these terms.
*Correspondence: Matthew P. Smeltzer, bXNtbHR6ZXJAbWVtcGhpcy5lZHU=