 Janna M. Emery1,2†
 Betsabel Chicana1,2†
 Hanna Taglinao1
 Citlaly Ponce1Cristine Donham1,2Hawa Padmore1
 Aimy Sebastian3Scott L. Trasti4
 Jennifer O. Manilay1,2*
- 1Department of Molecular and Cell Biology, School of Natural Sciences, University of California, Merced, Merced, CA, United States
- 2Quantitative and Systems Biology Graduate Program, University of California, Merced, Merced, CA, United States
- 3Lawrence Livermore National Laboratory, Physical and Life Science Directorate, Livermore, CA, United States
- 4Laboratory Animal Resource Center, Texas Tech University Health Sciences Center, Lubbock, TX, United States
Introduction: Erythropoiesis occurs in a specialized niche in the bone marrow and is regulated in part by oxygen-sensing signaling pathways. VHL is an E3 ubiquitin ligase that regulates the degradation of hypoxia-inducible factor (HIF) proteins under normoxic conditions. In hypoxia, VHL is inactivated resulting in enhancement of HIF signaling.
Methods and results: To investigate the effects of HIF-activation in bone cells on erythropoiesis, we performed longitudinal analyses of conditional Vhl knockout mice (Dmp1-Cre;Vhlfl/fl; VhlcKO) mice, in which Vhl is deleted primarily in osteocytes but is retained in hematopoietic cells. VhlcKO mice display elevated red blood cell counts and erythropoietin levels starting at 10 weeks of age, resembling polycythemia. Using flow cytometry, we observed increased frequency of CD71loTER119hiFSClo orthochromatophilic erythroblasts and reticulocytes in 10- and 24-week-old VhlcKO bone marrow. Features of extramedullary hematopoiesis were observed in the spleen, including red pulp hyperplasia, the presence of megakaryocytes, and increased frequency of basophilic and polychromatophilic erythroblasts and of mature stress erythroid progenitors. To investigate the mechanisms that drive the accelerated erythropoiesis in the bone marrow, we enumerated myeloid progenitors and observed higher frequencies of megakaryocyte-erythroid progenitors (MEPs) at 6 and 10 weeks of age, but MEP frequency was similar to controls at 24 weeks. Despite this normalization in MEP frequencies, bulk RNA-Seq of MEPs at this age showed upregulation of Epas1 (Hif2a), consistent with a response to hypoxia, as well as genes involved in erythrocyte development. Surprisingly, genes involved in the response to glucose were also upregulated in VhlcKO MEPs.
Discussion: Our studies implicate that HIF-driven alterations in skeletal homeostasis drive changes to the bone marrow microenvironment that influence erythroid cell development and MEP metabolism.
Introduction
Erythroid homeostasis is highly regulated to ensure a balanced supply of red blood cells (RBC) for efficient tissue oxygenation while avoiding their overproduction. The detailed steps of erythropoietic development have been studied extensively (reviewed in (1)). Briefly, RBCs originate from progenitors that reside in the bone marrow (BM). To produce RBCs, megakaryocyte-erythroid progenitors (MEP) differentiate into burst forming unit-erythroid and colony-forming unit-erythroid (CFU-E) cells. With erythropoietin (EPO) stimulation, CFU-E develop into various erythroid progenitors: proerythroblasts, basophilic erythroblasts, polychromatophilic erythroblasts, and orthochromatophilic erythroblasts. These progenitors develop in close proximity to macrophages in a specialized BM niche called an erythroblastic island. Terminal maturation, crucial for development of mature RBCs, involves enucleation leading to formation of reticulocytes (2). Reticulocytes then undergo organelle clearance and membrane remodeling (2, 3).
Despite the robust capacity of steady state erythropoiesis to produce new RBCs, there are situations where it is unable to maintain erythroid homeostasis. During such instances, a short-term, compensatory mechanism termed stress erythropoiesis produces an influx of new RBCs to maintain homeostasis until steady state erythropoiesis can resume (4). This response is driven by stress erythroid progenitors (SEPs) and is best understood in mice, where it is extramedullary, occurring in a specialized microenvironment in the fetal liver, as well as the adult spleen and liver (5–7). While extensive efforts have been made to understand RBC development, many questions remain regarding how the BM and bone microenvironment maintains and regulates erythroid development.
Bone is a highly dynamic tissue that undergoes continuous remodeling to maintain a healthy skeleton and support efficient and lifelong skeletal functions. Dysregulation of coupled signaling pathways or imbalances in bone resorption and formation can lead to abnormal bone remodeling and the development of bone diseases. Osteoporosis is a bone disease characterized by low bone mass and density, causing bone fragility and an increased risk of fractures (8). Osteolineage-specific Cre drivers that delete either prolyl hydroxylase (PHD) or von Hippel Lindau (VHL) result in the stabilization of hypoxia inducible factors (HIFs) and increased bone mass in mice (9–12). Findings from these models gave rise to the idea of novel, bone-targeted treatments for osteoporosis using PHD and VHL inhibitors (13, 14). However, the bone is also the site of hematopoiesis, and modification of HIF signaling in the bones of mice has been shown to impact the bone marrow microenvironment. For example, in mice where Vhl is conditionally deleted primarily in bone cells using the Dmp1 promoter (called VhlcKO mice), the mice develop high bone mass resulting in a severely occluded BM cavity, reduced BM cellularity, dysregulated B cell development, and prominent splenomegaly (11, 15).
In this study, we further investigated these VhlcKO mice, where Vhl is deleted in subsets of mesenchymal stem cells, late osteoblasts, and osteocytes, but is intact in hematopoietic cells (16, 17). We observed how Vhl deletion in Dmp1+ cells affects erythroid development. We provide evidence for structural, cellular and molecular alterations in the VhlcKO BM niche that impact the state of erythropoiesis.
Materials and methods
Experimental animals
Age-matched male and female mice on the C57BL/6 (B6) background were used. Dmp1-Cre (JAX 023047) and Vhlfl/fl (JAX 012933) mice were crossed to generate conditional Vhl knockouts (VhlcKO) in Dmp1-expressing cells (16, 18). Genotyping was confirmed by PCR (15) or Transnetyx, Inc. (Cordova, TN) using real-time PCR and no sex-specific differences in erythropoiesis or other components of our studies were detected. Mice were housed and bred under specific-pathogen free conditions. The University of California, Merced Institutional Animal Care and Use Committee approved all animal work.
Complete blood count and peripheral blood smears
Tail bleeds were performed as described (15). For complete blood count (CBC) and PB smears, peripheral blood was directly collected into BD Microcontainer tubes with K2E (K2EDTA; Fisher Scientific, Pittsburgh, PA) and 1.5 mL Eppendorf tubes with EDTA, respectively. A CBC was performed using a HEMAVET HV950 automated veterinary hematology counter (Drew Scientific, Inc., Miami Lakes, FL). MULTI-TROL mouse control blood (Drew Scientific, Inc., Miami Lakes, FL) was run prior to mouse blood samples to calibrate the HEMAVET system and assess sample quality control. The quality control program was run daily.
PB smears were prepared within 1 hour of blood collection to minimize artifacts. A glass slide was positioned so that the frosted end was on the left and one drop of blood was placed in the center nearest to the frosted end. Using a second glass slide positioned at a 45° angle, the drop of blood was gently smeared toward the end of the slide and left to air dry for 1 minute. The air-dried blood smear was fixed in methanol, air dried, stained with Wright-Giemsa stain (Volu-Sol, Salt Lake City, UT), and rinsed, then staining was repeated. Stained blood smears were left to air dry and cover slips were mounted using Permount (Fisher Scientific) before microscopic analysis. Slides were shipped overnight to Texas Tech University Health Sciences Center and photomicrographs were taken using a Nikon Eclipse Ni microscope.
Quantification of cytokines
BM fluid and PB was collected and processed, and cytokine measurements were performed using a customized bead-based multiplex (13-LEGENDplex assay) from Biolegend, Inc. as described (15).
Bone marrow and spleen collection and processing
Mice were euthanized by CO2 asphyxiation followed by cervical dislocation. BM from long bones and splenocytes from spleens were isolated as described (15). Isolated cells were treated with ACK lysis buffer to remove erythrocytes for myeloid progenitors, lineage, and erythroblast analysis. Cell counts were obtained using a hemocytometer and Trypan Blue staining to exclude dead cells.
Flow cytometry
Cell staining included a pre-incubation step with unconjugated anti-CD16/32 (clone 93) to block Fc receptors, except for myeloid progenitor panel (15). The antibody cocktails used are listed in Supplementary Table 1. For viability staining, DAPI (Sigma- Aldrich, 1 μg/ml) or PI (Sigma-Aldrich, 1 μg/ml) was used. Single color stains were used for setting compensations and gates were determined with fluorescent-minus one controls, isotype-matched antibody controls, or historical controls. Data were acquired with BD LSR II (Becton-Dickinson) or ZE5 (BioRad, Hercules, CA) flow cytometers. The data was analyzed using FlowJo Software version 10.7.1.
Histology
Dissected spleens, livers, and sterna were fixed in 10% neutral buffered formalin (Thermo-Fisher Scientific) for 24 hours. After fixation, all samples were shipped overnight to Texas Tech University Health Sciences Center. Liver and spleen samples were trimmed while sternum samples were decalcified in Cal-Rite solution (Thermo-Fisher Scientific), then placed into histology cassettes. Tissues were processed routinely for histopathology and slides were stained with Hematoxylin and Eosin. Slides were examined and photomicrographs were taken using a Nikon Eclipse Ni microscope.
Bulk RNA-sequencing
MEPs (live, negative for F4/80, CD3, CD4, CD5, CD8, CD19, NK1.1, Ter119 and Gr1; CD45+ cKIT+ Sca1- CD34- CD16/32-) from pooled BM of control (two replicates with n=5 and n=4, mixed sexes) and VhlcKO (two replicates with n=6, n=5, mixed sexes) mice were isolated by flow cytometric sorting on the FACS Aria3 (Becton-Dickinson) and stored in RLT lysis buffer (Qiagen, Redwood City, CA) supplemented with β-mercaptoethanol at -80C until RNA isolation. RNA from sorted MEPs was isolated using RNEasyMinElute columns following the manufacturer’s instructions. The isolated RNA from each sample was flash frozen and sent to UC Irvine Genomics Research and Technology Hub on dry ice to obtain a library of transcripts. Library construction was performed with the SMARTer® Stranded Total RNA-Seq Kit v3 and sequenced on the i5 NovaSeq 6000. Sequencing data quality was checked using fastQC (19). Subsequently UMIs, adapters and linkers were trimmed from Read 2 using Trimmomatic (20). Reads were then mapped to mouse genome (mm10) using STAR (21) and read counts per gene were determined using “featureCounts” from Rsubread package (22). Differentially expressed genes (DEGs) were identified using limma after voom normalization (23). Genes with a P value <0.05 were considered as significantly differentially expressed. Volcano plot and heatmap were generated using the gplots package (24) conducted in R version 4.3.0 (2023–04–21) (25). Functional gene ontology was analyzed from DEGs in the ToppGene Suite for gene list enrichment analysis with a false discovery rate set to p < 0.05 (26). Sequence files were submitted to the Gene Expression Omnibus (GEO) at the National Center for Biotechnology Information (NCBI) under accession number GSE237723.
Quantitative and standard reverse-transcriptase PCR
For quantitative RT-PCR (RT-qPCR), whole BM cells were isolated from long bones as described above. Cells were pelleted and resuspended in RNeasy RLT Lysis Buffer (Qiagen) with 1% 2-mercaptoethanol. Total RNA was purified using the Qiagen RNeasy Micro Kit (Qiagen) according to manufacturer’s protocol. RNA concentration and purity was analyzed using the Nanodrop One Spectrophotometer (Thermo Fisher Scientific). For RT-qPCR, the same amount of RNA from each sample was mixed with qScript XLT One-Step, RT-qPCR ToughMix (Quantabio) together with specific TaqMan expression primers. Real-time qPCR was run on the Applied Biosystems thermocycler using QuantStudio3 software (ThermoFisher) at the following specifications: 1 cycle at 50°C for 10 minutes for cDNA synthesis, 1 cycle at 95°C for 1 minute for initial denaturation and then 40 cycles of amplification at 95°C for 5 seconds then 60°C for 45 seconds. The following TaqMan gene expression assays (Thermo Fisher Scientific) were used: housekeeping Actb-VIC (Mm02619580_g1), target genes Slc2a1 FAM (Mm00441480_m1) EpoR-FAM (Mm00833882_m1).
Blood glucose measurements
For PB and BM fluid glucose measurements, mice were transferred into a sterile cage with only water for a 12-hour fast. After the 12-hour-fast, PB glucose levels were measured from 1 drop of blood using a glucometer (OneTouch Ultra2 LifeScan).
Statistical analysis
A G*Power statistical power analysis (a=0.05 and power of 0.95) (27) based on myeloid progenitor data and total BM cellularity determined that a minimum of 8 mice per group was needed for our studies. The total sample size for each experiment was performed in three independent experiments. For qPCR of sorted myeloid progenitors, mice were pooled (n=2 controls and VhlcKOs) and run in duplicate and for whole BM qPCR, 4 individual mice samples were used. Age-matched control and VhlcKO mice of both sexes were used. Comparisons between groups were performed using a two-tailed Student’s t-test to assess differences between mean and median values with Graph-Pad Prism and were considered significant if p<0.05.
Results
Elevated RBC parameters and polycythemia in VhlcKO mice
As early as 6 weeks of age, we observed increased hemoglobin and hematocrit in VhlcKO mice, and increased RBC counts starting at 10 weeks of age (Figure 1A), implying a polycythemic phenotype. VhlcKO mice also developed redness in their snouts and paws starting at 10 weeks of age (Supplementary Figure 1A), consistent with erythrocytosis. These changes were sustained to 24 weeks of age. No changes in white blood differentials were observed, except for a decrease in WBC and lymphocyte counts at 6 weeks of age (data not shown). To examine the possibility of a hematological disorder, we performed peripheral blood (PB) smears to assess RBC morphology. In both control and VhlcKO mice at 3, 6, and 10 weeks of age, the majority of RBCs were spherical, anucleate biconcave discs with central pallor which is typical of healthy murine RBCs (28) (Figure 1B, Supplementary Figure 1B). By 10 weeks of age, RBCs from VhlcKO mice exhibited increased mean corpuscular volume (MCV) and red blood cell distribution width (RDW), indicating increased RBC size (Supplementary Figure 1C). We attempted to perform PB smears on 24-week-old VhlcKO mice, but the blood was too viscous to accurately assess RBC morphology. Additionally, at 24 weeks, VhlcKO mice exhibited a significantly decreased platelet count (Figure 1C), but no significant changes in platelet volume (Supplementary Figure 1D). These findings demonstrate that Vhl deletion in Dmp1-expressing cells may not only be altering erythropoiesis, but also thrombopoiesis. Because erythropoietin (EPO) and thrombopoietin (TPO) can act in synergy to promote erythropoiesis (29), we measured EPO and TPO concentrations in the VhlcKO mice and found that EPO concentrations in the PB serum and BM fluid were comparable to controls between 3-to-6-weeks of age (Figure 1D). However, EPO levels in VhlcKO mice were increased by 10 weeks of age and sustained through 24 weeks (Figure 1D). Interestingly, TPO concentration was elevated only in the PB serum (Figure 1E).
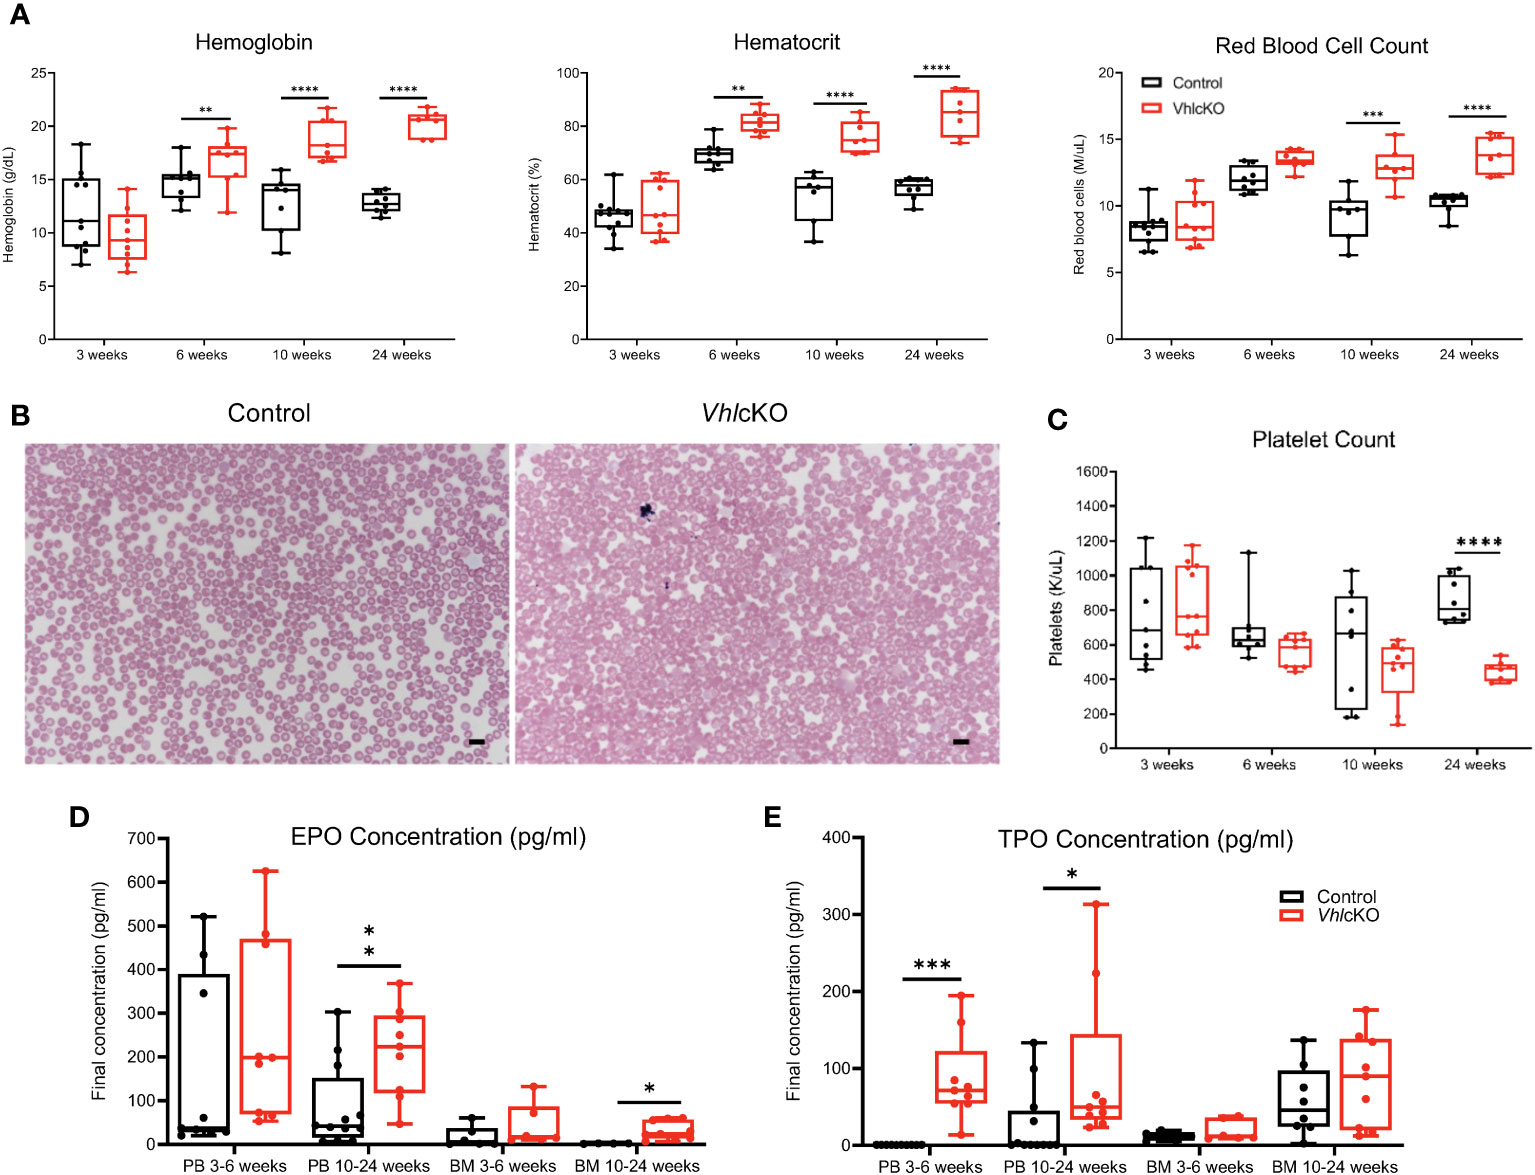
Figure 1 VhlcKO mice display enhanced erythropoiesis. (A) Hemoglobin, hematocrit, and red blood cell counts, as a function of age; (B) Wright-Giemsa-stained peripheral blood smears of 10-week-old control and VhlcKO mice, Scale bar: 10 µm; (C) Platelet count; (D) EPO concentration and (E) TPO concentration in peripheral blood and bone marrow fluid. *p < 0.05 **p < 0.01 ***p < 0.001 ****p < 0.0001, two-tailed Student’s t-test.
Vhl deletion in Dmp1-expressing cells dysregulates steady state erythropoiesis in the bone marrow and activates extramedullary hematopoiesis in the spleen
To identify any defects in erythropoiesis, we analyzed erythroblast development in the BM of VhlcKO mice using flow cytometry (30). We utilized CD71 and TER119 as cell surface markers and FSC as an additional parameter to classify all TER119+ cells into four subsets (31, 32): proerythroblasts (ProE; CD71hiTER119medFSChi), basophilic erythroblasts (BasoE; CD71hiTER119hiFSChi), polychromatophilic erythroblasts (PolyE; CD71medTER119hiFSClo), and orthochromatophilic erythroblasts and reticulocytes (OrthoE and Retic; CD71loTER119hiFSClo) (Figures 2A, B, top row). The frequencies and absolute numbers of erythroblast BM populations were unchanged or comparable between 3-week-old control and VhlcKO mice (Figure 2C, Supplementary Figure 2A). At 10 weeks and 24 weeks of age, the frequencies of bone marrow BasoE and PolyE were reduced, but the % of OrthoE and Retic were dramatically increased at 10 and 24 weeks (Figure 2C).
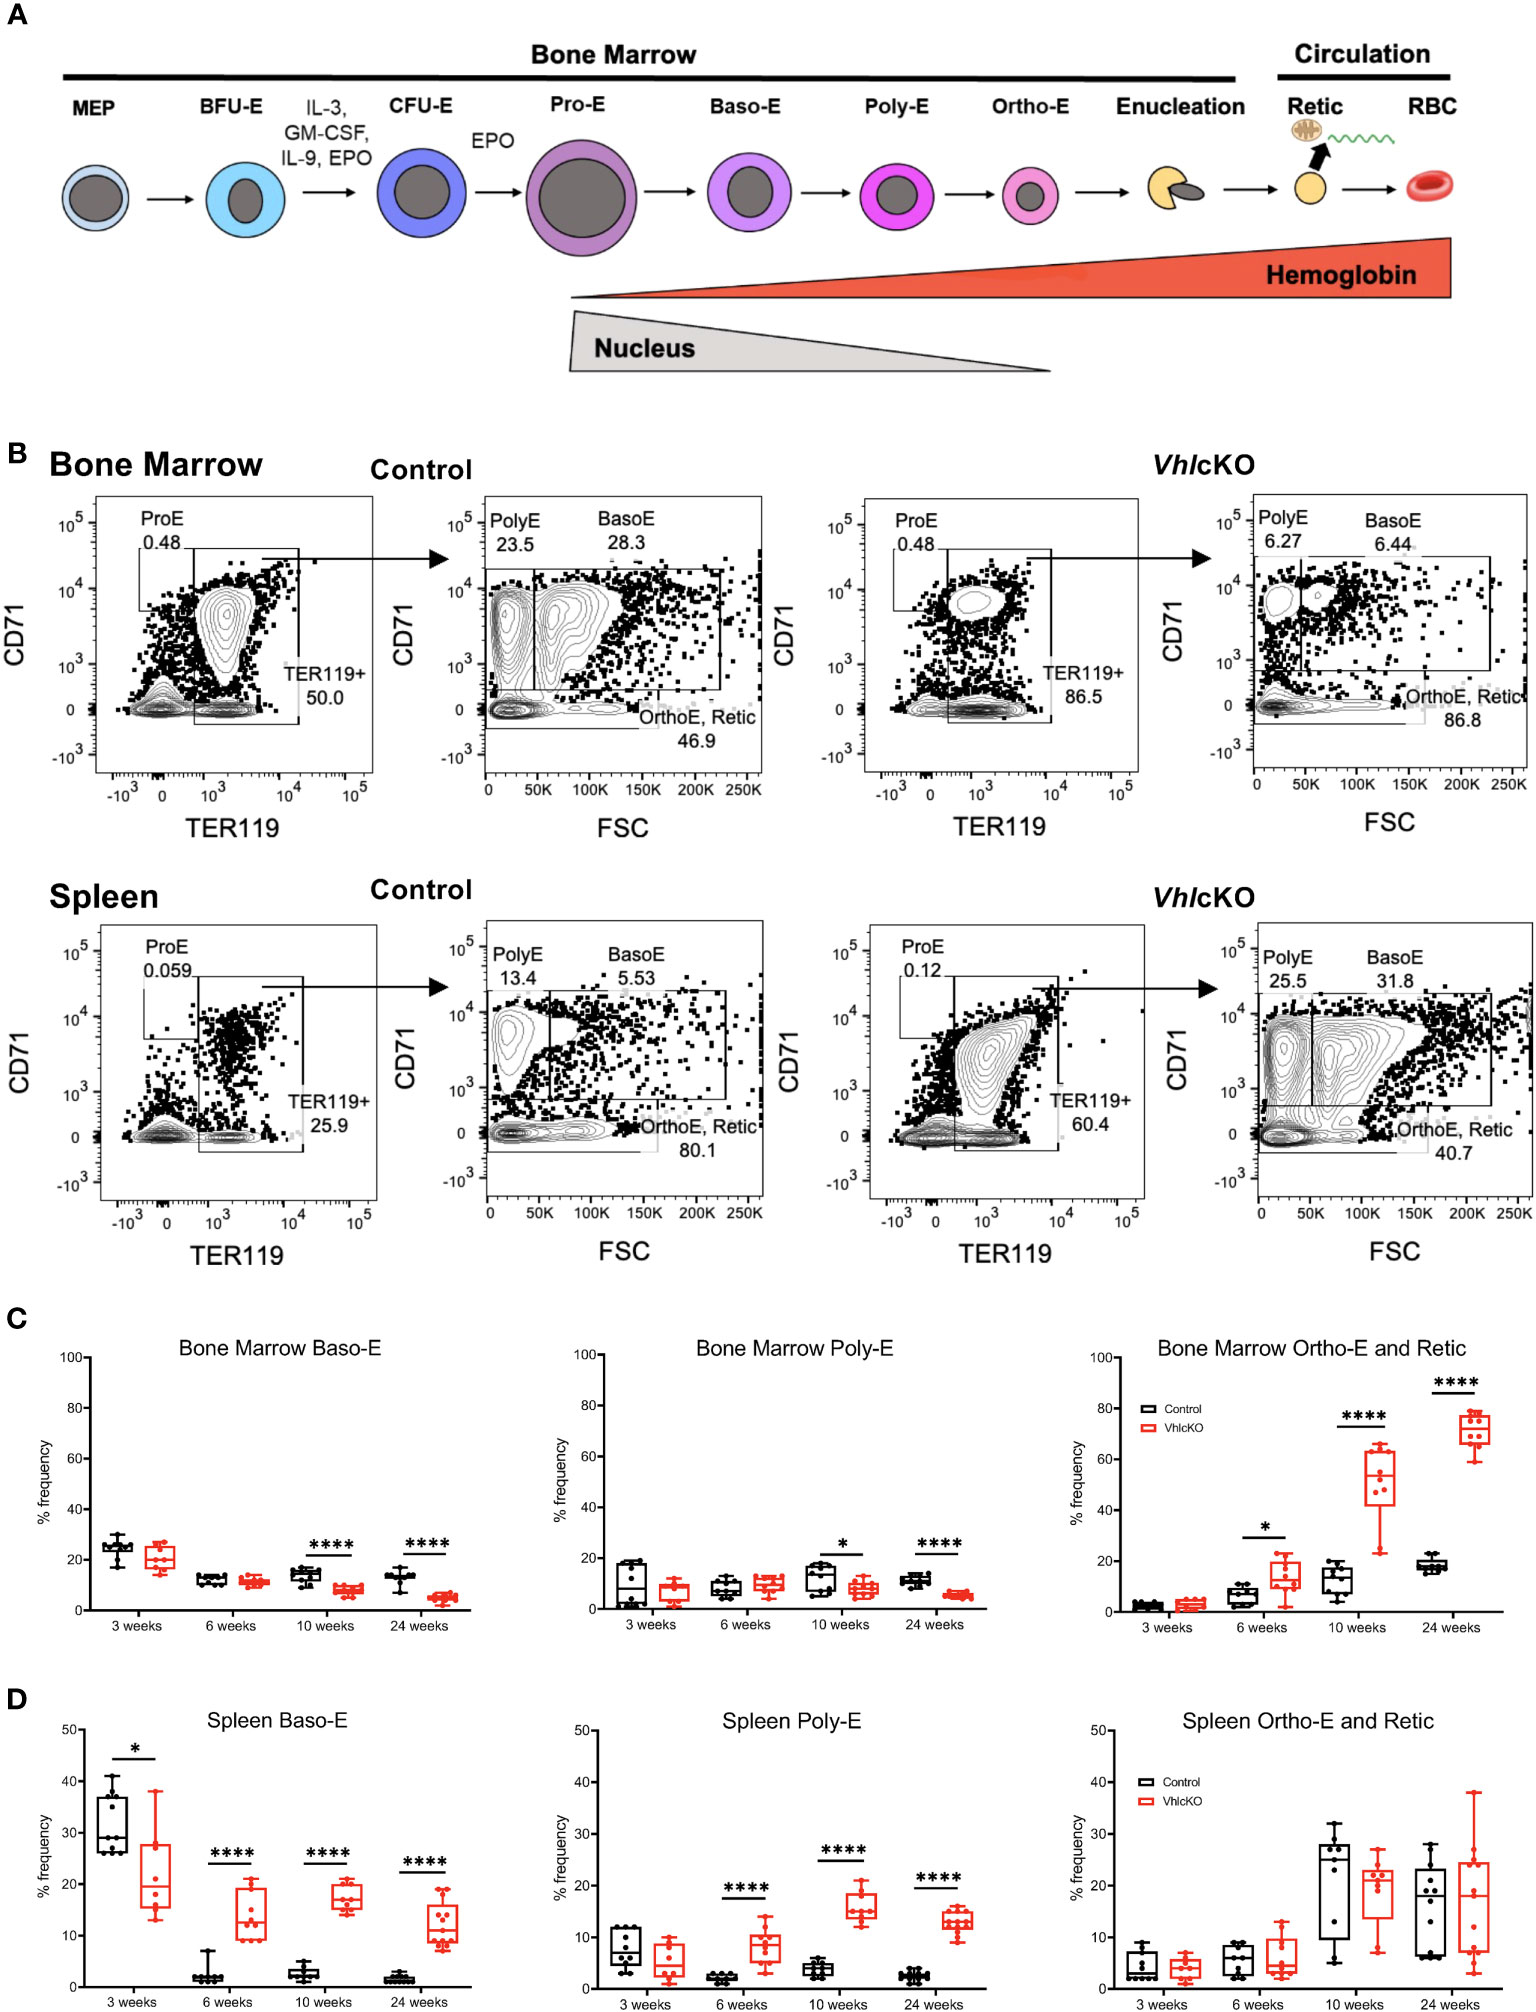
Figure 2 Altered steady state erythropoiesis in the bone marrow of 10- and 24-week-old VhlcKO mice. (A) Scheme of erythroid cell development; (B) Flow cytometry gating of erythroblast populations in the bone marrow of 24-week-old control and VhlcKO mice. ProE, proerythroblasts; BasoE, basophilic erythroblasts; PolyE, polychromatophilic erythroblasts; OrthoE and Retic, orthochromatophilic erythroblasts and reticulocytes; (C) Percentage of erythroblast populations in the bone marrow, and (D) spleen. *p < 0.05, ****p < 0.0001, two-tailed Student’s t-test.
Cessation of splenic erythropoiesis typically occurs by 6 weeks of age in mice (33). Previously, we found that VhlcKO mice display splenomegaly (15), characterized by increased spleen length, weight, and cellularity compared to controls. Splenomegaly is frequently associated with extramedullary hematopoiesis; consequently, we quantified the erythroblast stages in the spleen (Figure 2B, bottom row and 2D). At 3 weeks of age, splenic BasoE were decreased in VhlcKO, but starting at 6 weeks of age, VhlcKO spleens displayed increased BasoE frequencies (Figure 2D, left panel). PolyE frequencies were also increased in the spleen starting at 6 weeks of age (Figure 2D, middle panel). The absolute numbers of BasoE and PolyE also were increased starting at 6 weeks (Supplementary Figure 2B). Splenic OrthoE and Retic levels were similar to controls at all ages examined (Figure 2D, right panel, Supplementary Figures 2A, B). Taken together, our findings suggest that changes in the BM of VhlcKO mice leads to erythropoietic activity in the spleen.
Analysis of myeloid progenitors and lineages in the VhlcKO mice
VhlcKO long bones (15) and sterna displayed abnormally high bone mass and occlusion of the BM cavity starting at 6 weeks of age (Supplementary Figure 3A), which became severe by 24 weeks of age (Figure 3A). We previously reported increased frequencies of BM monocytes and granulocytes, suggesting skewing of hematopoietic differentiation toward the myeloid lineages in VhlcKO mice (15). To elucidate any changes to the myeloid progenitor compartments in the BM of VhlcKO mice, we performed a longitudinal quantification of common myeloid progenitors (CMP: CD45+Lin-cKIT+Sca1-CD16/32+CD34+), granulocyte/monocyte progenitors (GMP: CD45+Lin-cKIT+Sca1-CD16/32-CD34+) and megakaryocyte/erythroid progenitors (MEP: Lin-CD45+cKIT+Sca1-CD16/32-CD34-) using flow cytometry (Figure 3B). There were no differences at 3 weeks of age (Figure 3C). However, starting at 6 weeks, VhlcKO mice exhibited an increase in CMP frequency in the bone marrow, which persisted at 10 and 24 weeks (Figure 3C). MEP frequencies were markedly increased at 6 weeks, slightly but significantly increased at 10 weeks, and similar to controls by 24 weeks (Figure 3C). GMP frequencies were similar to controls until 24 weeks where GMP frequency was increased (Figure 3C).
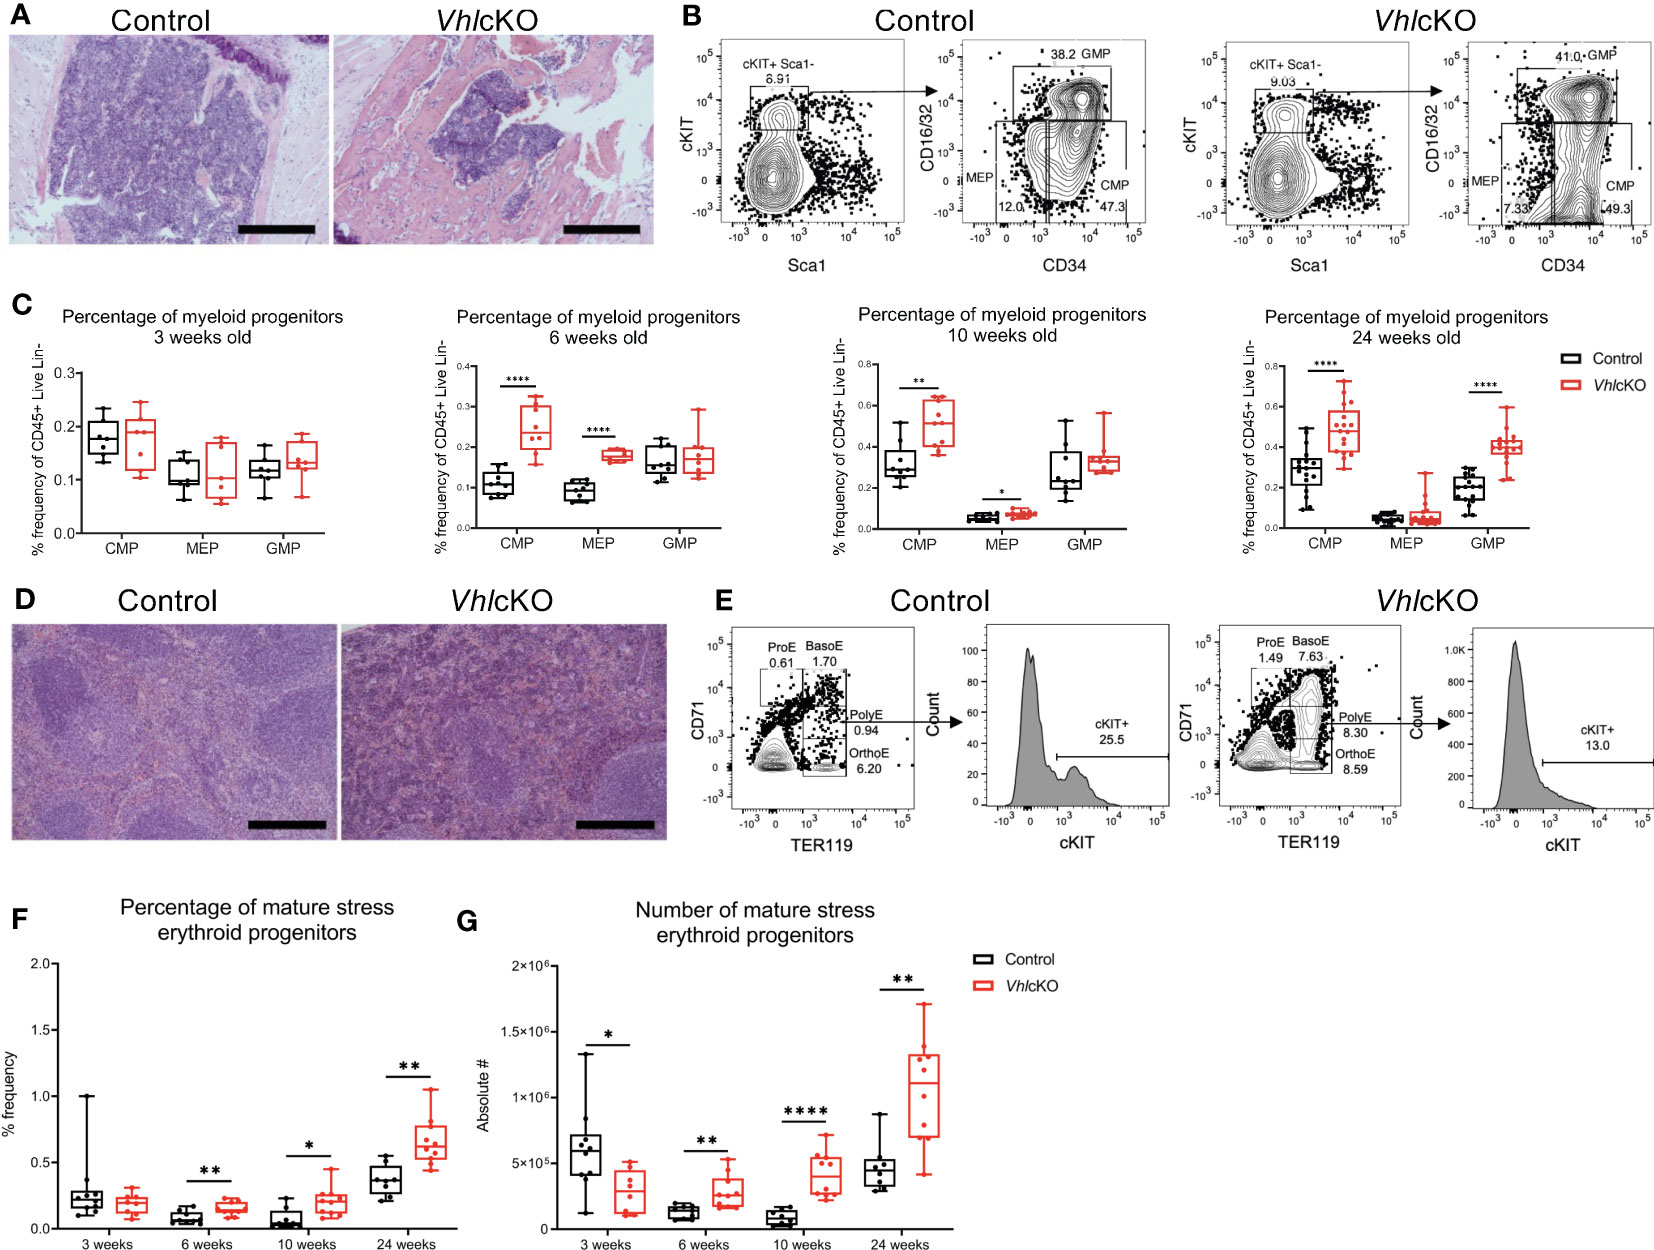
Figure 3 Myeloid progenitors and stress erythroid progenitors in the bone marrow of VhlcKO mice. (A) Photomicrographs of hematoxylin and eosin-stained control and VhlcKO sternum, where bone is light pink colored and bone marrow is dark purple colored; scale bar: 100 µm; (B) Flow cytometry gating strategy for myeloid progenitors; (C) Percentage of myeloid progenitors CMPs, MEPs, and GMPs out of Live, CD45+ from bone marrow, by mouse age; (D) Photomicrographs of control spleen (left) and VhlcKO spleen (right) at 24 weeks of age, Scale bar: 100 µm. Both groups display distinct regions of the red pulp (stained pink by eosin stain) and the white pulp (stained purple by hematoxylin); (E) Flow cytometry gating of the mature SEPs in the spleens of control and VhlcKO mice; (F) Percentage and (G) Number of stress erythroid progenitors. * p < 0.05, ** p < 0.01, **** p < 0.0001, two-tailed Student’s t-test.
Given that the total BM cellularity decreases in VhlcKO mice (15), it is also important to determine the absolute numbers of each population to see how these compare with the frequency patterns. Absolute numbers of CMPs, MEPs and GMPs were comparable at 3 weeks of age (Supplementary Figure 3B). At 6 weeks, VhlcKO CMPs and MEPs were similar to controls, but GMPs were reduced in number; GMPs then normalized to control levels by 10 weeks of age. By 24 weeks of age, absolute numbers of CMPs, MEPs and GMPs significantly decreased in the VhlcKO BM (Supplementary Figure 3B). Although the increased frequencies of CMPs, MEPs and GMPs could be due to myeloid bias, it may simply reflect the reduction of other BM cell populations (e.g., B cells (15)). Furthermore, the overall decrease in absolute cell numbers is likely due to the over proliferation of bone, leading to a smaller BM cavity.
We also quantified neutrophils (CD45+Ly6G+CD11b+), classical monocytes (CD45+Ly6G-CD11b+F4/80-CD115+Ly6Chi) divided into CD43+ or CD43- populations, non-classical monocytes (CD45+Ly6G-CD11b+F4/80-CD115+Ly6C-CD43+), and dendritic cells (CD45+Ly6G-CD11b+F4/80-CD115+Ly6C-CD43+MHC-II+CD11c+)(Supplementary Figure 4) (34). We observed no differences in the frequencies of neutrophils or monocytes at all ages examined (Supplementary Figures 4A, E). Dendritic cell frequency dropped at 10 weeks only (Supplementary Figure 4C). Consistent with the development of an occluded bone marrow cavity, the absolute cell number of neutrophils, dendritic cells, and conventional monocytes significantly decreased in the bone marrow by 24 weeks of age (Supplementary Figures 4B, D, F).
Evidence for EPO-dependent stress erythropoiesis in VhlcKO spleens
Starting at 6 weeks of age, we found significant red pulp hyperplasia and presence of megakaryocytes in the spleens and livers of VhlcKO mice, which became severe at 24 weeks of age (Figure 3D, Supplementary Figures 5A, C). We quantified long-term hematopoietic stem cells (LT-HSCs: LSK, CD150+ CD48-), short term hematopoietic stem cells (ST-HSCs: LSK, CD150-, CD48-), and multipotent progenitors (MPP2: LSK, CD150+, CD48+; MPP3: LSK, CD150-, CD48+; and MPP4: LSK, CD150-, Flk2+, CD48+) (Supplementary Figure 6A). We found an increased absolute number and frequency of all hematopoietic stem and progenitor cells, CMP,s MEPs and GMPs in the spleen of 10- and 24-week-old VhlcKO mice (Supplementary Figures 5B, 6B–E).
Conditions of stress (i.e. anemia) or underlying diseases (e.g., infection) can induce stress erythropoiesis in the spleen as a mechanism to temporarily rescue steady state erythropoiesis (4). This response is driven by SEPs, which are distinct from the progenitors involved in steady state erythropoiesis (35). Knowing that SEPs are derived from ST-HSCs that home to the spleen (4), we enumerated mature SEPs (CD71lowTER119+cKIT+) in the spleens of VhlcKO mice using flow cytometry (4) (Figure 3E). We found a lower absolute number of SEPs in 3-week-old VhlcKO mice. However, starting at 6 weeks of age, we observed an increase in both the absolute number and frequency of SEPs in VhlcKO mice (Figures 3F, G). Taken together with the observation of increased PB serum EPO concentration (Figure 1D), this data suggests that that EPO-dependent stress erythropoiesis is occurring and that EPO is driving the transition of SEPs to erythroblasts in the spleen (4, 36).
Elevated levels of Glut1 in VhlcKO MEPs
To investigate the molecular mechanisms underlying the altered erythropoiesis in VhlcKO mice, we sorted MEPs by flow cytometry (Supplementary Figure 7A) from 24-week old mice for bulk RNA sequencing analysis. At this age, the % of MEPs were similar to controls (Figure 3C), so we were curious to examine if there was any evidence of skewing to a particular cell fate at the genomic level. We identified 1094 differentially expressed genes (upregulated: 861 genes; downregulated: 233 genes) in MEPs of VhlcKO mice compared to controls (Figure 4A, Supplementary Table 2). A list of selected genes of interest are shown in the heatmap (Figure 4B). Epas1 (Hif2a) was upregulated in VhlcKO MEPs, consistent with a response to hypoxia, and Vhl expression was detected, confirming no off-target deletion (Figure 4B). We observed an upregulation of genes involved in erythrocyte development (Epb41l3, Epb41l1) (Figure 4B), consistent with the enhanced erythropoiesis observed in VhlcKO mice.
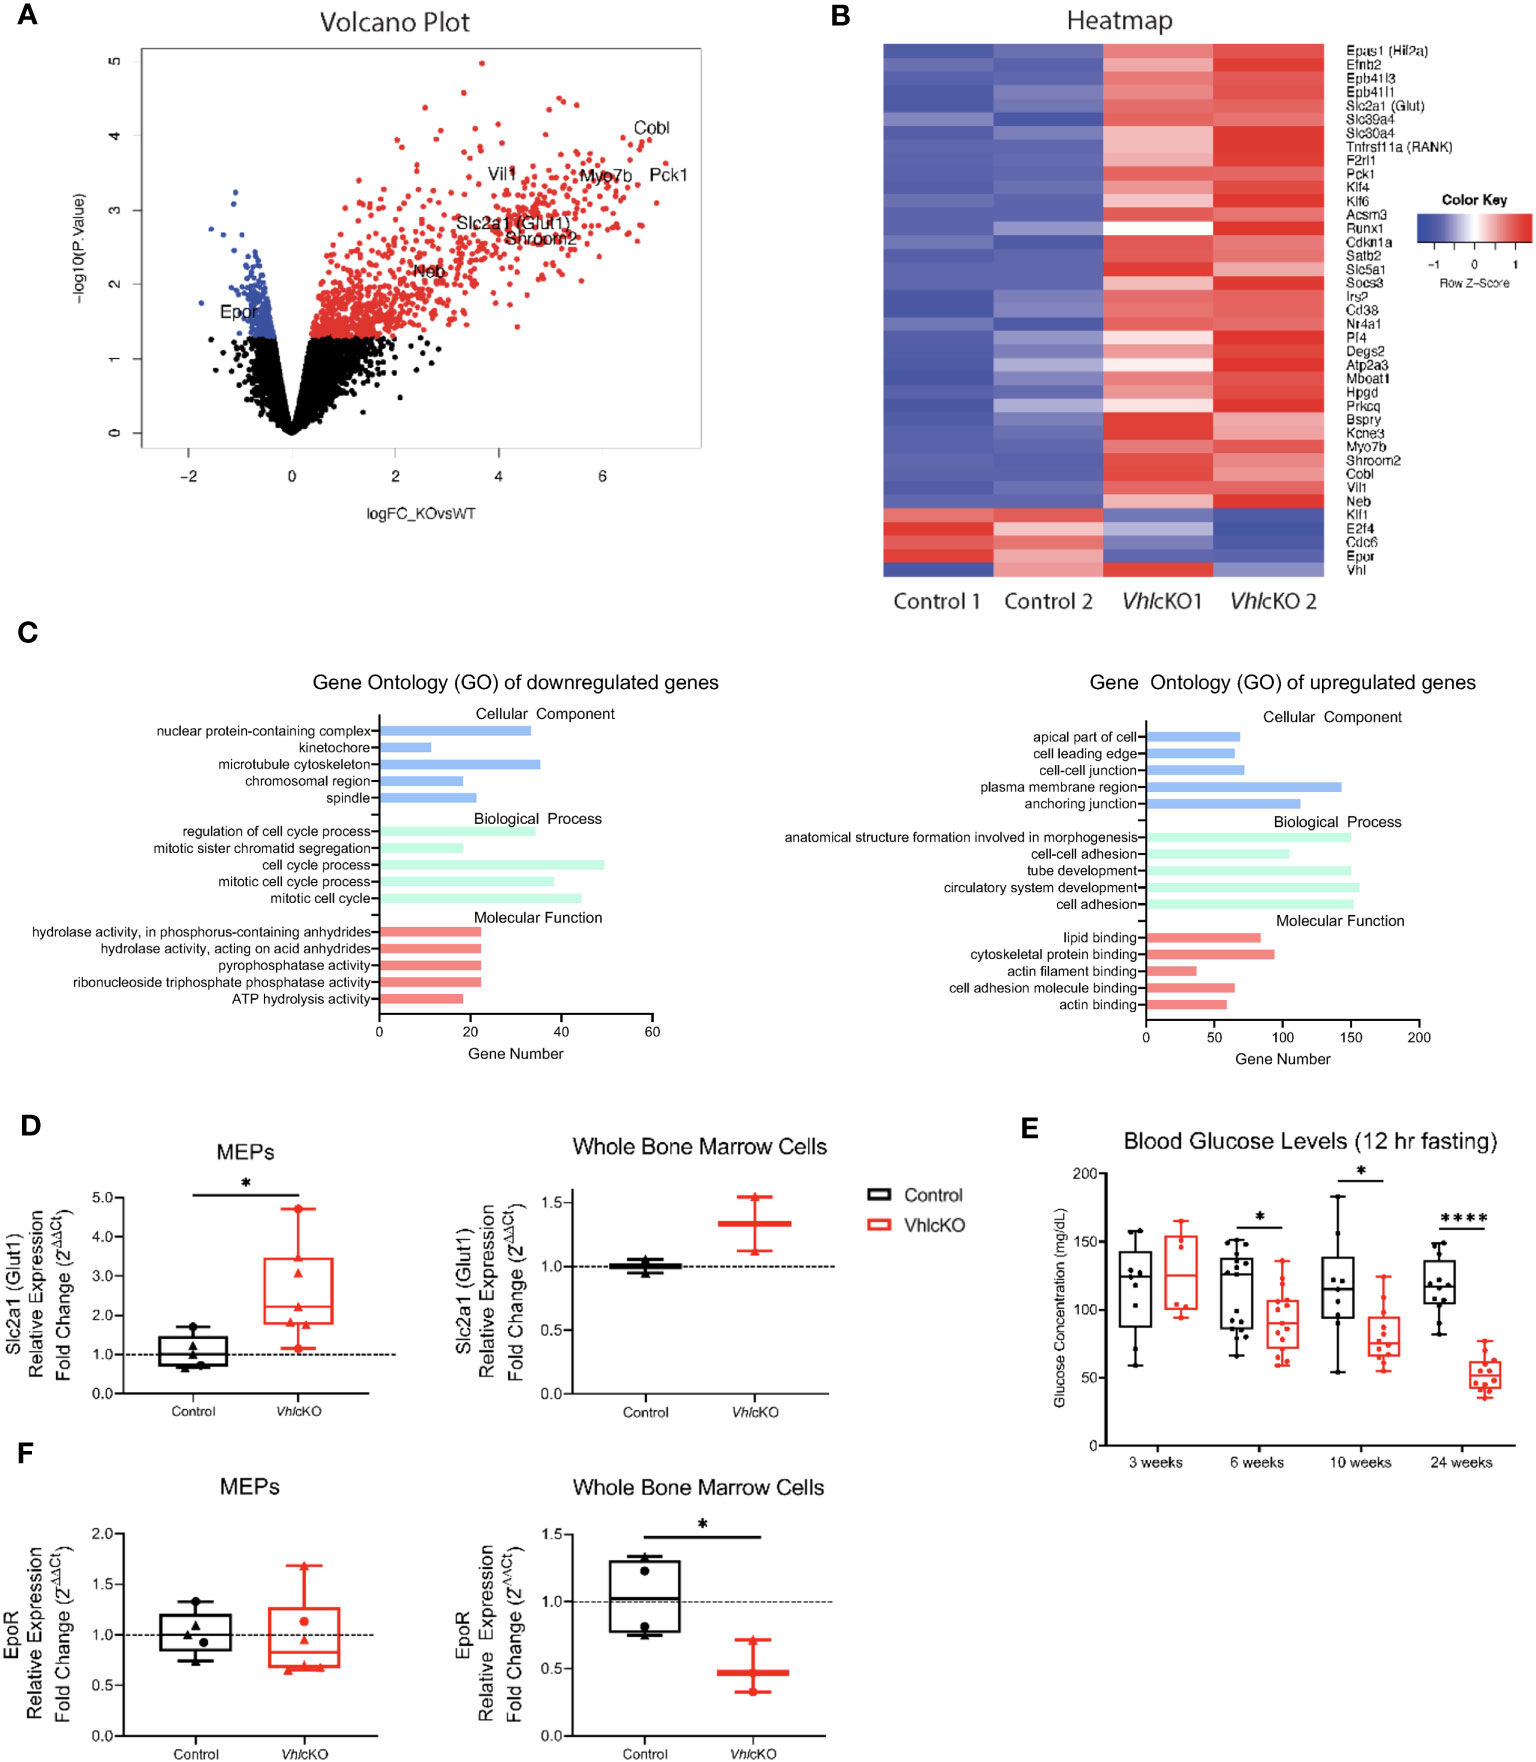
Figure 4 Gene expression analysis of VhlcKO MEPs. (A) Volcano plot, fold change (x axis) vs statistical significance (y axis) of upregulated genes (red) and downregulated genes (blue) p<0.05, black represents genes that were not found to be significantly differentiated between VhlcKO and control samples; (B) Heatmap of 3838 significant genes of interest from control and VhlcKO MEPs based on raw counts of sequenced samples; (C) Gene Ontology (GO) classification showing significant enrichment of three main gene pathway categories (cellular component, biological process, and molecular function) from bulk RNA sequencing of sorted MEPs from control and VhlcKO mice at 24 weeks old with the adjusted p-value <0.05. The x-axis indicates the number of genes in each category; (D) Normalized relative expression of Slc2a1(Glut1) from 10-week-old (circles) and 24-week-old (triangles) MEPs (left) or whole bone marrow (right) of control or VhlcKO mice.; (E) Blood glucose levels. Mice were fasted for 12 hours prior to glucose measurement. (F) Epor normalized gene expression of 10-week-old (circles) and 24-week-old (triangles) sorted MEPs (left) or whole BM (right) of control or VhlcKO mice. (F) * p < 0.05, **** p < 0.0001, two-tailed Student’s t-test.
Gene ontology (GO) analysis was performed to determine the functional categories of the differentially expressed genes, based on cellular component, biological process, and molecular function (Figure 4C). GO analysis of all downregulated genes revealed enrichment of categories involved in cell division (e.g., microtubule cytoskeleton, spindle, cell cycle process, mitotic cell cycle, mitotic cell cycle process, and regulation of cell cycle process) and hydrolase and pyrophosphatase activity, with Cdc6 and E2f4 included in multiple categories (Figures 4B, C). GO analysis of upregulated genes showed significant enrichment of genes involved in components of the cell membrane and molecular actin/cytoskeleton binding (e.g., apical part of cell, plasma membrane region, cell-cell junction, cell leading edge, anchoring junction, actin binding, actin filament binding, lipid binding, cytoskeletal protein binding, and cell adhesion molecule binding), with Myo7b, Shroom2, Cobl, Vil1, Epb41l3, and Epb41l1 included in multiple categories. GO analysis of upregulated genes also showed enrichment of genes involved in development of cellular structures, (e.g., cell adhesion, cell-cell adhesion, tube development, circulatory system development, and anatomical structure formation involved in morphogenesis), such as Epas1, Efnb2, Nr4a1 and Klf4 (Figures 4B, C).
Slc2a1 (aka Glut1) and Pck1, key genes involved in response to glucose and metabolic regulation, were also listed within these upregulated biological process categories. Increased Glut1 expression in MEPs was confirmed by qPCR (Figure 4D), suggesting increased glycolysis in the MEPs. Glut1 expression in whole bone marrow cells were similar to controls (Figure 4D) but fasting peripheral blood glucose levels were significantly lower in VhlcKO mice (Figure 4E). As Epo-receptor (EpoR) signaling mediates cell metabolism through an increase in glycolysis (37), we measured EpoR levels on MEPs. Sequencing results from sorted MEPs revealed a slight (0.45 fold) downregulation of EpoR in VhlcKO mice (Figure 4B, Supplementary Table 2), and qPCR results showed no difference between control and VhlcKO MEPs (Figure 4F), indicating that EpoR signaling is intact in VhlcKO MEPs. Interestingly, whole BM cells revealed a decrease in EpoR expression (Figure 4F). These findings suggest that Vhl deletion in Dmp1-expressing cells changes the bone marrow microenvironment, resulting in increased glucose uptake in MEPs that directly reduces blood glucose levels and concomitantly enhances erythroid development in the BM.
Discussion
Here, we report that deletion of the Vhl gene in Dmp1-expressing cells results in changes in the BM microenvironment that alter the state of erythropoiesis as early as 6 weeks of age. We observed increased myeloid progenitor frequency, which suggests myeloid skewing. We also observed upregulation of genes involved in response to glucose and actin filament arrangement in sorted MEPs, elevated EPO levels in both the PB serum and BM, and extramedullary hematopoiesis in the spleens and livers of VhlcKO mice, all of which are consistent with augmented erythroblast development. In VhlcKO mice, Vhl deletion occurs in non-hematopoietic cells; therefore, any effects on hematopoietic cells observed must be cell extrinsic. RNA-seq data confirmed that Vhl is expressed in the MEPs of VhlcKO mice, ruling out off-target expression of Dmp1-Cre in MEPs. In addition, since VhlcKO →wild-type whole BM chimeras display normal erythropoiesis (data not shown), hematopoietic progenitors developing in VhlcKO mice are not intrinsically skewed to differentiate into any particular lineage. To our knowledge, our report is the first to show the presence of mature SEPs in vivo due to Vhl deletion in bone, indicating that stress erythropoiesis is occurring. In addition, our hematological analyses revealed a polycythemic phenotype. Altogether, these findings implicate HIF-driven alterations in skeletal homeostasis drive changes in EPO levels and erythropoiesis, extending our insight of a functional relationship between these two tightly regulated processes (skeletal homeostasis and steady-state erythropoiesis).
Our findings are consistent with previous studies using osterix (Osx)-specific Cre drivers to conditionally delete Vhl in osteoblasts (9, 10). Rankin et al. observed splenomegaly, an expansion of erythropoiesis, increased expression of Epo in the bone cells, and decreased Epo expression in the kidney (9). Dirckx et al. focused on the bone cell metabolism in Osx-Cre; Vhlfl/fl mice and observed increased glucose uptake and glycolysis in Vhl-deleted osteoblasts, but they did not report any data on hematopoiesis (10). Our results extend and merge these two studies. Our genomic analyses reveal novel details on the genetic responses of MEPs to deletion of Vhl in non-hematopoietic cells in the bone, adding new details on the molecular responses of erythrocyte progenitors to the bone marrow and skeletal microenvironment.
Our results demonstrate that deletion of Vhl in Dmp1+ cells enhances EPO production in the bone marrow and increases glycolysis in MEPs. Since EPO concentrations are elevated in VhlcKO blood and BM fluid, we expected that EpoR levels would also be elevated, as EpoR signaling mediates cell metabolism through an increase in glycolysis (37). However, we found EpoR mRNA expression to be significantly decreased in the whole BM qPCR. EpoR expression in the BM could be decreased due to high levels of EPO binding to EpoR, resulting in downregulation of the EpoR receptor as a negative feedback mechanism. EpoR expression on VhlcKO MEPs were similar to controls by qPCR, so we are unable to definitively conclude the relationship between EpoR signaling and increased Glut1 expression at this time. In agreement with other groups (10), we observed a marked hypoglycemic phenotype in our VhlcKO mice starting at 6 weeks of age. It is plausible that the increased number of RBC and their consequent uptake of glucose may be heightening systemic glucose clearance (38). With this hypoglycemic phenotype occurring independent to changes in body weight (data not shown), sex-dependent and hormonal changes need to be further explored (39).
Our study also provides additional information on the RBC parameters in VhlcKO mice, such as increased MCV and RDW, indicating the RBC of VhlcKO mice vary in size (anisocytosis) (28). Typically, anisocytosis and erythrocytosis are associated with vascular abnormalities resulting in complications like thrombosis and hypertension, and can inevitably can lead to premature lethality (40–42). Intriguingly, our group found that VhlcKO mice displayed extensively vasodilated blood vessels in the BM (15), suggesting that local and possibly systemic adaptive mechanisms are induced in these mice to compensate for the erythrocytosis.
Extramedullary hematopoiesis in the spleens of VhlcKO mice is supported by our observations of increased percentages of splenic CMPs and MEPs, the presence of late-stage erythroblasts in the spleen, and the presence of megakaryocytes and red pulp hyperplasia. Taken together, these observations indicate that sequestration, accumulation, and proliferation of circulating myeloid progenitors in splenic cords is occurring. Following this thought, we presume this may also be due to the homing of ST-HSCs to the spleen, where the stress erythroid fate promotes the extramedullary nature of stress erythropoiesis (43). Unlike steady state erythropoiesis, which produces RBC at a constant rate, stress erythropoiesis generates a bolus of new RBC derived from SEPs. Early in vivo work indicated that these splenic progenitors were distinct from steady state erythroid progenitors (7). Our data now provide in vivo evidence that terminal differentiation of SEPs may contribute to the red pulp hyperplasia and increased number of circulating RBCs we observe in VhlcKO mice. Alternatively, our data could reflect increased RBC turnover or sequestration due to erythrocytosis.
The findings in this study expand our understanding of the role of Vhl in skeletal homeostasis, in particular the effect on glucose metabolism in MEPs. Our working model is shown in Figure 5. Steady state erythropoiesis is illustrated in the top panel and our model of erythropoiesis in VhlcKO mice is illustrated in the bottom panel. Our data support that deletion of Vhl in Dmp1-expressing cells induces HIF-driven alterations that not only causes BM microenvironmental irregularities, but also directly regulates the state of erythropoiesis through an increase in EPO in the BM and expansion of the erythroid niche to the spleen and liver. We suspect these changes in erythropoiesis are mediated mainly through systemic EPO secretion but with local EPO secretion in the BM also contributing. Enhanced EpoR signaling may result in the upregulation of Glut1 on MEPs, which in turn contributes to low systemic glucose levels in the blood. Future studies investigating both the hepatic and splenic stress erythroid niche could provide insight as to how EPO and its co-regulators (i.e., FGF23) regulate the state of erythropoiesis to compensate for BM irregularities (44).
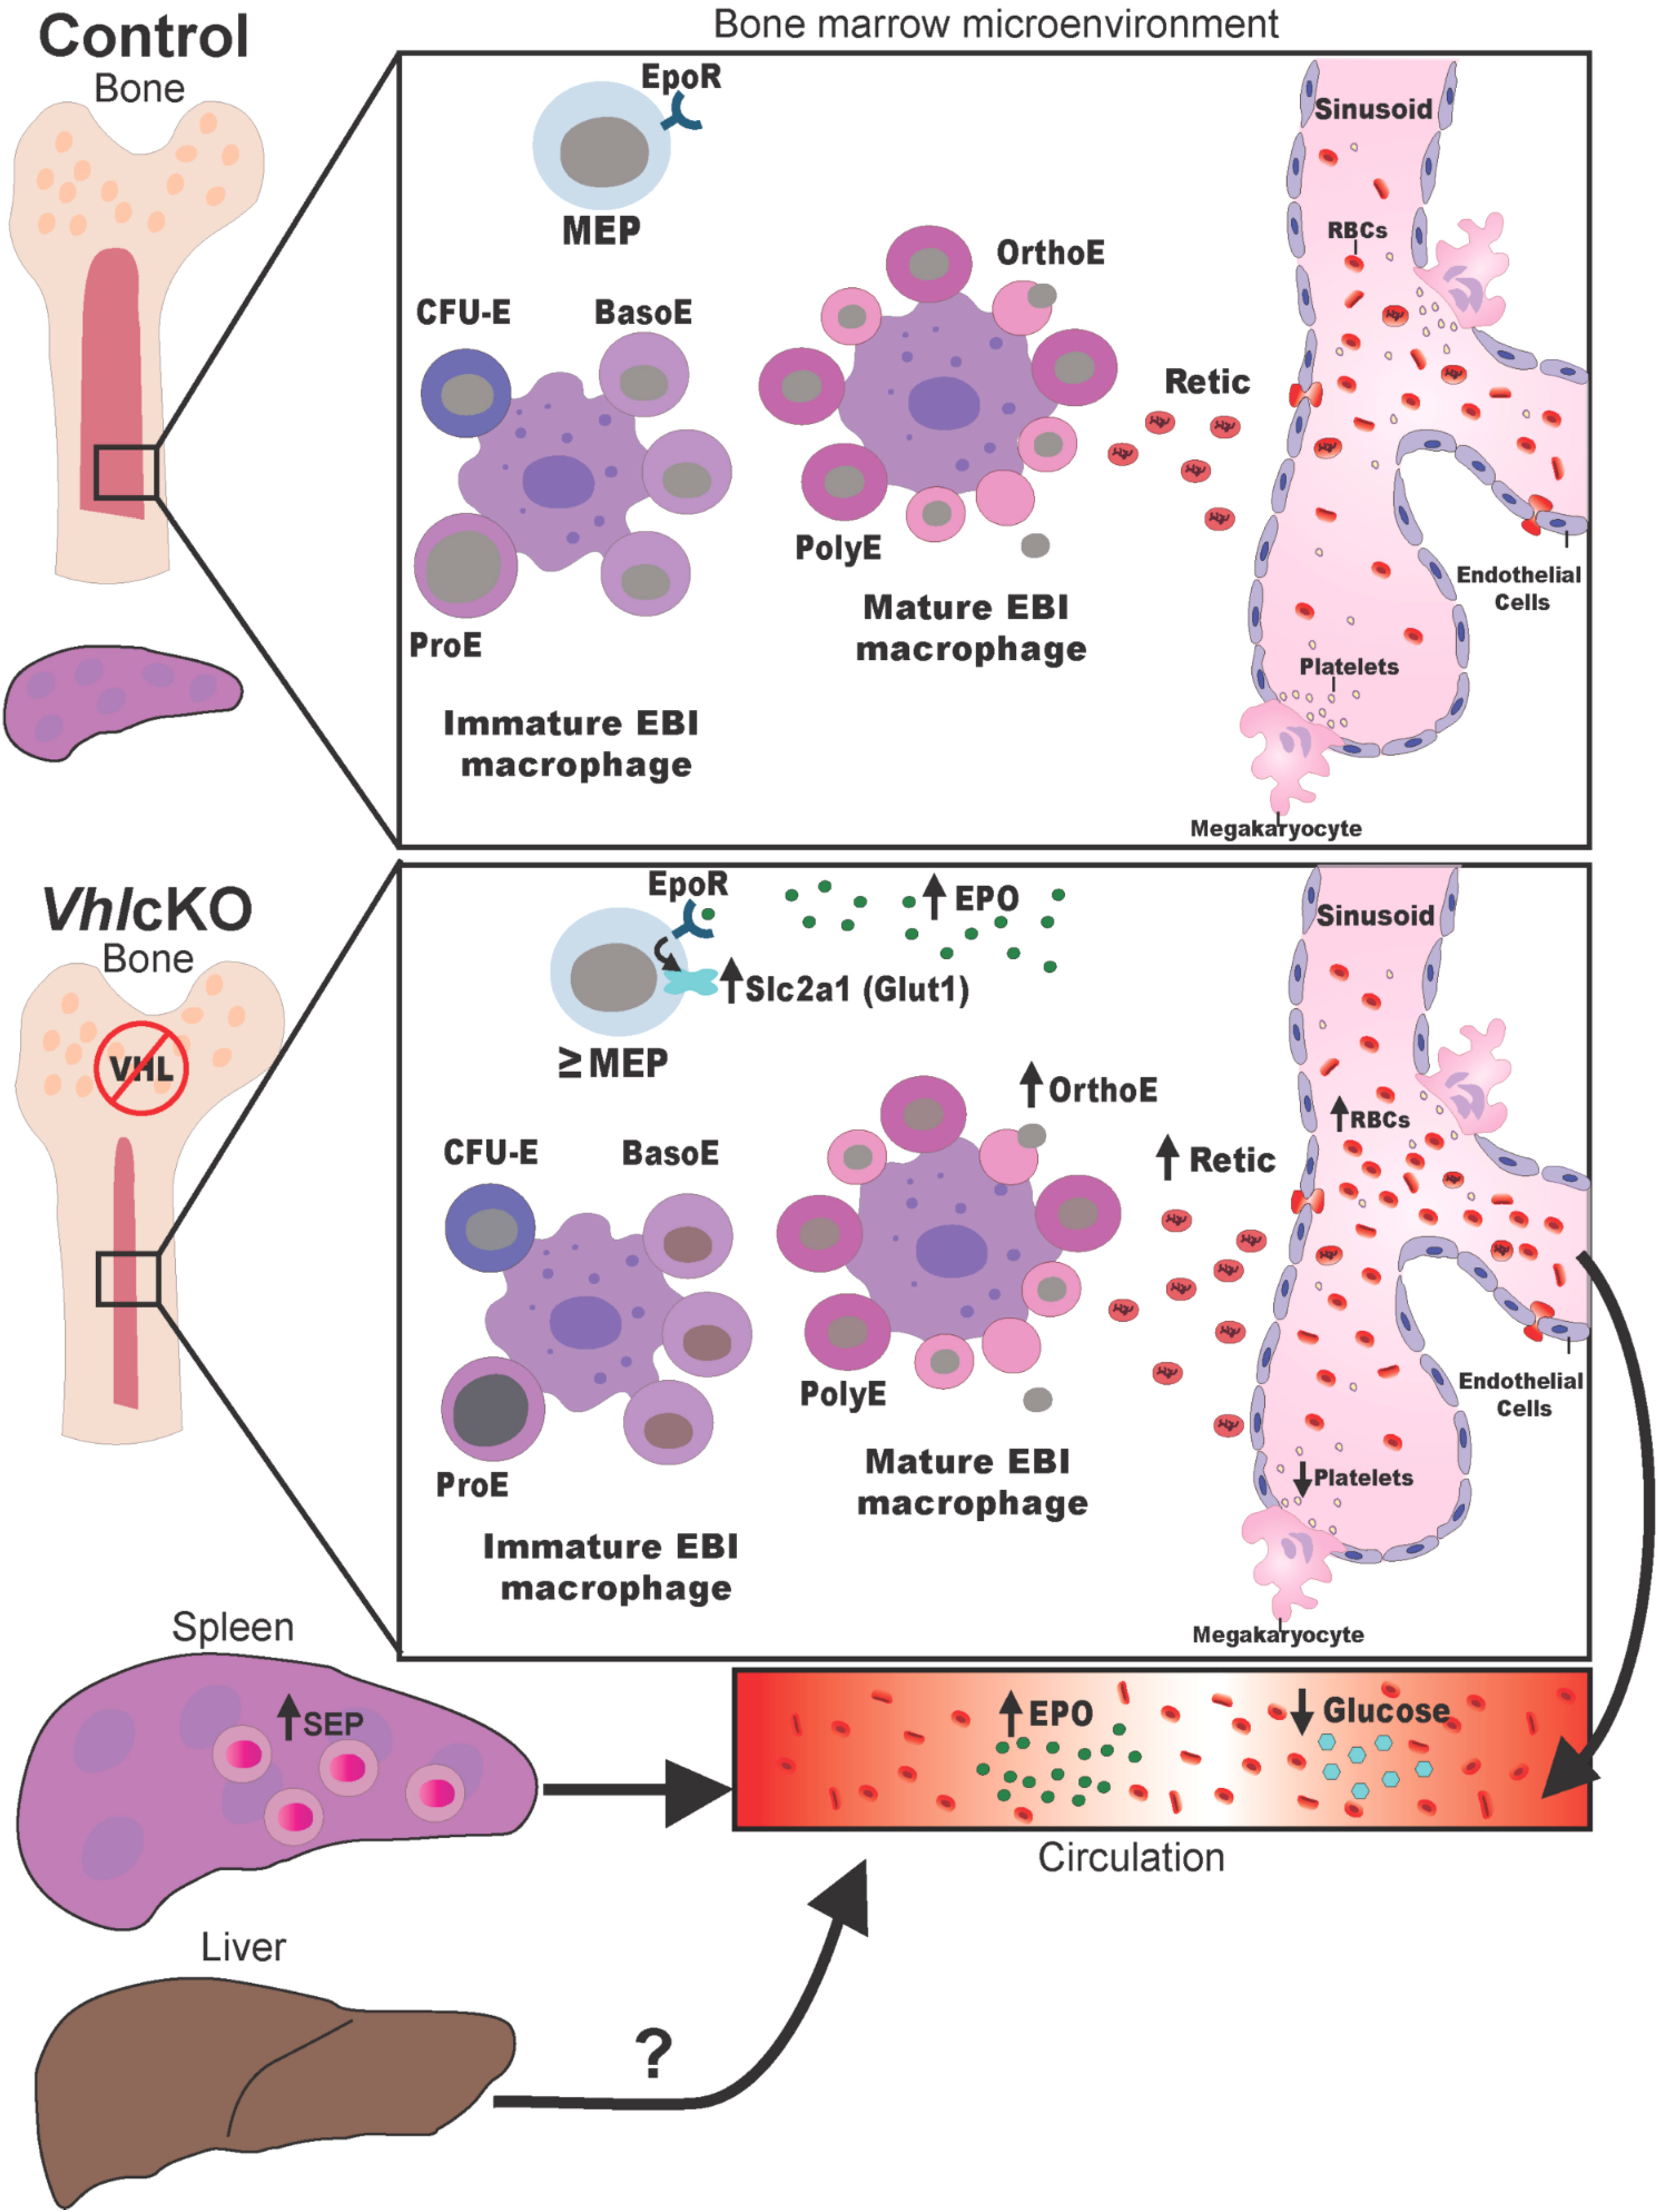
Figure 5 Working Model of how Vhl deletion in Dmp1-expressing cells contributes to alterations in the state of erythropoiesis. Schematic model describing the effects of BM microenvironmental changes in VhlcKO mice on erythropoiesis. See Discussion for details.
Our findings may have important implications for improving bone anabolic therapies for osteoporosis and may potentially lead to designing new therapeutics for individuals with anemia, such as those with frank diabetes mellitus and anemia of renal disease. Furthermore, these findings emphasize that when designing new treatments for osteoporosis by modulating HIF activity, investigators should be aware of unintended off-target effects in other tissues (45). Considering these factors may help in designing therapies targeting the HIF signaling pathway without dysregulating the skeletal and hematopoietic system (15, 46, 47) and causing off target metabolic, hormonal, and renal effects (48, 49).
Data availability statement
The datasets presented in this study can be found in online repositories. The names of the repository/repositories and accession number(s) can be found in the article/Supplementary Material.
Ethics statement
The animal study was approved by University of California, Merced Institutional Animal Care and Use Committee. The study was conducted in accordance with the local legislation and institutional requirements.
Author contributions
JE: Conceptualization, Data curation, Formal Analysis, Funding acquisition, Investigation, Methodology, Validation, Writing – original draft, Writing – review & editing. BC: Conceptualization, Data curation, Formal Analysis, Funding acquisition, Investigation, Methodology, Validation, Writing – original draft, Writing – review & editing. HT: Data curation, Writing – review & editing. CP: Data curation, Writing – review & editing. CD: Data curation, Formal Analysis, Methodology, Writing – review & editing. HP: Data curation, Writing – review & editing. AS: Formal Analysis, Methodology, Writing – original draft, Writing – review & editing. ST: Data curation, Formal Analysis, Methodology, Writing – review & editing. JM: Conceptualization, Data curation, Formal Analysis, Funding acquisition, Investigation, Methodology, Project administration, Supervision, Writing – original draft, Writing – review & editing.
Funding
The author(s) declare financial support was received for the research, authorship, and/or publication of this article. Research was supported mainly by NIH R15AI154245-01 (JM), F31AI154815-02 (BC), ORED Core Facilities Seed Grant (JE) and also in part by the DoD Research and Education Program for HBCU/MSI Instrumentation Grant (W911NF1910529) at the University of California, Merced. RNA-Seq was supported by the Genomics Research and Technology Hub Shared Resource of the Cancer Center Support Grant (P30CA-062203), the Single Cell Analysis Core shared resource of Complexity, Cooperation and Community in Cancer (U54CA217378), the Genomics-Bioinformatics Core of the Skin Biology Resource Based Center @ UCI (P30AR075047) at the University of California, Irvine and NIH shared instrumentation grants 1S10RR025496-01, 1S10OD010794-01, and 1S10OD021718-01. Part of the work was performed under the auspices of the US Department of Energy by Lawrence Livermore National Laboratory under contract no DE-AC52-07NA27344.
Acknowledgments
We thank the staff of the Department of Animal Research Services (DARS) at UC Merced (Katie Gallagher, Taylor Schaller, Vatthana Vongphakham, and Dr. Patrick Sharp) for excellent animal care. We acknowledge Dr. David Gravano in the Stem Cell Instrumentation Foundry for assistance in generating flow cytometry data. We also thank Dr. Katrina Hoyer, Dr. Anh Diep, and Christi Turner for access to and assistance with the Hemavet complete blood cell counting equipment. We thank Dr. Joel Spencer for his reading and comments on the final manuscript.
Conflict of interest
The authors declare that the research was conducted in the absence of any commercial or financial relationships that could be construed as a potential conflict of interest.
Publisher’s note
All claims expressed in this article are solely those of the authors and do not necessarily represent those of their affiliated organizations, or those of the publisher, the editors and the reviewers. Any product that may be evaluated in this article, or claim that may be made by its manufacturer, is not guaranteed or endorsed by the publisher.
Supplementary material
The Supplementary Material for this article can be found online at: https://www.frontiersin.org/articles/10.3389/frhem.2023.1276426/full#supplementary-material
References
1. Dzierzak E, Philipsen S. Erythropoiesis: Development and differentiation. Cold Spring Harbor Perspect Med (2013) 3:a011601–a011601. doi: 10.1101/cshperspect.a011601
2. Blanc L, De Gassart A, Géminard C, Bette-Bobillo P, Vidal M. Exosome release by reticulocytes–an integral part of the red blood cell differentiation system. Blood Cells Molecules Dis (2005) 35:21–6. doi: 10.1016/j.bcmd.2005.04.008
3. Da Costa L, Mohandas N, Sorette M, Grange M-J, Tchernia G, Cynober T. Temporal differences in membrane loss lead to distinct reticulocyte features in hereditary spherocytosis and in immune hemolytic anemia. Blood (2001) 98:2894–9. doi: 10.1182/blood.V98.10.2894
4. Paulson RF, Hariharan S, Little JA. Stress erythropoiesis: definitions and models for its study. Exp Hematol (2020) 89:43–54.e2. doi: 10.1016/j.exphem.2020.07.011
5. Lenox LE, Perry JM, Paulson RF. BMP4 and Madh5 regulate the erythroid response to acute anemia. Blood (2005) 105:2741–8. doi: 10.1182/blood-2004-02-0703
6. Lenox LE, Shi L, Hegde S, Paulson RF. Extramedullary erythropoiesis in the adult liver requires BMP-4/Smad5–dependent signaling. Exp Hematol (2009) 37:549–58. doi: 10.1016/j.exphem.2009.01.004
7. Paulson RF, Shi L, Wu D-C. Stress erythropoiesis: new signals and new stress progenitor cells. Curr Opin Hematol (2011) 18:139–45. doi: 10.1097/MOH.0b013e32834521c8
8. NIH Consensus Development Panel on Osteoporosis Prevention, Diagnosis, and Therapy. Osteoporosis prevention, diagnosis, and therapy. JAMA: J Am Med Assoc (2001) 285:785–95. doi: 10.1001/jama.285.6.785
9. Rankin EB, Wu C, Khatri R, Wilson TLS, Andersen R, Araldi E, et al. The HIF signaling pathway in osteoblasts directly modulates erythropoiesis through the production of EPO. Cell (2012) 149:63–74. doi: 10.1016/j.cell.2012.01.051
10. Dirckx N, Tower RJ, Mercken EM, Vangoitsenhoven R, Moreau-Triby C, Breugelmans T, et al. Vhl deletion in osteoblasts boosts cellular glycolysis and improves global glucose metabolism. J Clin Invest (2018) 128:1087–105. doi: 10.1172/JCI97794
11. Loots GG, Robling AG, Chang JC, Murugesh DK, Bajwa J, Carlisle C, et al. Vhl deficiency in osteocytes produces high bone mass and hematopoietic defects. Bone (2018) 116:307–14. doi: 10.1016/j.bone.2018.08.022
12. Chen K, Zhao J, Qiu M, Zhang L, Yang K, Chang L, et al. Osteocytic HIF-1α pathway manipulates bone micro-structure and remodeling via regulating osteocyte terminal differentiation. Front Cell Dev Biol (2022) 9:721561. doi: 10.3389/fcell.2021.721561
13. Li L, Li A, Zhu L, Gan L, Zuo L. Roxadustat promotes osteoblast differentiation and prevents estrogen deficiency-induced bone loss by stabilizing HIF-1α and activating the wnt/β-catenin signaling pathway. J Orthop Surg Res (2022) 17:286. doi: 10.1186/s13018-022-03162-w
14. Wang J, Zhao B, Che J, Shang P. Hypoxia pathway in osteoporosis: Laboratory data for clinical prospects. IJERPH (2023) 20:3129. doi: 10.3390/ijerph20043129
15. Chicana B, Abbasizadeh N, Burns C, Taglinao H, Spencer JA, Manilay JO. Deletion of vhl in Dmp1-expressing cells causes microenvironmental impairment of b cell lymphopoiesis. Front Immunol (2022) 13:780945. doi: 10.3389/fimmu.2022.780945
16. Lu Y, Xie Y, Zhang S, Dusevich V, Bonewald LF, Feng JQ. DMP1-targeted cre expression in odontoblasts and osteocytes. J Dent Res (2007) 86:320–5. doi: 10.1177/154405910708600404
17. Dallas SL, Xie Y, Shiflett LA, Ueki Y. Mouse cre models for the study of bone diseases. Curr Osteoporos Rep (2018) 16:466–77. doi: 10.1007/s11914-018-0455-7
18. Haase VH, Glickman JN, Socolovsky M, Jaenisch R. Vascular tumors in livers with targeted inactivation of the von hippel–lindau tumor suppressor. Proc Natl Acad Sci USA (2001) 98:1583–8. doi: 10.1073/pnas.98.4.1583
19. Andrews S. FastQC: A quality control tool for high throughput sequence data (2010). Available at: https://www.bioinformatics.babraham.ac.uk/projects/fastqc/.
20. Bolger AM, Lohse M, Usadel B. Trimmomatic: a flexible trimmer for illumina sequence data. Bioinformatics (2014) 30:2114–20. doi: 10.1093/bioinformatics/btu170
21. Dobin A, Gingeras TR. Mapping RNA-seq reads with STAR. CP Bioinf (2015) 51. doi: 10.1002/0471250953.bi1114s51
22. Liao Y, Smyth GK, Shi W. featureCounts: an efficient general purpose program for assigning sequence reads to genomic features. Bioinformatics (2014) 30:923–30. doi: 10.1093/bioinformatics/btt656
23. Law CW, Chen Y, Shi W, Smyth GK. Voom: precision weights unlock linear model analysis tools for RNA-seq read counts. Genome Biol (2014) 15:R29. doi: 10.1186/gb-2014-15-2-r29
24. Warnes G, Bolker B, Bonebakker L, Gentleman R, Huber W, Liaw A, et al. Gplots: Various r programming tools for plotting data (2022). Available at: https://CRAN.R-project.org/package=gplots.
25. R Core Team. R: A language and environment for statistical computing (2021). Available at: https://www.R-project.org.
26. Chen J, Bardes EE, Aronow BJ, Jegga AG. ToppGene suite for gene list enrichment analysis and candidate gene prioritization. Nucleic Acids Res (2009) 37:W305–11. doi: 10.1093/nar/gkp427
27. Faul F, Erdfelder E, Lang A-G, Buchner A. G*Power 3: A flexible statistical power analysis program for the social, behavioral, and biomedical sciences. Behav Res Methods (2007) 39:175–91. doi: 10.3758/BF03193146
28. O’Connell KE, Mikkola AM, Stepanek AM, Vernet A, Hall CD, Sun CC, et al. Practical murine hematopathology: a comparative review and implications for research. Comp Med (2015) 65:96–113.
29. Kaushansky K, Broudy VC, Grossmann A, Humes J, Lin N, Ren HP, et al. Thrombopoietin expands erythroid progenitors, increases red cell production, and enhances erythroid recovery after myelosuppressive therapy. J Clin Invest (1995) 96:1683–7. doi: 10.1172/JCI118210
30. Socolovsky M, Nam H, Fleming MD, Haase VH, Brugnara C, Lodish HF. Ineffective erythropoiesis in Stat5a(-/-)5b(-/-) mice due to decreased survival of early erythroblasts. Blood (2001) 98:3261–73. doi: 10.1182/blood.v98.12.3261
31. Liu Y, Pop R, Sadegh C, Brugnara C, Haase VH, Socolovsky M. Suppression of fas-FasL coexpression by erythropoietin mediates erythroblast expansion during the erythropoietic stress response in vivo. Blood (2006) 108:123–33. doi: 10.1182/blood-2005-11-4458
32. Socolovsky M. Molecular insights into stress erythropoiesis. Curr Opin Hematol (2007) 14:215–24. doi: 10.1097/MOH.0b013e3280de2bf1
33. Chen L, Wang J, Liu J, Wang H, Hillyer CD, Blanc L, et al. Dynamic changes in murine erythropoiesis from birth to adulthood: implications for the study of murine models of anemia. Blood Adv (2021) 5:16–25. doi: 10.1182/bloodadvances.2020003632
34. Yáñez A, Coetzee SG, Olsson A, Muench DE, Berman BP, Hazelett DJ, et al. Granulocyte-monocyte progenitors and monocyte-dendritic cell progenitors independently produce functionally distinct monocytes. Immunity (2017) 47:890–902.e4. doi: 10.1016/j.immuni.2017.10.021
35. Xiang J, Wu D-C, Chen Y, Paulson RF. In vitro culture of stress erythroid progenitors identifies distinct progenitor populations and analogous human progenitors. Blood (2015) 125:1803–12. doi: 10.1182/blood-2014-07-591453
36. Chen Y, Xiang J, Qian F, Diwakar BT, Ruan B, Hao S, et al. Epo receptor signaling in macrophages alters the splenic niche to promote erythroid differentiation. Blood (2020) 136:235–46. doi: 10.1182/blood.2019003480
37. Tóthová Z, Tomc J, Debeljak N, Solár P. STAT5 as a key protein of erythropoietin signalization. IJMS (2021) 22:7109. doi: 10.3390/ijms22137109
38. Montel-Hagen A, Sitbon M, Taylor N. Erythroid glucose transporters. Curr Opin Hematol (2009) 16:165–72. doi: 10.1097/MOH.0b013e328329905c
39. Rebolledo-Solleiro D, Fernández-Guasti A. Influence of sex and estrous cycle on blood glucose levels, body weight gain, and depressive-like behavior in streptozotocin-induced diabetic rats. Physiol Behav (2018) 194:560–7. doi: 10.1016/j.physbeh.2018.06.033
40. Tonelli M, Sacks F, Arnold M, Moye L, Davis B, Pfeffer M. Relation between red blood cell distribution width and cardiovascular event rate in people with coronary disease. Circulation (2008) 117:163–8. doi: 10.1161/CIRCULATIONAHA.107.727545
41. Gordeuk VR, Sergueeva AI, Miasnikova GY, Okhotin D, Voloshin Y, Choyke PL, et al. Congenital disorder of oxygen sensing: association of the homozygous chuvash polycythemia VHL mutation with thrombosis and vascular abnormalities but not tumors. Blood (2004) 103:3924–32. doi: 10.1182/blood-2003-07-2535
42. Sable CA, Aliyu ZY, Dham N, Nouraie M, Sachdev V, Sidenko S, et al. Pulmonary artery pressure and iron deficiency in patients with upregulation of hypoxia sensing due to homozygous VHLR200W mutation (Chuvash polycythemia). Haematologica (2012) 97:193–200. doi: 10.3324/haematol.2011.051839
43. Paulson RF, Ruan B, Hao S, Chen Y. Stress erythropoiesis is a key inflammatory response. Cells (2020) 9:634. doi: 10.3390/cells9030634
44. van Vuren AJ, Gaillard CAJM, Eisenga MF, van Wijk R, van Beers EJ. The EPO-FGF23 signaling pathway in erythroid progenitor cells: Opening a new area of research. Front Physiol (2019) 10:304. doi: 10.3389/fphys.2019.00304
45. Yan L, Colandrea VJ, Hale JJ. Prolyl hydroxylase domain-containing protein inhibitors as stabilizers of hypoxia-inducible factor: small molecule-based therapeutics for anemia. Expert Opin Ther Patents (2010) 20:1219–45. doi: 10.1517/13543776.2010.510836
46. Rauner M, Murray M, Thiele S, Watts D, Neumann D, Gabet Y, et al. Epo/EpoR signaling in osteoprogenitor cells is essential for bone homeostasis and epo-induced bone loss. Bone Res (2021) 9:42. doi: 10.1038/s41413-021-00157-x
47. Suresh S, Lee J, Noguchi CT. Erythropoietin signaling in osteoblasts is required for normal bone formation and for bone loss during erythropoietin-stimulated erythropoiesis. FASEB J (2020) 34:11685–97. doi: 10.1096/fj.202000888R
48. Lundby C, Olsen NV. Effects of recombinant human erythropoietin in normal humans: Physiological actions of erythropoietin. J Physiol (2011) 589:1265–71. doi: 10.1113/jphysiol.2010.195917
Keywords: bone homeostasis, extramedullary hematopoiesis, HIF signaling, myelopoiesis, polycythemia, red blood cells
Citation: Emery JM, Chicana B, Taglinao H, Ponce C, Donham C, Padmore H, Sebastian A, Trasti SL and Manilay JO (2024) Vhl deletion in Dmp1-expressing cells alters MEP metabolism and promotes stress erythropoiesis. Front. Hematol. 2:1276426. doi: 10.3389/frhem.2023.1276426
Received: 11 August 2023; Accepted: 30 November 2023;
Published: 08 January 2024.
Edited by:
Anna Rita Migliaccio, Campus Bio-Medico University, ItalyReviewed by:
Katarzyna Mleczko-Sanecka, International Institute of Molecular and Cell Biology in Warsaw (IIMCB), PolandAndres Garcia-Garcia, University of Basel, Switzerland
Copyright © 2024 Emery, Chicana, Taglinao, Ponce, Donham, Padmore, Sebastian, Trasti and Manilay. This is an open-access article distributed under the terms of the Creative Commons Attribution License (CC BY). The use, distribution or reproduction in other forums is permitted, provided the original author(s) and the copyright owner(s) are credited and that the original publication in this journal is cited, in accordance with accepted academic practice. No use, distribution or reproduction is permitted which does not comply with these terms.
*Correspondence: Jennifer O. Manilay, am1hbmlsYXlAdWNtZXJjZWQuZWR1
†These authors have contributed equally to this work and share first authorship