 Lynette Chee1,2,3*
 Rachel Koldej2,3
 Niko Thio4
 Mandy Ludford-Menting2
 Lucy Fox1,5
 Piers Blombery1,5David Ritchie1,2,3
- 1Department of Clinical Haematology, The Royal Melbourne Hospital and Peter MacCallum Cancer Centre, Melbourne, VIC, Australia
- 2Laboratory of ACRF Translational Research, Royal Melbourne Hospital, Melbourne, VIC, Australia
- 3Department of Medicine, Royal Melbourne Hospital, University of Melbourne, Melbourne, VIC, Australia
- 4Department of Bioinformatics, Division of Cancer Research, Peter MacCallum Cancer Centre, Melbourne, VIC, Australia
- 5Laboratory of Molecular Haematology, Peter MacCallum Cancer Centre, Melbourne, VIC, Australia
Aplastic anemia (AA) is a form of bone marrow failure (BMF) resulting in significant cytopenias and may progress with clonal evolution to myelodysplastic syndromes (MDS) and acute myeloid leukemia (AML). MicroRNA expression is dysregulated in MDS/AML, but there are limited studies on its role in the pathogenesis of AA. Using stored bone marrow (BM) samples (n=81) from 52 patients collected between 2006 and 2019, we demonstrate key differences in miRNA expression between AA patients at diagnosis and de novo MDS patients (n=21). The five most significantly upregulated miRNAs in MDS patients (downregulated in AA) were miR-130a-3p, miR-221-3p, miR-126-3p, miR-27b-3p, and miR-196b-5p (adjusted p<0.001). However, at the time of AA clonal progression to secondary MDS/AML, no significant miRNA-based differences were identified, suggesting that the underlying mechanistic pathways between AA progression to MDS/AML and de novo MDS are similar. At diagnosis, miR-127-3p, miR-1271-5p, miR-301b-5p, miR-3934-5p, and miR-4531 (adjusted p=0.081) were upregulated in those whose AA eventually progressed in comparison with those without eventual clonal progression. Longitudinal molecular mutational analysis of myeloid genes in AA patients with disease progression revealed the acquisition of new mutations, mostly at the time of MDS/AML progression, with four patients developing mutations prior to morphological MDS progression. In contrast, no myeloid gene mutations were detected at diagnosis or follow-up in AA patients with no clonal progression. Using KEGG pathway analysis derived from miRPathDBv2.0, cytokine–cytokine receptor interaction, TGF-β, MAP kinase, prolactin, Hippo, neurotrophin, and FOXO signaling pathways were enriched in AA patients with clonal progression to MDS/AML; these pathways were similarly enriched in the de novo MDS cohort. These studies highlight the differing miRNA expression profiles in AA and MDS, in AA clonal evolution to MDS/AML, and the potential interplay with myeloid gene mutations acquired at the time of disease progression.
Introduction
Aplastic anemia (AA) is a form of bone marrow failure (BMF) that presents with significant cytopenias mainly due to the immune-mediated targeting of the hematopoietic stem cells (HSCs) and/or progenitor cells that give rise to mature blood cells. It was found that clonal evolution to myelodysplastic syndromes (MDS) and acute myeloid leukemia (AML) occurred in 5%–15% of AA patients over a period of 5 years to 11.3 years (1, 2). With improved supportive care measures, treatment with immunosuppressive agents, and allogeneic stem cell transplantation, the overall survival of severe AA patients has improved over the last few decades (3); however, the outcomes of those who progress to MDS/AML remain inferior, and this is likely to be related to the acquisition of poor-risk karyotypic abnormalities such as monosomy 7, which is associated with lower post-SCT survival rates in post-AA MDS patients (4).
MicroRNAs are short non-coding RNA molecules that can regulate gene expression post transcription and have been demonstrated to regulate T-cell activation in AA. The downregulation of miR-126-3p, miR-145-5p, miR-223-3p, and miR-199a-5p was observed in the CD4+ and CD8+ T cells of AA patients, with restoration of normal expression after successful immunosuppressive treatment (IST) (5). MYC and PIK3R2 were upregulated and shown to be targets of miR-145-5p and 126-3p, respectively; the knockdown of these two miRNAs resulted in proliferation and increased IFN-γ and granzyme B production in both CD4+ and CD8+ T cells. In the plasma, three circulating miRNA biomarkers were found to be dysregulated in AA: miR-150-5p and miR-146b-5p were elevated, whereas miR-1 was decreased. These miRNAs could accurately predict the diagnosis of AA, and, similar to the findings of an earlier study, miRNA levels normalized following IST at 6 months, with miR-150-5p levels significantly reduced in responders but not in non-responders (6). Exosomal microRNAs have also been studied in AA in which levels of miR-143-3p, miR-324-3p, miR-1180-3p, miR-126-5p, and miR-382-5p were significantly decreased after 6 months of IST; in particular, miR-126-5p correlated strongly with response to IST, and a higher level of it at diagnosis was associated with inferior progression-free survival (7).
However, studies of miRNA expression in AA are limited and further investigation is required to understand the role of miRNAs in modulating immunity, treatment responses, and disease progression in AA. In this study, we aimed to identify miRNA biomarkers in the bone marrow (BM) cells of AA patients that correlate with clinical outcomes, predict clinical outcomes at diagnosis, and compare the miRNA profiles derived from AA patients with de novo MDS patients due to the association of clonal progression to MDS/AML in AA patients. In addition, we assessed the longitudinal molecular mutation patterns of patients who developed clonal progression to MDS/AML.
Materials and methods
A total of 86 AA samples from 54 patients were obtained from 2006 to 2019 from stored RMH/PMCC bone marrow (BM) samples collected as standard-of-care procedures at the Cancer Collaborative Biobank, Princess Alexandra Hospital (QLD, Australia). Five samples were excluded from analysis; four due to their low RNA concentration, and one because it had been collected from a post-allogeneic stem cell transplant patient. Of the remaining 81 samples from 52 patients, 33 were collected at diagnosis and 48 at follow-up (39 were collected post treatment and nine were collected from untreated patients). For the miRNA analysis, there were nine patients with paired samples available from diagnosis and follow-up, 24 patients with diagnostic samples only, and 19 patients with follow-up samples only (Supplementary Figure 1A). In the comparator group of de novo untreated MDS patients, 21 samples were studied—the MDS subtypes were as follows: RCMD (n=5), RAEB-1 (n=8), RAEB-2 (n=3), RARS-T (n=1), MDS-U (n=2), and hypoplastic MDS (n=2). There were no healthy normal controls used. This research project was approved by the Melbourne Health Human Research and Ethics Committee (HREC/16/MH/234, project number: 2016.207).
RNA extraction
Total RNA, including miRNA, was isolated from biobanked Trizol-treated bone marrow samples using the Direct-zol DNA/RNA mini Prepz kit (Zymo, Irvine, CA, USA) in accordance with the manufacturer’s instructions. Quantification of the RNA was conducted using an Agilent 2200 TapeStation System (Santa Clara, CA, USA).
miRNA profiling
Samples were analyzed using the NanoString nCounter system with the Human miRNA expression assay v3 (Nanostring, Seattle, WA, USA) in accordance with the manufacturer’s instructions. Raw data were analyzed using NanoString nSolver software (Nanostring, Seattle, WA, USA).
Molecular mutational analysis
Library preparation was carried out utilizing the Fluidigm Access Array System (Fluidigm, San Francisco, CA, USA). PCR amplification occurred within an Access Array 48.48 integrated fluidic circuit (IFC). The DNA input was 50 ng. PCR products were indexed using sample-specific barcode primers (Fluidigm) as per the manufacturer’s instructions. Samples were pooled and the resulting library was purified using the Agencourt AMPure XP system (Beckman Coulter). Quantification was carried out using a 2200 TapeStation instrument (Agilent Technologies, Santa Clara, CA, USA). Libraries were denatured and diluted as per the manufacturer’s instructions. We conducted 150 base pair paired-end sequencing on an Illumina MiSeq sequencer (Illumina, San Diego, CA, USA) using MiSeq v2 chemistry. Sequencing data were de-multiplexed and FASTQ files were generated using CASSAVA v1.8.2. Reads were assembled and aligned using Primal (a non-global alignment method based on a modified Smith–Waterman algorithm developed in house), and variants were called using VarScan 2 and Canary. Variant call files were analyzed for variants within the exons of 26 genes as detailed in Supplementary Table 1. The assay sensitivity was specific to each individual variant and at the target read depth (× 1,000) the assay had a general detection limit of 5%–10%.
Statistical analysis
There were 798 miRNAs (excluding quality control probes) in the NanoString nCounter Human v3 panel included in the downstream analysis. Quality control probes (ligation, mRNA housekeeping genes, positive and negative spike-ins) were used for assessing the sample quality during preprocessing. The NormFinder (8) and RUV-III (9) methods were used to find unvarying miRNAs, which showed high expression and low variation in samples, to serve as "housekeeping" genes for normalization, namely, hsa-miR-302d-3p and hsa-miR-548ar-5p. Batch normalization was then conducted using the RUV-III method, using control replicate samples on each run. The normalized expression data are shown in Supplementary Table 2. After the data had been normalized, differential expression analysis was conducted using the Limma method (10), and p-values were adjusted for multiple hypothesis testing using the Benjamini–Hochberg procedure.
The hierarchical clustering based on the miRNA expression of all samples included in the downstream analysis is shown in an expression heatmap (Figure 1). Each individual sample is marked in the columns and the miRNA probe is marked in the rows. Potential confounding variables such as age, gender, and cell type (blast cell percentages) were assessed visually using MDS plots and hierarchical clustering of the miRNA expression levels. We did not demonstrate any clustering of these variables, indicating that the potential confounding bias of these variables toward the miRNA panel was marginal (Supplementary Figures 2A–C).
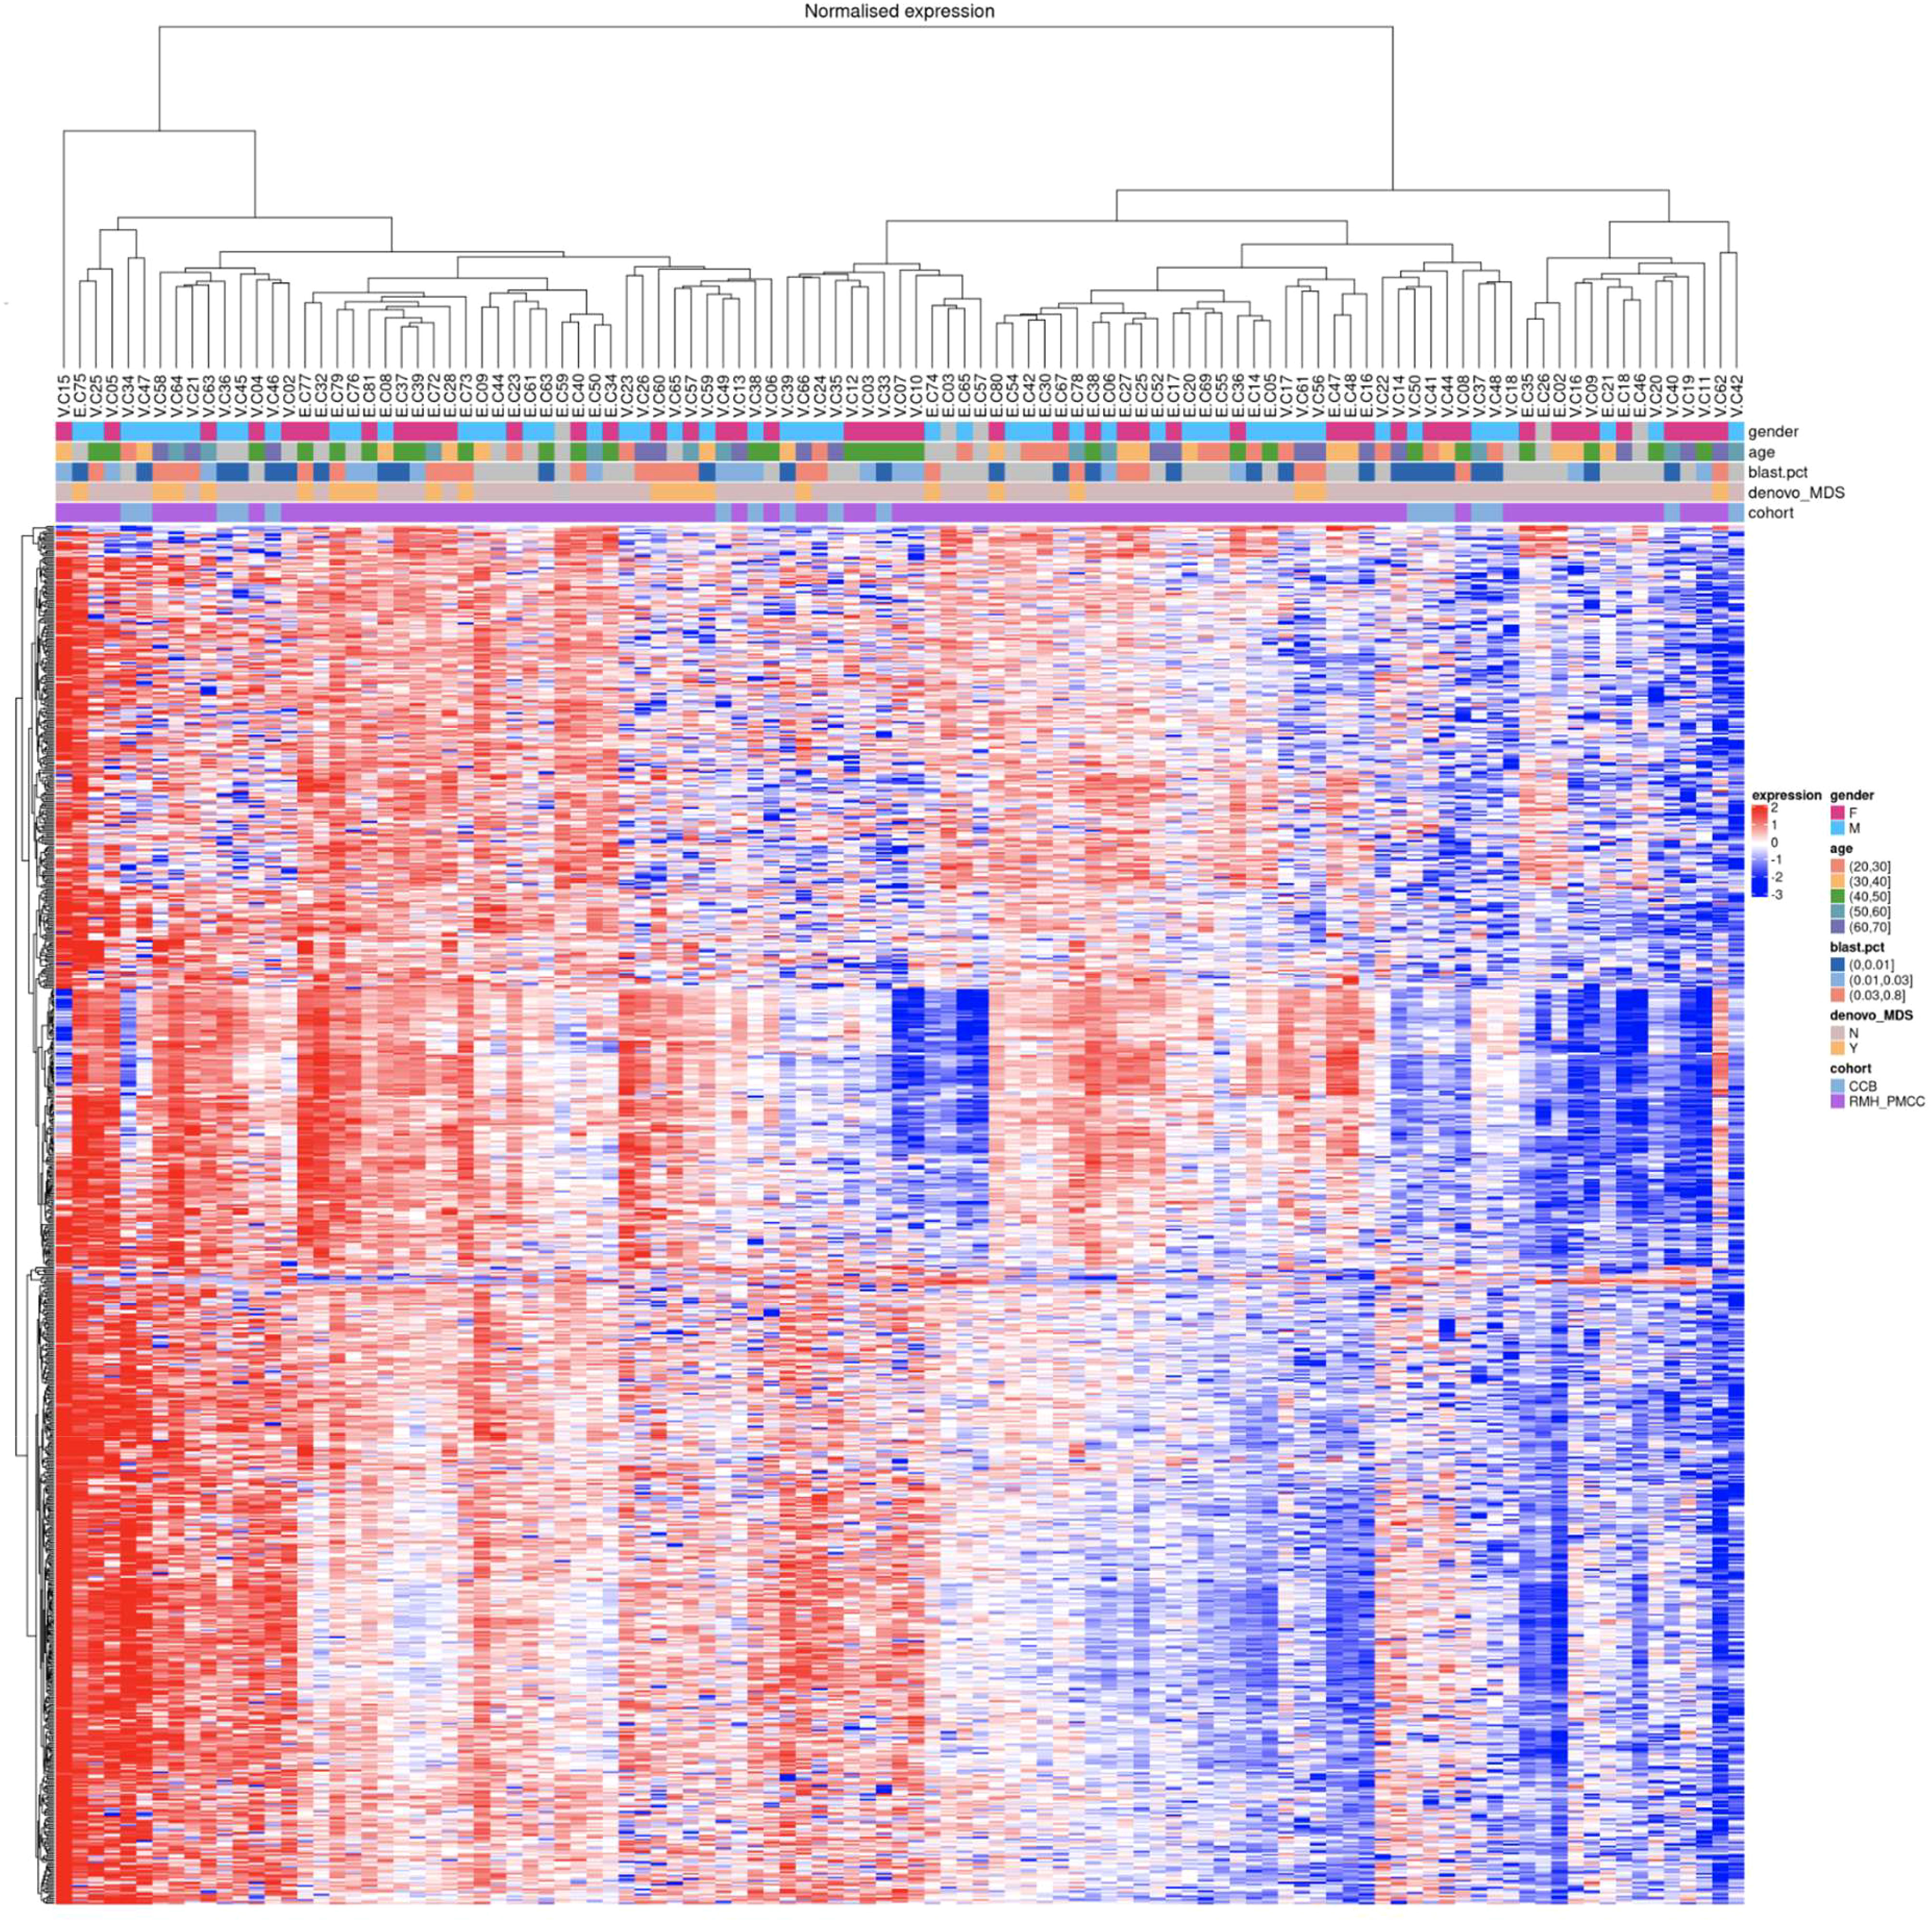
Figure 1 Hierarchical clustering of miRNA expression from all samples. At the top of the figure, coloured boxes indicate gender (F vs M), age and blast percentage (categorical values) showing no clustering for these variables.
Results
The clinical and disease characteristics of the AA patients are summarized in Table 1. The median age at diagnosis for the AA patients was 39 years (range 8–87 years). Among the 52 patients, 40 received treatment for AA; mostly with anti-thymocyte globulin (ATG) and cyclosporine (CSA) (n=25), CSA ± prednisolone (n=12) and ATG alone (n=3). Three patients also received eltrombopag during the course of their disease, and one patient received eculizumab. There were 18 responders (six complete responders (CR) and 12 partial responses (PR)), whereas 20 patients did not achieve a response (no response (NR)) (two patients’ response status unknown). Eleven (21%) patients had PNH clones detected at the time of diagnosis assessed by flow cytometric analysis, and 21 other patients did not (20 patients with unknown PNH status). During follow-up, 16 patients were tested, of whom four developed PNH clones later in their disease course (25 other patients were not tested, therefore their PNH status is unknown).
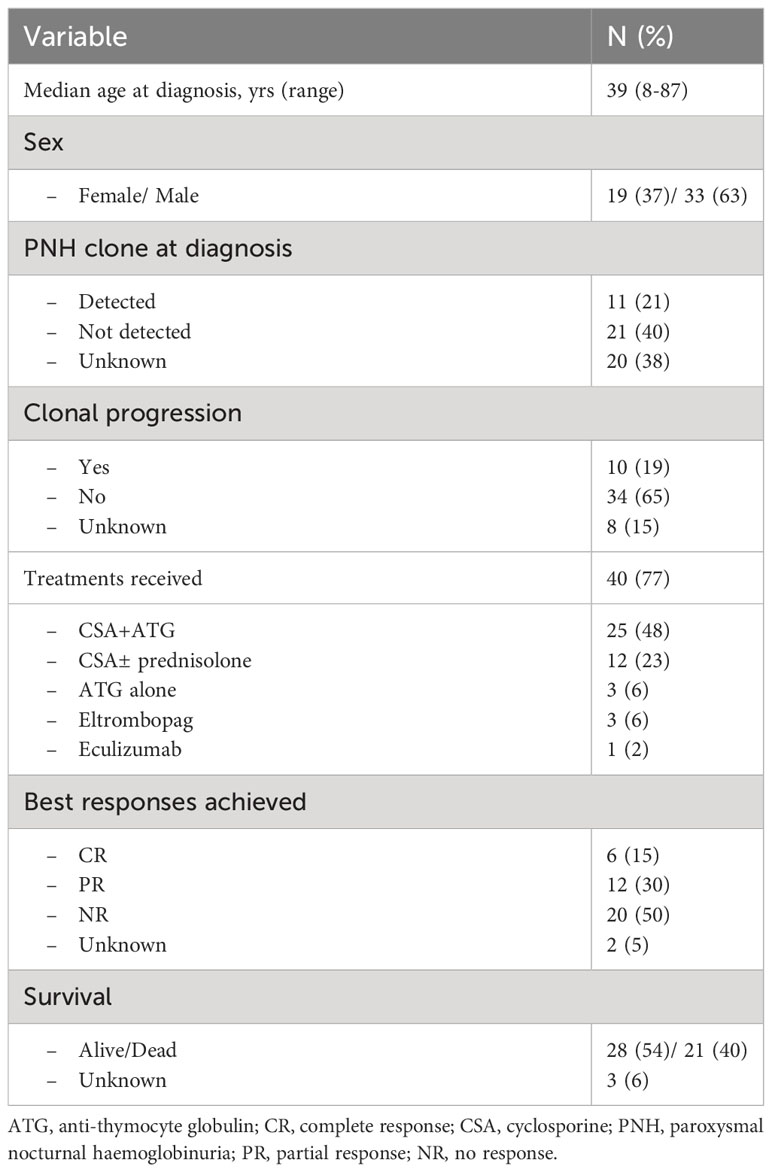
Table 1 Patient and disease characteristics.
Ten patients (19%) had clonal progression to myelodysplasia (MDS)/acute myeloid leukemia (AML) and/or additional cytogenetic aberrations/somatic mutation(s) develop during their disease course, whereas 34 (65%) patients did not (eight patients with status unknown). At the time of analysis, 28 (54%) patients were still alive and 21 (40%) were dead (survival status unknown for three patients). Thirteen (25%) patients proceeded to allogeneic stem cell transplantation; censoring for patients at time of allograft, 20 (51%) of the 39 patients were still alive, whereas 17 (44%) had died (survival status unknown in two patients).
MicroRNA expression
(1) MiR-130a-3p is significantly upregulated in de novo MDS patents (n=21) vs. AA patients at diagnosis (n=32)
Comparing patients with AA at diagnosis with de novo MDS patients, there were 153 differentially upregulated (p<0.05) miRNAs in MDS patients (downregulated in AA patients) with the six most significantly upregulated miRNAs being miR-130a-3p, miR-221-3p, miR-126-3p, miR-27b-3p, miR-196b-5p, and let-7e-5p (adjusted p<0.001) (Figure 2A and Table 2). The significant genes regulated by these miRNAs are shown in Figure 2B.
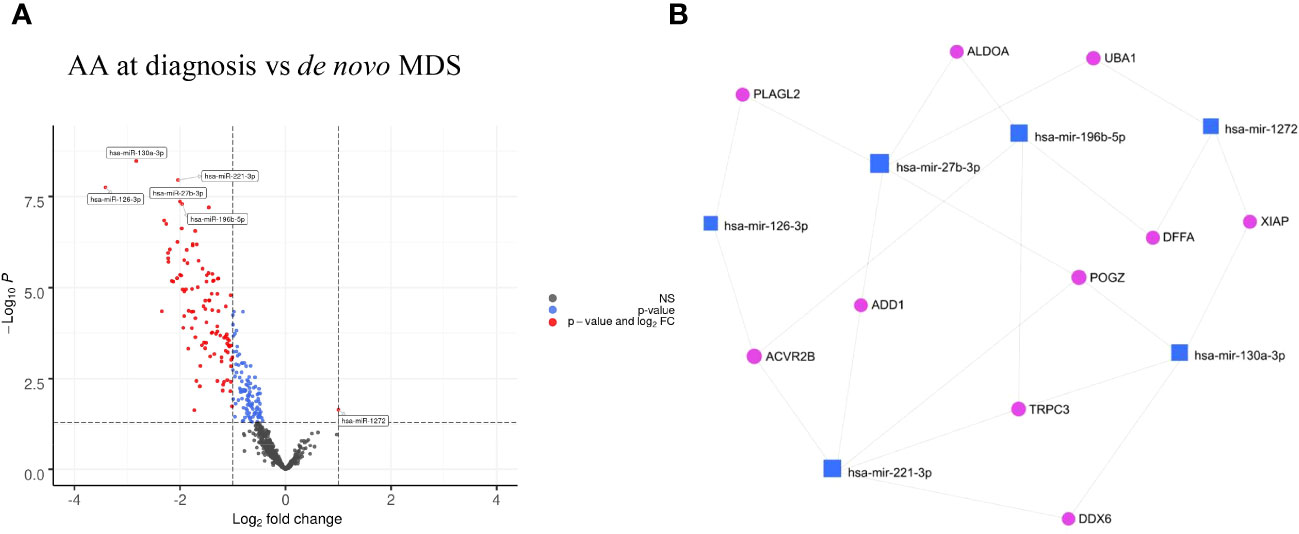
Figure 2 (A) Volcano plots of AA at diagnosis vs de novo MDS showing differential miRNA expression in AA vs MDS patients. (B) Gene interaction network of AA at diagnosis vs de novo MDS using minimum network graph from mirnet.ca.
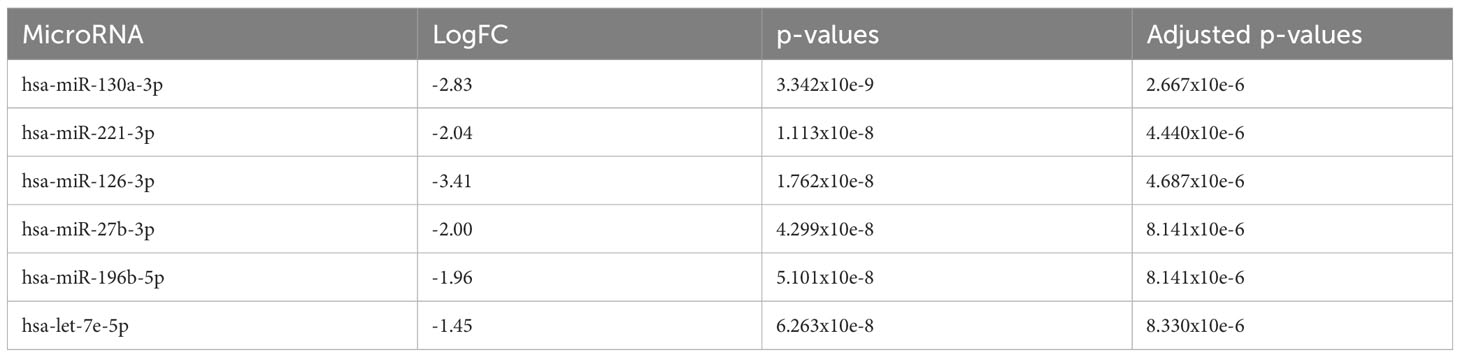
Table 2 The 6 most significantly downregulated (overexpressed in de novo MDS) miRNA in comparison to AA at diagnosis.
Using the miRPathDBv2.0 database (11), KEGG pathway analysis was conducted to identify the pathways that were significantly enriched (Supplementary Figure 3A). Focusing on the pathways in which the largest number of miRNAs were involved, this was expectedly microRNAs and pathways in cancer, specific cancers (including colorectal, bladder, and pancreatic cancers) and infections (including hepatitis B and HTLV-1 infection). Notably, the signaling pathways that were significantly enriched were the HIF-1, FOXO, cell cycle, p53, and PI3K-AKT pathways.
(2) AA patients with progression (n=13) and de novo MDS patients (n=21) demonstrate similar miRNA profiles
There were no significant differentially expressed miRNAs identified, which was consistent with similarities in the miRNA profiles between AA patients with progression and de novo MDS patients (Figure 3A).
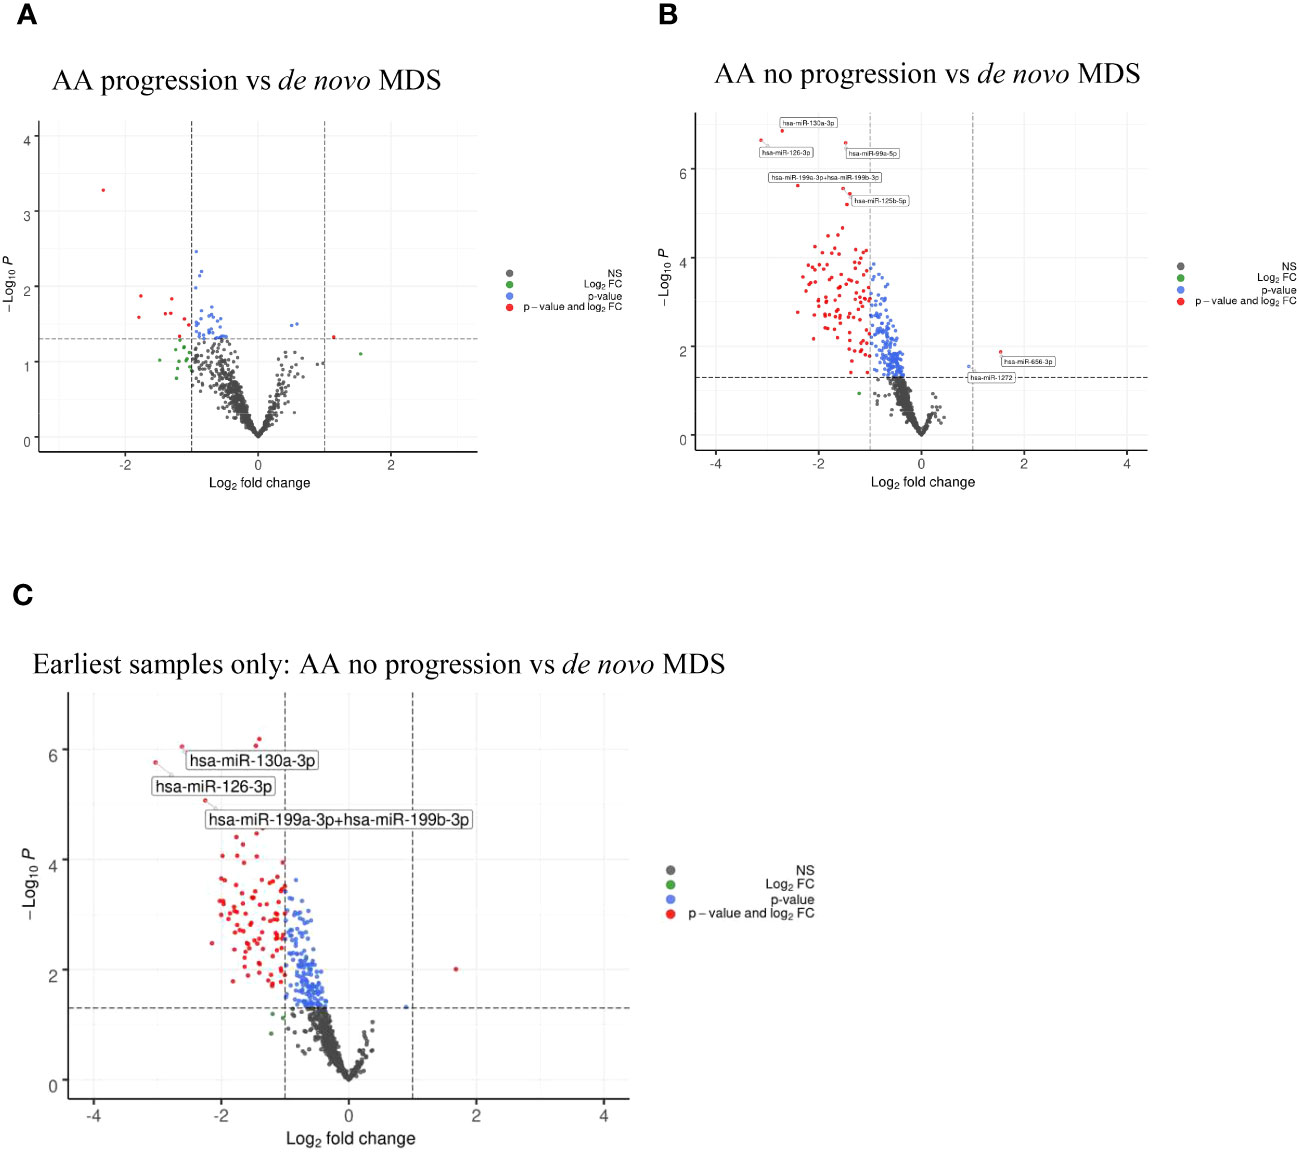
Figure 3 (A) Volcano plots of AA progression vs de novo MDS showing no significant differential miRNA expression. (B) Volcano plots of AA no progression vs de novo MDS showing differential miRNA expression between the two cohorts. (C) Volcano plots of AA no progression vs de novo MDS showing differential miRNA expression taking the earliest samples only from patients with multiple follow-up samples.
When comparing AA patients with no progression (n=37) with de novo MDS patients (n=21), we found that there were 164 miRNAs that were differentially upregulated (adjusted p<0.05) in MDS patients (downregulated in AA patients with no progression) with miR-130a-3p, miR-126-3p, miR-99a-5p, miR-199a-3p+199b-3p, and miR-125b-5p (adjusted p<0.001) being the top five upregulated miRNAs in the de novo MDS cohort (Figure 3B and Table 3A). Taking the earliest samples only from patients with multiple follow-up samples, a similar miRNA profile was observed (Figure 3C and Table 3B).
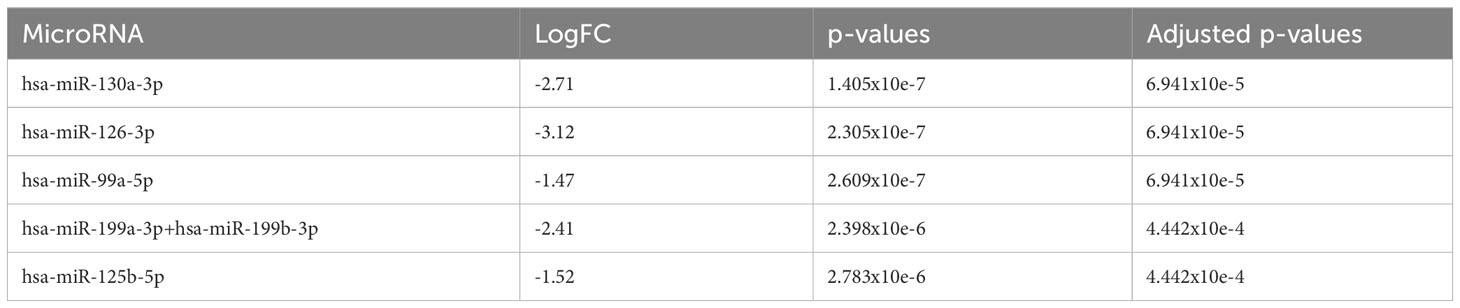
Table 3A The 5 most significantly downregulated (overexpressed in de novo MDS) miRNA in comparison to AA no progression.
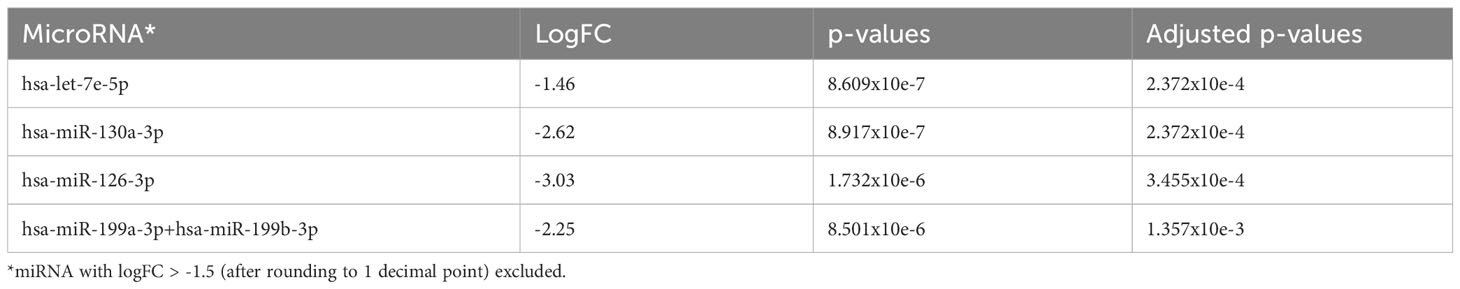
Table 3B The 4 most significantly downregulated (overexpressed in de novo MDS) miRNA in comparison to AA no progression taking earliest follow-up samples only.
(3) MiR-130a-3p was significantly upregulated in AA patients with progression (treated + untreated) (n=13) vs. AA patients with no progression (treated + untreated) (n=37)
Comparing AA patients who progressed with clonal evolution to MDS/AML with those patients who had no progression, we found that miR-130a-3p (adjusted p=0.05), miR-181c-5p, and miR-125b-5p (adjusted p=0.0896) were upregulated in patients who had disease progression (Figure 4A and Table 4A). However, no downregulated miRNAs were identified.
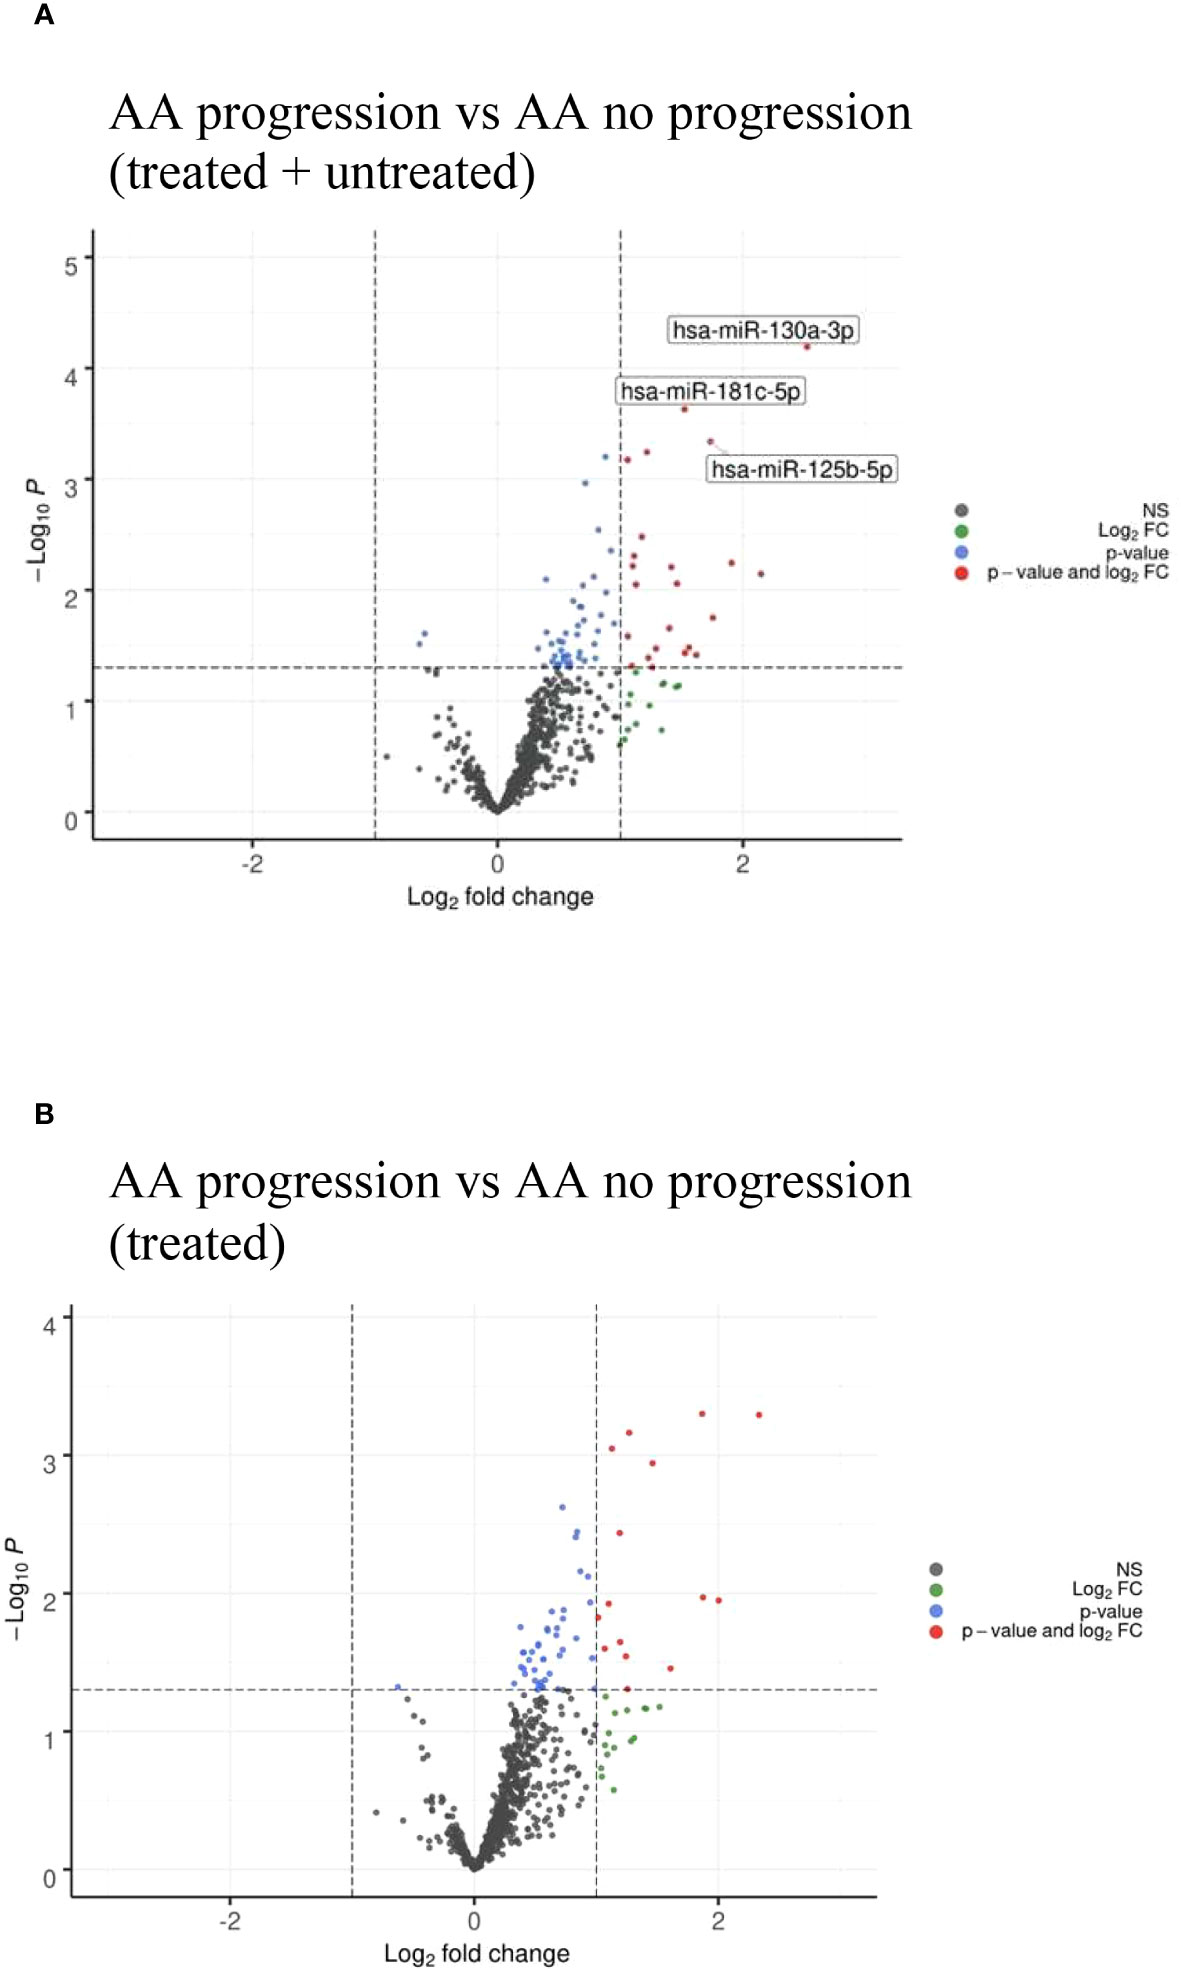
Figure 4 (A) Volcano plots of AA progression to MDS/AML vs no AA progression showing differential miRNA expression between the two cohorts. (B) Volcano plots of AA progression to MDS/AML vs no AA progression in treated patients only showing similar miRNA profile to (A).

Table 4A The 3 most significantly upregulated (overexpressed in AA progression) miRNA in comparison to AA no progression (Treated + Untreated).
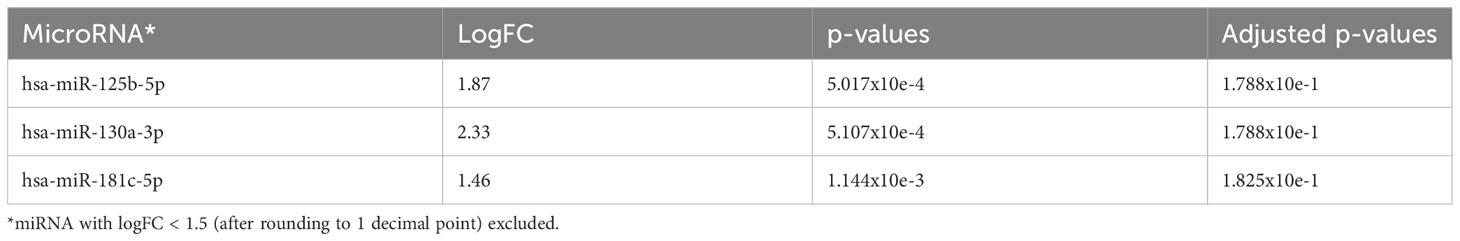
Table 4B The 3 most significantly upregulated (overexpressed in AA progression) miRNA in comparison to AA no progression (Treated).
The KEGG pathway analysis derived from the miRPathDBv2.0 database is shown in Supplementary Figure 3B. We observed that miR-125b-5p had the highest enrichment across multiple pathways, including HIF-1 signaling and other specific cancer pathways, including those for colorectal and endometrial cancers, and that it was also enriched across other infection, JAK-STAT, prolactin-1, mTOR, Erb-B, and VEG signaling pathways.
When comparing treated AA patients only, a similarly upregulated miRNA profile was identified in patients who had disease progression (Figure 4B and Table 4B). The untreated patients could not be analyzed separately as none of them had progression.
(4) MiR-130a-3p was significantly upregulated at the time of AA progression (n=13) vs. AA at diagnosis (n=32)
Comparing AA samples at diagnosis with those at the time of clonal progression, we found that there were no miRNAs that were significantly upregulated at diagnosis. However, in AA patients, miR-130a-3p (adjusted p=0.0043), miR-181c-5p (adjusted p=0.012), miR-27b-3p, and miR-221-3p (adjusted p=0.0273) were downregulated at diagnosis and upregulated at the time of disease progression (Figure 5A and Table 5A). Taking only the earliest follow-up samples for patients for whom multiple samples were available and conducting the same comparison, a similar miRNA profile was observed (Figure 5B and Table 5B). Notably, miR-130a-3p, miR-27b-3p, and miR-221-3p were also significantly upregulated in the de novo MDS cohort in comparison with the AA cohort at diagnosis (comparison number 1), which is consistent with observations from comparison number 2, in which there were no significant differentially expressed miRNAs among AA patients and de novo MDS patients at the time of disease progression.
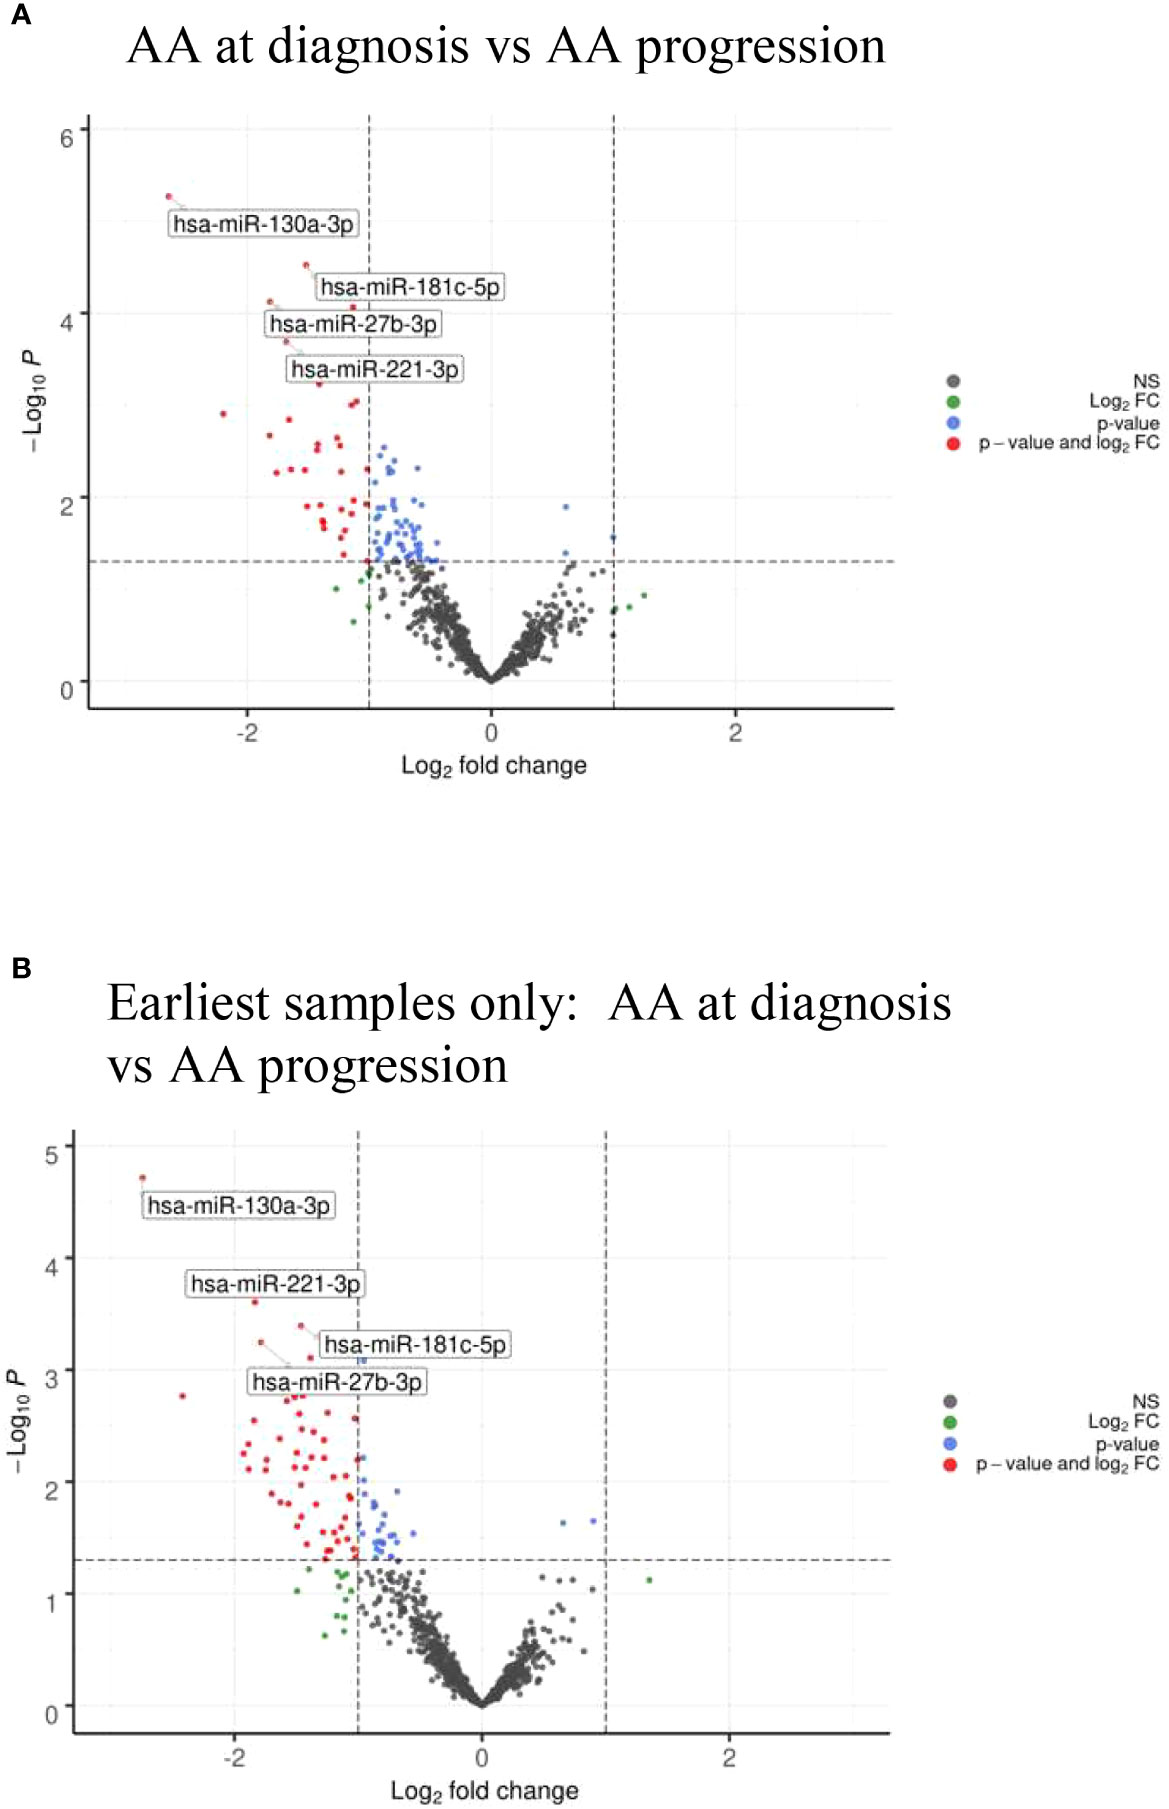
Figure 5 (A) Volcano plots of AA diagnosis vs at time of AA clonal progression showing differential miRNA expression between the two cohorts. (B) Volcano plots of AA diagnosis vs at time of AA clonal progression showing differential miRNA expression taking the earliest samples only from patients with multiple follow-up samples.

Table 5A The 4 most significantly downregulated (overexpressed in AA progression) miRNA in comparison to AA at diagnosis.
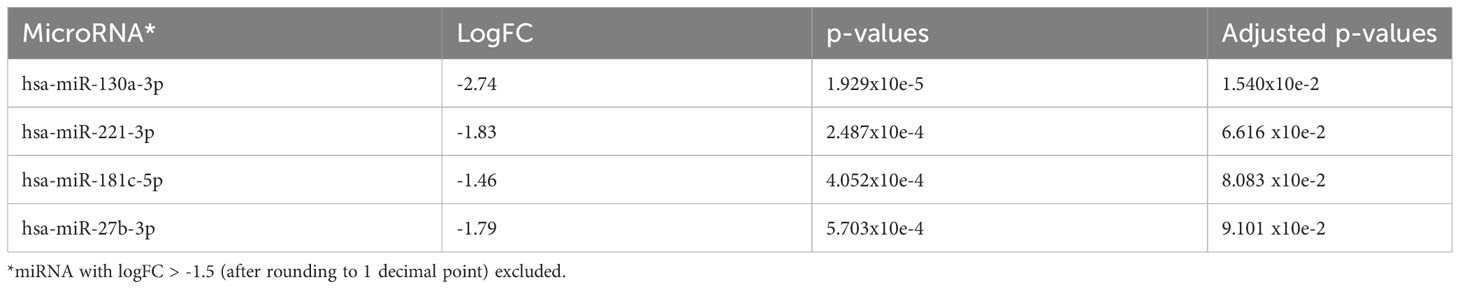
Table 5B The 4 most significantly downregulated (overexpressed in AA progression) miRNA in comparison to AA at diagnosis taking earliest follow-up samples only.
The KEGG pathway analysis derived from the miRPathDBv2.0 database is shown in Supplementary Figure 3C. Similar pathways were identified as enriched by significant miRNAs, with greater enrichment in the cytokine–cytokine receptor interaction, TGF-beta, MAP kinase, prolactin, Hippo, neurotrophin, and FOXO signaling pathways.
When comparing the AAs at diagnosis with those in follow-up samples in which there was no clonal progression (including all treated and untreated samples), we found that there were no significant differentially expressed miRNAs.
(5) At diagnosis timepoint for AA: there were no significant differentially expressed miRNAs that were predictive of clonal progression (n=3) vs. no progression (n=21)
To assess if there were any predictive miRNAs at diagnosis which may portend an inferior outcome with clonal progression to MDS/AML, the miRNA profiles at diagnosis were compared between patients who eventually progressed with those who did not. MiR-127-3p, miR-1271-5p, miR-301b-5p, miR-3934-5p, and miR-4531 (adjusted p=0.081) were upregulated in those whose AA eventually progressed, whereas miR-142-3p, miR-223-3p (adjusted p=0.081), and miR-15a-5p (adjusted p=0.095) were downregulated (Figure 6 and Table 6).
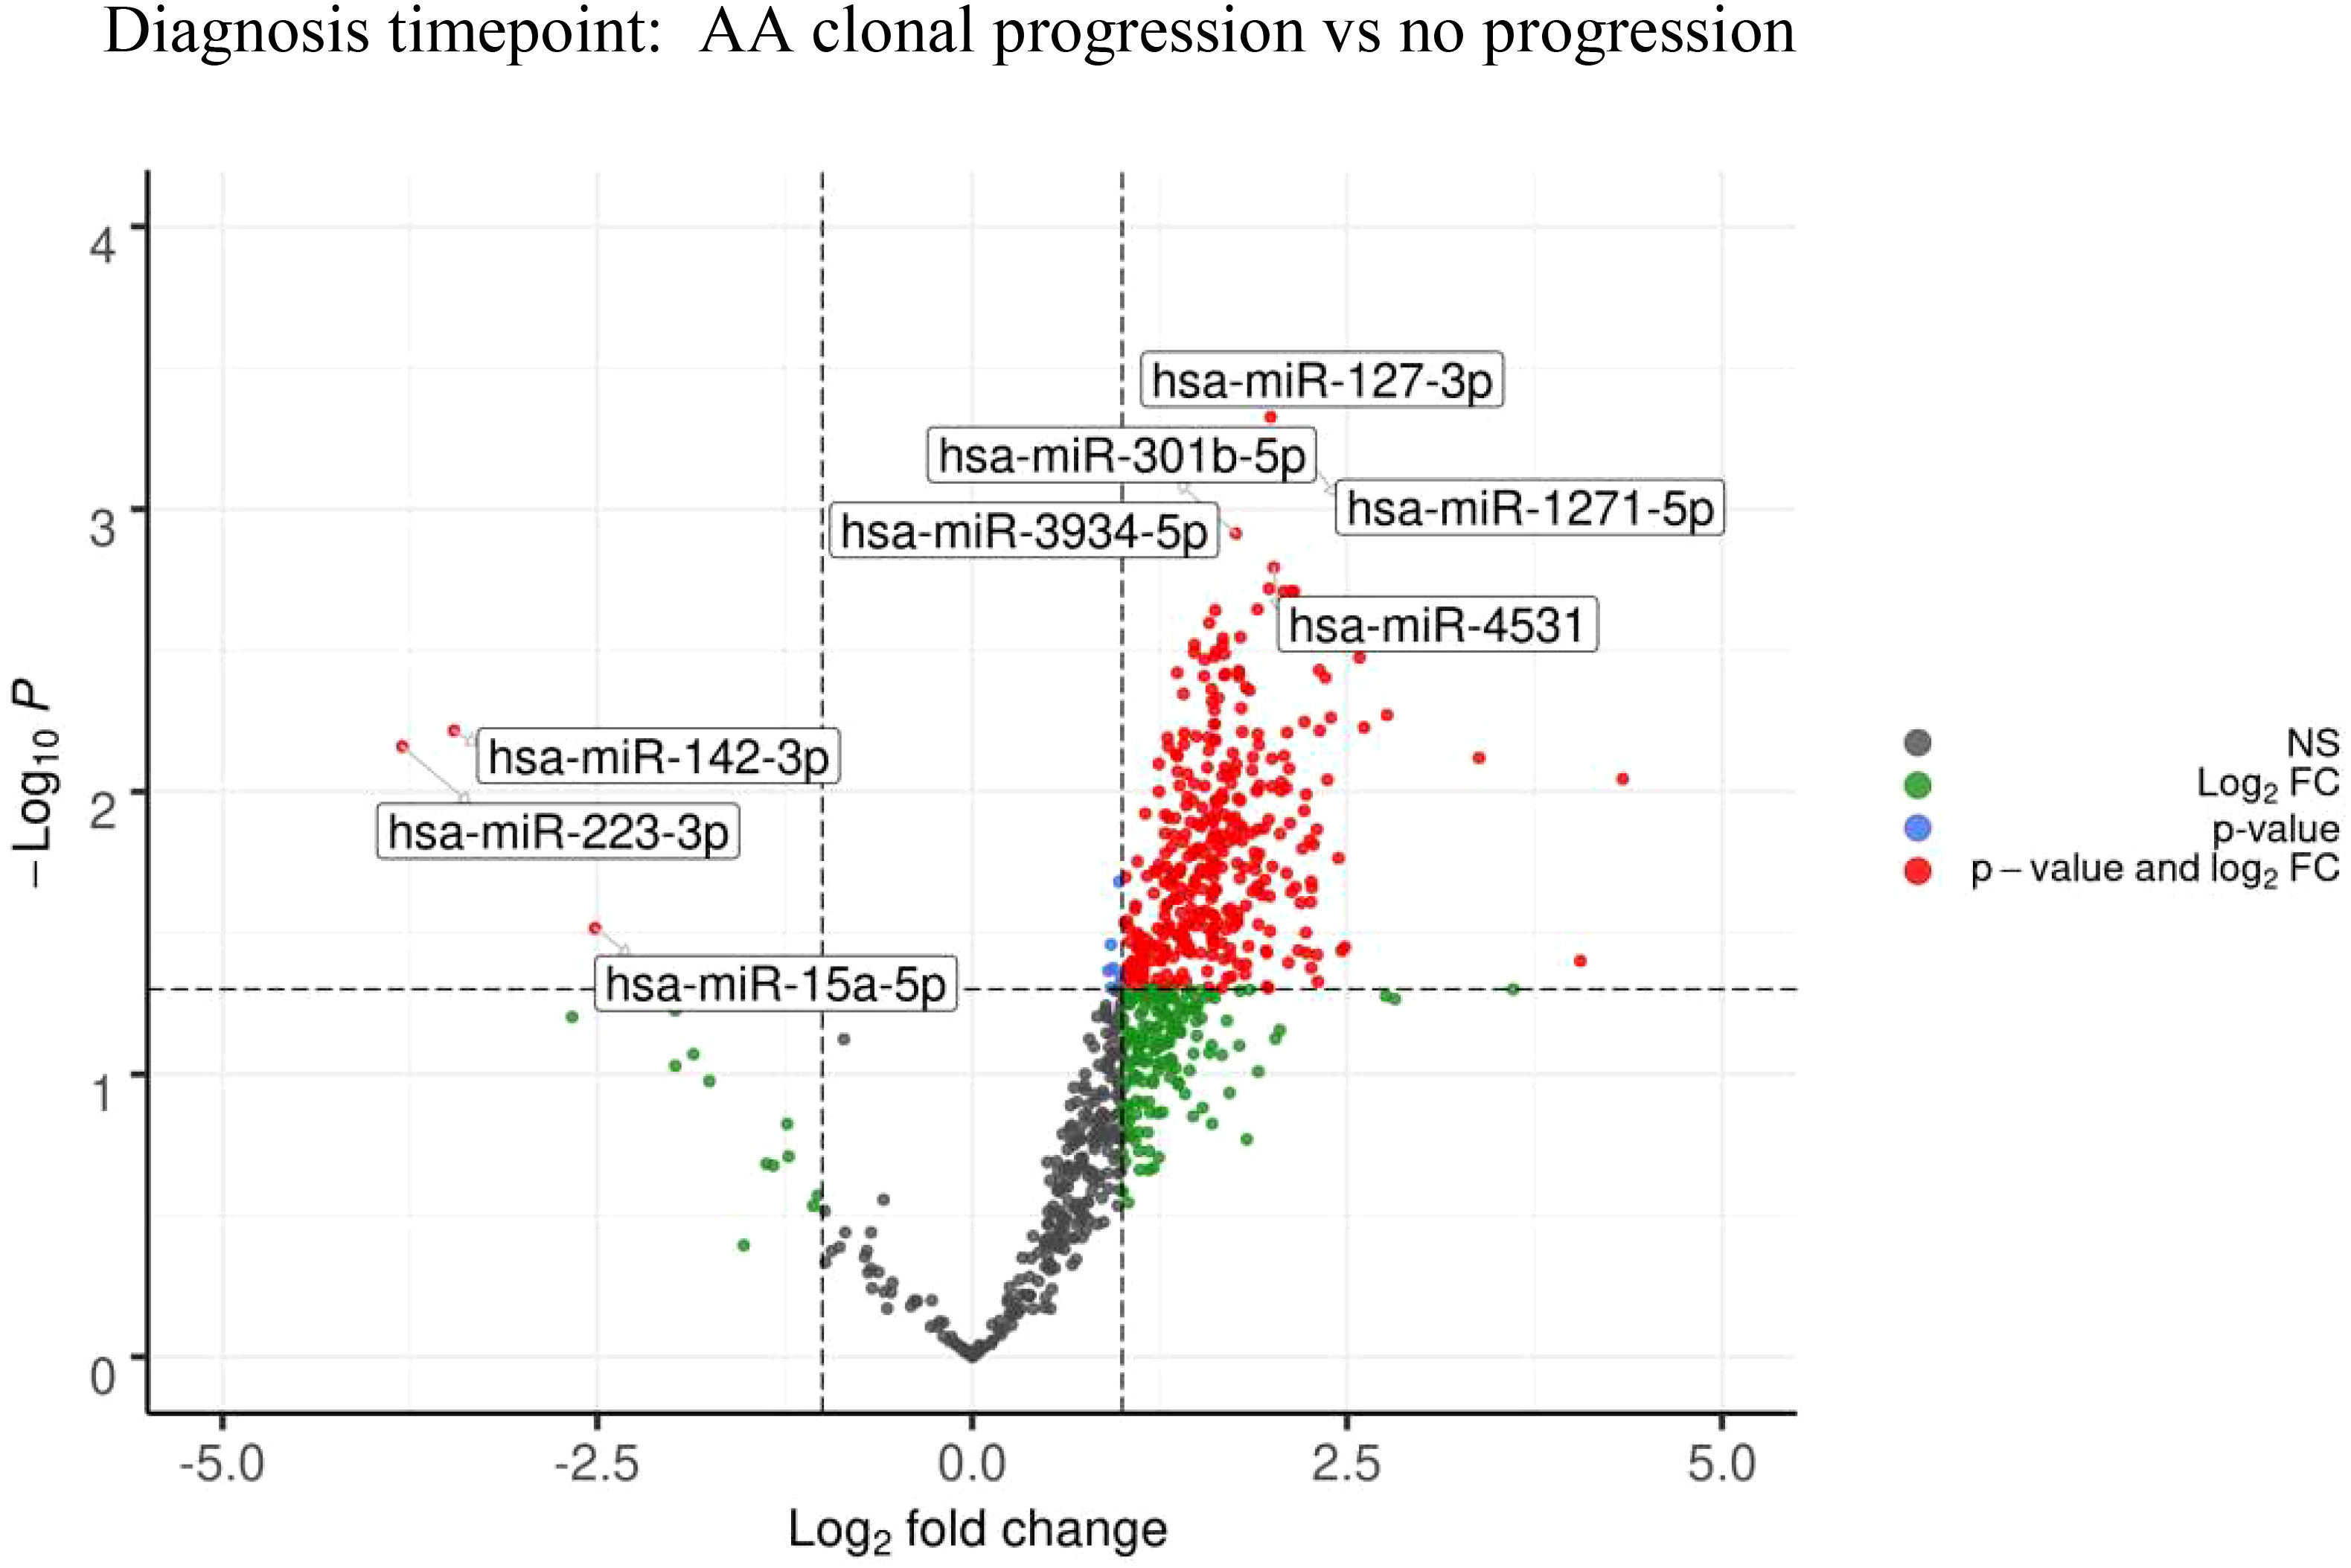
Figure 6 Volcano plots at diagnosis timepoint for AA: Clonal progression vs no progression showing differential miRNA expression between the two cohorts.
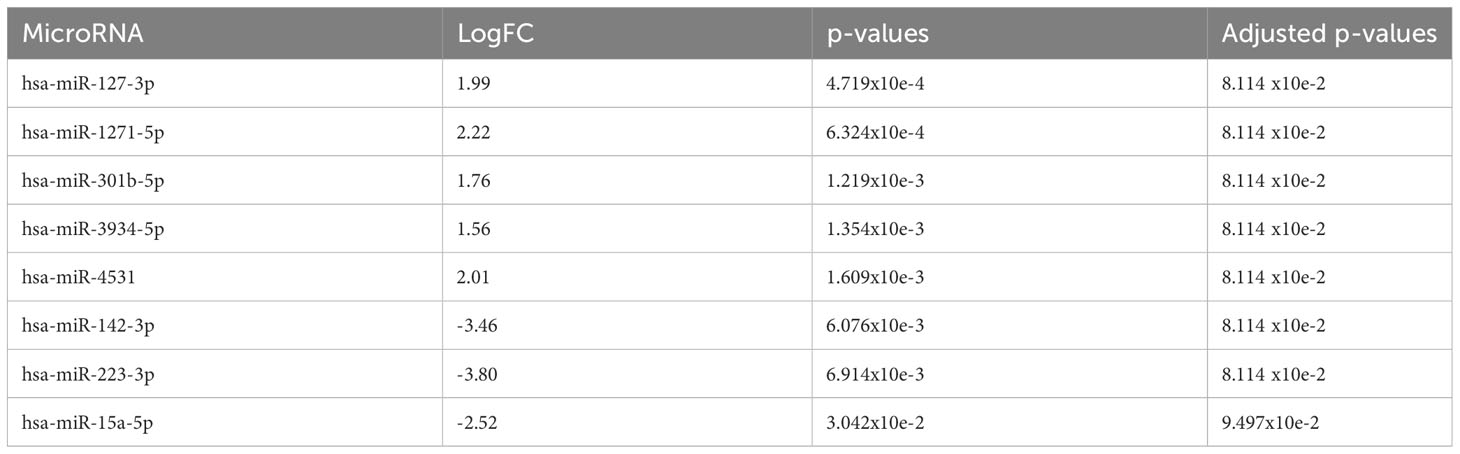
Table 6 At diagnosis timepoint for AA: The 5 most significantly upregulated (overexpressed in AA progression) miRNA and 3 most significantly downregulated (overexpressed in no AA progression) miRNA.
The KEGG pathway analysis derived from miRPathDBv2.0 for the upregulated miRNAs at diagnosis for patients who eventually developed AA progression to MDS/AML vs. those who did not is shown in Supplementary Figure 3D. The upregulated miRNAs at diagnosis enriched the pathways associated with infection, cell cycle, cancer, and transcriptional signaling, as described in the earlier comparisons.
Other comparisons, including samples taken from AA patients at diagnosis vs. post treatment follow-up samples (treated vs. untreated), diagnosis vs. response achieved (PR or NR), and post-treatment samples (PR vs. NR), yielded no significant differentially expressed miRNAs. There were also no significant miRNA-based differences observed between patients who presented with PNH at AA diagnosis and those who did not, or between those who presented with PNH at AA diagnosis and those who developed PNH later in the disease course. We could not identify any miRNA-based differences between those who achieved responses (CR/PR) vs. no response. As the treatments were relatively homogeneous—CSA+ATG (n=25), CSA ± prednisolone (n=12), ATG alone (n=3), and eltrombopag (n=3)—with overlapping agents used between treatment groups, we could not stratify treatment type against miRNA expression.
At diagnosis, there were no miRNAs that were predictive of survival outcomes (excluding in patients who eventually proceeded to allograft) and no miRNAs that were predictive of responses (CR/PR vs. NR). Similarly, post treatment, there were no miRNAs predictive of responses (CR/PR vs. NR) or any that were predictive of changing responses from NR to NR vs. from NR to PR, or of progression to MDS/AML (samples analyzed prior to progression) vs. no progression.
(6) Longitudinal molecular mutational analysis of myeloid genes in AA patients shows acquisition of new mutations in the majority of patients at time of disease progression
Out of 10 patients with AA clonal progression, mutational analysis had been carried out for nine at some point during their disease course. Twenty-six samples were available for analysis (two PB, 24 BM), with three patients had paired diagnostic and follow-up samples (Supplementary Figure 1B). The genes assessed in the myeloid NGS panel are listed in Supplementary Table 1.
The median time from AA diagnosis to clonal progression ± development of MDS/AML was 4.3 years (range 0.7 years to 17.5 years, n=9, n=1 date of progression unknown). The progression of mutations for each of these patients is shown in Table 7 and Supplementary Figure 4. None of the three patients with paired diagnostic and follow-up samples had any detectable mutations at diagnosis. Two patients had no mutations detected throughout their disease course, including at the time of AA progression (patient number 3), whereas the other (patient number 9) had a persistent marked reduction in megakaryopoiesis and mild dyserythropoiesis, but this was still insufficient for a morphological MDS diagnosis to be made. Patient number 2 acquired a RUNX1 mutation post treatment for AA with eltrombopag (they had received CSA and ATG prior), and then acquired a ASXL1 mutation at the time of MDS progression.
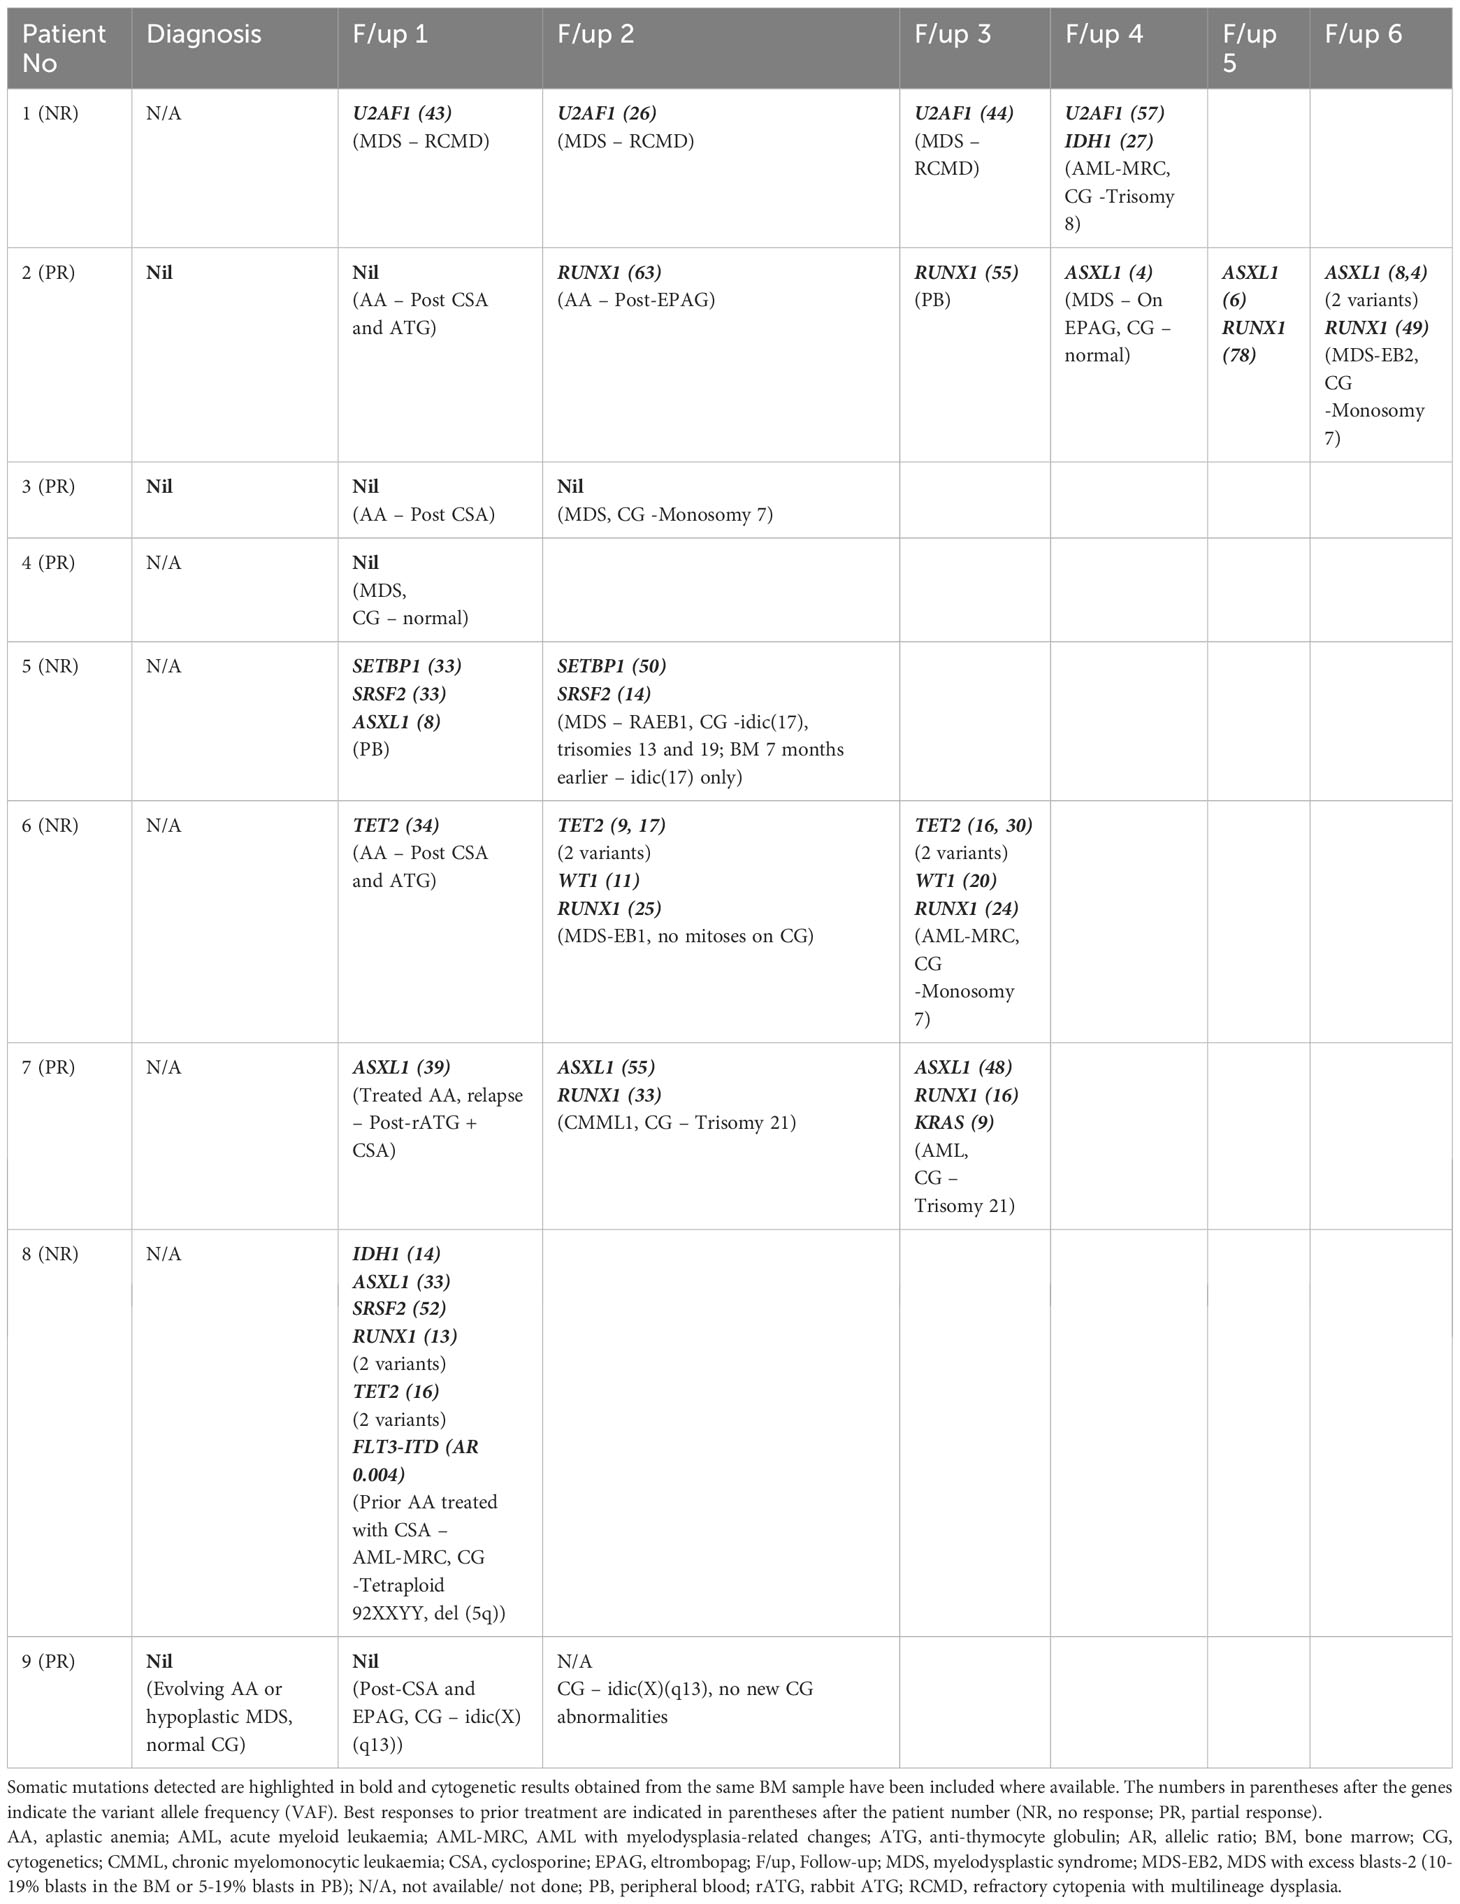
Table 7 Molecular mutational analysis of myeloid genes in AA patients with clonal progression ± development of MDS/AML where indicated in the respective follow-up samples.
Among the other patients in whom mutational analysis was not available at the time of initial diagnosis, the somatic mutations detected at the time of MDS progression were U2AF1 (n=1), SETBP1 (n=1), SRSF2 (n=1), WT1 (n=1), and RUNX1 (n=2); three patients progressed to AML from MDS and two acquired new mutations, namely IDH1 (n=1) and KRAS (n=1), whereas the other patient had persistent TET2 (two variants), WT1, and RUNX1 previously detected at the time of MDS progression. Patient number 8 had prior treatment with CSA for AA prior to presentation in AML progression with six somatic mutations detected—IDH1, ASXL1, SRSF2, RUNX1 (two variants), TET2 (two variants), and FLT3-ITD (no diagnostic sample was available for analysis).
For the AA patients with no clonal progression to MDS/AML, myeloid molecular mutational analysis was conducted on five patients, with eight samples (7 BM, 1 PB) analyzed. No mutations were detected at diagnosis (n=3) or at follow-up (n=5).
Discussion
In this study, we observed key differences between the BM miRNA profiles of AA patients at diagnosis and those of de novo MDS patients, but at the time of AA clonal progression to MDS/AML, we could not differentiate between the miRNA profile patterns secondary MDS/AML arising after AA diagnosis and de novo MDS. This suggests that the mechanistic pathways involved in AA progression mirror those that drive de novo MDS pathogenesis. Consistent with this hypothesis, the top five differentially expressed miRNAs that were upregulated in the de novo MDS cohort were miR-130a-3p, miR-221-3p, miR-126-3p, miR-27b-3p, and miR-196b-5p, and when comparing the miRNA profiles of AA patients at diagnosis with those at the time of clonal progression to MDS/AML, we observed similar upregulation of three miRNAs—miR-130a-3p, miR-27b-3p, and miR-221-3p. The other upregulated miRNA of significance from the latter comparison was miR-181c-5p.
MiR-130a-3p was the most significantly upregulated miRNA in de novo MDS and AA patients with progression in comparison with AA patients at diagnosis, and also in AA patients with progression vs. AA patients with no progression. In a study on granulopoiesis, it was noted that miR-130a-3p was overexpressed in myeloblasts and promyelocytes in comparison with mature neutrophils, with the modulation of the TGF-β signaling pathway proposed as a mechanism for the inhibition of granulocytic precursor proliferation (12). MiR-130a-3p has been shown to promote the proliferation, migration, and invasion of cervical cancer cells through the transfection of cell lines, whereas treatment with a miR-130a-3p inhibitor reversed these effects, mainly through increased apoptosis (13, 14). RUNX3 and DLL1 were identified as potential target genes of miR-130a-3p. However, in triple-negative breast and colorectal cancer studies, miR-130a-3p appears to have an opposite effect by suppressing cell proliferation and migration through modulation of the Wnt/β–catenin signaling pathway (15, 16).
MiR-126-3p has been reported to be downregulated in both the PB CD4+ and CD8+ T cells of AA patients and in the CD8+ T cells in MDS patients compared with healthy controls, with expression restored after IST in AA patients. Its role in suppressing the T-cell regulatory function in AA patients is related to activation of the PI3K-AKT pathway (5). In our study, we similarly observed the downregulation of miR-126-3p in unsorted BM cells in the AA cohort. MiR-196b-5p was downregulated in Fanconi anemia (FA) mesenchymal stem/stromal cells (MSCs) (17), but was found to be upregulated in higher-risk MDS and secondary AML patients, resulting in increased proliferation and downregulation in apoptosis (18). MiR-181c-5p was also downregulated in FA BM-MSCs (17), which was associated with the reduced expression of TNF-α,and transfection of BM cells from FA patients with miR-181c resulted in enhanced clonogenic potential (19). Consistent with this observation, the miR-181 family (miR-181a-5p, miR-181b-5p, and miR-181d-5p) was found to be overexpressed in MDS patients who progressed to AML, with the targeted pathways involving AKT/mTOR and MAP kinase (20); miR-181a was also found to repress granulocytic and macrophage-like differentiation in AML, mediated by the PRKCD-P38-C/EBPα and cell cycle (RB phosphorylation) pathways, and the suppression of miR-181a activity through lenti-miRZip-181a could reverse the leukemic phenotype (21). Both miR-196b-5p and miR-181a-3p/b-5p/c-5p were downregulated during hypomethylating agent treatment with azacitidine compared with the baseline in MDS and AML-MRC patients regardless of response, miR-199a-3p and miR-126–3p were downregulated in responders (CR/PR/marrow CR/haematological improvement (HI)), and miR-27b-3p was downregulated at baseline in patients who eventually achieved a CR (22, 23). Contrary to what was observed in this study, plasma miR-221-3p was significantly reduced in advanced MDS compared with early MDS patients, potentially due to the different sample source used.
Looking at the key signaling pathways involved in driving de novo MDS pathogenesis by the largest number of miRNAs involved, the HIF-1, FOXO, cell cycle, p53, and PI3K-AKT pathways were significantly enriched in comparison with AA at diagnosis, whereas the cytokine–cytokine receptor interaction, TGF-β, MAP kinase, prolactin, Hippo, neurotrophin, and FOXO signaling pathways were enriched in AA patients with clonal progression to MDS/AML. These latter pathways (except for the cytokine–cytokine receptor interaction) were also enriched in the de novo MDS cohort, albeit with fewer significant miRNAs involved (Supplementary Figures 3A, C). Cytokine–cytokine receptor interactions have been reported as a major pathway enriched in MDS, with miR-221 similarly identified in this study as a key miRNA modulating this pathway, in addition to miR-30b and miR-30e (24). Consistent with this observation, we have previously reported that the gene expression analysis from BM colony-forming units of MDS patients that have normalized after four cycles of treatment, exhibiting the downregulation of cytokine signaling (25).
Inhibitory cytokines such as TGF-beta contribute to myelosuppression and ineffective haematopoiesis (26), and also lead to the constitutive activation of the MAP kinase pathway in MDS, which in turn regulates apoptotic cell death and the survival of hematopoietic stem cells and progenitors (27). Interestingly, these similar pathways were observed in this study as key regulatory players in driving AA clonal progression to MDS/AML. We have similarly demonstrated that the MAPK12 gene was upregulated at MDS diagnosis and downregulated in normal BM colonies after four cycles of treatment (25). The Hippo signaling pathway interacts with other growth control and cell proliferation pathways such as PI3-AKT, TGF-β, RAS-MAP kinase, JAK/STAT, Notch, and Wnt signaling through YAP (Yes-associated protein) activation (28), and the downregulation of miR-9 and miR-550-1 is postulated to contribute to AML pathogenesis through inhibition of their tumor suppressor functions on the Hippo and YAP signaling pathways (29, 30). In CML, the downregulation of miR-181a resulted in the decreased activation of YAP and restored sensitivity to the tyrosine kinase inhibitor imatinib (31).
Linking these findings with the somatic mutations observed in the cohort of AA patients with disease progression, their clonal evolution pattern demonstrated the acquisition of new mutations mostly at the time of MDS or AML progression with four patients (patient number 2, patient number 5, patient number 6, and patient number 7) harboring mutations prior to morphological MDS progression. We did not observe a consistent rise in VAF in specific mutations such as ASXL1 and U2AF1, paralleling the clinical course of disease progression as previously reported (1, 32), although the RUNX1 VAF levels appeared to be stable over time. The U2AF1 mutation has been shown to promote MDS disease progression through FOXO3a activation, which results in pyroptosis through NLRP3-mediated inflammasome activation and cell cycle arrest through the activation of p21Cip1 and p27Kip1 (33).
MiR-125b upregulation has been implicated in the pathogenesis of multiple cancers, including MDS and AML, through its BCL2- and CBFβ-mediated downregulation of apoptosis, enhanced cellular proliferation, and impaired myeloid cell differentiation (34), and it has been proposed to be a post-transcriptional regulator of TET2 (35). MiR-15a-5p, which was downregulated at diagnosis in our AA cohort who eventually had progression, has been associated with the spliceosomal mutations SF3B1 and SRSF2, which may contribute to the progression of MDS (36). In contrast, miR-127-3p, which belongs to a miRNA cluster on the 14q32 locus, was upregulated at diagnosis in AA patients with eventual disease progression, consistent with observations of downregulated expression in del(5q) MDS post treatment with lenalidomide (37) and upregulation of 14q32 miRNAs in AML (38). Other miRNAs thought to be involved in the modulation of ASXL1, TET2, RUNX1, TP53, and spliceosomal mutations include the let-7 family, miR-125a, miR-9-5p, and miR-661 (39). Monosomy 7, which occurred in three patients in our cohort with MDS/AML progression and portends a poor prognosis, has been studied in the context of AML, in which RUNX1, ASXL1, NRAS, and TET2 were the most common recurrently mutated genes (25%–28%), and let-7e was identified as one of the upregulated miRNAs (40). In our cohort, let-7e-5p was upregulated in AA patients with MDS progression and in de novo MDS patients compared with AA patients at diagnosis.
Due to the retrospective nature of our study and sporadic nature of specimen collection post-treatment, we were unable to demonstrate significant changes in miRNA profile post treatment and correlate these to responses. We were also limited in our analysis in comparing AA samples against healthy controls due to the lack of sample availability and only ~17% of our cohort having paired diagnostic and follow-up samples available for comparison. However, due to the rarity of AA, the collative final patient cohort and sample size numbers were sufficient to demonstrate key miRNA changes in the BM of AA and MDS cohorts and shed clarity on AA patients who developed clonal progression to MDS/AML who had similar miRNA profiles to de novo MDS patients. Further work needs to be undertaken to clarify and delineate the underlying mechanistic pathways involved in clonal progression in AA.
Data availability statement
The data presented in the study are deposited in the Gene Expression Omnibus repository, with accession number GSE242216. (https://www.ncbi.nlm.nih.gov/geo/query/acc.cgi?acc=GSE242216).
Ethics statement
The studies involving humans were approved by Melbourne Health Human Research and Ethics Committee (HREC/16/MH/234 Project Number: 2016.207). The studies were conducted in accordance with the local legislation and institutional requirements. The ethics committee/institutional review board waived the requirement of written informed consent for participation from the participants or the participants’ legal guardians/next of kin because the samples collected as standard of care treatment were no longer required for clinical use.
Author contributions
LC, RK and DR contributed to the design and conduct of the study. LC collated the clinical data, analyzed the data and wrote the manuscript. ML-M processed and analyzed the bone marrow samples and wrote the Methods section for miRNA profiling. LF conducted and analyzed the myeloid NGS molecular mutational data and wrote the corresponding Methods section. NT conducted biostatistical analysis and clinical correlation on the miRNA data. All authors reviewed the article and approved the submitted version.
Funding
This research was funded through a Grant-in-Aid awarded by Maddie Riewoldt’s Vision.
Conflict of interest
The authors declare that the research was conducted in the absence of any commercial or financial relationships that could be construed as a potential conflict of interest.
The author(s) LC and RK declared that they were editorial board members of Frontiers, at the time of submission. This had no impact on the peer review process and the final decision.
Publisher’s note
All claims expressed in this article are solely those of the authors and do not necessarily represent those of their affiliated organizations, or those of the publisher, the editors and the reviewers. Any product that may be evaluated in this article, or claim that may be made by its manufacturer, is not guaranteed or endorsed by the publisher.
Supplementary material
The Supplementary Material for this article can be found online at: https://www.frontiersin.org/articles/10.3389/frhem.2023.1184962/full#supplementary-material
References
1. Ogawa S. Clonal hematopoiesis in acquired aplastic anemia. Blood (2016) 128(3):337–47. doi: 10.1182/blood-2016-01-636381
2. Sun L, Babushok DV. Secondary myelodysplastic syndrome and leukemia in acquired aplastic anemia and paroxysmal nocturnal hemoglobinuria. Blood (2020) 136(1):36–49. doi: 10.1182/blood.2019000940
3. Scheinberg P. Aplastic anemia: therapeutic updates in immunosuppression and transplantation. Hematol. Am. Soc. Hematol. Educ. Program (2012) 2012:292–300.
4. Kim SY, Le Rademacher J, Antin JH, Anderlini P, Ayas M, Battiwalla M, et al. Myelodysplastic syndrome evolving from aplastic anemia treated with immunosuppressive therapy: efficacy of hematopoietic stem cell transplantation. Haematologica (2014) 99(12):1868–75. doi: 10.3324/haematol.2014.108977
5. Hosokawa K, Muranski P, Feng X, Keyvanfar K, Townsley DM, Dumitriu B, et al. Identification of novel microRNA signatures linked to acquired aplastic anemia. Haematologica (2015) 100(12):1534–45. doi: 10.3324/haematol.2015.126128
6. Hosokawa K, Kajigaya S, Feng X, Desierto MJ, Fernandez Ibanez MD, Rios O, et al. A plasma microRNA signature as a biomarker for acquired aplastic anemia. Haematologica (2017) 102(1):69–78. doi: 10.3324/haematol.2016.151076
7. Giudice V, Banaszak LG, Gutierrez-Rodrigues F, Kajigaya S, Panjwani R, Ibanez M, et al. Circulating exosomal microRNAs in acquired aplastic anemia and myelodysplastic syndromes. Haematologica (2018) 103(7):1150–9. doi: 10.3324/haematol.2017.182824
8. Andersen CL, Jensen JL, Orntoft TF. NorMalization of real-time quantitative reverse transcription-PCR data: a model-based variance estimation approach to identify genes suited for norMalization, applied to bladder and colon cancer data sets. Cancer Res. (2004) 64(15):5245–50. doi: 10.1158/0008-5472.CAN-04-0496
9. Molania R, Gagnon-Bartsch JA, Dobrovic A, Speed TP. A new norMalization for Nanostring nCounter gene expression data. Nucleic Acids Res. (2019) 47(12):6073–83. doi: 10.1093/nar/gkz433
10. Ritchie ME, Phipson B, Wu D, Hu Y, Law CW, Shi W, et al. limma powers differential expression analyses for RNA-sequencing and microarray studies. Nucleic Acids Res. (2015) 43(7):e47. doi: 10.1093/nar/gkv007
11. Kehl T, Kern F, Backes C, Fehlmann T, Stockel D, Meese E, et al. miRPathDB 2.0: a novel release of the miRNA Pathway Dictionary Database. Nucleic Acids Res. (2020) 48(D1):D142–D7. doi: 10.1093/nar/gkz1022
12. Larsen MT, Hother C, Hager M, Pedersen CC, Theilgaard-Monch K, Borregaard N, et al. MicroRNA profiling in human neutrophils during bone marrow granulopoiesis and in vivo exudation. PloS One (2013) 8(3):e58454. doi: 10.1371/journal.pone.0058454
13. Wang M, Wang X, Liu W. MicroRNA−130a−3p promotes the proliferation and inhibits the apoptosis of cervical cancer cells via negative regulation of RUNX3. Mol. Med. Rep. (2020) 22(4):2990–3000.
14. Causin RL, Van Helvoort Lengert A, Gomes INF, De Freitas AJA, Rosa MN, Dos Reis R, et al. MicroRNA−130a−3p inhibition suppresses cervical cancer cell progression. Oncol. Rep. (2023) 49(5): 1–14. doi: 10.3892/or.2023.8546
15. Poodineh J, Sirati-Sabet M, Rajabibazl M, Mohammadi-Yeganeh S. MiR-130a-3p blocks Wnt signaling cascade in the triple-negative breast cancer by targeting the key players at multiple points. Heliyon (2020) 6(11):e05434. doi: 10.1016/j.heliyon.2020.e05434
16. Song GL, Xiao M, Wan XY, Deng J, Ling JD, Tian YG, et al. MiR-130a-3p suppresses colorectal cancer growth by targeting Wnt Family Member 1 (WNT1). Bioengineered (2021) 12(1):8407–18. doi: 10.1080/21655979.2021.1977556
17. Cagnan I, Keles M, Keskus AG, Tombaz M, Sahan OB, Aerts-Kaya F, et al. Global miRNA expression of bone marrow mesenchymal stem/stromal cells derived from Fanconi anemia patients. Hum. Cell. (2022) 35(1):111–24. doi: 10.1007/s13577-021-00626-9
18. Wen J, Huang Y, Li H, Zhang X, Cheng P, Deng D, et al. Over-expression of miR-196b-5p is significantly associated with the progression of myelodysplastic syndrome. Int. J. Hematol. (2017) 105(6):777–83. doi: 10.1007/s12185-017-2201-9
19. Rio P, Agirre X, Garate L, Banos R, Alvarez L, San Jose-Eneriz E, et al. Down-regulated expression of hsa-miR-181c in Fanconi anemia patients: implications in TNFalpha regulation and proliferation of hematopoietic progenitor cells. Blood (2012) 119(13):3042–9. doi: 10.1182/blood-2011-01-331017
20. Guo Y, Strickland SA, Mohan S, Li S, Bosompem A, Vickers KC, et al. MicroRNAs and tRNA-derived fragments predict the transformation of myelodysplastic syndromes to acute myeloid leukemia. Leuk Lymphoma (2017) 58(9):1–15. doi: 10.1080/10428194.2016.1272680
21. Su R, Lin HS, Zhang XH, Yin XL, Ning HM, Liu B, et al. MiR-181 family: regulators of myeloid differentiation and acute myeloid leukemia as well as potential therapeutic targets. Oncogene (2015) 34(25):3226–39. doi: 10.1038/onc.2014.274
22. Krejcik Z, Belickova M, Hrustincova A, Votavova H, Jonasova A, Cermak J, et al. MicroRNA profiles as predictive markers of response to azacitidine therapy in myelodysplastic syndromes and acute myeloid leukemia. Cancer biomark. (2018) 22(1):101–10. doi: 10.3233/CBM-171029
23. Hrustincova A, Krejcik Z, Kundrat D, Szikszai K, Belickova M, Pecherkova P, et al. Circulating small noncoding RNAs have specific expression patterns in plasma and extracellular vesicles in myelodysplastic syndromes and are predictive of patient outcome. Cells (2020) 9(4):1–25. doi: 10.3390/cells9040794
24. Lyu C, Liu K, Jiang Y, Wang T, Wang Y, Xu R. Integrated analysis on mRNA microarray and microRNA microarray to screen immune-related biomarkers and pathways in myelodysplastic syndrome. Hematology (2021) 26(1):417–31. doi: 10.1080/16078454.2021.1938429
25. Chee L, Ritchie D, Ludford-Menting M, Ripley J, Chung J, Park D, et al. Dysregulation of immune cell and cytokine signalling correlates with clinical outcomes in myelodysplastic syndrome (MDS). Eur. J. Haematol. (2022) 108(4):342–53. doi: 10.1111/ejh.13742
26. Bewersdorf JP, Zeidan AM. Transforming growth factor (TGF)-beta pathway as a therapeutic target in lower risk myelodysplastic syndromes. Leukemia (2019) 33(6):1303–12. doi: 10.1038/s41375-019-0448-2
27. Bachegowda L, Gligich O, Mantzaris I, Schinke C, Wyville D, Carrillo T, et al. Signal transduction inhibitors in treatment of myelodysplastic syndromes. J. Hematol. Oncol. (2013) 6:50.
28. Noorbakhsh N, Hayatmoghadam B, JaMali M, Golmohammadi M, Kavianpour M. The Hippo signaling pathway in leukemia: function, interaction, and carcinogenesis. Cancer Cell Int. (2021) 21(1):705. doi: 10.1186/s12935-021-02408-7
29. Wang G, Yu X, Xia J, Sun J, Huang H, Liu Y. MicroRNA-9 restrains the sharp increase and boost apoptosis of human acute myeloid leukemia cells by adjusting the Hippo/YAP signaling pathway. Bioengineered (2021) 12(1):2906–14. doi: 10.1080/21655979.2021.1915727
30. Hu C, Yu M, Li C, Wang Y, Li X, Ulrich B, et al. miR-550-1 functions as a tumor suppressor in acute myeloid leukemia via the hippo signaling pathway. Int. J. Biol. Sci. (2020) 16(15):2853–67. doi: 10.7150/ijbs.44365
31. Chorzalska A, Kim JF, Roder K, Tepper A, Ahsan N, Rao RSP, et al. Long-term exposure to imatinib mesylate downregulates hippo pathway and activates YAP in a model of chronic myelogenous leukemia. Stem Cells Dev. (2017) 26(9):656–77. doi: 10.1089/scd.2016.0262
32. Negoro E, Nagata Y, Clemente MJ, Hosono N, Shen W, Nazha A, et al. Origins of myelodysplastic syndromes after aplastic anemia. Blood (2017) 130(17):1953–7. doi: 10.1182/blood-2017-02-767731
33. Zhu Y, Song D, Guo J, Jin J, Tao Y, Zhang Z, et al. U2AF1 mutation promotes tumorigenicity through facilitating autophagy flux mediated by FOXO3a activation in myelodysplastic syndromes. Cell Death Dis. (2021) 12(7):655. doi: 10.1038/s41419-021-03573-3
34. Banzhaf-Strathmann J, Edbauer D. Good guy or bad guy: the opposing roles of microRNA 125b in cancer. Cell Commun. Signal. (2014) 12:30.
35. Cheng J, Guo S, Chen S, Mastriano SJ, Liu C, D’Alessio AC, et al. An extensive network of TET2-targeting MicroRNAs regulates Malignant hematopoiesis. Cell Rep. (2013) 5(2):471–81. doi: 10.1016/j.celrep.2013.08.050
36. Aslan D, Garde C, Nygaard MK, Helbo AS, Dimopoulos K, Hansen JW, et al. Tumor suppressor microRNAs are downregulated in myelodysplastic syndrome with spliceosome mutations. Oncotarget (2016) 7(9):9951–63. doi: 10.18632/oncotarget.7127
37. Merkerova MD, Krejcik Z, Belickova M, Hrustincova A, Klema J, Stara E, et al. Genome-wide miRNA profiling in myelodysplastic syndrome with del(5q) treated with lenalidomide. Eur. J. Haematol. (2015) 95(1):35–43. doi: 10.1111/ejh.12458
38. Dixon-McIver A, East P, Mein CA, Cazier JB, Molloy G, Chaplin T, et al. Distinctive patterns of microRNA expression associated with karyotype in acute myeloid leukaemia. PloS One (2008) 3(5):e2141. doi: 10.1371/journal.pone.0002141
39. Bauer M, Vaxevanis C, Heimer N, Al-Ali HK, Jaekel N, Bachmann M, et al. Expression, regulation and function of microRNA as important players in the transition of MDS to secondary AML and their cross talk to RNA-binding proteins. Int. J. Mol. Sci. (2020) 21(19):1–30. doi: 10.3390/ijms21197140
Keywords: microRNA, aplastic anemia (AA), clonal progression, myelodysplastic syndromes (MDS), bone marrow failure (BMF)
Citation: Chee L, Koldej R, Thio N, Ludford-Menting M, Fox L, Blombery P and Ritchie D (2023) MicroRNA profiling in aplastic anemia reveals similarities between secondary myelodysplastic syndromes arising from clonal progression and de novo MDS. Front. Hematol. 2:1184962. doi: 10.3389/frhem.2023.1184962
Received: 13 March 2023; Accepted: 22 August 2023;
Published: 15 September 2023.
Edited by:
Emanuele Azzoni, University of Milano Bicocca, ItalyReviewed by:
Sarah Grasedieck, University of British Columbia, CanadaValentina Giudice, University of Salerno, Italy
Copyright © 2023 Chee, Koldej, Thio, Ludford-Menting, Fox, Blombery and Ritchie. This is an open-access article distributed under the terms of the Creative Commons Attribution License (CC BY). The use, distribution or reproduction in other forums is permitted, provided the original author(s) and the copyright owner(s) are credited and that the original publication in this journal is cited, in accordance with accepted academic practice. No use, distribution or reproduction is permitted which does not comply with these terms.
*Correspondence: Lynette Chee, bHluZXR0ZS5jaGVlQG1oLm9yZy5hdQ==