
94% of researchers rate our articles as excellent or good
Learn more about the work of our research integrity team to safeguard the quality of each article we publish.
Find out more
ORIGINAL RESEARCH article
Front. Geochem., 22 May 2024
Sec. Biogeochemistry
Volume 2 - 2024 | https://doi.org/10.3389/fgeoc.2024.1393444
 Ludmila Silva Brighenti1†
 Elisa Aguiar Porto Viana2†Diego Guimarães Florêncio Pujoni2Francisco Antônio Rodrigues Barbosa2José Fernandes Bezerra-Neto2*
As hotspots of the global carbon cycle, lakes can regulate climate change while being regulated by it via a feedback loop. As ecosystem metabolism is considered to be a sentinel to these changes, we used high-frequency measurements and the inverse modeling approach to study the temporal dynamic of gross primary production (GPP), respiration (R), and net ecosystem production (NEP) at surface waters of a tropical lake, which lost about 60% of its volume in almost 10 years. This water loss and the return of the average rainfall led to an increased concentration of nitrogen, phosphorus, and dissolved organic carbon and decreased water transparency and light availability. During the post-drought period, epilimnetic GPP increased by 40% compared with the pre-drought period, and R surpassed GPP during the mixing period of the lake. We discuss that this modification results from higher carbon and nutrient concentrations, lower light availability, and a change in the lake stratification pattern. Surface water metabolism changed due to meteorological and hydrological drought, and it may continue to change under the ongoing variation in rainfall patterns, temperature, and human disturbances.
The carbon transformation in the aquatic environment involves the formation (i.e., gross primary production - GPP) and degradation (i.e., respiration - R) of organic matter (OM) by the organisms, as well as physical processes (Hotchkiss and DelSontro, 2024). The balance of these two processes is usually described as net primary production (NEP = GPP - R), which stands for the total biomass formation of primary producers, and these processes are known as the ecosystem metabolism (Staehr et al., 2012c). NEP is useful to describe and evaluate the trophic state of lakes and to define the role of the ecosystem in the carbon cycle as a sink (NEP >0; net autotrophic systems or periods) or a source (NEP <0; net heterotrophic systems or periods) of atmospheric CO2 (Zwart and Brighenti, 2021).
The effects of nutrients, organic matter, and light availability on lake metabolism is an active research topic. There is a general agreement that increased nutrient concentrations and light availability will stimulate algal growth, increasing GPP and R rates (Staehr et al., 2012a; Hoellein et al., 2013; Zou et al., 2022). However, because these drivers are not independent, the specific result may not be directly predictable due to complex interactions and feedback loops. Taking, for instance, the role of dissolved organic matter (DOM) in ecosystem metabolism, some studies have shown that the colored fraction of DOM (colored DOM or CDOM) reduces water transparency, which can decrease primary production and increase respiration rates (Thrane et al., 2014; Sherbo et al., 2023). On the other hand, DOM degradation remineralizes dissolved nutrients, stimulating algal growth, thus enhancing GPP more than ecosystem respiration (Solomon et al., 2015; Feuchtmayr et al., 2019). Although, the effects of higher DOM concentrations in bacterial metabolism are likely underestimated due to a lack of whole ecosystem studies compared to incubations and bioassays studies (Hotchkiss and DelSontro, 2024). In addition, DOM reduces the mixed layer depth, retaining primary producers in an upper and illuminated zone, which could increase epilimnetic GPP rates (Jones, 1992; Bordin et al., 2024). Even more complex outcomes can be expected when we consider tropical lakes, which receive more solar radiation throughout the year than their temperate counterparts. Thus, light availability by itself is not commonly the limiting factor for primary producers in this region (Staehr et al., 2016). Indeed, high irradiation combined with nutrient deprivation was shown to decrease epilimnetic GPP in tropical lakes in Brazil (Brighenti et al., 2015; 2018). As allochthonous DOM reduces light availability (Rose, 2024) and the penetration of harmful ultraviolet light into the water column (Arts et al., 2000; Brandão et al., 2018), increased DOM can enhance GPP in surface water also by preventing light-induced damages to the photosystem II of primary producers (Keren and Liszkay, 2011).
One of the most visible effects of climate change in aquatic ecosystems is the water volume reduction in response to changes in rainfall patterns and increased evapotranspiration (Williamson et al., 2009). Reduced rainfall can either decrease or increase the concentration of nutrients in lakes depending on the importance of terrestrial loading and evaporation rates (Mosley, 2015). The concentration decrease may occur due to the lowered inputs of allochthonous nutrients into the system, as shown by Lathrop (2007) for total phosphorus concentrations in a temperate lake. Increased concentrations are more likely to occur when reduced rainfall is associated with high evaporation rates, which leads to lower water volume (Mosley, 2015). With a lower water level, the concentrations of nutrients and organic matter might increase due to a concentration effect, affecting GPP and R rates (Jeppensen et al., 2015; Brasil et al., 2016). In addition, with the resumption of rain, more nutrients and organic matter are carried into the lake, combined with the low water volume, increases nutrient concentrations even more (Gámez et al., 2023; Isles et al., 2023). Lake metabolism responses to changes in rainfall depend on morphometric and catchment characteristics (Gagliardi et al., 2019). Prolonged droughts can reduce lakes and reservoirs water volume, favoring primary production through a higher concentration of nutrients and, therefore, leading to a decrease of CO2 in the water column (Mendonça Júnior et al., 2018; Junger et al., 2019). However, despite the initial increase in ecosystem metabolism following the reduction in lake volume, metabolic rates at surface waters might decline due to a stronger thermal stratification and a shallower mixed layer depth, which could lead to reduced nutrient concentrations in the upper mixed layer (Tsai et al., 2016). This indicates that the influence of drought and the changes in rainfall patterns are complex and might extend in the subsequent years, as demonstrated in previous studies (e.g., Fenner et al., 2001; Jennings et al., 2009; Chiu et al., 2020).
Water volume loss can also impact the seasonal dynamics of a lake (Mosley, 2015; Rigotti et al., 2023), and the alteration of mixing regimes is one of the most extensive and concerning physical consequences of climate change (Woolway et al., 2020). During typical seasonal dynamics in warm monomictic tropical lakes, metabolic rates at surface waters are higher during the dry season, when water column stability is low, and nutrients and DOM are reintroduced in the euphotic zone, decreasing photoinhibition and promoting primary production and respiration (Brighenti et al., 2015; Gagliardi et al., 2019). Albeit during the stratified warm rainy season, the combination of high light availability and nutrient depletion cooccurs with lower epiliminetic GPP and R rates and raised levels of photosynthetic photoinhibition (Brighenti et al., 2018; Mziray et al., 2018). In this context, prolonged droughts and high evaporation rates are anticipated to decrease water volume, consequently increasing the concentration of nutrients and DOM throughout the year in tropical freshwater systems (Jovem-Azevêdo et al., 2019; Barbosa et al., 2023). Moreover, the decrease in mean depth is expected to result in reduced water column stability, potentially leading to more frequent mixing events (Fee et al., 1996), even throughout the typical stratified season. Consequently, by enhancing nutrient and DOM availability and decreasing light availability yearlong, water volume reduction is likely to dampen the seasonal metabolic variability.
Herein, we aim to evaluate how a prolonged drought can influence the metabolic rates in surface waters of a tropical lake. To accomplish this, we compared two distinct periods (2011–2012 and 2017–2019) of the epilimnetic metabolism of a tropical lake that lost about 60% of its volume and circa 30% of its surface area compared to the last decade. The first period (P1 – 2011-2012) is the beginning of the prolonged drought and the second period (P2 – 2017-2019) is the beginning of a post-drought, a break-up phase of the drought, with still low water levels and volume, but with normalized rainfall and the return to pre-drought external inputs to the lake. We evaluated whether a persistent lower water level changed lake physical and chemical characteristics, thus altering the magnitude and the dynamics of GPP, R, and NEP rates. We predict, under low water level conditions, a year-long general increase in nutrient and dissolved organic matter concentrations, which will reduce water transparency and light availability (i) enhancing both epilimnetic GPP and R (ii) and weakening the role of seasonality on epilimnetic metabolism (the metabolic rates will be similar between rainy and dry seasons).
This study was performed in Lake Carioca (19.75°S; 42.6°W) in Brazil, a tropical, small (during high water level period - perimeter: 1718 m, area: 0.14 km2, maximum depth: 11.8 m, mean depth: 4.8 m; Bezerra-Neto et al., 2010), and monomictic lake surrounded by preserved Tropical Atlantic Forest. This lake is located inside a conservation unit (Parque Estadual do Rio Doce - PERD), being part of the middle Rio Doce lacustrine system that is recognized as a wetland of international importance by the Ramsar Convention (Ramsar 2010 - www.ramsar.org). Lake Carioca shows two distinct seasons: the dry season (May to August - Autumn/Winter), when total mixing of the water column occurs, and the rainy season (September to April - Spring/Summer) when the water column is stratified (Figure 1). Lake Carioca has been monitored since 1999 as part of a long-term ecological research project (LTER project site #4 - Atlantic Forest and Lacustrine System of the middle Rio Doce - Brazil; www2.icb.ufmg.br/limneapeld/site/index.php). Previous studies described Lake Carioca as mesotrophic (Petrucio et al., 2006; Brighenti et al., 2015). However, recent data presented here evidence a shift to a eutrophic state.
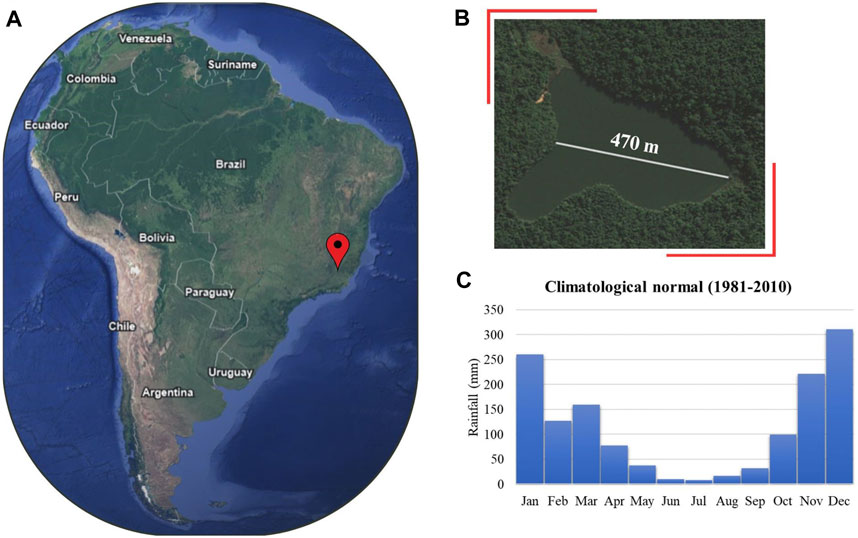
Figure 1. Location of the Middle Rio Doce Lake System, state of MG, Brazil (A) with emphasis on the location of Lake Carioca (B). Climatological Normal of Accumulated Rainfall (1981-2010) for the region (C). Source: Google Earth (https://earth.google.com/web/) and Instituto Nacional de Meteorologia (https://portal.inmet.gov.br).
Environmental variables were collected in two distinct periods. The first one (P1), from May 2011 to December 2012, comprised two dry (fully-mixed) and two rainy (stratified) seasons. While the second one (P2), from July 2017 to December 2019, covered three dry and three rainy seasons.
Water samples were collected at 0.5 m for physicochemical analyses. The sampling occurred monthly during P1 (n = 20) and at irregular intervals during P2 (n = 19) and covered the dry (n = 13) and the rainy (n = 26) seasons. Unfiltered samples were used to determine total phosphorus (TP) and total nitrogen (TN). TP was determined by digesting the sample to convert all phosphorus forms to orthophosphate, followed by colorimetric measurement of orthophosphate concentration according to Mackerth et al. (1978). TN was determined by oxidizing all nitrogen-containing compounds and measuring the resulting nitrogen oxides in a Total Organic Carbon analyzer (Shimadzu TOC-5000A). Samples for dissolved organic carbon (DOC) and colored dissolved organic matter (CDOM) were filtered (0.22 µm Millipore filter) after collection. DOC concentrations were determined by oxidizing all organic carbon compounds into carbon dioxide and then quantifying the resulting carbon dioxide concentration with a TOC analyzer (Shimadzu TOC-5000A). We determined CDOM at 254 nm absorbance coefficients to characterize allochthonous sources of carbon (Brandão et al., 2018). The absorption coefficients were derived from absorbance measurements according to the equation aCDOM(λ) = 2.303A(λ)L−1, where A(λ) is the absorbance measured at wavelength λ and L is the optical path of the cuvette (in meters). Absorption coefficients were corrected for backscattering by subtracting the value of the coefficient at 700 nm. Chlorophyll-a (Chl-a) concentration was estimated according to Lorenzen (1967) after extraction in 90% acetone. Total suspended solids (TSS) were determined as the difference between the dry weights of AP40 Millipore filters (105°C for 2 h) before and after the filtration of water samples.
In both the P1 and P2 campaigns, high-frequency data were sampled continuously throughout the campaigns in 15 min intervals from instrumentation deployed at the central deep region of Lake Carioca. In the P1 campaign the buoy was equipped with 1 dissolved oxygen (DO) and temperature sensor at 0.5 m (D-OptoLogger, Zebra Tech Ltda.) and 1 thermistor chain with 5 sensors (WQ101, Global Water) at different depths. For a complete description about the equipment used see Brighenti et al. (2015). In the P2 campaign the instrumentation in the buoy was the following: 8 DO and temperature sensors at the depths 0.5, 1.0, 1.5, 2.0, 3.0, 4.0, 5.0, and 6.5 m (miniDOT Logger, PME; D-OptoLogger, Zebra Tech Ltda.); 1 PAR radiation sensor at 1.6 m height (Sq214, Apogee); 1 wind speed sensor at 1.0 m above the surface (RK100-02, Rika Electronic Technology); 1 barometric pressure sensor (WE100, Global Water) and 1 rainfall sensor at 0.5 m above the surface (RainEW111, RainWiseInc); 1 air temperature and humidity sensor at 1.0 m height (RK330-01, Rika Electronic Technology); and four light sensors (UA-002, HOBO) at depths 0.25, 0.50, 0.75 and 1.00 m.
To make a general comparison of the meteorological data between P1 and P2 (e.g., air temperature and rainfall) we used data from a meteorological station located at 30 km of distance from the lake for both periods (https://tempo.inmet.gov.br/). We also used wind speed values from this station when the data from lake instrumentation were missing (from July 2017 to February 2018 and from September 2018 to November 2018).
The daily diffuse photosynthetically active radiation attenuation coefficient (KdPAR) was mainly determined using the data collected between 10 a.m. and 2 p.m. by HOBO sensors and converted to PAR according to Long et al. (2012). We also used a BIC radiometer to evaluate KdPAR in periods that HOBO information was not available. Mean available light at the upper mixed layer (Emean; mmol photons m-2 s-1) was estimated using PAR radiation sensor. HOBO sensor (at 0.25 m depth) was used when PAR values were not available or missing (from July 2017 to January 2018, from September 2018 to November 2018 and in September 2019), and calculated according to Eq. 1 (Staehr and Sand-Jensen, 2007).
Where I0 is the radiation measured in the atmosphere and 0.9 is a coefficient for backscattering and surface reflection (when radiation is measured inside the water, this term is removed from the equation); KdPAR is the diffuse photosynthetically active radiation attenuation coefficient and Zmix is the mixing depth. We use Brunt–Väisälä frequency to characterize the stability of stratification and Zmix to identify major changes in the mixing pattern in Lake Carioca. BV frequency and Zmix were calculated using the package rLakeAnalyzer in R software (R Core Team, 2022). See Brighenti et al., 2015 for more specific details about KdPAR, Emean, and Zmix calculation for 2011–2012 period.
The metabolism rates were estimated using the inverse modeling approach (IMA; Brighenti et al., 2015; Hanson et al., 2008; Solomon et al., 2013). In this technique, we used a nonlinear calibration procedure to estimate the best parameter values combination to obtain the best correlation between estimated and observed DO concentrations. We use DO concentrations measured at 0.5 m for P1 and 1.0 m for P2, since we missed large amount of DO data from P2 due to malfunction of the sensor. However, we expect this difference to not affect our results because our long-term data has shown that the DO concentrations of these two depths are highly correlated (R2 = 0.91; Supplementary Material–Supplementary Figure S1). The values of DO concentration measured at 0.5 and 1.0 m depths hold only for the upper mixed layer and were not extrapolated to the entire lake.
The DO concentrations obtained for every 15 min were averaged to obtain 30 min intervals. All temperature and DO measurements pass through visual inspection to remove erroneous values produced by sensor errors, low battery, sampling days, and biofilm accumulation. Data also underwent smoothing by the moving averages technique (1:30 h interval) to remove erratic variation and noise. DO fluctuations were described using Eq. 2 adapted from Odum (1956):
where DO(t+1) and DO(t) are DO concentrations (mg L-1) at times t + 1 and t; GPP(t) is the gross primary production at time t; R(t) is the respiration rate at time t; F(t) is the flux of O2 at the interface lake-atmosphere at time t.
Gross primary production (GPP) was calculated using the double exponential model of Platt et al. (1980). This model was chosen as it can evidence the occurrence of photoinhibition and saturation. Moreover, this light intensity relationship proved to be the best model to evaluate GPP on Lake Carioca, as described in Brighenti et al. (2015; 2018).
where Pmax is a free parameter describing the maximum potential photosynthetic rate; α (mg O2 L-1 mmol photons m-2 s-1) is a free parameter representing the initial linear slope of the relationship between photosynthesis and light; Emean(t) is the mean available light in the upper mixed layer (mmol photons m-2 s-1) measured at time t; β is a free parameter describing the degree of photoinhibition in the same unit as α.
Respiration (R) was calculated according to Jørgensen (1979), considering R to be dependent on temperature. We use a thermal dependence coefficient of 1.07 (Jørgensen, 1979) and a temperature reference point of 30°C:
where Rmax is a free parameter describing the respiration rate at 30°C and Tt is the water temperature (°C) at time t measured at the same depth of the DO sensor.
The atmospheric flux (m h-1) was calculated according to Staehr et al. (2010a) as follows:
where DOsat(t) is the concentration in water at equilibrium with atmosphere at ambient temperature and pressure calculated according to Weiss (1970) at time t; DO(t) is the concentration measured in the water at time t; Zmix(t) is the mixed layer depth (m) at time t; k(t) is the coefficient of gas exchange and was calculated considering the relationship between Schmidt numbers (Sc) and temperature at time t (Jahne et al., 1987):
where k600 (m h-1) is k for a Sc of 600 and simulates the piston velocity.
There has been much discussion in the literature about the accuracy of predicting the piston velocity k600 from wind measurements and the influence of the k600 model on metabolism estimates (Dugan et al., 2016; Klaus and Vachon, 2020). In this work, we used ten different approaches to estimate k600 and further, the metabolic rates. We aimed to understand if and how the models can affect the major results (i.e., the mean seasonal results) of this work, and we also evaluated the strengths and vulnerabilities about the application of these models for metabolism estimates. We separate the models into two groups: 1) wind-based models and 2) models that consider other processes that generate turbulence close to the air-water interface besides the wind. We tested the follow approaches: 1.1) Cole and Caraco (1998) – CC98; 1.2) Cole et al. (2010) - CO10; 1.3) bilinear model of Crusius and Wanninkhof (2003) - CWB03; 1.4) linear model of Crusius and Wanninkhof (2003) - CWL03; 1.5) power function of Crusius and Wanninkhof (2003) - CWPF03; 2.1) the buoyancy flux model from Heiskanen et al. (2014) - HE14; 2.2) the buoyancy flux model of MacIntyre et al. (2010) - MI10; 2.3) the combination of the surface renewal model from Read et al. (2012) and the breaking wave component of Soloviev et al. (2007) - RS712; 2.4) the Vachon and Prairie (2013) model that considers the lake area - VP13. Lastly, we also used k600 as a free parameter simulating the piston velocity - K600F. Models 2.1 and 2.3 were obtained from the LakeMetabolizer package (Winslow et al., 2016). Refer to Supplementary Material for the equations used and the abbreviations names of the models (Supplementary Table S1).
We used the free parameters (Pmax, α, β, Rmax) and Eqs 2–6 above to estimate DO concentrations at 30 min intervals and, thus, calculated daily metabolic rates. NEP was calculated as the difference between the daily GPP and R (NEP = GPP - R).
To evaluate the adequacy of the model for each day, we performed a linear regression between the estimated and observed DO to obtain the p and R2 values. We considered as a good model fit, only those days with R2 ≥ 0.7 and p < 0.05. In this way, we assume that in days with a good model fit, the biological processes and air-water flux are the main factors acting on DO fluctuations. On the other hand, in days with a poor model fit, other physical processes as internal waves, periodic mixing, and water movements from the littoral zone might be controlling the DO patterns, and thus, the model is not appropriate to represent these processes (Hanson et al., 2008; McNair et al., 2013; Brighenti et al., 2015).
For the two sampling periods, 58% (8,000 data points including all k600 models) of the data achieved our model requirements and were used in the data analysis. Days with poor model fit were more frequent in P2 (2017–2019; 46% of the days), and mainly in the dry season of the same period (66% of the days). Nonetheless, we believe that this imbalance is unlikely to alter our findings, because of the higher sample size used for comparative analysis (minimum of 1,014 days; Supplementary Table S2).
We also evaluated the occurrence of apparent light saturation and photoinhibition process. We used the adapted approach from Staehr et al. (2016) to estimate a light saturation index (Isat) and a photoinhibition index (Iinh).
where Pmax, α, β are as described in Eq. 3, and Emean was considered the average Emean values at 2-h around noon (11:00–13:00) for each day, thus avoiding comparisons between different day-lengths. Higher values of Isat signify higher levels of light saturation, indicating the absence of light limitation for a particular day. While higher values of Iinh indicate a reduced level of photoinhibition for that day. The levels of light saturation and photoinhibition are sensitive to the range of light conditions in each day. We considered light saturation to be moderate to high when Isat values were greater than 0.6 and photoinhibiotion to be moderate to high when Iinh values were lower than 0.6 (Staehr et al., 2016).
The non-parametric Kruskal–Wallis test was used to verify differences in environmental variables between the combination of the periods and seasons (P1-rainy vs. P1-dry vs. P2-rainy vs. P2-dry) of this work. We used the Dunn’s test with Bonferroni p-adjustment method to compare the groups. We used linear model to assess the main factors and interacting effects of periods, seasons, and models (i.e., the ten different approaches to calculate k600) in the metabolic rates (e.g., GPP, R, NEP). Spearman correlation analysis was used to assess the relationship between environmental variables and metabolic rates. We consider significance levels of p < 0.05. All statistical analysis were performed in software R (R Core Team, 2022).
The accumulated rainfall was 1866 mm in P1 and 3,034.8 mm in P2, however, the rainfall pattern was quite dissimilar between the years for both periods (Figures 2A, B). The years 2012, 2018, and 2019 registered the lowest rainfall values (726.2, 1,296.4, and 1,084 mm respectively), and were below the historical mean for the region (1981–2010: 1,359.5 mm; see Supplementary Figure S2). The region also registered higher values of maximum air temperature in the period ranging from 2011 to 2019, being on average 2.6°C above the historical mean for the region (1981–2010: 28.8°C). A higher seasonal amplitude in water temperature was observed for P2, which presented an average 1.1°C higher and 0.7°C lower than that of P1 for the rainy and dry seasons, respectively, following the pattern observed in air temperature (P1 21.9°C ± 3.6°C; P2 22.5°C ± 3.8°C; mean ± standard deviation; Supplementary Table S3).
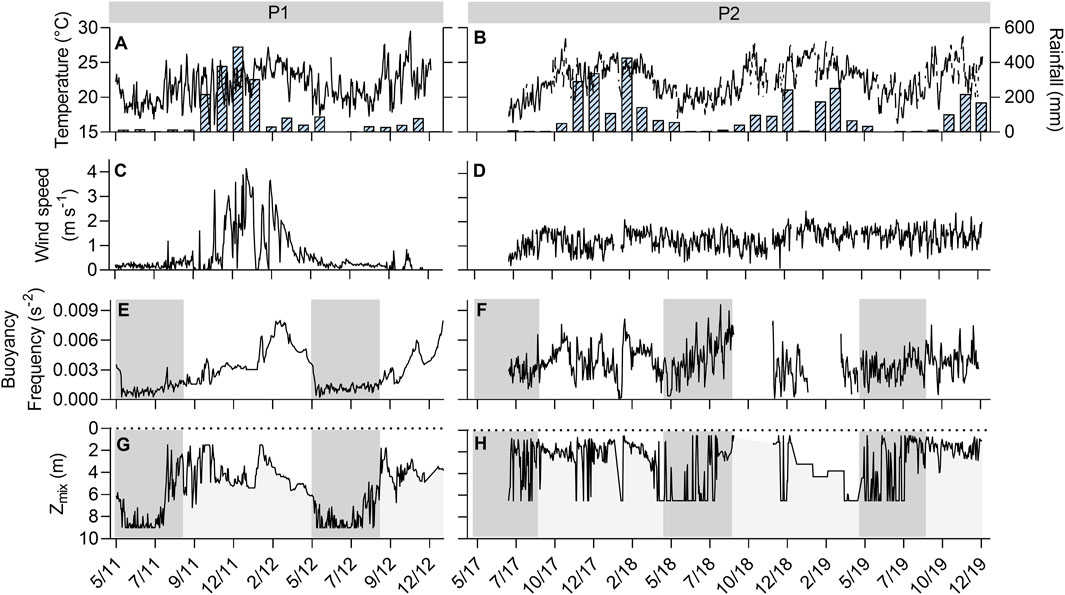
Figure 2. Intra and inter-annual changes in daily (A, B) mean air temperature (line) and monthly accumulated rainfall (bars); (C, D) wind speed at 10 m; (E, F) stratification stability (BV frequency); (G, H) mixed layer depth (Zmix). The grey area represents the typical dry season for both periods. High-frequency data for Zmix and BV frequency is missing from September 2018 to November 2018 and from January 2019 to March 2019 (monthly data are shown for Zmix). Dates in the x-axis are resepresented in the format MM/YY. For P1 the maximum depth was 11.2 m and for P2 the maximum depth was 8.8m.
Maximum depth ranged between 9.4 and 11.25 m in P1 and between 6.9 and 8.8 m in P2 (Supplementary Table S3). The mean water level in P2 (7.6 m) represents a total decrease of 4.2 m in comparison with the last bathymetry data (Bezerra-Neto et al., 2010) and a 2.6 m decrease in comparison to mean water level in P1. According to the hypsographic curves in Bezerra-Neto et al. (2010) a loss of 4 m in water column corresponds to 65.4% loss in total lake volume, thus, the total lake volume in P2 ranged around 50% and 35% of the volume registered in P1.
The mean concentration of all the environmental variables (Figure 3; Supplementary Table S3) generally varied between the periods and seasons, where on average the variation between periods was higher than between seasons. The mean parameter concentrations were significantly higher in P2 than in P1 (TN 2.8 times, Chl-a 1.7 times, DOC 1.8 times, CDOM254 1.5 times, TSS 1.4 times), except for TP (1.6 times higher, but not statistically significant). The mean parameter concentrations were also higher in the dry season than in the rainy season for both periods, except for TP, CDOM254, and Emean, which were higher in the rainy season of P2 than in the dry season of the same period.
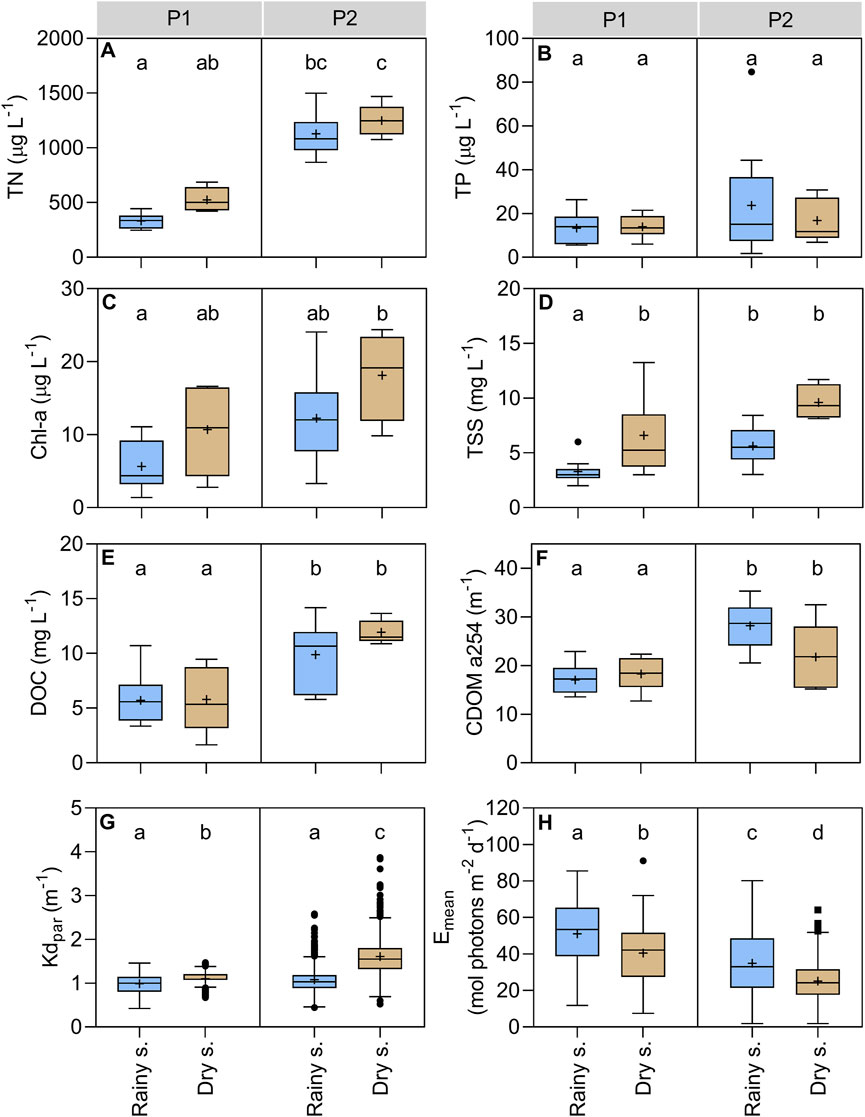
Figure 3. Variation of environmental variables in Lake Carioca between periods and seasons. All box plots show the third and first quartiles, the center line is the median and the "+" symbol indicates the mean value. Error bars represent the minimum and maximum values. Black circles indicate outliers. Different letters represent significant differences between seasons and periods (p < 0.05), and equal letters represent no significant differences between the groups (p > 0.05). P1 column indicates the 2011–2012 period. P2 column indicates the 2017–2019 period. Blue bars represent the data collected in the rainy season and the light brown represents the data collected in the dry season for (A) total nitrogen; (B) total phosphorus; (C) chlorophyll-a; (D) total suspended solids; (E) dissolved organic carbon; (F) absorbance coefficient at 254 nm; (G) light attenuation coefficient; and (H) mean available light at the upper mixed layer.
The PAR attenuation coefficient (KdPAR) was higher and the Emean was reduced in P2 when compared to P1. Thus, the average Emean value in the rainy season of P2 was 0.7 times the one found in the same season of P1. The average Emean value in the dry season of P2 was the lowest recorded for both periods and seasons, reflecting the higher concentrations of DOC, TSS, TN, and Chl-a in this season (Figure 3; Supplementary Table S3).
The Brunt–Väisälä frequency in P1 showed a clear seasonal pattern, where the stratification stability decreased in the dry season and increased again in the rainy season (Figures 2E, F). The mixed layer depth followed the same tendency and evidenced two full mixing periods, both during the dry seasons of 2011 and 2012 (Figures 2G, H). However, in P2 the stratification stability was quite variable during the entire period and did not show the same clear seasonal pattern exhibited in P1 (Figure 2). This instability in P2 might indicate a higher susceptibility to occasional mixing events during the entire year and higher variation in the mixed layer depth. This is supported by the greatest coefficient of variation of daily Zmix in P2 in comparison to P1 (64.8% and 40.3%, respectively; CV= SD/mean X 100%). We also noticed the occurrence of occasional mixing events in the P2 rainy season, but not in the P1 rainy season (Figures 2G, H).
All metabolic rates (GPP, R, NEP) at surface waters varied according to the interaction between periods and seasons. Furthermore, epilimnetic R and NEP also varied with the different k600 models (Table 1; refer to Supplementary Material for the number of data points for each period, season, and model - Supplementary Table S2).
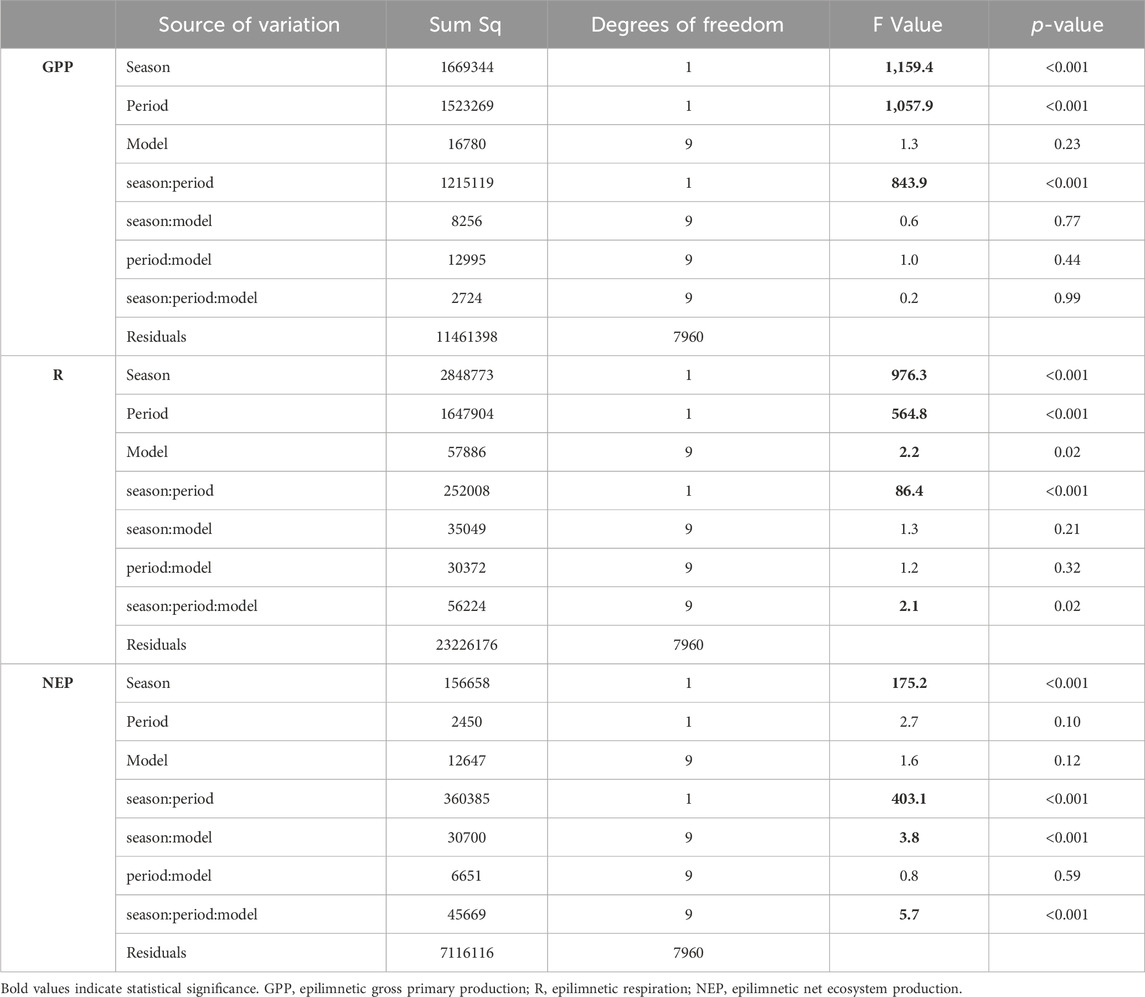
Table 1. Results from the linear regression models testing the effects of periods, seasons, and models (i.e., the different k600 models) and their interactions on the epilimnetic metabolic rates.
Following the increase in nutrients, organic matter, algal biomass, and the decrease in water transparency and light availability, mean epliminetic GPP was 40% higher in P2 than in P1 (81.03 ± 0.60 mmol O2 m-3 d-1 and 58.08 ± 0.74 mmol O2 m-3 d-1, respectively; mean ± standard error). In P1, epilimnetic GPP rates were higher in the dry season than in the rainy season (91.97 ± 1.41 mmol O2 m-3 d-1 and 35.58 ± 0.31 mmol O2 m-3 d-1, respectively). In P2, there was no statistically significant difference in epilimnetic GPP rates between the seasons (82.70 ± 1.54 mmol O2 m-3 d-1 in the dry season and 80.5 ± 0.63 mmol O2 m-3 d-1 in the rainy season). Epilimnetic GPP value in P2 rainy season was quite similar to the P1 dry season (80.5 ± 0.63 mmol O2 m-3 d-1 and 91.97 ± 1.41 mmol O2 m-3 d-1, respectively) (Table 1; Figure 4).
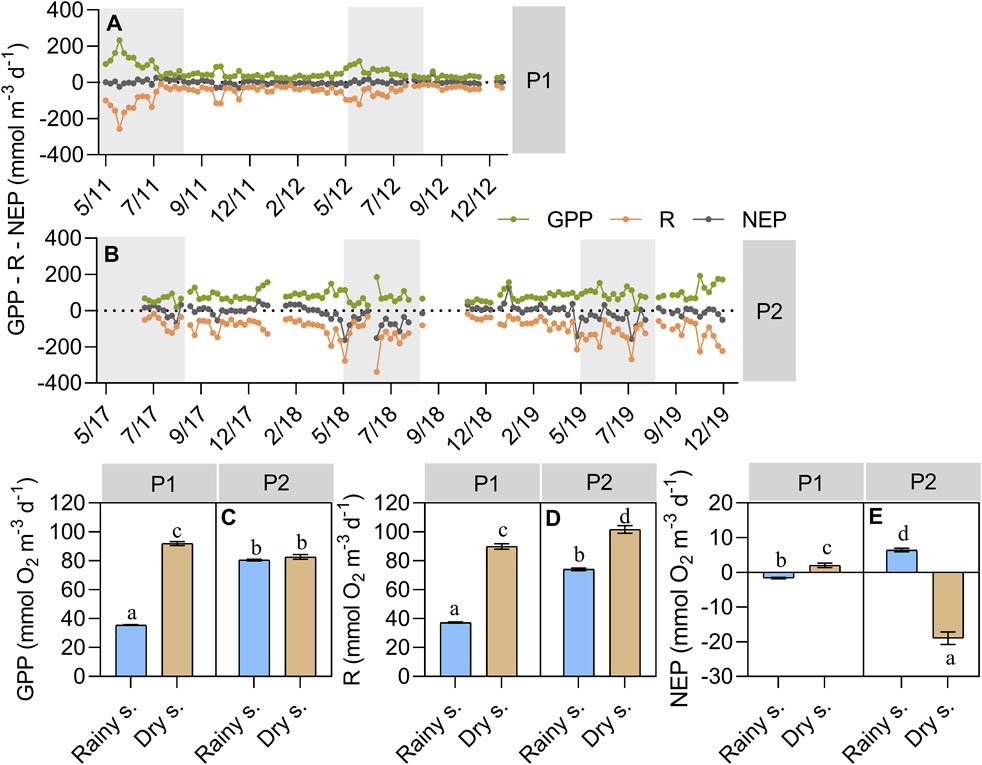
Figure 4. Variation in epilimnetic metabolism estimates of (A) weekly interval of P1 (2011–2012) and (B) P2 (2017–2019); and between periods and seasons for (C) GPP – epilimnetic gross primary production; (D) R – epilimnetic respiration; (E) NEP – epilimnetic net ecosystem production. Grey areas indicate the typical dry season. Bars represent the mean value and error bars represent standard error. Blue bars indicate the rainy season and light brown bars indicate the dry season. Different letters represent significant differences between seasons and periods (p < 0.05), and equal letters represent no significant differences between the groups (p > 0.05).
Mean epiliminetic R also increased in P2 in comparison to P1 (80.71 ± 0.94 mmol O2 m-3 d-1 and 58.26 ± 0.87 mmol O2 m-3 d-1, respectively). There was a difference between the seasons for both periods (Figure 4D), where the highest rates were found in the dry season (89.93 ± 1.79 mmol O2 m-3 d-1 in P1 and 101.68 ± 2.62 mmol O2 m-3 d-1 in P2). The mean R registered in the P2 rainy season was almost two times higher than in the same season of P1 (74.07 ± 0.89 mmol O2 m-3 d-1 and 37.23 ± 0.42 mmol O2 m-3 d-1; Table 1 and Figure 4).
In consequence, epilimnetic NEP shifted from a state near equilibrium (NEP ≈0) in P1 (mean NEP -0.18 ± 0.29 mmol O2 m-3 d-1) to an autotrophy state in the P2 rainy season and a heterotrophy state in the P2 dry season (6.44 ± 0.51 mmol O2 m-3 d-1 and -18.98 ± 1.81 mmol O2 m-3 d-1, respectively; Table 1 and Figure 4), following the higher concentrations of DOC observed in this season.
Although the different k600 models were sources of variation for epilimnetic R and NEP, the main results (i.e., seasonal differences in Figure 4) remained almost the same regardless of the model used. Two exceptions were the bilinear (CWB03) and the power function (CWPF03) of Crusius and Wanninkhof (2003) in which epilimnetic R rates were equal between the rainy and dry season of P2. Regarding epilimnetic NEP, we noticed that k600 as a free parameter was the model responsible for the statistical difference found between the seasons of P1. For the other 9 models tested, no statistical difference between the rainy and dry seasons of P1 was observed. Moreover, epilimnetic R and NEP absolute values were higher than expected in some of the models, especially those that consider other turbulence generating processes besides the wind, mainly during the P2 for both seasons (see Supplementary Figure S3).
Regarding light saturation and photoinhibition occurrence, the index Isat showed the lowest values during the P1 rainy season (Figure 5A), indicating that epilimnetic GPP was more prone to be light limited during this season, when compared to the others. P1 rainy season were also the season when epilimnetic GPP was more prone to experience photoinhibition (lower values of Iinh; Figure 5B). On the other end, epilimnetic GPP during the P2 dry season were less prone to experience photoinhibion than all other seasons followed by the P1 dry season and the P2 rainy season.
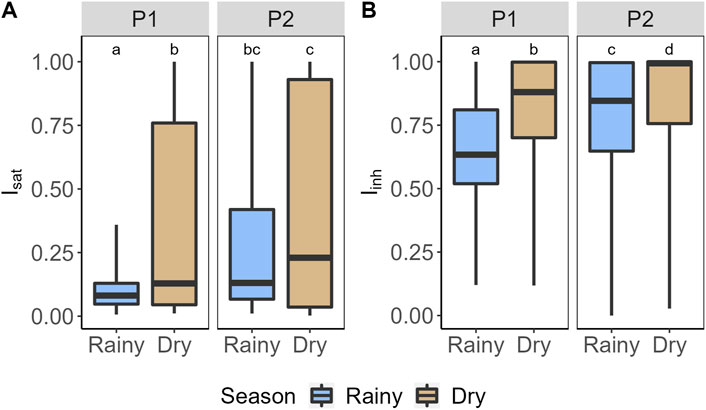
Figure 5. Variation of the (A) light saturation index (Isat) and the (B) photoinhibition index (Iinh) of epilimnetic primary production in Lake Carioca between periods and seasons. Different letters represent significant differences between seasons and periods (p < 0.05), and equal letters represent no significant differences between the groups (p > 0.05). P1 column indicates the 2011–2012 period. P2 column indicates the 2017–2019 period. Blue bars represent the data collected in the rainy season and the light brown represents the data collected in the dry season. Box-plots represent the 25th and 75th percentile and the median.
Between P1 and P2, Lake Carioca suffered an extreme reduction in water levels. During 2014 and 2015, the accumulated rainfall was 29% lower than expected for the region (Supplementary Figure S2), and the dry season extended through the typically rainy months of these years when the meteorological drought led to a hydrological drought (Lake, 2011). This fact, in combination with the higher air temperature, resulted in a process known as evapoconcentration, increasing lake nutrients and DOM due to less dilution (Waiser et al., 2006; Brasil et al., 2016; Mendonça Júnior et al., 2018; Junger et al., 2019). During P2, the precipitation returned to typical values (2017), carrying terrestrial loads of nutrients and DOM into the lake but not refilling the system to its previous volume (Schindler et al., 1997; Chiu et al., 2020). As a result, higher DOC concentrations in P2 were accompanied by higher allochthonous DOM (CDOM254) in the rainy season (r = 0.52, p < 0.001).
In agreement with our expectations, metabolic rates at surface waters were on average higher during the post-drought period (P2) than during the pre-drought (P1), coinciding with the increase in concentrations of nutrients, carbon, light attenuation, and the consequential decrease in light availability in the mixed layer. Furthermore, the effect of seasonality in epilimnetic GPP and R rates during the P2 was lower than in P1, except for NEP. During P1 rainy season, low nutrient availability in combination with the higher light availability and greater levels of photoinhibition in the epilimnion, driven by higher stratification stability, most likely reduced epilimnetic primary production as previously shown by Brighenti et al. (2015). Corroborating to this, we found strong significant negative correlations between epilimnetic GPP and Emean (r = −0.66, p < 0.001) and strong significant positive correlations between epilimnetic GPP and TN (r = 0.62, p < 0.001), while Iinh were negatively correlated to Emean (r = −0.57, p < 0.001) and positively correlated to TN (r = 0.52, p < 0.001), which means that higher levels of apparent photoinhibition occurred during higher Emean and lower TN. However, during the post-drought period (P2), seasonality on epilimnetic GPP was weakened.
The effects of increased DOM in the water column are usually expected to decrease GPP by reducing light availability, while stimulating R, resulting in negative NEP values (i.e., heterotrophy) (Staehr et al., 2010b; Bogard et al., 2020). However, in Lake Carioca, the higher DOC and CDOM254 in P2 most likely stimulated both epilimnetic GPP and R. Higher DOM concentration in the water column might have influenced primary producers, as algal biomass (i.e., Chl-a) peaked at higher DOC concentrations (11.9 mg L-1; r = 0.42, p = 0.008), in agreement with the unimodal curve relationship described by Bergstrom and Karlsson (2019), where algal biomass showed the maximum values at DOC levels around 11 mg L-1. Allochthonous DOM reaches the lake as relatively recalcitrant molecules, however, through biological and/or light-induced mineralization the organic fraction of DOM can become available for the aquatic microbial community (Vähätalo and Wetzel, 2008) releasing nutrients and CO2 to the water column (Jansson et al., 2012), thus enhancing primary production. Furthermore, previous studies show that allochthonous DOM can also increase nutrients concentration by co-exporting and releasing bound nutrients (Kissman et al., 2013; Solomon et al., 2015; Zwart et al., 2016). In fact, TN was positively correlated with DOC concentrations (r = 0.65, p < 0.001) and the higher CDOM254 index (i.e., proxy of allochthonous DOM content) found during the P2 rainy season was accompanied by slightly elevated and more variable concentration of TP (Figure 3B) and TN (r = 0.55, p< 0.001). Furthermore, the rise in epilimnetic GPP and respiration R in P2 occurred in the specific context of a drought cessation. This aligns with prior research indicating that alterations in material loading from the watershed result in qualitative and quantitative changes in lake nutrients and DOM, as well as in metabolic rates at both seasonal and annual scales (Chiu et al., 2020).
Moreover, as light and nutrients are a bottom-up control for algal growth (Reynolds, 2006; Jakobsen et al., 2015), the change in light availability pattern conditioned by the higher content of optically active substances in P2 and increased nutrients concentrations most likely drove the lack of seasonal variation in epilimnetic GPP rates. The 30% reduction in mean light available in the mixed layer during the P2 rainy season and the increased nutrients concentrations (compared to the same season of P1) make the light and nutrients conditions closer to the P1 dry season than to the pre-drought rainy season (P1). In the same way, epilimnetic GPP rates during the P2 rainy season are almost as high as the epilimnetic GPP rates during the P1 dry season, the most productive season of the pre-drought period of the study. This inverse relationship between light availability and primary production in Lake Carioca and other lakes in the same region has been demonstrated in previous observational field studies (Gagliardi et al., 2019) and mesocosm experiments (Brighenti et al., 2018). However, the even higher nutrient concentrations (TN) and light reduction in the P2 dry season did not have the same effect of increasing the epilimnetic GPP rates compared to the P1 dry season and the P2 rainy season. During the P2 dry season, epiliminetic GPP rates are lower than during the P1 dry season despite higher TN levels, lower Emean, and still high Chl-a concentrations. GPP during the P2 dry seasons was also less prone to be photoinhibited and more prone to be light saturated. These findings may be explained by variables not considered in this study, such as phytoplankton composition and stoichiometry (Shao et al., 2023).
Regarding epilimnetic respiration rates, our results showed that R rates increased with epilimnetic GPP in the P2 rainy season and surpassed GPP in the P2 dry season. Regardless of the higher variation of daily mixed layer depth found during P2, most lake mixing events continue to occur during the dry season. Mixing events provide inorganic material to DOM production by primary producers and releases organic substrates from the sediment, which is used by bacteria as an energy source in respiration processes (Staehr and Jensen, 2007). Even though most of the organic carbon trapped in the hypolimnion is comprised of allochthonous material, the elevated amount of autochthonous production in Lake Carioca during P2 can facilitate the degradation and utilization of the recalcitrant DOM pool by the heterotrophic community enhancing respiration rates (i.e., priming effect; Guenet et al., 2010; Townsend et al., 2011). Therefore, with DOC increase, greater bacterial biomass and respiration levels are likely to occur (Tranvik, 1988). In fact, the highest concentrations of DOC were found during the P2 dry season, which, along with autotrophic production, might explain the seasonal variation in R rates.
In relation to the changes in the lake mixing pattern, the effect of the decrease in water level and lake volume can produce two antagonistic results. Water loss can reduce the temperature gradient between surface and deep layers, deepening Zmix (Landkildehus et al., 2014) and increasing the susceptibility to wind-induced mixing events (Fee et al., 1996). However, water loss also increases the concentration of nutrients and carbon due to less dilution, reducing the water transparency and increasing the absorption of solar radiation in the surface waters, thus shortening the mixed layer depth (Read and Rose, 2013; Tsai et al., 2016; Bezerra-Neto et al., 2019). Both processes seem to occur in Lake Carioca but at different moments: occasional mixing events prevailing in the P2 rainy season and shortening of Zmix occurring during the P2 dry season. Although most of the mixing events continued in the dry season, the observed lack of a clear stratification stability pattern in P2 led to the occasional mixing events even during the typical highly stratified rainy season. Thus, the higher variation in Zmix enables the re-entrance of nutrient and carbon-rich bottom waters in the surface optical zone, which reinforces their direct (e.g., algal growth stimulation) and indirect (e.g., lower light availability) effects in metabolic rates (Staehr and Jensen, 2007).
It is expected that variability in epilimnetic GPP and R rates would respond to variability in water temperature (Brown et al., 2004; Yvon-Durocher et al., 2012). Since the activation energy of aerobic respiration is higher than photosynthesis, R is expected to increase more rapidly with increasing temperature than GPP, which leads to lower NEP values (Yvon-Durocher et al., 2017). In our study, considering only the same season (rainy = warmer months; dry = colder months) for comparing P1 and P2, daily average GPP was positive correlated with daily average water temperature (Tw) at depth of the DO sensor (Rainy: r = 0.12, p < 0.01; Dry: r = 0.17, p < 0.01). While daily average R were positive correlated with Tw only when considering dry seasons in P1 and P2 (r = 0.14, p < 0.05). However, temperature dependence of metabolic rates does not explain by itself variability in epilimnetic metabolic rates in Lake Carioca across different season and periods. During P2 dry season, epilimnetic R rates were the highest and water temperature were the lowest across all seasons, leading to the lowest values of NEP.
Finally, the combination of all these changes in lake physical and chemical characteristics influenced the shift in the metabolic balance of Lake Carioca. While during P1 epilimnetic NEP rates were near to equilibrium state with a slight tendency for heterotrophy (NEP = −0.18 ± 0.29; mean ± standard error), during the P2 the lake trophic status switched from a significant autotrophy state in the rainy season to a highly heterotrophic state in the dry season. On the other hand, the elevated epilimnetic GPP found during the P2 rainy season drove the autotrophy in this season, benefiting from the low light conditions due to higher DOC concentration and water color and also by the higher concentration of nutrients (del Giorgio and Peters, 2002; Brighenti et al., 2015). The notable instability observed in both auto- and heterotrophic states appears to stem from eutrophication (Dodds and Cole, 2007), a phenomenon documented in this study. A similar trend was noted in the research by Junger et al. (2019), where eutrophic environments exhibited significant fluctuations in metabolism over time. It is conceivable that this dynamic, characterized by elevated production and accumulation of organic matter, contributes to the fluctuating balance between auto- and heterotrophy, potentially exacerbated by the resuspension of organic matter during periods of low water levels.
The remarkable epilimnetic R rate that was fueled by higher DOC content during the dry season drove epilimnetic NEP towards a more heterotrophic state. Changes in CO2 flux and alternation of autotrophy and heterotrophy periods were previously recorded for Lake Carioca by Reis and Barbosa (2014) through diurnal scale measurements. Furthermore, our results confirm the findings of the mesocosm study by Brighenti et al. (2018), conducted at the same lake of this work, where nutrients and carbon additions strongly enhanced the metabolic rates through a combination of stimulation of algal growth and the decrease of likelihood of apparent photoinhibition. Here, the effect of water loss and the variation in the precipitation pattern turned the DOC levels ∼2 times higher than the concentration used to simulate carbon addition in the experiment (8.6 ± 0.1 µg L-1; mean ± standard deviation), explaining the shift in lake trophic status seen in this study, contrary to the NEP results of the mesocosms study. The pattern of fewer rain events during the rainy season, yet with intense rainfall concentrated within a short timeframe, coupled with significant year-to-year fluctuations in precipitation (such as wet years following prolonged dry periods), leads to a distinct pattern in the influx of allochthonous dissolved organic matter (DOM) into aquatic ecosystems (Hotchkiss and DelSontro, 2024). Following extended droughts, organic matter accumulated in the soil is washed into water bodies in a single large pulse during heavy rainfall events, resulting in elevated levels of DOM available for decomposition in the water column (Suhett et al., 2007).
The influence of air-water exchange term in metabolic estimates is an issue of frequent concern (Staehr et al., 2010a; Dugan et al., 2016). Our study used 10 different equations to estimate the air-water flux exchange component. Although these models did not influence the epilimnetic GPP variability and did not change the general seasonal pattern of epilimnetic R and NEP rates, their magnitude varied among the different k models, mainly during the P2 dry season.
In general, we noticed that higher epilimnetic R and lower NEP rates during P2 occur mostly among the models from MacIntyre et al. (2010), Heiskanen et al. (2014), the combination of the models from Read et al. (2012) and Soloviev et al. (2007), Vachon and Prairie (2013), and by the k600 estimated as a free parameter. All these approaches have in common the fact that they do not consider wind speed as the only factor influencing the air-water exchange. As a tropical, small, shallow, and wind-sheltered lake, diel heating and cooling can be the primary mechanism that drives surface gas exchange, explaining the lack of variability between the wind-based models and the higher absolute values of epilimnetic R and NEP found for the surface renewal models, in agreement with the results of Dugan et al. (2016) for small lakes. Furthermore, these higher values occurred only in a few days, mainly in the dry season, during which most of the lake full-mixing events occurred.
Besides the influence of the models, these higher values could also be a result of oscillations in the DO measured that were captured by the sensors. As cited previously, we found a greater day-to-day variation in the mixed layer depth during the P2 dry season which could be a result of the cooling and heating dynamics (Staehr et al., 2012b). These abrupt and frequent deepening of Zmix could bring oxygen-depleted bottom waters to the surface, causing oscillations in the signal captured by the sensor, which further might result in an overestimation of epilimnetic R and NEP rates. Despite this, it is unlikely that these non-biological sources of noise in the DO measurements affect the daily, weekly, and seasonal metabolic means, being more important at sub-daily timescales (Staehr and Jensen, 2007; Staehr et al., 2010a) that are beyond the scope of this work. To deal with this source of uncertainty: i) we applied smoothing solutions to our dissolved oxygen data (Coloso et al., 2008); ii) the number of days under investigation was elevated (Staehr et al., 2010a); and iii) most of the days with noise in the oxygen measurements, which in fact occurred mostly during the P2 dry season, had a poor model fit (R2 < 0.7) and were not included in the results shown here.
Regarding estimating k600 as a free parameter, this approach had the highest absolute epilimnetic R and NEP rates between all the models. As the primary role of an optimization algorithm is to identify a parameter value that optimally fits the data, allowing k600 as a free parameter may yield a superior fit compared to other models, yet it might not accurately depict the system’s internal processes. Thus, if noisy DO data were incorporated into the modeling process, those few days with higher absolute values of epilimnetic R and NEP could represent an overestimation of these rates, despite our efforts to maintain conservative results.
An alternative approach to improve estimates of the air-water exchanges that were not included in our study relies on estimates turbulence, as rate of dissipation of turbulent kinetic energy, taking into account the relative contributions of wind and the buoyancy flux. However, this approach requires measurements of the turbulent kinetic energy from temperature-gradient microstructure profilers and acoustic Doppler velocimeters (MacIntyre et al., 2021). Another alternative approach to estimate metabolic rates that has been said to mitigate problems with air-water gas exchange is the combination of DO measurements and DO stable isotopes ratio (O18:O16 expressed as δ18ODO) (Dordoni et al., 2022; Piatka, et al., 2022). However, the use of stable isotopes also has limitations, especially regarding to sampling limitations, such as understanding diel isotope variations, since sampling usually occurs around noon (Bogard et al., 2017).
In addition to air-water gas exchange, other physical processes, such as internal waves and heterogeneous turbulent mixing, also affect the dissolved oxygen (DO) signal (Coloso et al., 2008; Coloso et al., 2011). Unlike air-water gas fluxes, these physical processes are more challenging to track and have been less studied in lake metabolism research (Fernández Castro et al., 2021). However, they can significantly impact DO levels, especially in tropical lakes with high evaporation rates and temperature-sensitive density changes (Talling, 1963; Macintyre et al., 2014). To address internal motions impacting oxygen levels, Fernández Castro et al. (2021) proposed two new methods. In the first, the scale-separation technique, they combined a 2-week oxygen budget with spectral methods to differentiate biological signals from physical movements. Smoothing temperature and oxygen data over 15 days revealed seasonal oxygen changes, aiding in understanding oxygen dynamics over the period. In the second method, they directly filtered slow movements’ effects on oxygen levels. Analyzing temperature and oxygen anomalies in daily records, split into 24-h segments, isolated oxygen changes due to vertical movements. This facilitated calculating hourly oxygen changes linked to biological processes. Improving our estimates of air-water gas exchange and incorporating other physical processes into metabolism estimates hold strong promise for better projections and modeling of lake metabolism and, as a result, greater prospects for understanding and anticipating future lake responses to global changes.
Our study corroborates the hypothesis that metabolic rates in the upper mixed layer of a tropical lake changed due to prolonged drought. Although the different models for air-water exchange estimations bring some variation in the estimates of epilimnetic GPP and R, it can be concluded that the reduction in lake water volume followed by the resumption of rainfall has consequences for the metabolism at surface waters of Carioca Lake, enhancing nutrient and DOM concentrations, reducing water transparency and light availability, thus enhancing both epilimneticc GPP and R and weakening the role of seasonality on epilimnetic metabolism. We expect warm monomictic tropical lakes, subject to high evaporation rates, to respond similarly to Carioca Lake. However, our results also lead us to think about the complex mechanisms of ongoing climate change, which imply a complex range of consequences in aquatic ecosystems, depending on different intrinsic characteristics of each system, such as mixing regimes, morphometric features, and surrounding land use. Given that the primary manifestation of climate change in tropical latitudes is the alteration of rainfall regimes (Brêda et al., 2023), understanding the effects on lake metabolism is crucial for predicting and mitigating potential ecological consequences. In light of these findings, further research is warranted to fully understand the complex interplay between climatic factors and lake metabolism, particularly in changing hydrological patterns and their implications for aquatic biogeochemistry and biodiversity conservation.
The raw data supporting the conclusion of this article will be made available by the authors, without undue reservation.
LB: Conceptualization, Data curation, Formal Analysis, Investigation, Methodology, Supervision, Validation, Visualization, Writing–original draft, Writing–review and editing. EV: Conceptualization, Data curation, Formal Analysis, Investigation, Methodology, Validation, Visualization, Writing–original draft, Writing–review and editing. DP: Data curation, Formal Analysis, Investigation, Methodology, Validation, Writing–review and editing. FB: Conceptualization, Funding acquisition, Methodology, Project administration, Resources, Writing–review and editing. JB-N: Conceptualization, Funding acquisition, Investigation, Methodology, Project administration, Resources, Supervision, Writing–review and editing.
The author(s) declare that financial support was received for the research, authorship, and/or publication of this article. This study was funded by Long-Term Ecological Research Project (PELD – Rio Doce, Process No 441481/2016-7 - Conselho Nacional de Desenvolvimento Científico e Tecnológico; CNPq). EV was supported by Coordenação de Aperfeiçoamento de Pessoal de Nível Superior (CAPES; Process No 88887.342111/2019-00). LB received grant from - Conselho Nacional de Desenvolvimento Científico e Tecnológico (CNPq; Process 150960/2018-2).
We thank Anelise Garcia, Marina Bessa and Renata Cristina for their help in the field campaigns and in laboratory analysis. We also thank Thais Silva, Marcelo Costa, and Cid Morais for support in laboratory analysis. We are also grateful for the support by the staff of the Parque Estadual do Rio Doce and for the meteorological data provided by Instituto Nacional de Meteorologia (INMET).
The authors declare that the research was conducted in the absence of any commercial or financial relationships that could be construed as a potential conflict of interest.
All claims expressed in this article are solely those of the authors and do not necessarily represent those of their affiliated organizations, or those of the publisher, the editors and the reviewers. Any product that may be evaluated in this article, or claim that may be made by its manufacturer, is not guaranteed or endorsed by the publisher.
The Supplementary Material for this article can be found online at: https://www.frontiersin.org/articles/10.3389/fgeoc.2024.1393444/full#supplementary-material
Arts, M. T., Robarts, R. D., Kasai, F., Waiser, M. J., Tumber, V. P., Plante, A. J., et al. (2000). The attenuation of ultraviolet radiation in high dissolved organic carbon waters of wetlands and lakes on the northern Great Plains. Limnol. Oceanogr. 45, 292–299. doi:10.4319/lo.2000.45.2.0292
Barbosa, C. C., Calijuri, M. d. C., Anjinho, P. d. S., and dos Santos, A. C. A. (2023). An integrated modeling approach to predict trophic state changes in a large Brazilian reservoir. Ecol. Model. 476, 110227. doi:10.1016/j.ecolmodel.2022.110227
Bergström, A., and Karlsson, J. (2019). Light and nutrient control phytoplankton biomass responses to global change in northern lakes. Glob. Change Biol. 25, 2021–2029. doi:10.1111/gcb.14623
Bezerra-Neto, J. F., Briguenti, L. S., and Pinto-Coelho, R. M. (2010). A new morphometric study of Carioca Lake, Parque estadual do Rio Doce (PERD), Minas Gerais state, Brazil. Acta Sci. Biol. Sci. 32, 49–54. doi:10.4025/actascibiolsci.v32i1.4990
Bezerra-Neto, J. F., Gagliardi, L. M., Brandão, L. P. M., Brighenti, L. S., and Barbosa, F. A. R. (2019). Effects of precipitation on summer epilimnion thickness in tropical lakes. Limnologica 74, 42–50. doi:10.1016/j.limno.2018.10.004
Bogard, M. J., St-Gelais, N. F., Vachon, D., and del Giorgio, P. A. (2020). Patterns of spring/summer open-water metabolism across boreal lakes. Ecosystems 23, 1581–1597. doi:10.1007/s10021-020-00487-7
Bogard, M. J., Vachon, D., St.-Gelais, N. F., and del Giorgio, P. A. (2017). Using oxygen stable isotopes to quantify ecosystem metabolism in northern lakes. Biogeochemistry 133, 347–364. doi:10.1007/s10533-017-0338-5
Bordin, L. H., da Costa Machado, E., Mendes, C. R. B., Fernandes, E. H. L., and de Camargo, M. G. (2024). Total ecosystem metabolism variability in a subtropical lagoonal estuary channel-site. Estuaries Coasts 47, 276–291. doi:10.1007/s12237-023-01270-2
Brandão, L. P. M., Brighenti, L. S., Staehr, P. A., Asmala, E., Massicotte, P., Tonetta, D., et al. (2018). Distinctive effects of allochthonous and autochthonous organic matter on CDOM spectra in a tropical lake. Biogeosciences 15, 2931–2943. doi:10.5194/bg-15-2931-2018
Brasil, J., Attayde, J. L., Vasconcelos, F. R., Dantas, D. D. F., and Huszar, V. L. M. (2016). Drought-induced water-level reduction favors cyanobacteria blooms in tropical shallow lakes. Hydrobiologia 770, 145–164. doi:10.1007/s10750-015-2578-5
Brêda, J. P. L. F., Cauduro Dias de Paiva, R., Siqueira, V. A., and Collischonn, W. (2023). Assessing climate change impact on flood discharge in South America and the influence of its main drivers. J. Hydrology 619, 129284. doi:10.1016/j.jhydrol.2023.129284
Brighenti, L. S., Staehr, P. A., Gagliardi, L. M., Brandão, L. P. M., Elias, E. C., de Mello, N. A. S. T., et al. (2015). Seasonal changes in metabolic rates of two tropical lakes in the atlantic forest of Brazil. Ecosystems 18, 589–604. doi:10.1007/s10021-015-9851-3
Brighenti, L. S., Staehr, P. A., M. Brandão, L. P., Barbosa, F. A. R., and Bezerra-Neto, J. F. (2018). Importance of nutrients, organic matter and light availability on epilimnetic metabolic rates in a mesotrophic tropical lake. Freshw. Biol. 63, 1143–1160. doi:10.1111/fwb.13123
Brown, J. H., Gillooly, J. F., Allen, A. P., Savage, V. M., and West, G. B. (2004). TOWARD A METABOLIC THEORY OF ECOLOGY. Ecology 85, 1771–1789. doi:10.1890/03-9000
Chiu, C.-Y., Jones, J. R., Rusak, J. A., Lin, H.-C., Nakayama, K., Kratz, T. K., et al. (2020). Terrestrial loads of dissolved organic matter drive inter-annual carbon flux in subtropical lakes during times of drought. Sci. Total Environ. 717, 137052. doi:10.1016/j.scitotenv.2020.137052
Cole, J. J., Bade, D. L., Bastviken, D., Pace, M. L., and Van de Bogert, M. (2010). Multiple approaches to estimating air-water gas exchange in small lakes. Limnol. Oceanogr. Methods 8, 285–293. doi:10.4319/lom.2010.8.285
Cole, J. J., and Caraco, N. F. (1998). Atmospheric exchange of carbon dioxide in a low-wind oligotrophic lake measured by the addition of SF6. Limnol. Oceanogr. 43, 647–656. doi:10.4319/lo.1998.43.4.0647
Coloso, J. J., Cole, J. J., Hanson, P. C., and Pace, M. L. (2008). Depth-integrated, continuous estimates of metabolism in a clear-water lake. Can. J. Fish. Aquatic Sci. 65, 712–722. doi:10.1139/f08-006
Coloso, J. J., Cole, J. J., and Pace, M. L. (2011). Short-term variation in thermal stratification complicates estimation of lake metabolism. Aquat. Sci. 73, 305–315. doi:10.1007/s00027-010-0177-0
Crusius, J., and Wanninkhof, R. (2003). Gas transfer velocities measured at low wind speed over a lake. Limnol. Oceanogr. 48, 1010–1017. doi:10.4319/lo.2003.48.3.1010
del Giorgio, P. A., and Duarte, C. M. (2002). Respiration in the open ocean. Nature 420, 379–384. doi:10.1038/nature01165
Dodds, W. K., and Cole, J. J. (2007). Expanding the concept of trophic state in aquatic ecosystems: it’s not just the autotrophs. Aquat. Sci. 69, 427–439. doi:10.1007/s00027-007-0922-1
Dordoni, M., Seewald, M., Rinke, K., Schmidmeier, J., and Barth, J. A. C. (2022). Novel evaluations of sources and sinks of dissolved oxygen via stable isotopes in lentic water bodies. Sci. Total Environ. 838, 156541. doi:10.1016/j.scitotenv.2022.156541
Dugan, H. A., Woolway, R. I., Santoso, A. B., Corman, J. R., Jaimes, A., Nodine, E. R., et al. (2016). Consequences of gas flux model choice on the interpretation of metabolic balance across 15 lakes. Inland Waters 6, 581–592. doi:10.1080/IW-6.4.836
Fee, E. J., Hecky, R. E., Kasian, S. E. M., and Cruikshank, D. R. (1996). Effects of lake size, water clarity, and climatic variability on mixing depths in Canadian Shield lakes. Limnol. Oceanogr. 41, 912–920. doi:10.4319/lo.1996.41.5.0912
Fenner, N., Freeman, C., Hughes, S., and Reynolds, B. (2001). Molecular weight spectra of dissolved organic carbon in a rewetted Welsh peatland and possible implications for water quality. Soil Use Manag. 17, 106–112. doi:10.1111/j.1475-2743.2001.tb00015.x
Fernández Castro, B., Chmiel, H. E., Minaudo, C., Krishna, S., Perolo, P., Rasconi, S., et al. (2021). Primary and net ecosystem production in a large lake diagnosed from high-resolution oxygen measurements. Water Resour. Res. 57. doi:10.1029/2020WR029283
Feuchtmayr, H., Pottinger, T. G., Moore, A., De Ville, M. M., Caillouet, L., Carter, H. T., et al. (2019). Effects of brownification and warming on algal blooms, metabolism and higher trophic levels in productive shallow lake mesocosms. Sci. Total Environ. 678, 227–238. doi:10.1016/j.scitotenv.2019.04.105
Gagliardi, L. M., Brighenti, L. S., Staehr, P. A., Barbosa, F. A. R., and Bezerra-Neto, J. F. (2019). Reduced rainfall increases metabolic rates in upper mixed layers of tropical lakes. Ecosystems 22, 1406–1423. doi:10.1007/s10021-019-00346-0
Gámez, T. E., Groeger, A. W., and Manning, S. R. (2023). Dynamic phytoplankton community structure in a subtropical reservoir during an extended drought, Central Texas, USA. Aquat. Sci. 85, 7. doi:10.1007/s00027-022-00903-1
Guenet, B., Danger, M., Abbadie, L., and Lacroix, G. (2010). Priming effect: bridging the gap between terrestrial and aquatic ecology. Ecology 91, 2850–2861. doi:10.1890/09-1968.1
Hanson, P. C., Carpenter, S. R., Kimura, N., Wu, C., Cornelius, S. P., and Kratz, T. K. (2008). Evaluation of metabolism models for free-water dissolved oxygen methods in lakes. Limnol. Oceanogr. Methods 6, 454–465. doi:10.4319/lom.2008.6.454
Heiskanen, J. J., Mammarella, I., Haapanala, S., Pumpanen, J., Vesala, T., Macintyre, S., et al. (2014). Effects of cooling and internal wave motions on gas transfer coefficients in a boreal lake. Tellus B Chem. Phys. Meteorology 66, 22827. doi:10.3402/tellusb.v66.22827
Hoellein, T. J., Bruesewitz, D. A., and Richardson, D. C. (2013). Revisiting Odum (1956): a synthesis of aquatic ecosystem metabolism. Limnol. Oceanogr. 58, 2089–2100. doi:10.4319/lo.2013.58.6.2089
Hotchkiss, E. R., and DelSontro, T. (2024). “Organic carbon cycling and ecosystem metabolism,” in Wetzel’s Limnology (Amsterdam, Netherlands: Elsevier), 939–997. doi:10.1016/B978-0-12-822701-5.00028-8
Isles, P. D. F., Creed, I. F., Hessen, D. O., Kortelainen, P., Paterson, M., Pomati, F., et al. (2023). Widespread synchrony in phosphorus concentrations in northern lakes linked to winter temperature and summer precipitation. Limnol. Oceanogr. Lett. 8, 639–648. doi:10.1002/lol2.10318
Jahne, B., Munnich, K. O., Bosinger, R., Dutzi, A., Huber, W., and Libner, P. (1987). On the parameters influencing air-water gas exchange. J. Geophys Res. 92, 1937–1949. doi:10.1029/jc092ic02p01937
Jakobsen, H. H., Blanda, E., Staehr, P. A., Højgård, J. K., Rayner, T. A., Pedersen, M. F., et al. (2015). Development of phytoplankton communities: implications of nutrient injections on phytoplankton composition, pH and ecosystem production. J. Exp. Mar. Biol. Ecol. 473, 81–89. doi:10.1016/j.jembe.2015.08.011
Jansson, M., Karlsson, J., and Jonsson, A. (2012). Carbon dioxide supersaturation promotes primary production in lakes. Ecol. Lett. 15, 527–532. doi:10.1111/j.1461-0248.2012.01762.x
Jennings, E., Järvinen, M., Allott, N., Arvola, L., Moore, K., Naden, P., et al. (2009). “Impacts of climate on the flux of dissolved organic carbon from catchments,” in The impact of climate change on European lakes (Dordrecht: Springer Netherlands), 199–220. doi:10.1007/978-90-481-2945-4_12
Jeppesen, E., Brucet, S., Naselli-Flores, L., Papastergiadou, E., Stefanidis, K., Nõges, T., et al. (2015). Ecological impacts of global warming and water abstraction on lakes and reservoirs due to changes in water level and related changes in salinity. Hydrobiologia 750, 201–227. doi:10.1007/s10750-014-2169-x
Jones, R. I. (1992). The influence of humic substances on lacustrine planktonic food chains. Hydrobiologia 229, 73–91. doi:10.1007/BF00006992
Jørgensen, S. E. (1979) Handbook of Environmental data and ecological parameters. Copenhagen: National society for Ecological Modelling. Available at: https://www.sciencedirect.com/science/book/9780080234366.
Jovem-Azevêdo, D., Bezerra-Neto, J. F., Azevêdo, E. L., Gomes, W. I. A., Molozzi, J., and Feio, M. J. (2019). Dipteran assemblages as functional indicators of extreme droughts. J. Arid Environ. 164, 12–22. doi:10.1016/j.jaridenv.2019.01.014
Junger, P. C., Dantas, F. d. C. C., Nobre, R. L. G., Kosten, S., Venticinque, E. M., Araújo, F. d. C., et al. (2019). Effects of seasonality, trophic state and landscape properties on CO2 saturation in low-latitude lakes and reservoirs. Sci. Total Environ. 664, 283–295. doi:10.1016/j.scitotenv.2019.01.273
Keren, N., and Krieger-Liszkay, A. (2011). Photoinhibition: molecular mechanisms and physiological significance. Physiol. Plant. 142, 1–5. doi:10.1111/j.1399-3054.2011.01467.x
Kissman, C. E. H., Williamson, C. E., Rose, K. C., and Saros, J. E. (2013). Response of phytoplankton in an alpine lake to inputs of dissolved organic matter through nutrient enrichment and trophic forcing. Limnol. Oceanogr. 58, 867–880. doi:10.4319/lo.2013.58.3.0867
Klaus, M., and Vachon, D. (2020). Challenges of predicting gas transfer velocity from wind measurements over global lakes. Aquat. Sci. 82, 53. doi:10.1007/s00027-020-00729-9
Landkildehus, F., Søndergaard, M., Beklioglu, M., Adrian, R., Angeler, D. G., Hejzlar, J., et al. (2014). Climate change effects on shallow lakes: design and preliminary results of a cross-European climate gradient mesocosm experiment. Est. J. Ecol. 63, 71. doi:10.3176/eco.2014.2.02
Lathrop, R. C. (2007). Perspectives on the eutrophication of the Yahara lakes. Lake Reserv. Manag. 23, 345–365. doi:10.1080/07438140709354023
Long, M. H., Rheuban, J. E., Berg, P., and Zieman, J. C. (2012). A comparison and correction of light intensity loggers to photosynthetically active radiation sensors. Limnol. Oceanogr. Methods 10, 416–424. doi:10.4319/lom.2012.10.416
MacIntyre, S., Bastviken, D., Arneborg, L., Crowe, A. T., Karlsson, J., Andersson, A., et al. (2021). Turbulence in a small boreal lake: consequences for air–water gas exchange. Limnol. Oceanogr. 66, 827–854. doi:10.1002/lno.11645
MacIntyre, S., Jonsson, A., Jansson, M., Aberg, J., Turney, D. E., and Miller, S. D. (2010). Buoyancy flux, turbulence, and the gas transfer coefficient in a stratified lake. Geophys. Res. Lett. 37. n/a-n/a. doi:10.1029/2010GL044164
MacIntyre, S., Romero, J. R., Silsbe, G. M., and Emery, B. M. (2014). Stratification and horizontal exchange in Lake victoria, east africa. Limnol. Oceanogr. 59, 1805–1838. doi:10.4319/lo.2014.59.6.1805
Mackereth, F. J. H., Heron, J., and Talling, J. F. (1978) Water analysis and some revised methods for limnologists. London, England: Freshwater Biological Association.
McNair, J. N., Gereaux, L. C., Weinke, A. D., Sesselmann, M. R., Kendall, S. T., and Biddanda, B. A. (2013). New methods for estimating components of lake metabolism based on free-water dissolved-oxygen dynamics. Ecol. Model. 263, 251–263. doi:10.1016/j.ecolmodel.2013.05.010
Mendonça Júnior, J. R. de, Amado, A. M., Vidal, L. d. O., Mattos, A., and Becker, V. (2018). Extreme droughts drive tropical semi-arid eutrophic reservoirs towards CO2 sub-saturation. Acta Limnol. Bras. 30. doi:10.1590/s2179-975x1517
Mosley, L. M. (2015). Drought impacts on the water quality of freshwater systems; review and integration. Earth-Science Rev. 140, 203–214. doi:10.1016/j.earscirev.2014.11.010
Mziray, P., Kimirei, I. A., Staehr, P. A., Lugomela, C. V., Perry, W. L., Trolle, D., et al. (2018). Seasonal patterns of thermal stratification and primary production in the northern parts of Lake Tanganyika. J. Gt. Lakes. Res. 44, 1209–1220. doi:10.1016/j.jglr.2018.08.015
Petrucio, M. M., Barbosa, F. A. R., and Furtado, A. L. S. (2006). Bacterioplankton and phytoplankton production in seven lakes in the Middle Rio Doce basin, south-east Brazil. Limnologica 36, 192–203. doi:10.1016/j.limno.2006.05.001
Piatka, D. R., Venkiteswaran, J. J., Uniyal, B., Kaule, R., Gilfedder, B., and Barth, J. A. C. (2022). Dissolved oxygen isotope modelling refines metabolic state estimates of stream ecosystems with different land use background. Sci. Rep. 12, 10204. doi:10.1038/s41598-022-13219-9
Platt, T., Gallegos, C. L., and Harrison, W. G. (1980). Photoinhibition of photosynthesis in natural assemblages of marine phytoplankton. J. Mar. Res. 38, 687–701.
Read, J. S., Hamilton, D. P., Desai, A. R., Rose, K. C., MacIntyre, S., Lenters, J. D., et al. (2012). Lake-size dependency of wind shear and convection as controls on gas exchange. Geophys. Res. Lett. 39. n/a-n–a. doi:10.1029/2012GL051886
Read, J. S., and Rose, K. C. (2013). Physical responses of small temperate lakes to variation in dissolved organic carbon concentrations. Limnol. Oceanogr. 58, 921–931. doi:10.4319/lo.2013.58.3.0921
Reis, P., and Barbosa, F. (2014). Diurnal sampling reveals significant variation in CO2 emission from a tropical productive lake. Braz. J. Biol. 74, S113–S119. doi:10.1590/1519-6984.01713
Rigotti, J. A., Carvalho, J. M., Soares, L. M. V., Barbosa, C. C., Pereira, A. R., Duarte, B. P. S., et al. (2023). Effects of hydrological drought periods on thermal stability of Brazilian reservoirs. Water (Basel) 15, 2877. doi:10.3390/w15162877
Rose, K. C. (2024). “Light in inland waters,” in Wetzel’s Limnology (Amsterdam, Netherlands: Elsevier), 75–94. doi:10.1016/B978-0-12-822701-5.00006-9
Schindler, D. W., Curtis, P. J., Bayley, S. E., Parker, B. R., Beaty, K. G., and Stainton, M. P. (1997). Climate-induced changes in the dissolved organic carbon budgets of boreal lakes. Biogeochemistry 36, 9–28. doi:10.1023/A:1005792014547
Shao, M., Liu, Z., Sun, H., Lai, C., Ma, Z., He, X., et al. (2023). C-N-P driven changes to phytoplankton community structure and gross primary productivity in river-fed reservoir ecosystems on the Chinese Loess Plateau. J. Hydrology 616, 128781. doi:10.1016/j.jhydrol.2022.128781
Sherbo, B. A. H., Tonin, J., Paterson, M. J., Hann, B. J., Kozak, J., and Higgins, S. N. (2023). The effects of terrestrial dissolved organic matter on phytoplankton biomass and productivity in boreal lakes. Freshw. Biol. 68, 2109–2119. doi:10.1111/fwb.14178
Solomon, C. T., Bruesewitz, D. A., Richardson, D. C., Rose, K. C., Van de Bogert, M. C., Hanson, P. C., et al. (2013). Ecosystem respiration: drivers of daily variability and background respiration in lakes around the globe. Limnol. Oceanogr. 58, 849–866. doi:10.4319/lo.2013.58.3.0849
Solomon, C. T., Jones, S. E., Weidel, B. C., Buffam, I., Fork, M. L., Karlsson, J., et al. (2015). Ecosystem consequences of changing inputs of terrestrial dissolved organic matter to lakes: current knowledge and future challenges. Ecosystems 18, 376–389. doi:10.1007/s10021-015-9848-y
Soloviev, A., Donelan, M., Graber, H., Haus, B., and Schlüssel, P. (2007). An approach to estimation of near-surface turbulence and CO2 transfer velocity from remote sensing data. J. Mar. Syst. 66, 182–194. doi:10.1016/j.jmarsys.2006.03.023
Staehr, P. A., Baastrup-Spohr, L., Sand-Jensen, K., and Stedmon, C. (2012a). Lake metabolism scales with lake morphometry and catchment conditions. Aquat. Sci. 74, 155–169. doi:10.1007/s00027-011-0207-6
Staehr, P. A., Bade, D., Van de Bogert, M. C., Koch, G. R., Williamson, C., Hanson, P., et al. (2010a). Lake metabolism and the diel oxygen technique: state of the science. Limnol. Oceanogr. Methods 8, 628–644. doi:10.4319/lom.2010.8.0628
Staehr, P. A., Brighenti, L. S., Honti, M., Christensen, J., and Rose, K. C. (2016). Global patterns of light saturation and photoinhibition of lake primary production. Inland Waters 6, 593–607. doi:10.1080/IW-6.4.888
Staehr, P. A., Christensen, J. P. A., Batt, R. D., and Read, J. S. (2012b). Ecosystem metabolism in a stratified lake. Limnol. Oceanogr. 57, 1317–1330. doi:10.4319/lo.2012.57.5.1317
Staehr, P. A., and Sand-Jensen, K. (2007). Temporal dynamics and regulation of lake metabolism. Limnol. Oceanogr. 52, 108–120. doi:10.4319/lo.2007.52.1.0108
Staehr, P. A., Sand-Jensen, K., Raun, A. L., Nilsson, B., and Kidmose, J. (2010b). Drivers of metabolism and net heterotrophy in contrasting lakes. Limnol. Oceanogr. 55, 817–830. doi:10.4319/lo.2009.55.2.0817
Staehr, P. A., Testa, J. M., Kemp, W. M., Cole, J. J., Sand-Jensen, K., and Smith, S. V. (2012c). The metabolism of aquatic ecosystems: history, applications, and future challenges. Aquat. Sci. 74, 15–29. doi:10.1007/s00027-011-0199-2
Suhett, A. L., Amado, A. M., Enrich-Prast, A., Esteves, F. d. A., and Farjalla, V. F. (2007). Seasonal changes of dissolved organic carbon photo-oxidation rates in a tropical humic lagoon: the role of rainfall as a major regulator. Can. J. Fish. Aquatic Sci. 64, 1266–1272. doi:10.1139/f07-103
Talling, J. F. (1963). Origin of stratification in an African rift lake. Limnol. Oceanogr. 8, 68–78. doi:10.4319/lo.1963.8.1.0068
Thrane, J.-E., Hessen, D. O., and Andersen, T. (2014). The absorption of light in lakes: negative impact of dissolved organic carbon on primary productivity. Ecosystems 17, 1040–1052. doi:10.1007/s10021-014-9776-2
Townsend, S. A., Webster, I. T., and Schult, J. H. (2011). Metabolism in a groundwater-fed river system in the Australian wet/dry tropics: tight coupling of photosynthesis and respiration. J. North Am. Benthol. Soc. 30, 603–620. doi:10.1899/10-066.1
Tranvik, L. J. (1988). Availability of dissolved organic carbon for planktonic bacteria in oligotrophic lakes of differing humic content. Microb. Ecol. 16, 311–322. doi:10.1007/BF02011702
Tsai, J.-W., Kratz, T. K., Rusak, J. A., Shih, W.-Y., Liu, W.-C., Tang, S.-L., et al. (2016). Absence of winter and spring monsoon changes water level and rapidly shifts metabolism in a subtropical lake. Inland Waters 6, 436–448. doi:10.1080/IW-6.3.844
Vachon, D., and Prairie, Y. T. (2013). The ecosystem size and shape dependence of gas transfer velocity versus wind speed relationships in lakes. Can. J. Fish. Aquatic Sci. 70, 1757–1764. doi:10.1139/cjfas-2013-0241
Vähätalo, A. V., and Wetzel, R. G. (2008). Long-term photochemical and microbial decomposition of wetland-derived dissolved organic matter with alteration of 13C:12C mass ratio. Limnol. Oceanogr. 53, 1387–1392. doi:10.4319/lo.2008.53.4.1387
Waiser, M. J. (2006). Relationship between hydrological characteristics and dissolved organic carbon concentration and mass in northern prairie wetlands using a conservative tracer approach. J. Geophys. Res. Biogeosciences 111. doi:10.1029/2005JG000088
Weiss, R. F. (1970). The solubility of nitrogen, oxygen and argon in water and seawater. Deep Sea Res. Oceanogr. Abstr. 17, 721–735. doi:10.1016/0011-7471(70)90037-9
Williamson, C. E., Saros, J. E., Vincent, W. F., and Smol, J. P. (2009). Lakes and reservoirs as sentinels, integrators, and regulators of climate change. Limnol. Oceanogr. 54, 2273–2282. doi:10.4319/lo.2009.54.6_part_2.2273
Winslow, L. A., Zwart, J. A., Batt, R. D., Dugan, H. A., Woolway, R. I., Corman, J. R., et al. (2016). LakeMetabolizer: an R package for estimating lake metabolism from free-water oxygen using diverse statistical models. Inland Waters 6, 622–636. doi:10.1080/IW-6.4.883
Woolway, R. I., Kraemer, B. M., Lenters, J. D., Merchant, C. J., O’Reilly, C. M., and Sharma, S. (2020). Global lake responses to climate change. Nat. Rev. Earth Environ. 1, 388–403. doi:10.1038/s43017-020-0067-5
Yvon-Durocher, G., Caffrey, J. M., Cescatti, A., Dossena, M., Giorgio, P. del, Gasol, J. M., et al. (2012). Reconciling the temperature dependence of respiration across timescales and ecosystem types. Nature 487, 472–476. doi:10.1038/nature11205
Yvon-Durocher, G., Hulatt, C. J., Woodward, G., and Trimmer, M. (2017). Long-term warming amplifies shifts in the carbon cycle of experimental ponds. Nat. Clim. Change 7, 209–213. doi:10.1038/nclimate3229
Zou, W., Zhu, G., Xu, H., Zhu, M., Zhang, Y., and Qin, B. (2022). Temporal dependence of chlorophyll a–nutrient relationships in Lake Taihu: drivers and management implications. J. Environ. Manag. 306, 114476. doi:10.1016/j.jenvman.2022.114476
Zwart, J. A., and Brighenti, L. S. (2021). “Measurement and variability of Lake metabolism,” in Reference module in Earth systems and environmental sciences (Amsterdam, Netherlands: Elsevier), 1–11. doi:10.1016/B978-0-12-819166-8.00029-3
Keywords: water loss, lake volume, trophic status, climate change, high frequency data, inverse modeling approach
Citation: Brighenti LS, Viana EAP, Pujoni DGF, Barbosa FAR and Bezerra-Neto JF (2024) Post-drought leads to increasing metabolic rates in the surface waters of a natural tropical lake. Front. Geochem. 2:1393444. doi: 10.3389/fgeoc.2024.1393444
Received: 29 February 2024; Accepted: 17 April 2024;
Published: 22 May 2024.
Edited by:
Presentación Carrillo, University of Granada, SpainReviewed by:
Fajin Chen, Guangdong Ocean University, ChinaCopyright © 2024 Brighenti, Viana, Pujoni, Barbosa and Bezerra-Neto. This is an open-access article distributed under the terms of the Creative Commons Attribution License (CC BY). The use, distribution or reproduction in other forums is permitted, provided the original author(s) and the copyright owner(s) are credited and that the original publication in this journal is cited, in accordance with accepted academic practice. No use, distribution or reproduction is permitted which does not comply with these terms.
*Correspondence: José Fernandes Bezerra-Neto, am9zZW5ldG8udWZtZ0BnbWFpbC5jb20=
†These authors have contributed equally to this work and share first authorship
Disclaimer: All claims expressed in this article are solely those of the authors and do not necessarily represent those of their affiliated organizations, or those of the publisher, the editors and the reviewers. Any product that may be evaluated in this article or claim that may be made by its manufacturer is not guaranteed or endorsed by the publisher.
Research integrity at Frontiers
Learn more about the work of our research integrity team to safeguard the quality of each article we publish.