 Julia E. Greenwald
 Mervin Zhao
 Douglas A. Wicks
- 1Advanced Research Projects Agency—Energy, U.S. Department of Energy, Washington, DC, United States
- 2Booz Allen Hamilton, McLean, VA, United States
Hydrogen (H2) is widely viewed as critical to the decarbonization of industry and transportation. Water electrolysis powered by renewable electricity, commonly referred to as green H2, can be used to generate H2 with low carbon dioxide emissions. Herein, we analyze the critical mineral and energy demands associated with green H2 production under three different hypothetical future demand scenarios, ranging from 100–1,000 Mtpa H2. For each scenario, we calculate the critical mineral demands required to build water electrolyzers (i.e., electrodes and electrolyte) and to build dedicated or additional renewable electricity sources (i.e., wind and solar) to power the electrolyzers. Our analysis shows that scaling electrolyzer and renewable energy technologies that use platinum group metals and rare earth elements will likely face supply constraints. Specifically, larger quantities of lanthanum, yttrium, or iridium will be needed to increase electrolyzer capacity and even more neodymium, silicon, zinc, molybdenum, aluminum, and copper will be needed to build dedicated renewable electricity sources. We find that scaling green H2 production to meet projected net-zero targets will require ∼24,000 TWh of dedicated renewable energy generation, which is roughly the total amount of solar and wind projected to be on the grid in 2050 according to some energy transition models. In summary, critical mineral constraints may hinder the scaling of green H2 to meet global net-zero emissions targets, motivating the need for the research and development of alternative, low-emission methods of generating H2.
1 Introduction
Hydrogen (H2) is widely viewed as critical to the decarbonization of industry and transportation. Currently ∼100 million tonnes per annum (Mtpa) of H2 are produced globally (IEA, 2023a), the primary uses of which are petroleum refining, fertilizer production, and oxygen (O2) scavenging in metal treatments (Ramachandran and Menon, 1998; IRENA, 2018; EIA, 2023). Many proposed decarbonization strategies rely on expanding the uses of H2 to include use as a chemical reductant in industrial sectors, such as steel refining, and as a chemical fuel for heavy-duty transportation and shipping, either directly via fuel cells or indirectly via ammonia (Hydrogen Council, McKinsey & Company, 2021; IEA, 2023b). However, the majority of H2 is currently produced from fossil-based feedstocks, such as steam methane reforming (∼60 Mtpa) or coal gasification (∼20 Mtpa), which yields a carbon footprint of ∼10–20 kg carbon dioxide equivalent (CO2eq)/kg H2 (IEA, 2023b) and ∼900 Mtpa of direct CO2 emissions. Developing low-emission methods of producing H2 and scaling the total volume of H2 produced are required to realize significant CO2 abatement via new H2-related applications. Water electrolysis powered by renewable electricity, commonly referred to as “green hydrogen”, is one method of generating H2 with low CO2 emissions. Although water electrolysis has historically been associated with higher costs (van Renssen, 2020; Yu et al., 2021), it is generally considered the most viable technology for producing low-emission H2 and reaching net-zero emissions targets by 2050 (Castelvecchi, 2022; IRENA, 2022; IEA, 2023a). More than 40 governments around the world have H2 strategies in place and many offer incentives for green H2 production to make it more cost competitive with fossil-based production methods (DOE, 2023a; IEA, 2023a).
Herein, we analyze the critical mineral and energy demands associated with green H2 production. We use the term “critical minerals” to refer to all “critical materials for energy,” as defined by the United States Energy Act of 2020 (Bauer et al., 2023). This definition includes elemental metals, alloys, and natural minerals, though the following analysis mostly focuses on elemental metals. We include both the minerals required to construct dedicated renewable electricity sources (Figure 1A) and the minerals required for water electrolyzers (Figure 1B). In this analysis, we consider the following three scenarios for future green H2 demand:
(1) 100 Mtpa, corresponding to an “existing uses” (or “business as usual”) case where green H2 production displaces current, fossil-based H2 production for existing uses and applications (Hydrogen Council, McKinsey & Company, 2023):
(2) 500 Mtpa, corresponding to a “net-zero” case with increased demand and applications for H2. This is based on the average projected demand for H2 in 2050 according to the International Energy Agency (IEA)’s Net Zero Roadmaps (IEA, 2021a; 2023b), which forecast that H2 will primarily be produced via renewable electricity in 2050.
(3) 1,000 Mtpa, corresponding to a hypothetical “high growth” scenario where increased H2 production could significantly transform the energy landscape, i.e., H2 could potentially be widely used as a fuel and replace natural gas. In this scenario, H2 plays a more significant role in energy storage and transportation as total demand reaches the gigatonne scale (Energy Transitions Commission, 2020; Oliveira et al., 2021).
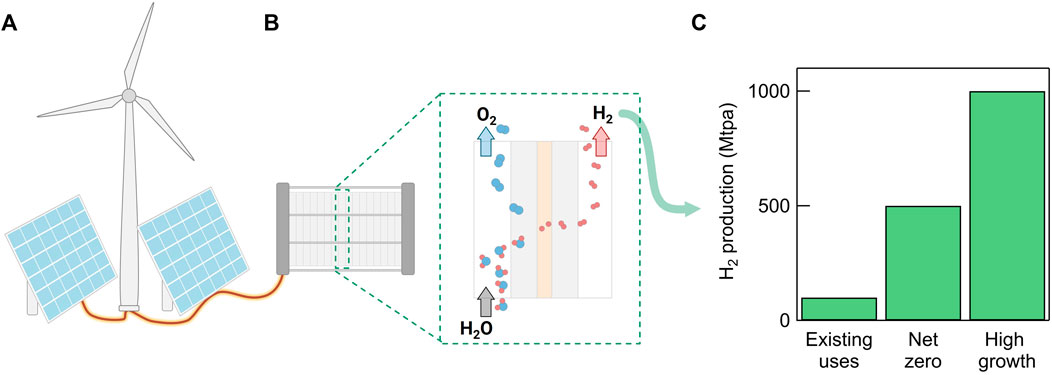
FIGURE 1. Schematic of green hydrogen production and the future demand scenarios considered in this paper. (A) Renewable electricity produced via wind and solar is used to power (B) electrolyzers which split water into H2 and O2. (C) Bar graph displaying the three scenarios considered in this paper: (1) “Existing uses” = 100 Mtpa, corresponding to a “business as usual” case where green H2 production displaces current, fossil-based H2 production for existing applications. (2) “Net zero” = 500 Mtpa, roughly corresponding to the IEA’s projections for H2 demand in 2050. (3) “High growth” = 1,000 Mtpa, corresponding to a hypothetical high growth case where H2 can significantly transform the energy landscape.
2 Water electrolyzer analysis
Water electrolyzer technologies use metallic electrode catalysts to convert water into H2 and O2 under an applied electrical current. Alkaline water electrolysis (AE) and solid oxide electrolysis cells (SOEC) also use metal oxides in electrochemical separators. Significant research efforts have been devoted to increasing electrolyzer efficiency and the discovery of new materials for electrolysis technology (Roger et al., 2017; Hauch et al., 2020; Tong et al., 2020; Chatenet et al., 2022). The first commercial water electrolysis technology to be developed was AE. While AE is relatively inexpensive and typically uses nickel (Ni) catalysts and modern separators comprising zirconium dioxide (ZrO2) in a polysulfone matrix, the limited current density, gas crossover, and corrosion of the Ni-based electrodes led to the development of membrane-based electrolysis. In proton exchange membrane (PEM) electrolysis, a solid polymer electrolyte composed of perfluorosulfonic acids (PFSAs) is directly integrated with the electrodes. While PEM allows for higher current densities and increased H2 purity, PEM uses platinum group metals (PGMs, e.g., platinum, Pt, palladium, Pd, and iridium, Ir) as electrode catalysts, making the raw materials more expensive than those required for AE. Both AE and PEM operate at relatively low temperatures (<100°C) compared to SOECs, which operate at temperatures >700°C. SOECs may enable higher efficiency H2 production (Ni et al., 2008), but require transition metals and rare earth elements (REEs). Typically, SOEC electrodes are made from composites of Ni with yttrium (Y)-stabilized-zirconia and use strontium (Sr)-doped lanthanum (La)-based manganese (Mn) or iron (Fe) oxides as separator materials.
We assess the demand for select minerals used in the aforementioned electrolyzers (AE, PEM and SOEC) in Figure 2, according to the three H2 production scenarios described above. The selected metals are essential to each technology’s performance and currently cannot be easily substituted. We use reported levelized mineral demands (IEA, 2021b) and assume each electrolyzer supplies 100% of global green H2 demand. Each electrolyzer type is assumed to operate at the system efficiency targets set by the U.S. Department of Energy: 45 kWh/kgH2 for AE (DOE, 2023b) and PEM (DOE, 2023c), and 40 kWh/kgH2 for SOEC (DOE, 2023d). We approximate the total mineral quantities required for each H2 demand scenario following Eq. 1:
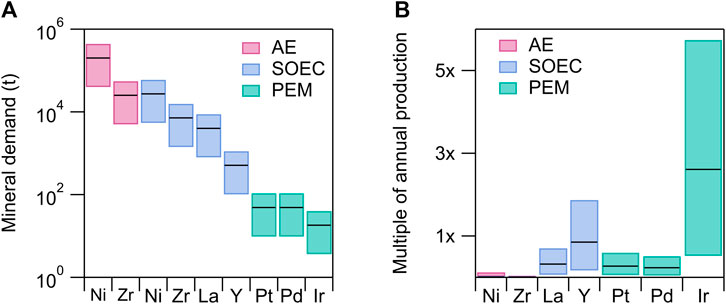
FIGURE 2. For each floating bar, the lower and upper limits correspond to the quantity of H2 required for the “existing uses” (100 Mtpa) and “high growth” (1,000 Mtpa) scenarios, respectively. Black lines correspond to the “net zero” (500 Mtpa) scenario (defined in Figure 1C). (A) Total mineral demand required to produce 100–1,000 Mt H2 using different electrolyzer technologies: Alkaline water electrolyzers, AE (pink), solid oxide electrolysis cells, SOEC (blue) and proton exchange membranes, PEM (green). Values are calculated according to Eq. 1 assuming the levelized mineral demand for each technology (IEA, 2021b) and target electrolyzer efficiencies of 45 kWh/kg H2 for AE (DOE, 2023b) and PEM (DOE, 2023c), and 40 kWh/kg H2 for SOEC (DOE, 2023d). (B) Mineral demand normalized to annual, global production values (USGS, 2023). Note that in (B) the AE and SOEC values for Ni and Zr are stacked on top of each other but are too small to be observed on the linear scale shown.
PEM electrolyzers require the least amount of raw material, requiring less than 500 tonnes of PGMs to generate total anticipated electrolyzer capacity (Figure 2A), even in the “high growth” scenario (1,000 Mtpa H2). However as all current PEM technologies rely on PGMs, PEM becomes the most resource constrained (Figure 2B) when demand is normalized to current global annual production values (USGS, 2023). Even under the “existing uses” scenario (100 Mtpa H2), half of all annual global Ir production is needed to build sufficient PEM electrolyzer capacity. We acknowledge that the electrolyzers would only need to be built once, yet we are normalizing to mineral production on a per annum basis. However since green H2 currently accounts for less than 1% of global H2 production (IEA, 2023a), the projected growth of PEM electrolyzers would represent new demand for Ir and other PGMs. Scaling PEM electrolyzers to the “net zero” or “high growth” scenarios would result in vastly higher (∼2.5–5×) Ir demand. The high cost of PGMs will likely lead to PEM being more expensive than other electrolyzer technologies. In addition, potential regulations and restrictions surrounding the production of fluorinated compounds, such as PFSAs (Lim, 2023), increase the uncertainty of PEM as a long-term technology solution for water electrolysis.
Current SOEC technologies are potentially constrained by two REEs, La and Y (Figure 2). The limited distribution of REE reserves, challenges associated with separating and purifying specific minerals, and increasing competing demand for these elements from other clean energy technologies make scaling SOECs to meet higher H2 demands potentially difficult. Compared to PEM and SOECs, AE is the least resource constrained, as it requires only a small fraction of total Ni and Zr annual production. However, AE is the most resource intensive in terms of the total tonnage of materials required, representing potentially a higher CO2 footprint associated with producing the materials for these electrolyzers (Azadi et al., 2020). Our findings suggest securing sufficient PGMs and REEs will be a key challenge to scaling green H2 production and are consistent with recent analysis of U.S. electrolyzer supply chain vulnerabilities (Badgett et al., 2022).
Technological improvements, such as anion exchange membrane (AEM)-based electrolysis, may alleviate some of these potential supply constraints. AEM electrolysis combines the inexpensive and more abundant mineral benefits of AE with the efficiencies of PEM, making it an attractive electrolysis technology under development (Du et al., 2022). While AEM device lifetimes are currently less than those of AE and PEM (Mustain et al., 2020), active research into improving membrane stability and recovering metals from degraded devices may make AEM a viable path for future water electrolyzers with low mineral demands and high performance. On the other hand, regardless of electrolyzer technology, system efficiency is limited by the thermodynamic limit of ∼39 kWh/kg H2, assuming standard temperature and pressure (Levene et al., 2007).
3 Renewable electricity analysis
We next consider the mineral demands that arise from building dedicated renewable electricity sources to power water electrolyzers. Currently, water electrolysis using the existing, fossil-based global grid can produce greater CO2 emissions than directly producing H2 from fossil fuels (IEA, 2023c). Therefore, either “behind-the-meter” renewable systems, i.e., electrolyzers directly connected to renewable electricity sources, or an electrical grid based solely on a renewable mix are required to enable low-emission water electrolysis. For simplicity, we assume a hypothetical future energy supply comprising equal parts solar, onshore wind, and offshore wind. We calculate the capacity factor (CF) for each electricity source by taking the ratio of 2021 global generation (GWh) to 2021 global capacity (GW), as shown in Eq. 2 (IRENA, 2023a). This yields global CFs of 14%, 25%, and 29% for solar, onshore wind, and offshore wind, respectively. These CFs agree with global and regional analyses (Tong et al., 2021; Bolson et al., 2022), though higher CFs can be achieved in select regions. For example, in Chile’s Atacama Desert >30% CF can be achieved with standard photovoltaics and >80% with concentrated solar power (Gallardo et al., 2021), and >50% CF can be achieved for offshore wind in Scotland (Carreno-Madinabeitia et al., 2021).
Assuming a target system efficiency of 45 kWh/kg H2, total mineral demand (Figures 3A,B) is calculated by multiplying the levelized mineral demands for solar and wind (IEA, 2021c) by the energy demand required for each H2 scenario, as given in Eq. 3. Offshore and onshore wind are binned together as they share similar mineral requirements, though the quantities required for specific minerals may vary.
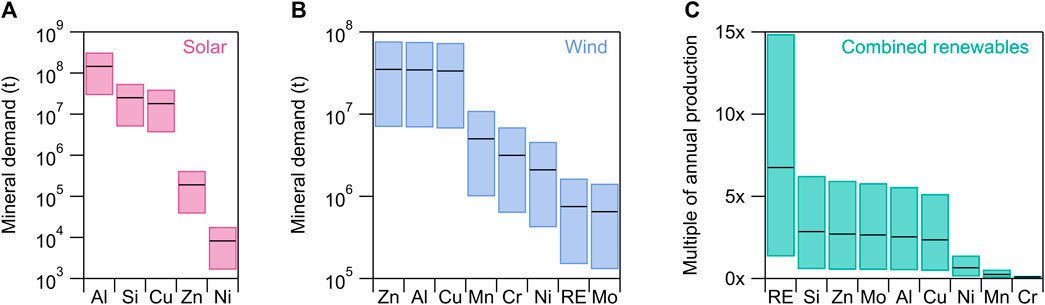
FIGURE 3. Total mineral demand required for (A) solar and (B) wind to collectively produce 100–1,000 Mt H2. The hypothetical renewable mix comprises equal shares solar, onshore wind, and offshore wind. RE = Rare earth elements (REEs). For each floating bar, the lower and upper limits correspond to the “existing uses” and “high growth” scenarios shown in Figure 1, respectively. Black lines correspond to the “net zero” scenario. (C) Mineral demand for wind and solar combined and normalized to annual production values for each mineral (USGS, 2023). Since ascertaining exact REE annual production values and ensuring that those values represent the REEs most used in wind turbines is difficult, Nd is used as a prototypical REE in 3c and an average need of 100 kg Nd/MW is assumed for offshore wind only. The forecasted increases in REE demand, under all scenarios, are therefore lower bounds since Nd demand for onshore wind and all other REEs are excluded.
The total tonnage of minerals required for renewable energy (Figure 3) is much greater than the quantity required for electrolyzers (Figure 2). For example, the Ni needed for AE under the “high demand” scenario (∼0.40 Mt) is roughly equivalent to the total amount of Ni required for solar and wind under the “existing uses” scenario (∼0.002 Mt for solar and ∼0.4 Mt for wind). The contrast is even starker for PEM and SOECs, where the mass of all minerals required for electrolysis is several orders of magnitude less than the mass of minerals needed for renewables.
As with the electrolyzer analysis, we normalize renewable energy mineral demand to current annual production values (Figure 3C) (USGS, 2023). We bin together the shared minerals (Al, Cu, Ni, and Zn), assuming equal energy contribution of solar, offshore wind, and onshore wind. Normalizing total demand to current annual production highlights the minerals of particular concern. Higher quantities of Si, Cu, Al, Zn and Mo will be required, ranging from ∼0.5–5× annual production, pending the H2 demand scenario. Though elemental Si and Al are abundant, both depend on energy- and emission-intensive refining processes (Maldonado, 2020; Lennon et al., 2022; Bauer et al., 2023). Greater electrification in other sectors will also increase demand for Si and Al. The increase in demand for Cu is also noteworthy, as it is the most common conductor for wiring (He and Small, 2022), and critical for global renewable generation and electrification efforts, yet global ore grades are in decline (Northey et al., 2014).
While solar has seen the highest growth in capacity over the last decade (IRENA, 2023a), its relatively low global CF (∼14%) makes it challenging to use for continuous H2 production, absent dedicated energy storage systems or dynamic electrolyzers. Offshore wind has the highest CF (∼29%), making it an attractive renewable electricity source with lower intermittency. However, offshore wind requires more Cu than onshore wind due to longer cable lengths. Similarly, more REEs are required for offshore wind due to the greater dependence of offshore turbines on strong permanent magnet generators. Most permanent magnets are based on neodymium-iron-boron alloys (NdFeB) doped with praseodymium (Pr), dysprosium (Dy), and terbium (Tb), though the type and quantity of REEs vary depending on turbine design (Gielen, 2021). We use Nd as a representative REE and assume 100 kg Nd/MW are required for offshore turbines only. With this calculation, we find REEs to be the most supply constrained mineral needed for renewables. More than an order of magnitude increase over current annual REE production values is required to meet the high demand scenario. Accounting for REE demand for onshore turbines and for REEs besides Nd would result in an even greater increase over current production levels and further supply constraints. Additionally, since REEs are essential for electric motors (Smith et al., 2022), future demand for these minerals is also likely to increase with greater electric vehicle adoption.
We next compare the total renewable electricity needed to produce green H2 relative to current and projected global renewable electricity generation. At 45 kWh/kg H2, a substantial fraction of global wind and solar energy will be required for water electrolysis to produce green H2 (Figure 4). Under the “existing uses” scenario (100 Mtpa H2), water electrolysis will require more electricity (∼4,500 TWh) than total wind and solar generation in 2022 (3,427 TWh) (IEA, 2021a). The IRENA Planned Energy Scenario (IRENA, 2023b) and IEA Announced Pledges Scenario (IEA, 2021a), two more conservative energy transition models, estimate that wind and solar will generate ∼25,000–30,000 TWh globally in 2050. In contrast, more aggressive targets, such as the IRENA 1.5°C Scenario (IRENA, 2023b) and BloombergNEF Net Zero Scenario (Bloomberg, 2022) project wind and solar will generate ∼60,000–65,000 TWh in 2050. Considering these generation ranges, the “net zero” H2 scenario (500 Mtpa, ∼22,500 TWh) will require between ∼34 and 90% of all installed renewables in 2050. Even with technological improvements to reach 100% efficiency (39 kWh/kg H2), electrolyzers may still require at least ∼30% of projected global renewables in 2050 under the “net zero” scenario. Given these projections, it is more realistic that green H2 uses a dedicated “behind-the-meter” system than connecting to the grid, which will also enable lower costs.
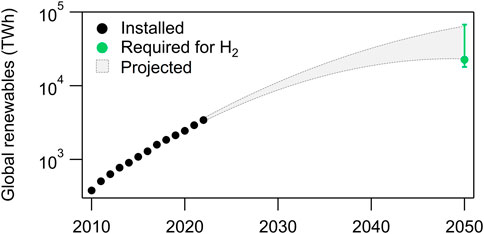
FIGURE 4. Current installed wind and solar renewable electricity generation (black circles), projected generation (grey shaded region), and electricity needed to produce green H2 under the three different demand scenarios (green). The lower bound of projected renewables generation corresponds to the IEA’s Announced Pledges Scenario (IEA, 2021a) and IRENA’s Planned Energy Scenario (IRENA, 2023b). The upper bound corresponds to the IRENA 1.5°C (IRENA, 2023b) and BloombergNEF Net Zero Scenario (Bloomberg, 2022). The green circle represents the renewable energy required for water electrolysis under the proposed “net zero” scenario (500 Mtpa H2), while the error bar ranges represent the “existing uses” and “high demand” H2 scenarios.
The IEA has recently lowered their forecast demand for H2 in 2050 from 530 (IEA, 2021a) to 470 (IEA, 2023b) Mtpa, perhaps due to some of the aforementioned challenges. Given the quantity of minerals required for renewable generation, we feel the primary focus should be on deployment of renewables for grid electricity generation. At present, the energy and mineral requirements for wind and solar present a major challenge to scaling green H2 production.
4 Discussion
The above analysis is intended to highlight the challenges associated with scaling green H2 production using existing technology and mineral production levels, especially with regards to REEs and PGMs. Both REEs and PGMs currently rely on extremely concentrated supply chains with limited geographic diversity. REEs are abundant in the earth’s crust (∼130 Mt) but are typically found in very low concentrations. Only ∼250,000 tonnes of rare earth oxides were mined in 2023 (USGS, 2023), with ∼70% mined in China. While there are currently ∼70,000 tonnes of known PGM reserves, ∼90% are located in South Africa (USGS, 2023). Innovations in surveying technologies to identify new deposits and new technologies to enable mining of REEs and PGMs from low concentration sources would help alleviate potential supply constraints. Within this analysis, we have excluded calculating mineral demands for dedicated battery storage systems, which is expected to increase the demand of other critical minerals, such as Li, Co, and graphite. We also leave the mineral demands of fuel cells out of scope, even though PEM fuel cells may represent additional demand for PGMs (Wang et al., 2022). In addition, we note that locations with high solar CFs are often in water stressed regions, potentially limiting the ease of implementing large-scale electrolysis (Tonelli et al., 2023). Therefore, ongoing research and development efforts dedicated to identifying alternative materials and increasing efficiency are essential. REE-free permanent magnets, significant reductions in catalyst loading, PGM-free AEMs, and coupling water electrolysis with other heat generation sources, are all being investigated and can potentially improve the energy and material efficiency of green H2 production. Nuclear energy, especially small modular reactors, provides another alternate route to scaling low-emission, electrolysis-based H2 production, given the high CF and low-emissions profile of nuclear systems (IEA, 2023c). Finally, we note that we have excluded material and energy requirements for “blue hydrogen”, which integrates carbon capture and storage with fossil-based methods, due to the nascency of carbon capture and storage technology.
As this special issue highlights, “natural hydrogen” is one potential alternative method for producing low-emission H2. Natural hydrogen is H2 created in the subsurface, through serpentinization of Fe-containing rocks or radiolysis of water. There are potentially large untapped reservoirs of natural hydrogen, ranging from ∼0.5 (Lollar et al., 2014) to >1,000 (Zgonnik, 2020) Mtpa of H2. Natural hydrogen may alleviate some of the mineral supply constraints discussed above and provide a potential source of low-emissions H2 in the future. However, there are significant challenges to utilizing this unexplored resource and the needed technology is notably less mature than renewables and electrolysis. The exploration and discovery of natural hydrogen accumulations, the ability to stimulate subsurface reservoirs, and the capacity to effectively remove H2 from the subsurface are currently all not well understood enough for on-demand extraction of H2. Ensuring that natural H2 extraction and production does not have unintended environmental impacts, including seismicity, microbial community changes, water usage, and fugitive emissions, is another area in need of research. We hope this opening perspective piece helps frame the exciting and urgent challenges natural hydrogen researchers aim to solve.
Data availability statement
The original contributions presented in the study are included in the article/Supplementary material, further inquiries can be directed to the corresponding author.
Author contributions
JG: Conceptualization, Writing–original draft, Writing–review and editing. MZ: Writing–original draft, Writing–review and editing. DW: Conceptualization, Supervision, Writing–review and editing.
Funding
The author(s) declare that no financial support was received for the research, authorship, and/or publication of this article.
Acknowledgments
The views and opinions of the authors expressed herein do not necessarily state or reflect those of the U.S. Government or any agency thereof. The authors acknowledge Daniel Cunningham, Samuel Falzone, Elise Goldfine, M. Neal Golovin, Colin Gore, Matthew Hackworth, Kirk Liu, Othon Monteiro, and Christian Vandervort for valuable discussions.
Conflict of interest
The author MZ was employed by Booz Allen Hamilton, McLean.
The remaining authors declare that the research was conducted in the absence of any commercial or financial relationships that could be construed as a potential conflict of interest.
Publisher’s note
All claims expressed in this article are solely those of the authors and do not necessarily represent those of their affiliated organizations, or those of the publisher, the editors and the reviewers. Any product that may be evaluated in this article, or claim that may be made by its manufacturer, is not guaranteed or endorsed by the publisher.
References
Azadi, M., Northey, S. A., Ali, S. H., and Edraki, M. (2020). Transparency on greenhouse gas emissions from mining to enable climate change mitigation. Nat. Geosci. 13, 100–104. doi:10.1038/s41561-020-0531-3
Badgett, A., Brauch, J., Buchheit, K., Hackett, G., Li, Y., Melaina, M., et al. (2022). Water electrolyzers and fuel cells supply chain: supply chain deep dive assessment (No. DOE/OP-0006). Washington, DC (United States): USDOE Office of Policy (PO).
Bauer, D. J., Khazdozian, H., Mehta, J., Nguyen, R. T., Severson, M. H., Vaagensmith, B. C., et al. (2023). 2023 Critical materials strategy (No. INL/RPT-23-72323-Rev001). Idaho Falls, ID (United States): Idaho National Laboratory (INL).
Bloomberg (2022). New energy outlook 2022 | BloombergNEF | Bloomberg finance LP. Available at: https://about.bnef.com/new-energy-outlook/ (Accessed 2022.12.19).
Bolson, N., Prieto, P., and Patzek, T. (2022). Capacity factors for electrical power generation from renewable and nonrenewable sources. Proc. Natl. Acad. Sci. U. S. A. 119, e2205429119. doi:10.1073/pnas.2205429119
Carreno-Madinabeitia, S., Ibarra-Berastegi, G., Sáenz, J., and Ulazia, A. (2021). Long-term changes in offshore wind power density and wind turbine capacity factor in the Iberian Peninsula (1900–2010). Energy 226, 120364. doi:10.1016/j.energy.2021.120364
Castelvecchi, D. (2022). How the hydrogen revolution can help save the planet — and how it can’t. Nature 611, 440–443. doi:10.1038/d41586-022-03699-0
Chatenet, M., Pollet, G., Dekel, D. R., Dionigi, F., Deseure, J., Millet, P., et al. (2022). Water electrolysis: from textbook knowledge to the latest scientific strategies and industrial developments. Chem. Soc. Rev. 51, 4583–4762. doi:10.1039/d0cs01079k
DOE (2023a). Financial incentives for hydrogen and fuel cell projects. Energy.gov. Available at: https://www.energy.gov/eere/fuelcells/financial-incentives-hydrogen-and-fuel-cell-projects (Accessed October 18, 2023).
DOE (2023b). Technical targets for liquid alkaline electrolysis. Energy.gov. Available at: https://www.energy.gov/eere/fuelcells/technical-targets-liquid-alkaline-electrolysis (Accessed 2023.September.29).
DOE (2023c). Technical targets for proton exchange membrane electrolysis. Energy.gov. Available at: https://www.energy.gov/eere/fuelcells/technical-targets-proton-exchange-membrane-electrolysis (Accessed 2023.September.29).
DOE (2023d). Technical targets for high temperature electrolysis. Energy.gov. Available at: https://www.energy.gov/eere/fuelcells/technical-targets-high-temperature-electrolysis (Accessed 2023.September.29).
Du, N., Roy, C., Peach, R., Turnbull, M., Thiele, S., and Bock, C. (2022). Anion-exchange membrane water electrolyzers. Chem. Rev. 122, 11830–11895. doi:10.1021/acs.chemrev.1c00854
EIA (2023). Use of hydrogen - U.S. Energy information administration. Available at: https://www.eia.gov/energyexplained/hydrogen/use-of-hydrogen.php (Accessed September 29, 2023).
Energy Transitions Commission (2020). Making mission possible: delivering a net-zero economy. London.
Gallardo, F. I., Monforti Ferrario, A., Lamagna, M., Bocci, E., Astiaso Garcia, D., and Baeza-Jeria, T. E. (2021). A Techno-Economic Analysis of solar hydrogen production by electrolysis in the north of Chile and the case of exportation from Atacama Desert to Japan. Int. J. Hydrogen Energy 46, 13709–13728. doi:10.1016/j.ijhydene.2020.07.050
Gielen, D. (2021). Critical materials for the energy transition. Abu Dhabi: International Renewable Energy Agency.
Hauch, A., Küngas, R., Blennow, P., Hansen, A. B., Hansen, J. B., Mathiesen, B. V., et al. (2020). Recent advances in solid oxide cell technology for electrolysis. Science 370, eaba6118. doi:10.1126/science.aba6118
He, R., and Small, M. J. (2022). Forecast of the U.S. Copper demand: a framework based on scenario analysis and stock dynamics. Environ. Sci. Technol. 56, 2709–2717. doi:10.1021/acs.est.1c05080
IEA (2021a). Net zero by 2050 - a roadmap for the global energy sector. Paris: International Energy Agency.
IEA (2021b). Estimated levelised demand for selected minerals in electrolysers and fuel cells today, log scale. Available at: https://www.iea.org/data-and-statistics/charts/estimated-levelised-demand-for-selected-minerals-in-electrolysers-and-fuel-cells-today-log-scale (Accessed September 29, 2023).
IEA (2021c). The role of critical minerals in clean energy transitions. Paris: International Energy Agency.
IEA (2023b). Net zero roadmap: a global pathway to keep the 1.5 °C goal in reach. Paris: International Energy Agency.
IEA (2023c). Comparison of the emissions intensity of different hydrogen production routes, 2021 – charts – Data & Statistics. IEA. Available at: https://www.iea.org/data-and-statistics/charts/comparison-of-the-emissions-intensity-of-different-hydrogen-production-routes-2021 (Accessed September 29, 2023).
IRENA (2018). Hydrogen from renewable power: technology outlook for the energy transition. Abu Dhabi: International Renewable Energy Agency.
IRENA (2022). Global hydrogen trade to meet the 1.5°C climate goal: Part III – green hydrogen cost and potential. Abu Dhabi: International Renewable Energy Agency.
Lennon, A., Lunardi, M., Hallam, B., and Dias, P. R. (2022). The aluminium demand risk of terawatt photovoltaics for net zero emissions by 2050. Nat. Sustain. 5, 357–363. doi:10.1038/s41893-021-00838-9
Levene, J. I., Mann, M. K., Margolis, R. M., and Milbrandt, A. (2007). An analysis of hydrogen production from renewable electricity sources. Sol. Energy 81, 773–780. doi:10.1016/j.solener.2006.10.005
Lollar, B. S., Onstott, T. C., Lacrampe-Couloume, G., and Ballentine, C. J. (2014). The contribution of the Precambrian continental lithosphere to global H2 production. Nature 516, 379–382. doi:10.1038/nature14017
Maldonado, S. (2020). The importance of new “sand-to-silicon” processes for the rapid future increase of photovoltaics. ACS Energy Lett. 5, 3628–3632. doi:10.1021/acsenergylett.0c02100
Mustain, W. E., Chatenet, M., Page, M., and Kim, Y. S. (2020). Durability challenges of anion exchange membrane fuel cells. Energy Environ. Sci. 13, 2805–2838. doi:10.1039/d0ee01133a
Ni, M., Leung, M. K. H., and Leung, D. Y. C. (2008). Technological development of hydrogen production by solid oxide electrolyzer cell (SOEC). Int. J. Hydrogen Energy 33, 2337–2354. doi:10.1016/j.ijhydene.2008.02.048
Northey, S., Mohr, S., Mudd, G. M., Weng, Z., and Giurco, D. (2014). Modelling future copper ore grade decline based on a detailed assessment of copper resources and mining. Resour. Conservation Recycl. 83, 190–201. doi:10.1016/j.resconrec.2013.10.005
Oliveira, A. M., Beswick, R. R., and Yan, Y. (2021). A green hydrogen economy for a renewable energy society. Curr. Opin. Chem. Eng. 33, 100701. doi:10.1016/j.coche.2021.100701
Ramachandran, R., and Menon, R. K. (1998). An overview of industrial uses of hydrogen. Int. J. Hydrogen Energy 23, 593–598. doi:10.1016/s0360-3199(97)00112-2
Roger, I., Shipman, M. A., and Symes, M. D. (2017). Nat. Rev. Chem. 1, 1–13. doi:10.1038/s41570-016-0003
Smith, B. J., Riddle, M. E., Earlam, M. R., Iloeje, C., and Diamond, D. (2022). Rare earth permanent magnets: supply chain deep dive assessment. Washington DC: USDOE Office of Policy (PO).
Tonelli, D., Rosa, L., Gabrielli, P., Caldeira, K., Parente, A., and Contino, F. (2023). Global land and water limits to electrolytic hydrogen production using wind and solar resources. Nat. Commun. 14, 5532. doi:10.1038/s41467-023-41107-x
Tong, D., Farnham, D. J., Duan, L., Zhang, Q., Lewis, N. S., Caldeira, K., et al. (2021). Geophysical constraints on the reliability of solar and wind power worldwide. Nat. Commun. 12, 6146. doi:10.1038/s41467-021-26355-z
Tong, W., Forster, M., Dionigi, F., Dresp, S., Sadeghi Erami, R., Strasser, P., et al. (2020). Electrolysis of low-grade and saline surface water. Nat. Energy 5, 367–377. doi:10.1038/s41560-020-0550-8
Wang, Y., Pang, Y., Xu, H., Martinez, A., and Chen, K. S. (2022). PEM Fuel cell and electrolysis cell technologies and hydrogen infrastructure development – a review. Energy Environ. Sci. 15, 2288–2328. doi:10.1039/d2ee00790h
Yu, M., Wang, K., and Vredenburg, H. (2021). Insights into low-carbon hydrogen production methods: green, blue and aqua hydrogen. Int. J. Hydrogen Energy 46, 21261–21273. doi:10.1016/j.ijhydene.2021.04.016
Keywords: hydrogen, green hydrogen, critical minerals, electrolysis, solar, wind, renewables
Citation: Greenwald JE, Zhao M and Wicks DA (2024) Critical mineral demands may limit scaling of green hydrogen production. Front. Geochem. 1:1328384. doi: 10.3389/fgeoc.2023.1328384
Received: 26 October 2023; Accepted: 11 December 2023;
Published: 16 January 2024.
Edited by:
Stephen A. Bowden, University of Aberdeen, United KingdomReviewed by:
Malcolm Hole, University of Aberdeen, United KingdomSam Spinks, Teck Resources Limited, Australia
Copyright © 2024 Greenwald, Zhao and Wicks. This is an open-access article distributed under the terms of the Creative Commons Attribution License (CC BY). The use, distribution or reproduction in other forums is permitted, provided the original author(s) and the copyright owner(s) are credited and that the original publication in this journal is cited, in accordance with accepted academic practice. No use, distribution or reproduction is permitted which does not comply with these terms.
*Correspondence: Douglas A. Wicks, ZG91Zy53aWNrc0BocS5kb2UuZ292
†These authors have contributed equally to this work