
94% of researchers rate our articles as excellent or good
Learn more about the work of our research integrity team to safeguard the quality of each article we publish.
Find out more
ORIGINAL RESEARCH article
Front. Geochem., 23 May 2023
Sec. Biogeochemistry
Volume 1 - 2023 | https://doi.org/10.3389/fgeoc.2023.1180893
This article is part of the Research TopicMineral defects: a driving force for (bio)geochemical reactions?View all articles
 Jordan Stone1†
 John O. Edgar1
 Johnny Rutherford1
 Beatriz Gill-Olivas2
 Martyn Tranter3Jamie A. Gould4Cijo M. Xavier4
 Jon Telling1*
Subglacial environments harbour a diversity of microbial ecosystems capable of influencing biogeochemical cycles. However, the darkness and isolation of subglacial environments limit the energy sources available for microbial metabolism. A recently recognised energy source for these microbes in wet-based regions is the rock-water reactions that occur after the mechanical fracturing of glacial bedrock. These mechanochemical reactions produce H2 and H2O2 at 0°C from reactions with mineral surface defects (Si• and SiO•) and release Fe from within the mineral structures, providing electron donors and acceptors for microbial metabolism. However, the production of H2O2 and H2 may be underestimated as temperatures at rock abrasion sites can increase substantially above 0°C as glaciers “slip and grind” rocks, potentially accelerating the rates of mechanochemical reactions. Despite this, the effect of rapid heating on subsequent low-temperature mechanochemical reactions has yet to be examined. Here, we investigate H2, H2O2, and Fe production during low-temperature (0 °C) incubations of water with a range of ground rocks and minerals following “flash heating” to 30, 60, or 121 °C. We show that transient increases (as little as 5–10 min of heating) to moderate temperatures (30 or 60 °C) can significantly increase the rate of H2 production, while short-term heating to 121 °C generates larger bursts of H2. In addition, pyrite is easily crushed, potentially releasing large quantities of Fe2+ into subglacial systems and promoting mechanochemical reactions due to the resulting large surface area (10× larger than other materials). We provide the first evidence for H2 production from water reactions with crushed pyrite and suggest that crushed pyrite has a greater influence on subglacial H2O2 production than silicates. We conclude that electron donors in the form of Fe2+ and H2 bursts can be produced in subglacial ecosystems, which may be coupled to substantial concentrations of H2O2 produced from crushed pyrite. This suggests that rock–water mechanochemical reactions may be a greater source of energy for subglacial environments than previously recognised.
Understanding how microbes survive in cold subsurface environments under conditions of darkness, isolation, high pressure, and low temperature has garnered increasing attention (Wadham et al., 2008; Christner et al., 2014; Gill-Olivas et al., 2021). However, the ubiquitous presence of rock comminution (e.g., from rock grinding at the glacier bed) and water in cold subsurface environments indicates that rock–water reactions may be prevalent (Telling et al., 2015; Gill Olivas, 2019). Silicon-oxygen bonds are broken by rock comminution, resulting in the formation of Si• and SiO• (Kita et al., 1982; Fubini et al., 1990; He et al., 2021; Eq. 1).
Si• reacts with water at 0 °C to produce H2 gas over hours to weeks (Telling et al., 2015; Eq. 2; Eq. 3), providing energy to subglacial ecosystems and supporting methanogenesis (Telling et al., 2015; Macdonald et al., 2018; Parkes et al., 2019).
The potential for additional energy supplied from mechanochemically produced H2O2 as an electron acceptor coupled to H2 has recently been identified (Gill-Olivas et al., 2021). Pyrite is a potentially large source of H2O2 in subglacial environments, even in the absence of O2 (Gill-Olivas et al., 2021). The mechanism of H2O2 production at the surface remains controversial, but it involves the reaction of H2O or O2 with the Fe3+ and sulfur-deficient sites on the fractured pyrite surface (Xian et al., 2019; Borda et al., 2003; e.g., through Eq. 4 and Eq. 5). The process generates •OH as an intermediate, which combines to form H2O2 (Eq. 6).
However, despite the linking of Fe2+ to H2 production (McCollom and Bach, 2009; Irfan et al., 2019), no study has examined the production of H2 from reactions of water with crushed pyrite (a mineral with high Fe2+ content). If crushed pyrite can produce H2 in addition to the substantial quantities of H2O2 indicated by Gill-Olivas et al. (2021), then the energy available from mechanochemical reactions in cold subsurface environments may be much higher than previously estimated.
The rate of mechanochemical H2 production typically increases with temperature up to ∼90°C - within the range of microbial habitability (Kita et al., 1982; Parkes et al., 2019; Stone et al., 2022) - reducing the potential for H2 production in colder environments. However, the cold subsurface biosphere experiences fluctuating temperatures that can impact the chemistry of energy-providing rock–water reactions. For example, certain glaciers can exhibit stick–slip” behaviour where energy is built up as glaciers “stick” to rough ground and is then released (up to 4 W/m2 of frictional heating—Benn et al., 2019) during a “slip” (Fischer and Clarke, 1997; Sevestre and Benn, 2015). The increased sliding velocity during a slip can increase bedrock erosion (Fischer et al., 2013; Cook et al., 2020) and generate high spot temperatures (Zhang and Valentine, 2002). The temperatures reached are difficult to observe in the field, but, based on an approximate calculation, spot temperatures can be as high as 155°C (Supplementary Material S1.2.2). Such high transitory temperatures can locally increase the rate of mechanochemical reactions (Figure 1) and boost the potential for H2 production in low-temperature environments. In addition, the potential activation of SiO• at high temperatures can stimulate H2O2 production (Eq. 7; Eq. 5) or inhibit H2 production (Eq. 8 outcompetes Eq. 3; Stone et al., 2022; Gill-Olivas et al., 2021).
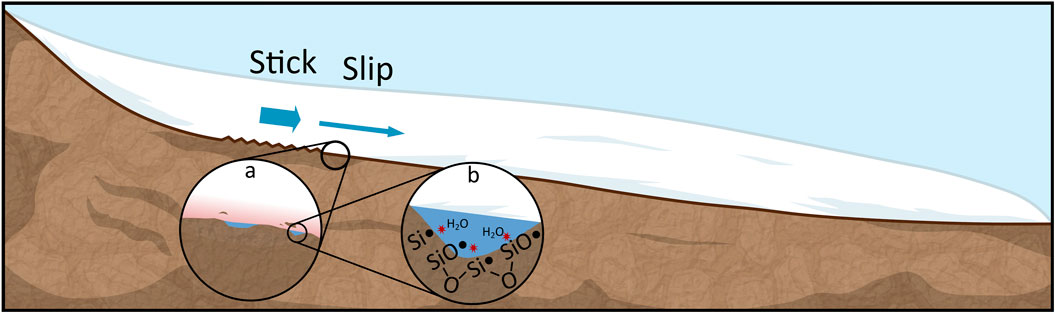
FIGURE 1. Stick–slip glacier motion simultaneously grinds bedrock and releases high spot temperatures, potentially promoting mechanochemical reactions. Glaciers stick to rough spots and build up potential energy. (A) As they slip, high temperatures can be generated, and rock can be fractured. (B) Reaction of subglacial water with surface defects at high temperatures can generate free H2, H2O2, and Fe.
Fe2+ may also be generated from crushed rocks and minerals. The effect of the resulting Fenton reactions (due to Fe2+ and H2O2; Fenton, 1894) on mechanochemically derived energy and H2 has yet to be studied. For example, by generating highly reactive •OH (Araujo et al., 2011; Eq. 9):
In addition, if Fe2+ is generated in large quantities, it may serve as an electron donor to couple with O2, including any O2 generated from H2O2 via the action of catalase (Kayani et al., 2018). Furthermore, it is possible (although not currently documented in situ) that some microorganisms may be able to use H2O2 directly as a terminal electron acceptor using the cytochrome-c peroxidase as a respiratory oxidase (Khademian and Imlay, 2017).
This study aims to investigate low-temperature rock–water reactions, following short-term (hereafter referred to as “flash”) heating. A range of rocks and minerals, representing a mix of subglacial sediments, were ground in a planetary ball mill under anoxic conditions. H2O2, H2, and Fe were measured due to their potential impact on subglacial microbial communities and to build on past research on mechanochemical reactions. Rock and mineral powders were added to 0 °C anoxic water, rapidly heated to 30, 60, or 121 °C, and incubated at 0 °C for 1 h, 1 day, and 1 week. Concentrations of H2, H2O2, and aqueous iron were measured at each time point.
All rocks and minerals were commercially sourced from Northern Geological Supplies Limited (Bolton, United Kingdom). Initially, quartz (cat# RckCryChnKBg; a common mineral that has been used in extensive mechanochemistry research—e.g., Fubini et al., 1987), basalt (cat# bas1 kg; a major rock of the oceanic crust), granite (cat# gasg1 kg; a major rock of the continental crust that produces high quantities of H2—Parkes et al., 2011; Telling et al., 2015), and pyrite (cat# PyrKbg; common in subglacial systems and capable of generating H2O2—Borda et al., 2001; Gill-Olivas et al., 2021) were crushed with a sledgehammer on an anvil (washed with 100% ethanol) inside multiple thick polyethylene bags. The materials were then crushed with a jaw crusher (after an initial discard) and sieved to a uniform 1–3 mm size fraction. They were then sieved again, washed in 18.2 MΩ cm−1 water, and ultrasonicated to remove fine dust particles. The materials were then dried at 60 °C for >1 week before milling and crushed in a planetary ball mill. The planetary ball mill was cleaned twice by milling with pure quartz and once with the desired material for 2 min each before crushing the experimental sample. Due to the limited size of the mortar, the planetary ball mill was run twice with 45 g of material each time. The mortar was sealed with a gas-tight lid containing a Viton O-ring and enclosed within a custom-made stainless-steel tri-axial clamping system. The ball mill was then vacuumed and flushed with N2 for seven cycles before the N2 headspace was equilibrated to atmospheric pressure using a syringe (Kaur et al., 2016; Gill-Olivas et al., 2021). Each milling was performed at 500 rpm for 30 min (Telling et al., 2015; Gill-Olivas et al., 2021). Prior tests have demonstrated that, under these conditions, contamination of agate from the ball mill or grinding balls into the crushed rock or mineral sample is ≤0.2% (Stone et al., 2022). The ball mill was then transferred and opened into a glove bag filled and continuously flushed with 5.0 grade N2 (<10 ppm O2). The O2 within the glove bag was also confirmed to be <0.1% O2 using a PreSens optical O2 sensor. We then transferred 2 g (1.94–2.05 g) subfractions into 10-mL borosilicate serum vials (previously autoclaved, bathed in 10% HCl for 2 h, rinsed in 18.2 MΩ cm−1 water, and furnaced at 500 °C for 4 h—Parkes et al., 2011; Telling et al., 2015). Vials were sealed with thick butyl rubber stoppers (previously autoclaved at 121°C for 30 min, boiled in 1 M NaOH for 1 h (McCollom and Donaldson, 2016), rinsed in 18.2 MΩ cm-1 water, and dried under a fume hood), and crimp sealed. The remaining material was stored at room temperature in a sealed plastic tub for grain size analysis. Blank controls were treated identically but without the rock/mineral powder. The vials were then flushed with N2 for 2 min each to remove any trace O2 and then equilibrated to 1 atm (Telling et al., 2015; Gill-Olivas et al., 2021).
De-oxygenated water was prepared by autoclaving 18.2 MΩ cm−1 water in a 0.5 L borosilicate Duran bottle at 121°C for 1 h. The Duran bottle was then placed in a 0 °C water bath and vigorously bubbled with N2 for ∼4 h; dissolved O2 was measured to be 0.216 mg L−1 (equivalent to 6.74 μmol L−1) with a calibrated PreSens O2 optical sensor. We then added 4 mL of deoxygenated water to each vial (∼2 h after crushing) using a gas-tight syringe and needle, which were shaken for 10 s.
Vials were stored in a 0 °C water bath for 5–30 min before heating. Batches of nine vials were either kept at 0 °C or rapidly flash-heated to 30 °C (water bath), 60 °C (oven), or 121 °C (autoclave) for 1 min; the vials were then rapidly cooled in the dark at 0 °C (see Stone et al., 2022). The temperature was measured using a vial with a temperature probe (held in place using aluminium foil) in 4 mL of water. Triplicate vials were then destructively sampled at 1 h, 24 h, and 168 h. During sampling, 4 mL gas (replaced with N2) was taken and stored at an overpressure in 3 mL Exetainers with double-wadded caps (evacuated to <0.6 mbar) using a gastight syringe and needle for later H2 analysis (Telling et al., 2015). The vial was then shaken to ensure that the liquid was homogeneous (Telling et al., 2015), and a 2 mL liquid sample was extracted using a syringe and needle for H2O2 and Fe2+ analysis.
H2 was measured using a ThermoFisher gas chromatograph with a helium pulsed discharge detector (GC-PDD) with a 2-m micro-packed Shin Carbon ST 100/120 mesh, 1/16-inch OD, and 1.0 mm ID column, with a constant flow (10 mL-1) of helium carrier gas and a run time of 12.5 min. The column temperature was 60 °C, the injector temperature was 110 °C, and the detector temperature was 110 °C. Samples were calibrated against certified (±5%) 100 ppm standards (BOC). Three standards were run daily throughout the experimental period (coefficient of variation = 5.97%, n = 39). We injected 100 μL of gas from Exetainers directly into the column of the GC. The ideal gas law was used to calculate the mol H2 in the headspace of the vials from the ppm concentration (Okland et al., 2014). Adjustments were made for dilution during sampling, and the mol H2 was normalised to dry material weight.
H2O2 concentrations were analysed immediately after sampling using a UV-spectrophotometric method (Baga et al., 1988; Borda et al., 2001). The method measures the quantity of copper (I)–DMP complex (Cu(DMP)2+) formed in the presence of H2O2 at a wavelength of 454 nm after a reaction time of ∼20 min. Daily standards were prepared from a stock solution of 1000 µMol L−1 H2O2 to prevent the photodegradation of H2O2 (Ueki et al., 2020; Yi et al., 2012; coefficient of variation = 0.03%, n=12).
Ferrozine spectrophotometry was used to measure Fe2+ and Fe3+ in the liquid samples (Viollier et al., 2000; Stone et al., 2022). This method determines the concentration of Fe2+ based on the measurement of the Fe2+-ferrozine complex formed by the reaction of Fe2+ with ferrozine. The use of a reducing agent, hydroxylamine hydrochloride, allows the measurement of Fe3+ concentration (Viollier et al., 2000). Samples were stored in evacuated Exetainers for <2 weeks prior to analysis, and were analysed in the open air (exposing them to air for 5–20 min during analysis). Under similar conditions, a pH range of 7–10 was recorded by Stone et al. (2022).
The grain size was measured by laser diffraction using a Mastersizer 3000 with Mastersizer v3.81 software, with 15 replicates per analysis. Three separate samples of the material that remained after milling were added to the Mastersizer at 10%–20% obscuration with five replicates each.
The surface area of the materials was measured using a NOVA 1200e BET Analysis System. Approximately 1 g of dried crushed mineral was loaded into a pre-calibrated sample cell. The entire system was then evacuated and dried at 300 °C for 2 h (Bardestani et al., 2019). The surface area of the materials was measured using nitrogen gas as an adsorbent at 77 K.
Six-phase identification was performed by XRD using a PANalytical X’Pert Pro MPD, powered using a Philips PW3040/60 X-ray generator fitted with an X’Celerator detector. Powder samples were exposed to Cu-Kα X-rays at a characteristic wavelength (λ) of 1.5418 Å to generate diffraction data. A Cu anode supplied with 40 kV and a current of 40 mA was used to acquire X-ray data. Using a scanning X’Celerator detector and a secondary Ni monochromator in the diffracted beam path, the data sets were collected over the range 5°–100° 2θ with a step size of 0.0334° 2θ and a nominal time per step of 1 s. The optics were set up with an incident anti-scatter slit of 4°, a programmable divergence slit with a fixed length of 10 mm, a beam mask of 20 mm, and incident/diffracted Soller slits of 0.04 radians. Scans were performed in continuous mode. Data were exported as XRDML files, and profiles were fitted using a minimum second derivative method and evaluated by searching the Crystallography Open Database (COD; http://www.crystallography.net/cod/) using Malvern Panalytical HighScore Plus software. The mineral search was restricted to phases containing at least one of the major elements O, Si, Al, Fe, Mg, Na, K, and Ca and potentially containing Ti, Mn, Ni, S, and Cl. The Reitveld method was used to further analyse the data; this involves constructing a model consisting of the crystal structures of all component phases; the differences between the observed and simulated diffraction patterns are minimised by varying the scale factors, unit-cell parameters, and crystallite size for each phase. This method provides information about well-ordered (crystalline) phases.
All concentrations were normalised to dry sediment mass (μmol g-1). Detection limits were calculated based on the sum of the mean of the blanks and the standard deviation multiplied by three. Statistical analyses were conducted using IBM SPSS Statistics 25., Mann-Whitney U tests were used to test whether each temperature and time point was significantly different from the blanks (p<0.05; two-tailed). Independent sample t-tests (p<0.05; two-tailed) were used to determine whether there were differences in the chemistry of larger groups. One-way ANOVA (two-tailed) was used to test for significant differences in H2 and H2O2. Spearman’s rank was used to evaluate the relationships between different molecules, time, and temperature (p<0.05; two-tailed). Oxygen mass balance calculations were conducted as per Stone et al. (2022) (Supplementary Material S1.2.1).
Equal crushing time and intensity produced varied grain sizes and surface areas depending on the material. Pyrite had the smallest grain size (4.1 µm) and the largest surface area (26.2 m2 g-1). Granite, quartz, and basalt had grain sizes ranging from 16.8 to 27.0 µm (Supplementary Figure S1) and surface areas ranging from 2.3 to 3.0 m2 g-1 (Supplementary Table S1). Mineral phase identification is presented in Supplementary Tables S1, S5.
The results for 24 h showed a significant increase in H2 production from crushed granite and pyrite after flash heating to 30 or 60 °C (T-test: t18.01=−3.696, p=0.002); H2 production from pyrite only differed significantly from the blanks after flash heating to 30 or 60 °C (Figure 2C). In addition, flash heating to 121 °C caused an initial burst of H2 production after 1 h from basalt (ANOVA: F3,8=41, p<0.001; LSD: p<0.001), quartz (ANOVA: F3,8=34.388, p<0.001; LSD: p<0.001), and granite (ANOVA: F3,7=60.178, p<0.001; LSD: p<0.001). However, after 24 h, granite that was flash heated to 121 °C showed significantly lower H2 production than 30°C and 60 °C (ANOVA: F3,20=3.727, p=0.028; LSD: p=0.014, p=0.007, respectively), while basalt and quartz showed no significant H2 production 1 week after flash heating to 121 °C (Figures 2A, B). The H2 concentration decreased between 24 and 168 h for quartz (t-test: t22=3.64, p=0.001), basalt (t-test: t22=4.66, p<0.001), and pyrite (t-test: t16.887=7.434, p<0.001), with all H2 initially generated from pyrite reduced to below detection after 1 week (Figure 2C).
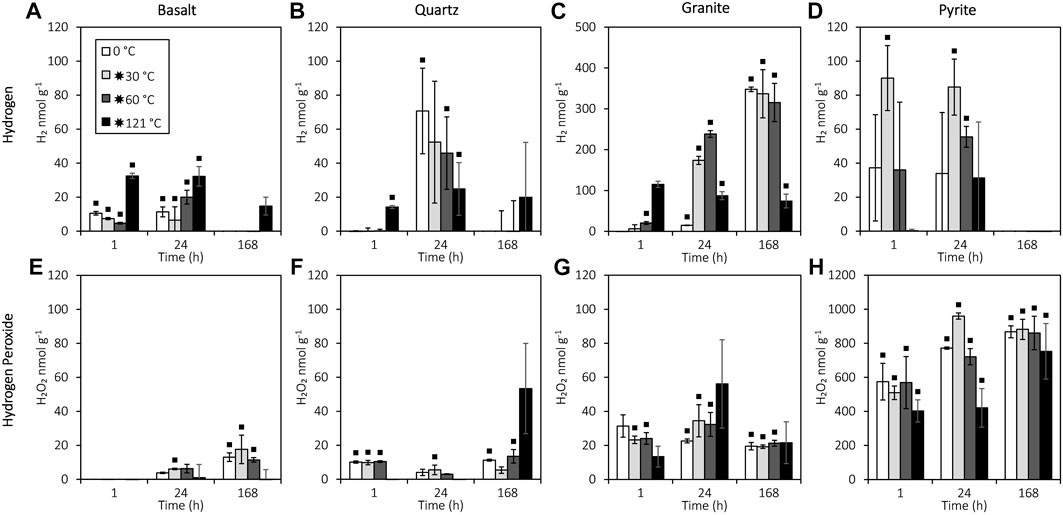
FIGURE 2. H2O2 and H2 production from reactions of water with crushed basalt, quartz, pyrite, and granite. All data are blank subtracted (see Supplementary Table S2 for the blank-subtracted data, and Supplementary Table S3 and Figure 2 for the blank data). A black square indicates a significant difference from the blanks (Mann–Whitney U: p<0.05). Error bars represent the standard error of the mean. The detection limits for H2 and H2O2 were 0.2 nmol g-1 and 9.2 nmol g-1, respectively. (A) H2 production from crushed basalt. (B) H2 production from crushed quartz. (C) H2 production from crushed granite. (D) H2 production from crushed pyrite. (E) H2O2 production from crushed basalt. (F) H2O2 production from crushed quartz. (G) H2O2 production from crushed granite. (H) H2O2 production from crushed pyrite.
Pyrite produced significantly more H2O2 than the silicates (t-test: t35.181=−18.066, p<0.001) and produced an order of magnitude more H2O2 than H2 (reaching 391 μmol L-1 H2O2; Figure 2G). However, unlike H2 production, flash heating to 30 or 60 °C did not significantly affect H2O2 production from granite, basalt, or quartz compared to constant 0 °C incubation (ANOVA: F2,78=0.033, p=0.968). H2O2 concentrations were not related to H2 in the granite experiment (Spearman’s: rs=−0.172, n=35, p=0.322), but H2O2 and H2 were negatively correlated in the basalt (Spearman’s: rs=−0.535, n=36, p=0.001), quartz (Spearman’s: rs=−0.409, n=36, p=0.013), and pyrite (Spearman’s: rs=−0.386, n=36, p=0.020) experiments.
Granite and basalt released detectable Fe3+ into the water, while pyrite released higher concentrations of Fe2+ and Fe3+. Neither Fe2+ nor Fe3+ was significantly correlated (Spearman’s: rs=0.123, n=36, p=0.475; rs=0.140, n=36, p=0.415) with H2O2 concentration in the crushed pyrite experiment. Aqueous Fe2+ in pyrite experiments was not significantly correlated (Spearman’s: rs=0.262, n=36, p=0.123) with H2. However, Fe2+ and Fe3+ were significantly correlated with each other (Spearman’s: rs=0.640, n=36, p<0.001; see Supplementary Figure S3 for blanks) despite two orders of magnitude difference in their concentrations (Figure 3). Fe2+ and Fe3+ from crushed granite (Spearman’s: rs=−0.657, n=36, p<0.001) and basalt (Spearman’s: rs=−0.735, n=36, p<0.001) were also significantly correlated (Figure 3). Notably, all Fe2+ concentrations from the basalt, granite, and quartz experiments were lower than the blanks (Figure 3).
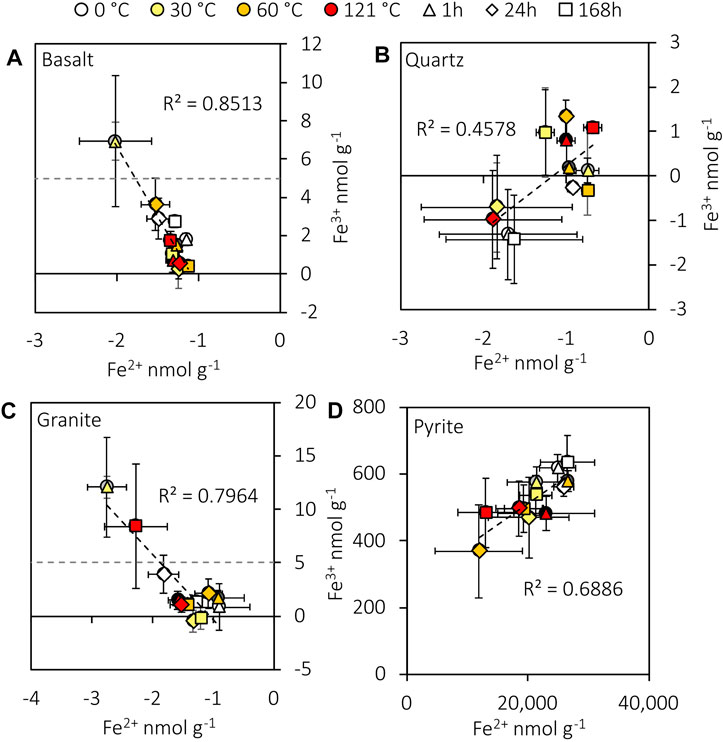
FIGURE 3. Plots of aqueous Fe2+ and Fe3+ generated from crushed basalt (A), quartz (B), granite (C), and pyrite (D). Data are blank subtracted. The experimental detection limits for Fe2+ and Fe3+ are 4 and 5 nmol g-1, respectively. The negative concentrations indicate a loss of Fe relative to the mean blank concentrations (see Supplementary Figure S3 for the blanks). Error bars represent the standard error of the mean.
Results for 24 h show that flash heating to 30 or 60 °C increases H2 production from granite, consistent with the thermal activation of Si• (Telling et al., 2015; Parkes et al., 2019; Eq. 2; Eq. 3). Heating to only 30 °C for 5 min (Figure 2) caused an order of magnitude increase in H2 production from crushed granite after 24 h (15 vs. 174 nmol g-1), indicating that even very temporary increases to modest temperatures have the capacity to promote faster H2 production from the reaction of H2O with Si•. Glacier slip can release 4 W/m2 of frictional heating (Benn et al., 2019), with the stick–slip events lasting up to 10–30 min (Bindschadler et al., 2003), suggesting that glaciers with stick–slip motion may have the potential to significantly boost subglacial H2 generation rates. Notably, after 1 week, the H2 production from a constant incubation at 0 °C (no heating) had “caught up” to samples flash heated to 30 or 60 °C, demonstrating that increased H2 production from flash heating to 30 or 60 °C does not ultimately affect maximum H2 yield. Although the heat generated from stick–slip behaviour may not raise the bulk temperature of subglacial water by more than a fraction of a degree (Kita et al., 1982; Hart et al., 2011), the transient increase in the temperature of the mineral surface free radicals at rock abrasion sites (Figure 1) may potentially drive higher concentration bursts of H2 that could help support microbial communities (Telling et al., 2015). We recommend further experiments using shorter-duration temperatures to further test this hypothesis.
In addition, 121 °C flash heating caused a burst of H2 production after 1 h (Figure 3) in all other silicates. However, the results for 168 h showed further inhibition of H2 production by 121 °C flash heating of basalt and quartz. The maximum H2 yield from granite at 121 °C was also significantly (p<0.05) reduced compared to lower temperatures (Figure 3). The inhibition of H2 generation at 121 °C is consistent with the reaction of H• with SiO• at high temperatures (>90 °C; Stone et al., 2022; Eq. 8), resulting in the formation of ≡SiOH at mineral surfaces instead of H2 generation (Eq. 2; Eq. 3; Kita et al., 1982). We noted, however, that, due to logistical constraints, temperatures > 90 °C were maintained for 40 min in the 121 °C experiments, although such sustained temperature increases are highly unlikely during subglacial rock grinding. The inhibitory effect of this mechanism on in situ subglacial H2 generation yields may therefore be minimal. The high generation of H2O2 (significantly higher than blank, p<0.05; Supplementary Material S1.1) at lower temperatures (Figure 3) most likely does not result from the reaction of SiO• but ultimately from the more reactive SiOO• that can be formed from trace O2 in the experiments (Eqs 10, 12 and 13; Kita et al., 1982; Stone et al., 2022) or from the homolytic cleavage of peroxy linkages (Eqs 11–13; He et al., 2023).
O2 mass balance calculations (Supplementary Material S1.2.2) indicate that there was sufficient trace oxygen in the vials (235 nmol g-1) to explain the generation of SiOO• in sufficient quantities to produce the observed H2O2 from crushed silicates (max of 56.1 nmol g-1). We suggest that, at 121 °C, no significant H2O2 was generated by this mechanism as fewer Si• sites were available for reaction with O2 due to faster reaction rates with H2O to generate H•, which were then consumed by reaction with activated SiO• sites (Kita et al., 1982). SiO• at higher temperatures may therefore inhibit some H2O2 production in the presence of O2, although H2O2 can still be generated by the homolytic cleavage of peroxy linkages (Si-O-O-Si). Additional small quantities of H2O2 (and O2) may also have been produced independently of the existing O2 by the reaction of water with SiO• at low temperatures. The SiO• may have been formed by the breakage of Si-O-Si bonds (Eq. 1, Eq. 5, Eq. 7) or the uniaxial stressing of peroxy linkages (Si-O-O-Si; He et al., 2021).
Fenton reactions are likely to have exerted additional controls on H2O2 concentrations in the experiments (Fenton, 1894; Edgar et al., 2022). Aqueous Fe2+ concentrations in the granite and basalt experiments were lower than the blanks in all experiments (Figure 3), consistent with the reaction of Fe2+ with H2O2. In addition, there was a negative correlation between Fe2+ and Fe3+ from both crushed rocks (Figure 3), providing further evidence that Fe2+ may have oxidised to Fe3+. In addition, H2O2 and H2 concentrations were negatively correlated in all experiments except the granite, suggesting that H2O2 may also have reacted with H2. This may also have occurred indirectly through the generation of •OH from the Fenton reactions, which may have reacted with H2 (Allen et al., 1952; Edgar et al., 2022). Therefore, the H2O2 concentrations measured in these experiments (Figure 3) are likely to have underestimated the total H2O2 production potential of crushed granite and basalt.
H2O2 concentrations produced from crushed pyrite (minimum 12 μmol g-1) greatly exceeded the estimated concentrations of O2 in the experiments (0.2 μmol g-1). Therefore, while reactions of O2 with the mineral surface may have contributed to ROS generation (Schoonen et al., 2010, Zhang et al., 2016), the majority of H2O2 in these experiments seems to have come from a different source. The H2O2 from the crushed pyrite experiments was likely generated by reactions of water with the crushed pyrite surface. Borda et al. (2003) outlined a mechanism involving the reaction of adsorbed H2O with Fe3+ formed on the mineral surface (Eq. 4; Eq. 5). However, further investigations have questioned the thermodynamic feasibility of the oxidation of water at the Fe3+ sites (Buckley and Woods, 2015). Instead, reactions of water with the mineral surface at sulfur-deficient sites may have been the predominant •OH generation pathway (Zhang et al., 2016; Xian et al., 2019). Therefore, the detailed reaction mechanisms at the pyrite surface remain unclear. Nevertheless, the 10× higher surface area of pyrite likely contributed to 5,000% higher concentrations of H2O2 than the silicates when normalised to mass (Figure 2). However, when normalised to surface area, the H2O2 concentrations from pyrite are in the same order of magnitude as those from silicates (max of 36.7 nmol m2 compared to a mean of 16.1 nmol m-2 from the silicates). Therefore, the ease with which pyrite is ground likely exposes large fractured mineral surfaces in subglacial systems, resulting in enhanced mechanochemical reactions and H2O2 production. Gill-Olivas et al. (2021)have previously suggested the potential for pyrite to mechanochemically generate H2O2 in subglacial sediments. We show here for the first time that crushing pure pyrite has the potential to generate at least an order of magnitude more H2O2 than silicate rocks and minerals for the same energy input (500 rpm, 30 min), supporting the theory that pyrite is a key mineralogical control on subglacial ecosystems (Mitchell et al., 2013; Gill-Olivas et al., 2021). However, our H2O2 concentrations generated from crushed pure pyrite (mean of 0.6 μmol g-1 after 1 h at 0 °C) were far lower than those generated from crushed subglacial Lake Whillans sediment (15 μmol g-1) using a similar energy input during crushing (500 rpm for 30 min). Adjusting for the pyrite content of subglacial sediments (0.56% at Robertson Glacier; Mitchell et al., 2013), we predict that pyrite can only produce 3.4 nmol H2O2 per gramme of sediment, only 0.02% of the concentrations recorded by Gill-Olivas et al. (2021). We note that Gill Olivas et al. (2021) did not measure surface area and had a higher rock–water ratio, limiting an accurate quantitative comparison. In addition, the sediment load in Gill-Olivas et al. (2021) was much lower at 15 g than at 45 g, which may have affected the grinding intensity and consequent surface area generation. However, the discrepancy in H2O2 concentrations may be explained by the difference in sampling times in the experiments. H2O2 production from pyrite occurs in <1 min (Borda et al., 2003), and Gill-Olivas et al. (2021) measured H2O2 production after 2 min, whereas we measured H2O2 only after 1 h. As indicated by the high concentration of aqueous Fe2+ in our crushed pyrite experiments (reaching 38 μmol g-1) and its ratio to Fe3+ (Figure 3), we suggest that Fenton reactions (Fubini and Hubbard, 2003; Eq. 10) may have removed up to 14 μmol g-1 H2O2 before the 1-h time point. Data from Borda et al. (2001) further support this theory as they produced 8.5 μmol g-1 H2O2 after 2 min from crushed pyrite crystals (unknown crushing intensity; Borda et al., 2001), much closer to the values recorded by Gill Olivas et al. (2021). The fact that our subglacial sediment-adjusted H2O2 concentrations are lower than those of Gill-Olivas et al. (2021) could therefore be interpreted as the residual concentration following its initial production and subsequent rapid destruction (Edgar et al., 2022). Alternatively, the H2O2 assay may not have measured all of the H2O2 generated during the experiments. We note that pH was not measured in this study due to low sample volumes; it is possible that the crushing and dissolution of pyrite generated sufficiently low pH values (< pH 5) to slow the formation of the 2Cu(DMP)2+ colorimetric complex used to assay H2O2 (Baga et al., 1988). We note that additional investigations of H2O2 generation from pyrite over shorter time periods with a variety of complimentary methods to analyse H2O2 revealed no relationship between the pyrite content of crushed rock and H2O2 generation potential (Gill-Olivas et al., 2022).
Although some Fe2+ may have reacted with H2O2, substantial concentrations of Fe2+ were analysed from crushed pyrite experiments (mean of 21 μmol g-1; Supplementary Figure S4). This source of Fe2+ may help explain the presence of iron oxyhydroxide particles in subglacial systems, which are thought to form from the oxidation of Fe2+ (Hawkings et al., 2014; Nixon et al., 2017). In such systems, assuming a typical pyrite content in subglacial sediments of 0.56% (Mitchell et al., 2013), 121 nmol of Fe2+ can be released per gramme of sediment, based on 0.56% of the average Fe2+ generation from pyrite after 24 h and excluding 168 h as the Fe2+ concentration is likely to have decreased due to Fenton reactions (Fenton, 1894; Edgar et al., 2022).
Subglacial microorganisms such as Sideroxydans sp. and Thiobacillus sp. (Mitchell et al., 2013; Boyd et al., 2014) can utilise this Fe2+ as an electron donor—for example, coupled to O2 as an electron acceptor, with a Gibbs free energy of reaction (∆Gr°)= −52.2 kJ mol-1 using standard Gibbs free energies of formation at 2 °C (Amend and Shock, 2001) based on Eq. 14 (Boyd et al., 2014).
Theoretically, H2O2 generated during mechanochemical reactions (Figure 2) could be used as a source of O2 even in habitats isolated from atmospheric O2 as many microorganisms (including subglacial microorganisms; Kayani et al., 2018) contain ROS defence enzymes such as catalase. Catalase protects microbes from potentially toxic H2O2 by disproportioning it to H2O and O2 (Eq. 15; George, 1947).
Under glaciers, Fe-utilising microbes may use this H2O2-derived O2, or possibly even H2O2 directly if any microorganisms have evolved the ability to use H2O2 as an electron acceptor (Khademian and Imlay, 2017), to couple with the Fe2+ released from pyrite (Boyd et al., 2014).
Our experimental data also demonstrate for the first time that pure crushed pyrite can produce H2 under low-O2 conditions (Figure 3). The mechanism is unlikely to involve the oxidation of dissolved Fe2+ (e.g., Murray et al., 2020), as Fe2+ concentrations were not significantly (p<0.05) correlated with H2. The H2 generated from crushed pyrite surfaces could instead potentially involve the oxidation of surface-bound ≡Fe2+ linked to the reduction of H+ or water (Figure 4A), as observed for Fe2+-containing silicates (Parkes et al., 2007; Mayhew et al., 2013; Okland et al., 2014; Edgar et al., 2022). However, the thermodynamic feasibility of the ≡Fe2+ oxidation step is unclear. A second alternative pathway could be the reduction of adsorbed water by surface S defect sites (Figure 4B). Although steps 4bi. and 4bii. are well supported by experimental and modelling data (Xian et al., 2019), the thermodynamic feasibility of the final electron transfer from the S defect sites to H (4Biii.) is again uncertain and would require further testing. Although the mechanism for H2 generation is therefore uncertain, it is clear from Figure 2B that there are also additional mechanisms that remove H2. This can be explained by the reaction of H2 with •OH formed at the surface of the pyrite (i.e., the Allen chain reaction; Eq. 16; Eq. 17; Edgar et al., 2022; Allen et al., 1952).
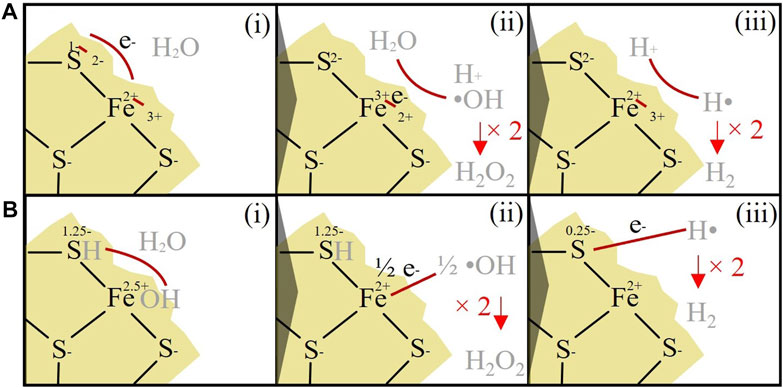
FIGURE 4. H2O2 and H2 production from the surface of crushed pyrite (A) i) In this model (based on Borda et al., 2003), it is assumed that the defect S site has an initial redox state of −2, and Fe, a redox state of +2. Fe2+ is oxidised to Fe3+ via the transfer of an electron to the adjacent S site. ii) •OH and H+ are generated from the reaction of water with surface-bound Fe3+, which reduce Fe3+ back to Fe2+. Two •OH can then react together to generate H2O2. iii) 2H+ react with Fe2+ to reform Fe3+ at the pyrite surface and generate H2. (B) i) In this model (based on Xian et al., 2019), it is assumed that the S defect site has an initial redox state of −1.25, and the Fe site has a redox state of +2.5. Water is adsorbed on the surface and split, generating FeOH and SH. ii) Electrons are transferred from the OH group to the Fe2.5+ sites, resulting in surface-bound Fe2+ and •OH (note that two Fe2.5+ defect sites would have to be reduced to generate one •OH). Two •OH then react together to generate H2O2. iii) The S1.25- site donates an electron to H, resulting in the release of H•. Two H• can then react to form H2.
Flash heating to 30 °C also generated higher H2 concentrations (Figure 2), presumably via an increased rate of oxidation of Fe2+. Small bursts of H2 may therefore be generated as glaciers slip and release energy, temporarily raising temperatures (Figure 1). As mentioned above, assuming a typical pyrite concentration of 0.56% in subglacial systems and using the same calculation as with Fe2+, there can be a release of 0.26 nmol of H2 per gramme of sediment. H2 generation from pyrite is therefore likely to be negligible for subglacial ecosystems when compared to silicates such as granite, which are more abundant and produce more H2 per gramme (Figure 2).
H2 generation from crushed rock–water reactions has previously been shown to occur at temperatures relevant to subglacial environments (0 °C). However, we demonstrated that rapid increases to even moderate temperatures that might be expected at grinding sites during a glacier slip (30°C–60 °C) can increase the rate of H2 production by up to 1500% over 24 h. In addition, heating to high temperatures (121 °C, potentially expected at sites where glaciers fracture rock) may have the potential to produce rapid bursts of H2 in subglacial ecosystems. Most importantly, our data indicate that pyrite is likely to be a more significant source of mechanochemically generated H2O2 and Fe2+ than silicate minerals under glaciers. The release of Fe2+ and H2O2 (with the use of catalase to generate O2) could provide additional electron donors and acceptors for subglacial microbial communities. These mechanochemical energy sources may not only be relevant to subglacial ecosystems but could alter the geochemistry and potentially help support life in other cold subsurface environments that experience fluctuating temperatures, potentially including shallow subseafloor sediments and the subsurface oceans of icy moons.
The original contributions presented in the study are publicly available. This data can be found here: Telling, J. (2023). Crushed rock-water experimental data investigating the role of flash heating in hydrogen and hydrogen peroxide from silicate rocks and pyrite. NERC EDS National Geoscience Data Centre. (Dataset). https://doi.org/10.5285/d71310b7-e5af-4979-be0c-7640d5fd71e9.
JS performed the majority of the laboratory work, helped design the detailed methods, conducted data analyses and initial interpretations, prepared figures, and co-wrote the manuscript. JE aided with the development of theories and concepts for the project and discussion, aided in chemical analyses, and contributed to the manuscript. JR assisted with chemical analyses, laboratory preparations, and initial interpretations. BG-O performed the surface area analysis. MT contributed to the manuscript. JG conducted the XRD analysis. CX assisted with XRD analysis. JT conceived the project idea and overall methodology, supervised the laboratory work, conducted some of the laboratory work, and co-wrote the manuscript.
This research was supported by the United Kingdom Space Agency Aurora grants ST/R001421/1 and ST/S001484/1 (to JT), and NERC grants NE/S001670/1 (to MT and JT) and NE/W005506/1 (to JT).
The authors thank Alex Charlton for assistance with HPLC analyses, Lisa Deveaux-Robinson and Dave Earley for technical assistance in the laboratories, and Ana Contessa for assistance with grain size analysis.
The authors BG-O and JT declare that they were editorial board members of Frontiers at the time of submission. This had no impact on the peer review process or the final decision.
The remaining authors declare that the research was conducted in the absence of any commercial or financial relationships that could be construed as a potential conflict of interest.
All claims expressed in this article are solely those of the authors and do not necessarily represent those of their affiliated organizations, or those of the publisher, the editors and the reviewers. Any product that may be evaluated in this article, or claim that may be made by its manufacturer, is not guaranteed or endorsed by the publisher.
The Supplementary Material for this article can be found online at: https://www.frontiersin.org/articles/10.3389/fgeoc.2023.1180893/full#supplementary-material
Allen, A. O., Hochanadel, C., Ghormley, J., and Davis, T. (1952). Decomposition of water and aqueous solutions under mixed fast neutron and Γ-radiation. J. Phys. Chem. 56, 575–586. doi:10.1021/j150497a007
Amend, J. P., and Shock, E. L. (2001). Energetics of overall metabolic reactions of thermophilic and hyperthermophilic archaea and bacteria. Fems Microbiol. Rev. 25, 175–243. doi:10.1111/j.1574-6976.2001.tb00576.x
Araujo, F., Yokoyama, L., Teixeira, L., and Campos, J. (2011). Heterogeneous fenton process using the mineral hematite for the discolouration of a reactive dye solution. Braz. J. Chem. Eng. 28, 605–616. doi:10.1590/S0104-66322011000400006
Baga, A. N., Johnson, G. A., Nazhat, N. B., and Saadalla-Nazhat, R. A. (1988). A simple spectrophotometric determination of hydrogen peroxide at low concentrations in aqueous solution. Anal. Chim. Acta 204, 349–353. doi:10.1016/S0003-2670(00)86374-6
Bardestani, R., Patience, G. S., and Kaliaguine, S. (2019). Experimental methods in chemical engineering: Specific surface area and pore size distribution measurements—bet, bjh, and dft. Can. J. Chem. Eng. 97, 2781–2791. doi:10.1002/cjce.23632
Benn, D. I., Jones, R. L., Luckman, A., Fürst, J. J., Hewitt, I., and Sommer, C. (2019). Mass and enthalpy budget evolution during the surge of a polythermal glacier: A test of theory. J. Of Glaciol. 65, 717–731. doi:10.1017/jog.2019.63
Bindschadler, R. A., King, M. A., Alley, R. B., Anandakrishnan, S., and Padman, L. (2003). Tidally controlled stick-slip Discharge of a west antarctic ice. Science 301, 1087–1089. doi:10.1126/science.1087231
Borda, M. J., Elsetinow, A. R., Schoonen, M. A., and Strongin, D. R. (2001). Pyrite-induced hydrogen peroxide formation as a driving force in the evolution of photosynthetic organisms on an early earth. Astrobiology 1, 283–288. doi:10.1089/15311070152757474
Borda, M. J., Elsetinow, A. R., Strongin, D. R., and Schoonen, M. A. (2003). A mechanism for the production of hydroxyl radical at surface defect sites on pyrite. Geochimica Cosmochimica Acta 67, 935–939. doi:10.1016/S0016-7037(02)01222-X
Boyd, E. S., Hamilton, T. L., Havig, J. R., Skidmore, M. L., and Shock, E. L. (2014). Chemolithotrophic primary production in a subglacial ecosystem. Appl. And Environ. Microbiol. 80, 6146–6153. doi:10.1128/AEM.01956-14
Buckley, A., and Woods, R. (2015). Can sulfide minerals oxidize water to hydrogen peroxide during grinding in the absence of dissolved oxygen? Min. Metallurgy Explor. 32, 59–61. doi:10.1007/BF03402358
Christner, B. C., Priscu, J. C., Achberger, A. M., Barbante, C., Carter, S. P., Christianson, K., et al. (2014). A microbial ecosystem beneath the west antarctic ice sheet. Nature 512, 310–313. doi:10.1038/nature13667
Cook, S. J., Swift, D. A., Kirkbride, M. P., Knight, P. G., and Waller, R. I. (2020). The empirical basis for modelling glacial erosion rates. Nat. Commun. 11, 759. doi:10.1038/s41467-020-14583-8
Edgar, J. O., Gilmour, K., White, M. L., Abbott, G. D., and Telling, J. (2022). Aeolian driven oxidant and hydrogen generation in martian regolith: The role of mineralogy and abrasion temperature. Earth And Planet. Sci. Lett. 579, 117361. doi:10.1016/j.epsl.2021.117361
Fenton, H. J. H. (1894). Lxxiii.—oxidation of tartaric acid in presence of iron. J. Of Chem. Soc. Trans. 65, 899–910. doi:10.1039/CT8946500899
Fischer, L., Huggel, C., Kääb, A., and Haeberli, W. (2013). Slope failures and erosion rates on a glacierized high-mountain face under climatic changes. Earth Surf. Process. landforms 38, 836–846. doi:10.1002/esp.3355
Fischer, U. H., and Clarke, G. K. (1997). Stick–slip sliding behaviour at the base of a glacier. Ann. Of Glaciol. 24, 390–396. doi:10.3189/S0260305500012490
Fubini, B., Bolis, V., and Giamello, E. (1987). The surface chemistry of crushed quartz dust in relation to its pathogenicity. Inorganica Chim. Acta 138, 193–197. doi:10.1016/S0020-1693(00)81222-0
Fubini, B., Giamello, E., Volante, M., and Bolis, V. (1990). Chemical functionalities at the silica surface determining its reactivity when inhaled. Formation and reactivity of surface radicals. Toxicol. And Industrial Health 6, 571–598.
Fubini, B., and Hubbard, A. (2003). Reactive oxygen species (ROS) and reactive nitrogen species (RNS) generation by silica in inflammation and fibrosis. Free Radic. Biol. And Med. 34, 1507–1516. doi:10.1016/s0891-5849(03)00149-7
George, P. (1947). Reaction between catalase and hydrogen peroxide. Nature 160, 41–43. doi:10.1038/160041a0
Gill Olivas, B. (2019). Rock comminution of Subglacial Lake sediments as a potential source of energy and nutrients to the Subglacial Lake Whillans microbial ecosystem. PhD thesis. University Of Bristol.
Gill-Olivas, B., Telling, J., Skidmore, M., and Tranter, M. (2022). Abrasion of sedimentary rocks as a source of hydrogen peroxide and nutrients to subglacial ecosystems. Egusphere, 1–21. doi:10.5194/egusphere-2022-908
Gill-Olivas, B., Telling, J., Tranter, M., Skidmore, M., Christner, B., O’doherty, S., et al. (2021). Subglacial erosion has the potential to sustain microbial processes in Subglacial Lake Whillans, Antarctica. Commun. Earth Environ. 2, 134–212. doi:10.1038/s43247-021-00202-x
Hart, J. K., Rose, K. C., and Martinez, K. (2011). Subglacial till behaviour derived from in situ wireless multi-sensor subglacial probes: Rheology, hydro-mechanical interactions and till formation. Quat. Sci. Rev. 30, 234–247. doi:10.1016/j.quascirev.2010.11.001
Hawkings, J. R., Wadham, J. L., Tranter, M., Raiswell, R., Benning, L. G., Statham, P. J., et al. (2014). Ice sheets as a significant source of highly reactive nanoparticulate iron to the oceans. Nat. Commun. 5, 3929–3938. doi:10.1038/ncomms4929
He, H., Wu, X., Xian, H., Zhu, J., Yang, Y., Lv, Y., et al. (2021). An abiotic source of archean hydrogen peroxide and oxygen that pre-dates oxygenic photosynthesis. Nat. Commun. 12, 6611. doi:10.1038/s41467-021-26916-2
He, H., Wu, X., Zhu, J., Lin, M., Lv, Y., Xian, H., et al. (2023). A mineral-based origin of Earth’s initial hydrogen peroxide and molecular oxygen. Proc. Natl. Acad. Sci. U. S. A. 120, e2221984120. doi:10.1073/pnas.2221984120
Irfan, M., Zhou, L., Bai, Y., Yuan, S., Liang, T.-T., Liu, Y.-F., et al. (2019). Insights into the hydrogen generation from water-iron rock reactions at low temperature and the key limiting factors in the process. Int. J. Hydrogen Energy 44, 18007–18018. doi:10.1016/j.ijhydene.2019.05.086
Kaur, J., Rickman, D., and Schoonen, M. A. (2016). Reactive oxygen species (ROS) generation by lunar simulants. Acta Astronaut. 122, 196–208. doi:10.1016/j.actaastro.2016.02.002
Kayani, M., Doyle, S. M., Sangwan, N., Wang, G., Gilbert, J. A., Christner, B. C., et al. (2018). Metagenomic analysis of basal ice from an Alaskan glacier. Microbiome 6, 123. doi:10.1186/s40168-018-0505-5
Khademian, M., and Imlay, J. A. (2017). Escherichia coli cytochrome C peroxidase is a respiratory oxidase that enables the use of hydrogen peroxide as a terminal electron acceptor. Proc. Natl. Acad. Sci. U. S. A. 114, E6922–E6931. doi:10.1073/pnas.1701587114
Kita, I., Matsuo, S., and Wakita, H. (1982). H2 generation by reaction between H2O and crushed rock: An experimental study on H2 degassing from the active fault zone. J. Geophys. Res. Solid Earth 87, 10789–10795. doi:10.1029/JB087IB13P10789
Macdonald, M. L., Wadham, J. L., Telling, J., and Skidmore, M. L. (2018). Glacial erosion liberates lithologic energy sources for microbes and acidity for chemical weathering beneath glaciers and ice sheets. Front. Earth Sci. 6, 212. doi:10.3389/feart.2018.00212
Mayhew, L. E., Ellison, E., McCollom, T., Trainor, T., and Templeton, A. (2013). Hydrogen generation from low-temperature water–rock reactions. Nat. Geosci. 6, 478–484. doi:10.1038/ngeo1825
McCollom, T. M., and Bach, W. (2009). Thermodynamic constraints on hydrogen generation during serpentinization of ultramafic rocks. Geochimica Cosmochimica Acta 73, 856–875. doi:10.1016/j.gca.2008.10.032
McCollom, T. M., and Donaldson, C. (2016). Generation of hydrogen and methane during experimental low-temperature reaction of ultramafic rocks with water. Astrobiology 16, 389–406. doi:10.1089/ast.2015.1382
Mitchell, A. C., Lafrenière, M. J., Skidmore, M. L., and Boyd, E. S. (2013). Influence of bedrock mineral composition on microbial diversity in a subglacial environment. Geology 41, 855–858. doi:10.1130/g34194.1
Murray, J., Clément, A., Fritz, B., Schmittbuhl, J., Bordmann, V., and Fleury, J. M. (2020). Abiotic hydrogen generation from biotite-rich granite: A case study of the soultz-sous-forêts geothermal site, France. Appl. Geochem. 119, 104631. doi:10.1016/j.apgeochem.2020.104631
Nixon, S. L., Telling, J. P., Wadham, J. L., and Cockell, C. S. (2017). Viable cold-tolerant iron-reducing microorganisms in geographically diverse subglacial environments. Biogeosciences 14, 1445–1455. doi:10.5194/bg-14-1445-2017
Okland, I., Huang, S., Thorseth, I., and Pedersen, R. (2014). formation of H2, CH4 and N-species during low-temperature experimental alteration of ultramafic rocks. Chem. Geol. 387, 22–34. doi:10.1016/j.chemgeo.2014.08.003
Parkes, R. J., Berlendis, S., Roussel, E. G., Bahruji, H., Webster, G., Oldroyd, A., et al. (2019). Rock-crushing derived hydrogen directly supports a methanogenic community: Significance for the deep biosphere. Environ. Microbiol. Rep. 11, 165–172. doi:10.1111/1758-2229.12723
Parkes, R. J., Linnane, C. D., Webster, G., Sass, H., Weightman, A. J., Hornibrook, E. R., et al. (2011). Prokaryotes stimulate mineral H2 formation for the deep biosphere and subsequent thermogenic activity. Geology 39, 219–222. doi:10.1130/G31598.1
Parkes, R. J., Wellsbury, P., Mather, I. D., Cobb, S. J., Cragg, B. A., Hornibrook, E. R., et al. (2007). Temperature activation of organic matter and minerals during burial has the potential to sustain the deep biosphere over geological timescales. Org. Geochem. 38, 845–852. doi:10.1016/j.orggeochem.2006.12.011
Schoonen, M. A., Harrington, A. D., Laffers, R., and Strongin, D. R. (2010). Role of hydrogen peroxide and hydroxyl radical in pyrite oxidation by molecular oxygen. Geochimica Cosmochimica Acta 74, 4971–4987. doi:10.1016/j.gca.2010.05.028
Sevestre, H., and Benn, D. I. (2015). Climatic and geometric controls on the global distribution of surge-type glaciers: Implications for a unifying model of surging. J. Of Glaciol. 61, 646–662. doi:10.3189/2015JoG14J136
Stone, J., Edgar, J., Gould, J., and Telling, J. (2022). Tectonically-driven oxidant production in the hot biosphere. Nat. Commun. 13, 4529–4610. doi:10.1038/s41467-022-32129-y
Telling, J., Boyd, E., Bone, N., Jones, E., Tranter, M., Macfarlane, J., et al. (2015). Rock comminution as a source of hydrogen for subglacial ecosystems. Nat. Geosci. 8, 851–855. doi:10.1038/ngeo2533
Ueki, R., Imaizumi, Y., Iwamoto, Y., Sakugawa, H., and Takeda, K. (2020). Factors controlling the degradation of hydrogen peroxide in river water, and the role of riverbed sand. Sci. Total Environ. 716, 136971. doi:10.1016/j.scitotenv.2020.136971
Viollier, E., Inglett, P., Hunter, K., Roychoudhury, A., and Van Cappellen, P. (2000). The ferrozine method revisited: Fe (II)/Fe (III) determination in natural waters. Appl. Geochem. 15, 785–790. doi:10.1016/S0883-2927(99)00097-9
Wadham, J. L., Tranter, M., Tulaczyk, S., and Sharp, M. (2008). Subglacial methanogenesis: A potential climatic amplifier? Glob. Biogeochem. Cycles 22, 22. doi:10.1029/2007GB002951
Xian, H., Zhu, J., Tan, W., Tang, H., Liu, P., Zhu, R., et al. (2019). The mechanism of defect induced hydroxylation on pyrite surfaces and implications for hydroxyl radical generation in prebiotic chemistry. Geochimica Cosmochimica Acta 244, 163–172. doi:10.1016/j.gca.2018.10.009
Yi, J., Bahrini, C., Schoemaecker, C., Fittschen, C., and Choi, W. (2012). Photocatalytic decomposition of H2O2 on different TiO2 surfaces along with the concurrent generation of HO2 radicals monitored using cavity ring down spectroscopy. J. Phys. Chem. C 116, 10090–10097. doi:10.1021/jp301405e
Zhang, P., Yuan, S., and Liao, P. (2016). Mechanisms of hydroxyl radical production from abiotic oxidation of pyrite under acidic conditions. Geochimica et Cosmochimica Acta 172, 444–457. doi:10.1016/j.gca.2015.10.015
Keywords: hydrogen, hydrogen peroxide, subglacial, microbial, temperature, mechanochemistry, energy
Citation: Stone J, Edgar JO, Rutherford J, Gill-Olivas B, Tranter M, Gould JA, Xavier CM and Telling J (2023) Flash heating boosts the potential for mechanochemical energy sources for subglacial ecosystems. Front. Geochem. 1:1180893. doi: 10.3389/fgeoc.2023.1180893
Received: 06 March 2023; Accepted: 02 May 2023;
Published: 23 May 2023.
Edited by:
Yiliang Li, The University of Hong Kong, Hong Kong, SAR ChinaReviewed by:
Xiao Wu, Chinese Academy of Sciences, ChinaCopyright © 2023 Stone, Edgar, Rutherford, Gill-Olivas, Tranter, Gould, Xavier and Telling. This is an open-access article distributed under the terms of the Creative Commons Attribution License (CC BY). The use, distribution or reproduction in other forums is permitted, provided the original author(s) and the copyright owner(s) are credited and that the original publication in this journal is cited, in accordance with accepted academic practice. No use, distribution or reproduction is permitted which does not comply with these terms.
*Correspondence: Jon Telling, am9uLnRlbGxpbmdAbmV3Y2FzdGxlLmFjLnVr
†Present Address: Jordan Stone, Department of Earth Science and Engineering, Imperial College London, London, United Kingdom
Disclaimer: All claims expressed in this article are solely those of the authors and do not necessarily represent those of their affiliated organizations, or those of the publisher, the editors and the reviewers. Any product that may be evaluated in this article or claim that may be made by its manufacturer is not guaranteed or endorsed by the publisher.
Research integrity at Frontiers
Learn more about the work of our research integrity team to safeguard the quality of each article we publish.