 Quan Ye1
 Hong Ye
94% of researchers rate our articles as excellent or good
Learn more about the work of our research integrity team to safeguard the quality of each article we publish.
Find out more
ORIGINAL RESEARCH article
Front. Genet., 10 April 2025
Sec. Computational Genomics
Volume 16 - 2025 | https://doi.org/10.3389/fgene.2025.1554116
This article is part of the Research TopicComputational Approaches Integrate Multi-Omics Data for Disease Diagnosis and TreatmentView all 6 articles
Background: Glutathione peroxidase 3 (GPX3) is a strong antioxidant. While elevated GPX3 levels are linked to diverse pathologies, its role in liver failure (LF) remains underexplored. This study investigates GPX3’s diagnostic potential and mechanistic contributions to LF pathogenesis.
Methods: We integrated two high-quality liver tissue datasets (GSE38941 and GSE14668) from the Gene Expression Omnibus (GEO) database. Gene Ontology and Kyoto Encyclopedia of Genes and Genomes analyses were conducted to identify potential biomarkers associated with liver failure. The Comparative Toxicogenomics Database was used to predict the function of GPX3. In addition, in our study, we verified the target gene mRNA expression level in 40 patients with acute or chronic acute liver failure (ACHBLF) by RT-QCPR experiment and detect the methylation status of GPX3 promoter of ACHBLF patients with methylation specific PCR (MSP).
Results: The results demonstrate that GPX3 drives pathogenic mechanisms in liver failure through oxidative stress-related pathways (e.g., collagen cross-linking, extracellular matrix remodeling) and immune dysregulation (e.g., macrophage activation, PD-1/CTLA-4 signaling). CPX8, PRDX6, GPX4, GSS, GSR, TXN, GPX7, PPARGC1A, ALOX15, and ALOX5 have been identified as key immune-related genes. Furthermore, there were significant differences in immune cell infiltration between the high and low expression groups of GPX3 groups. Immune infiltration analysis demonstrated strong correlations between GPX3 expression and key immune markers (p < 0.05), suggesting its role in modulating inflammatory responses. Additionally, GPX3 increased susceptibility to aerosols, cyclosporin and dexamethasone was observed in patients with elevated levels of GPX3. The mRNA expression of GPX3 was much higher in ACHBLF patients than in other groups. In ACHBLF patients, the group with GPX3 methylated promoter had higher mortality than those without.
Conclusion: In conclusion, GPX3 is a promising diagnostic biomarker for liver failure. Its promoter methylation status may serve as a prognostic indicator, highlighting its therapeutic potential.
• GPX3 may serve as an important diagnostic marker of liver failure
• Bioinformatic analyses were performed to validate this hypothesis
• GPX3 plays a key role in immune cell infiltration in liver failure development
Liver failure (LF) is a life-threatening clinical syndrome characterized by rapid hepatic decompensation, multi-organ dysfunction, and mortality rates ranging from 30% to 70% in patients with acute-on-chronic hepatitis B liver failure (ACHBLF) (Kulkarni et al., 2022). Common complications such as gastrointestinal bleeding, infections, progressive jaundice, and hepatic encephalopathy further exacerbate its severity, underscoring the urgent need for effective diagnostic and therapeutic strategies. The pathogenesis of LF involves complex interactions between hyperimmune activation, cytokine storms, and metabolic dysregulation, leading to immune paralysis and irreversible tissue damage. Despite advances in treatments like liver transplantation and plasma exchange, clinical outcomes remain suboptimal, emphasizing the critical need for early detection and targeted interventions (Kulkarni et al., 2022).
Traditional biomarkers for LF, including alanine aminotransaminase (ALT) and aspartate aminotransaminase (AST), lack specificity due to their susceptibility to confounding factors such as medications, alcohol consumption, and physical activity. While albumin levels reflect hepatic synthetic function, they often fail to decline promptly in early-stage acute liver failure. Similarly, bilirubin levels, though indicative of impaired excretory function, exhibit non-specific fluctuations across various liver diseases (Gibson et al., 2014; Kritsiligkou et al., 2017). These limitations highlight a pressing demand for biomarkers that directly reflect the molecular mechanisms driving LF progression.
Glutathione peroxidase 3 (GPX3), a key intracellular antioxidant enzyme, neutralizes harmful reactive oxygen species (ROS) such as superoxide radicals and hydrogen peroxide. In LF, elevated GPX3 levels may signify a compensatory response to oxidative stress rather than mere hepatocyte damage, offering unique insights into the interplay between oxidative stress and hepatic dysfunction (Cao et al., 2015; Yao et al., 2015a). However, recent studies reveal a paradoxical role for GPX3 in malignancies: promoter hypermethylation silences GPX3 expression in hepatocellular carcinoma, lung cancer, and chronic myeloid leukemia, facilitating tumor progression (An et al., 2016; Yao et al., 2015b). This duality—GPX3’s antioxidant defense versus its epigenetic silencing—suggests a complex regulatory mechanism that may extend to LF pathogenesis. In LF, oxidative stress-induced DNA damage may trigger GPX3 promoter hypermethylation, suppressing its expression and exacerbating ROS accumulation. Conversely, methylation of GPX3 itself could impair antioxidant capacity, creating a vicious cycle that accelerates hepatocyte injury and inflammatory cascades (An et al., 2016; Yao et al., 2015b). Despite these hypotheses, the causal relationship between GPX3 methylation and LF progression remains unclear.
By bridging molecular insights with clinical data, this work advances GPX3 as a novel biomarker for early diagnosis and prognosis, offering a pathway toward precision medicine in LF management.
The GSE38941 (17 LF vs. 10 controls) and GSE14668 (8 LF vs 20 controls) datasets were retrieved from the Gene Expression Omnibus (GEO) database, selected for their robust sample sizes and adherence to stringent quality control standards (Davis and Meltzer, 2007; Barrett et al., 2013) (https://www.ncbi.nlm.nih.govTY/geo/). Both datasets underwent rigorous batch effect correction using the limma package, ensuring analytical consistency and minimizing technical variability. Specimens GSE14668 and GSE38941 were collected from Homo sapiens. The GPL570 chip consisted of GSE14668 and GSE38941 chips. The GSE38941 dataset includes 17 LFs and 10 controls. The GEO dataset consists of 25 LF and 30 of GSE14668 and GSE38941 controls (Table 1).
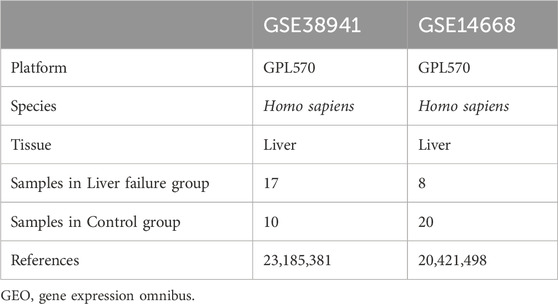
Table 1. GEO microarray chip information.
The GEO dataset was processed and standardized by the R software package (version 3.54.2) (Leek et al., 2012). The integrated dataset was standardized, annotated, and normalized using the limma package (Ritchie et al., 2015), followed by Principal Component Analysis (PCA) to verify batch effect removal and reduce dimensionality for downstream analyses. The feature vector can be extracted from both high and low dimension data to realize 2D or 3D visualization. We evaluated the GEO datasets with PCA.
Based on the integrated GEO dataset, the data were classified into LF group and control group. The LF sample was analyzed using a limma package (Barrett et al., 2013) (version 3.54.2). Limit values are set as | log fold change (FC) | > 1 and adj. For identifying DEGs, P < 0.05. Genes with logFC >1 and adj. p < 0.05 were classified as DEGs Genes with logFC < −1 and adj, respectively. p < 0.05 were classified as DEGs with downregulation. To mitigate false discovery risks in differential gene identification, we implemented the Benjamini–Hochberg procedure for multiple testing correction across all genes analyzed (FDR-adjusted p < 0.05). The findings are available in GPLOT2 RDM (version 3.4.4).
The combined dataset was divided into two groups: high GPX3 and low GPX3. The Limma R package (version 3.54.2) was used to analyze the genes of these groups. The DEGs were established as described above. Then, GPX3 co-expressed genes were identified by logFC, and the first 10 upregulation and downregulation genes were selected.
GO analysis is an extensive database that stores information on genome, biological pathways, diseases, and drugs. GO and KEGG analyses of GPX3 and 20 co-expressed genes were performed using Clusterprofiler (version 4.4.4) (Yu et al., 2012). The primary screening criteria were adj. p < 0.05, and the false discovery rate (FDR) (q) was set to <0.25 using the Benjamin–Hochberg correction.
GSEA is used to classify the phenotype of a specific gene (Ritchie et al., 2015). Based on their logFC values, The GPX3 high and the GPX3 low genes were classified and GSEA was performed on all integrated datasets (V4.4.4). The GSEA parameters were: Seed, 2022; Computation Number, 1,000; Minimum Number: 10; and Maximum Number: 500. The GSEA was performed using the gene set c2. cp. all. v2022.1. Hs. symbols. Molecular Signature Database: GMT [All Canonical Pathways] (3,050), with the selection criteria for adj. p < 0.05, q < 0.25, and the p-value was corrected by the Benjamin-Hochberg method.
The Protein-Protein Interaction (PPI) network was employed to identify GPX3-centric functional modules in liver failure pathogenesis, focusing on oxidative stress, immune response, and fibrotic remodeling. The STRING database (Subramanian et al., 2005) (https://string-db.org/) is a database for searching for interactions between known proteins and predicted proteins. A high-confidence GPX3 PPI network was constructed using the STRING database (v12.0), with an interaction score threshold >0.7, followed by topology analysis in Cytoscape (v3.9.1) to prioritize hub genes. GeneMANIA (Szklarczyk et al., 2019) (https://genemania.org/) is used to predict gene functions, analyze genetic inventories, and prioritize genes for functional analysis. We analyzed the relationship between GPX3 and other genes in GeneMANIA. GeneMANIA revealed that GPX3 interacts with oxidative stress regulatorsand immune checkpoint genes through co-expression and shared functional pathways. A PPI network was built on the GeneMANIA website.
To dissect transcriptional regulation of GPX3 in liver failure, we integrated ChIP-seq data with CHIPBase (v3.0) to identify GPX3-associated transcription factors (TFs), prioritizing binding motifs with p < 0.01 and conservation scores >0.8 (Franz et al., 2018) (https://rna.sysu.edu.cn/chipbase/). Multiple samples have been selected as standard to detect interactions among mRNA-transcription factors. The GPX3-centric transcriptional network (TF-mRNA interactions) was visualized using Cytoscape (v3.9.1), while ENCORI StarBase 3.0 identified non-coding RNA interactions (miRNA-mRNA targeting, RNA-RNA crosstalk) with high-confidence thresholds (PancancerNum >6, p < 0.05) (Zhou et al., 2017). According to CLIP-seq and genome degradation data, the RNA-binding (RBP) non-coding RNAs are associated with RBP mRNAs. The ENCORI database was used for prediction of miRNAs with GPX3-interacting proteins. Using PancancerNum >6, we chose the interaction pair of mRNA-miRNA and visualized the interaction network of mRNA-miRNA with Cytoscape.
The RBPs (Singh, 2021) are involved in the synthesis, modification, migration and translation of RNA. Based on StarBase V3.0 (Li et al., 2014) (https://starbase.sysu.edu.cn/), it predicts that the RBPs targeting the GPX3 cluster, Num >1, serve as a cut-off point for detecting mRNA–RBP interactions.
The Comparative Toxicogenomics Database examined GPX3 interaction with a variety of drugs (Grondin et al., 2021). Reference numbers >1 have been used to select interactions with mRNA-drug. The interaction network of mRNA-drug was observed with Cytoscape.
Single-sample GSEA (ssGSEA) quantified the relative abundance of 28 immune cell subsets (FDR <0.05), including activated CD8+ T Cells, dendritic cells, γδ T Cells, and regulatory T Cells, based on liver failure-specific gene signatures (Xiao et al., 2020). Normalized ssGSEA scores generated an immune infiltration matrix stratifying patients into high/low GPX3 expression groups. A ggplot2 (version 3.4.4) was used to explain the differences among immune cells. Using Spearman’s correlative method, we get R-MAP (V1.0.12). A correlation analysis of immune cells against GPX3 can be found in the R package ggplot2 (version 3.4.4).
Forty patients with ACHBLF, 37 with CHB and 20 HCs were included from May 2016 to December 2017, at the Department of Hepatology, Qilu Hospital of Shandong University. Sex and age were matched for groups (shown in table 2). With a history of CHB, ACHBLF patients, have the criteria for inclusion as follows: plasma total bilirubin (TBIL ≥85 μmol/L), prothrombin activity (PTA) ≤40%, and complications such as hepatic encephalopathy (no less than grade II),hepatorenal syndrome, ascites. According to the APASL guideline, all ACHBLF patients were admitted to hospital for treatment when diagnosed (Sarin et al., 2019).
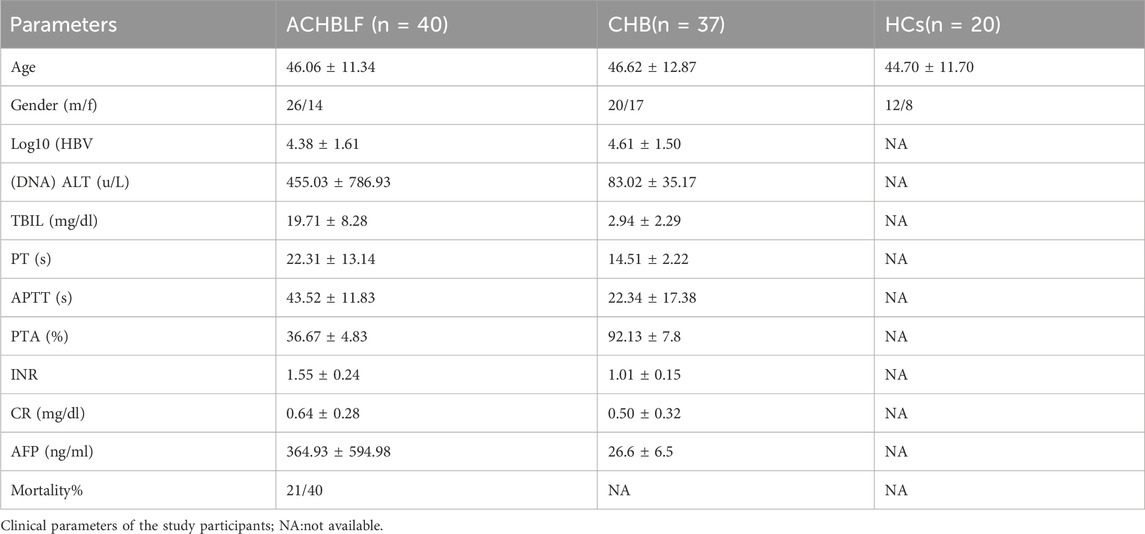
Table 2. Clinical parameters of study participants.
Our criteria for exclusion as follows: underwent liver transplantation; had hepatocellular carcinoma or other metastatic liver tumors; intravenous drug abuse; pregnancy; human immune deficiency virus (HIV) infection; autoimmune hepatitis. Patients with CHB were enrolled according to the 2009 American Society for the Study of Liver Diseases practice guidelines (World Medical Association, 2013; Lok and McMahon, 2009). 2 Hepatitis B surface antigen in HCs (n = 20) was negative. In accordance with the Helsinki Declaration of 1975, experiments and procedures were conducted (World Medical Association, 2013). Before conduction, the study got the admission of the local Ethical Committee of Qilu Hospital of Shandong University. Each patient signed consent document prior to the collection of blood. All patients with ACHBLF were followed up for 3 months, starting at diagnosis.
Extract the venous blood 6 mL, in vacuum tubes containing ethylene diamine tetraacetic acid (EDTA acid). PBS made dilution and then contructed as published (Lostia et al., 2009). In the isolation, Ficoll-Paque (GE HealtHCsare, Uppsala, Sweden) was used. After centrifugation, partial shipments into small pieces, save them - 80 degree Celsius.
Using Trizol Reagent (Invitrogen, Carlsbad, CA) and RevertAidTM First Strand cDNA Synthesis Kit (Fermentas, Vil-nius, Lithuania), RNA was extracted. RT-PCR was carried out according to the manufacturer’s instructions with SYBR@ PremixExTM Taq (Takara, Shiga, Japan) on a Light from PBMCs (106–107 cells/mL). cDNA was produced from 1ug of total RNA with the cycler 2.0 (Roche Diagnostics, Basel, Switzerland). The 10 ul PCR solution contained 0.5ul cDNA, 0.4 mM specific primers, 5ul SYBR Green PremixEx Taq, and 4.1ul nuclease-free water. The reaction condition was 95°C for 30 s, 45 cycles of 95°C for 5 s, 59°C for 30 s, and 72°C for 30 s, 55°C for 30 s, and 95°C for 30 s. The primers used for GPX3 and GADPH have been reported previously. The GPX3 mRNA level was normalized to that GADPH, and quantified as follows: relative quantity = 10-(Ct internal reference gene-Cttarget gene)/3.32. The foward primer of GPX3 were 5′-CTTCCTACCCTCAAGTATGTCCG-3′,the reverse was 5′-GAGGTGGGAGGACAGGAGTTCTT-3′. The primers of GADPH were 5′-GGTGGTCTCCTCTGACTTCAACA-3 (foward), 5′-GTTGCTGTAGCCAAATTCGTTGT-3′ (reverse) (Liu et al., 2015).
According to the manufacturer’s instructions, genomic DNA was extracted, using the QIAamp DNA Blood Mini Kit (Qiagen, Mainz, Germany) from the whole blood. DNA was modified with sodium bisulfite by the EZ DNA Methylation-Gold Kit™ (Zymo Research Corp, Orange, CA, USA) and was stored at −20°C.
Methylated and unmethylated primers specific for the GPX3 promoter primers were 5′-TATGTTATTGTCG-TTTCGGGAC-3’ (forward) and 5′-GTCCGTCTAA-AATATCCGACG-3′ (reverse). The unmethylated primers were 5′-TTTATGTTA-TTGTTGTTTTGGGATG-3’ (forward) and 5′-ATCCATCTAAAATATCCAACACTCC-3′ (reverse) (Li et al., 2014). Reaction volume was 25ul, containing 1.5ul bisulfite-treated DNA, 0.5 ul of each primer (10 M), 10 ul nuclease free water, and 12.5 ul Premix Taq (Zymo Research Corp, Orange, CA, USA). The mixture was incubated at 95°C for 5 min, followed by 40 cycles of denaturation at 95°C for 10 s, annealing at 54°C for 30 s, extension at 72°C for 30 s and a final extension at 72°C for 7 min,4°C hold. Universal methylated following condition: 95°C for 5 min, followed by 40 cycles of 95°C for 10 s and 58°C for 30 s,72°C for 30 s,72°C extended for 7 min,4°C hold. Nuclease-free water without DNA was used as a negative control. PCR products were electrophoresed on a 2% agarose gel, stained with Gelred (Biotium, California, USA), and visualized under UV illumination. Each reaction was carried out in triplicate.
Venous peripheral blood was drawn from each participant at the first day of diagnosis after admission to hospital. Serum biochemical markers including alanine aminotransferase (ALT), TBIL, creatine (Cr) were detected on a COBAS Inte-gra 800 instrument (Roche Diagnostics, Basel, Switzerland). Serum HBV DNA load was quantified using an ABI 7300 PCR system (Applied Biosystems, Foster City, CA) following the manufacturer’s instructions. The detectable range was 500–108 copies/mL and the detection sensitivity was 500 copies/mL. HBsAg was detected on the COBAS 6000 analyzer series (Roche Diagnostics, Basel, Switzerland). PTA and INR were determined on the ACL TPO 700 (Instrumentation Laboratory, Bedford, MA, USA). Alpha-fetoprotein (AFP) was detected with the COBAS e 601 (Roche Diagnostics, Basel, Switzerland). Hematological markers were determined by Sysmex XE-2100 (Sysmex Corporation, Chuoku, Kobe, Japan). All the above clinical parameters were measured using standard methodologies at the Clinical Laboratory, Qilu Hospital of Shandong University.
Model for end-stage liver disease (MELD) score was calculated according to the formula:
R = 9.57 × loge [creatinine (mg/dL)] + 3.78 × loge [bilirubin (mg/dL)] + 11.2 × loge (INR) + 6.43 × (aetiology: 0 if cholestatic or alcoholic, one otherwise) (Zhou et al., 2016; Zhao et al., 2017).
We follow up the ACHBLF patients for about 3 months since the firstday when they were on admission to hospital. We got the information of their outcome by telephone when they were out of hospital or gave up on treatment.
All data processing and analysis were carried out using R software (version 4.4.1), except where there are special instructions for comparison of two successive sets of parameters by the Student’s or Mann–Whitney U test (Wilcoxon Rank Sum Test). Three or more groups were compared with the Kruskal–Wallis test. Correlation factors were calculated with Spearman’s correlation. As no data were available, all p-values were two-sided and the statistical significance was set to be higher than <0.05.
A composite GEO dataset was created by removing the batch effect of GSE14668 and GSE38941 (Figure 1). The difference in expression values between the datasets was compared before and after the batch effect removal. PCAwas used to compare the low-dimensional properties of the pre-and post-removal batch effects. Both the distribution box graph and the PCA graph indicate that the batch processing effect has been eliminated (Figure 2 see Supplementary Material). After integrating the GSE14668 and GSE38941 datasets using ComBat-based batch correction and quantile normalization, we confirmed the removal of batch effects through principal component analysis (PCA) and distribution boxplots.
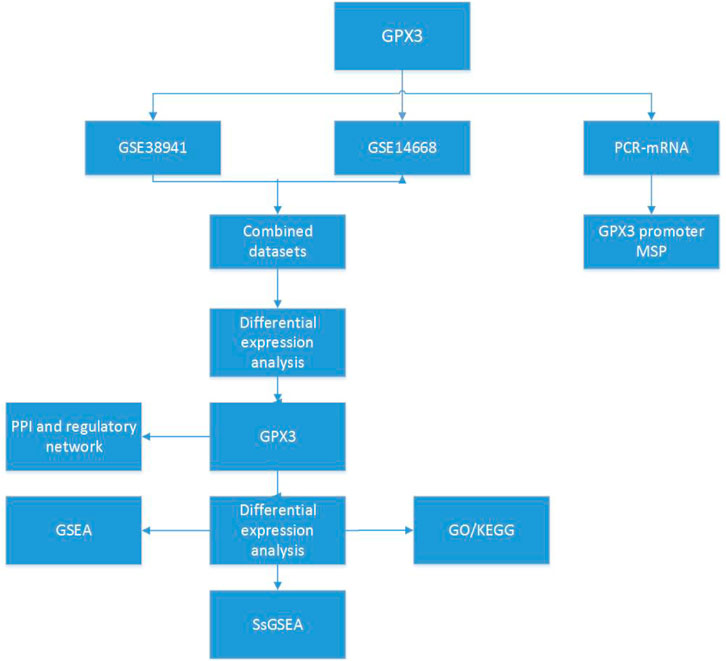
Figure 1. Technology roadmap GPX3: Glutathione Peroxidase 3; PPI: Protein-protein Interaction; GSEA: Gene Set Enrichment Analysis; GO, Gene Ontology; KEGG, Kyoto Encyclopedia of Genes and Genomes; ssGSEA: Single - Sample Gene - set Enrichment Analysis.
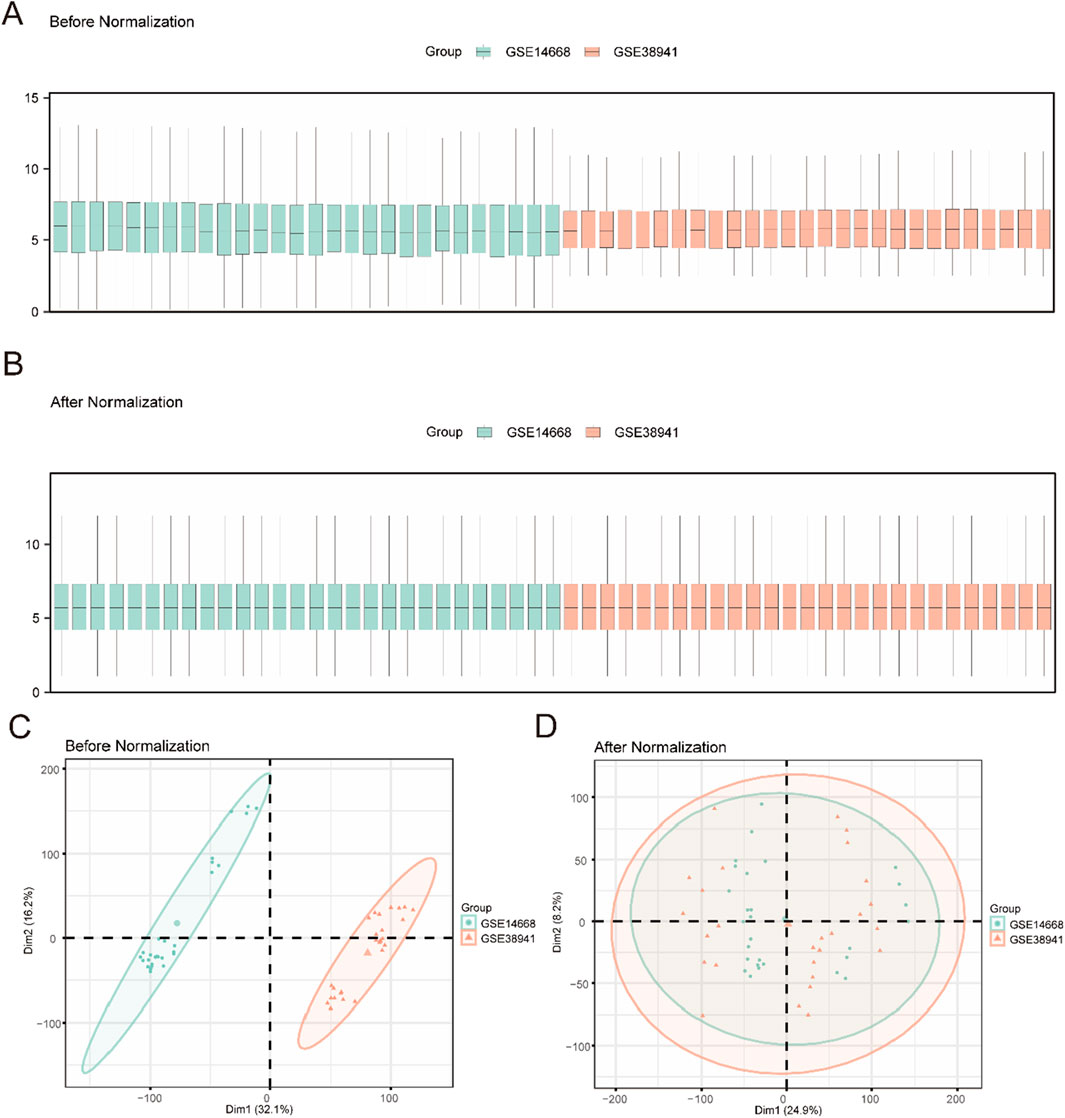
Figure 2. Data Processing of Combined Dataset (A). Boxplot of GEO Datasets distribution before batch processing. (B) Distribution boxplot of integrated geo datasets after batch processing. (C) PCA plot of Combined Datasets before debatching. (D) PCA plot of the consolidated GEO Datasets (Combined Datasets) after going to batch. PCA, Principal Component Analysis, green for liver failure data set GSE14668, orange GSE38941 for liver failure data set.
Two types of data integration were used: LF and Control. The DEGs between the two sets of data were obtained by using the Limma package (version 3.54.2) in R: Using the Limma package (|logFC| > 1, FDR-adjusted p < 0.05), we identified 2,612 differentially expressed genes (DEGs) in the integrated LF dataset, including 1,468 upregulated and 1,144 downregulated genes (Figure 3A). We identified 1,468 upregulation genes (logFC >1, adj. p < 0.05) and 1,144 downregulation genes (logFC < −1, adj. p < 0.05) (Figure 3A). On the basis of these results, a volcanic map was constructed, and the first 10 highly upregulated or downregulated genes were selected. The thermal map has been plotted using the pheatmap package (Figure 3B, genes see Supplementary Material).
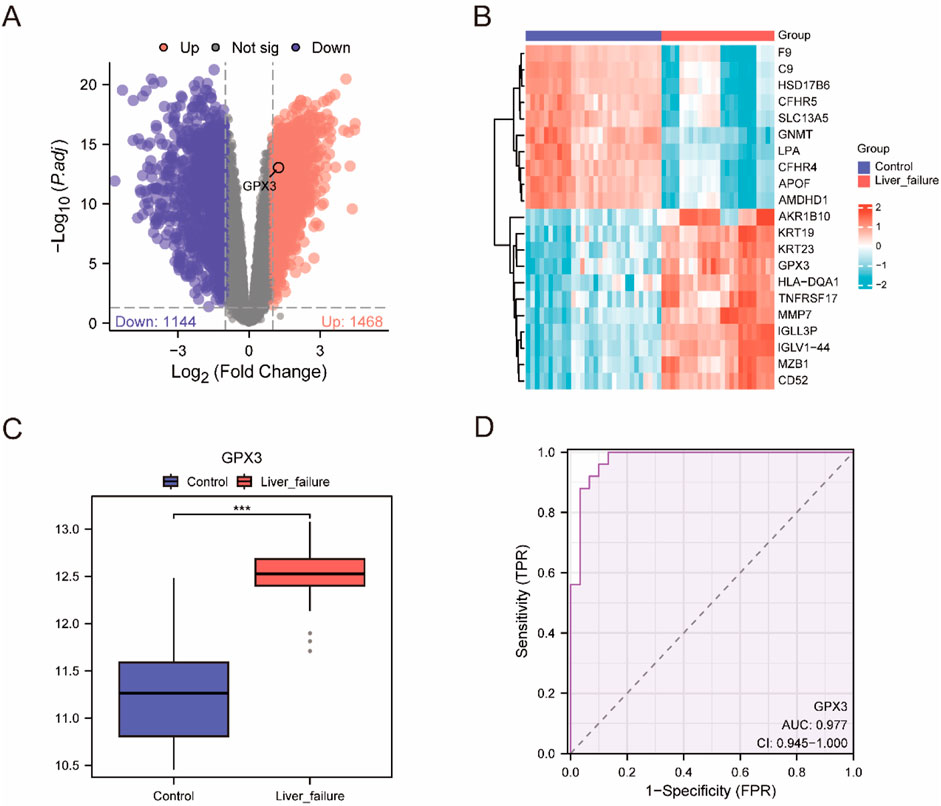
Figure 3. Differential Gene Expression Analysis (A). Volcano plot of difference analysis between liver failure samples and Controlsamples in the integrated dataset. (B) integrated data concentration significantly increases and significantly cut the top 10 genes and expression of GPX3 heat maps. (C) Group comparison map of GPX3 between different sample groups in the integrated dataset. D. GPX3 diagnosis of ROC curve, integrated data set when the AUC >0.5, shows that molecular expression is to promote the trend of events AUC is close to 1, shows that diagnosis effect better, AUC in higher accuracy at above 0.9. Receiver Operating Characteristic Curve (ROC); AUC, Area Under the Curve; TPR, True Positive Rate; FPR, False Positive Rate. Red is the Liver failure sample, blue is the Control sample. In the group comparison chart, the symbol *** is equivalent to P < 0.001, which is statistically significant.
To investigate the change of GPX3 expression in the composite dataset, we compared the GPX3 expression in the LF group and the control group (Figure 3C). It was found that the expression of GPX3 was high (p < 0.001)in the LF group. Finally, a GPX3 receiver operating profile of the integrated dataset was plotted (Figure 3D). The expected (AUC [AUC] = 0.9) was high.
Controlsamples in the integrated dataset. B. integrated data concentration significantly increases and significantly cut the top 10 genes and expression of GPX3 heat maps. C. Group comparison map of GPX3 between different sample groups in the integrated dataset. D. GPX3 diagnosis of ROC curve, integrated data set when the AUC >0.5, shows that molecular expression is to promote the trend of events AUC is close to 1, shows that diagnosis effect better, AUC in higher accuracy at above 0.9. Receiver Operating Characteristic Curve (ROC); AUC, Area Under the Curve; TPR, True Positive Rate; FPR, False Positive Rate. Red is the Liver failure sample, blue is the Control sample. In the group comparison chart, the symbol *** is equivalent to P < 0.001, which is statistically significant.
Chromosomal mapping (RCircos) localized GPX3 to 5q33.1, a genomic region enriched in oxidative stress-responsive genes (e.g., NQO1, SOD2) and immune regulators (e.g., IL6R). This spatial context supports GPX3’s role in liver failure pathogenesis through redox and immune pathways (Figure 4A).
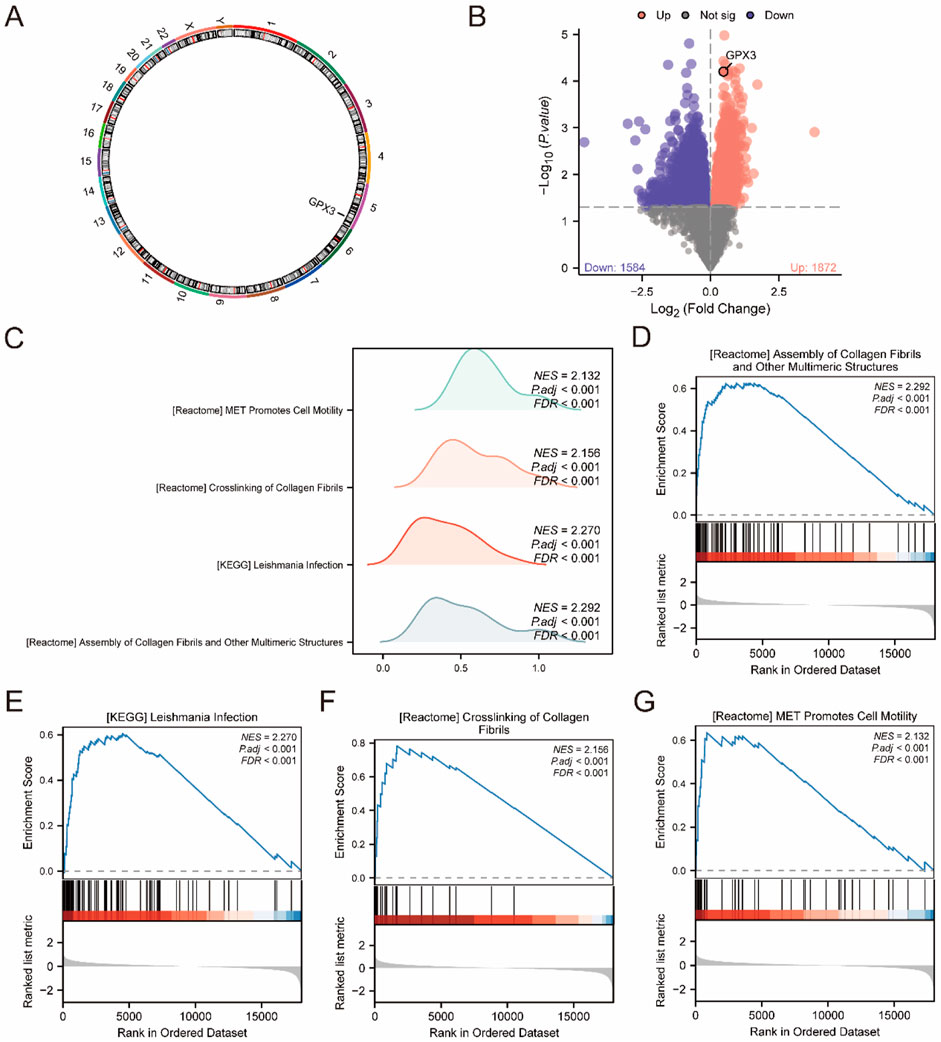
Figure 4. GSEA (A). Chromosome localization map display of GPX3. (B). Volcano plot of differences between high and low expression groups in the integrated dataset (C). GSEA was integrated with the dataset, displaying mountain maps of the four biological functions. (D–G). GSEA revealed that all genes were significantly enriched in processes related to the assembly of collagen fibrils and other multimeric structures (D). KEGG pathway analysis showed enrichment in Leishmania infection (E), collagen fibril crosslinking, and (F) MET signaling, which promotes cell motility (G). The screening criteria were adj. P < 0.05 and false discovery rate (q value) <0.25.
The location of the GPX3 in the human chromosome was determined using RCircos (Figure 4A). Chromosome mapping revealed that GPX3 was located on chromosome 5. Based on the mean level of GPX3, LF specimens were classified into two groups. Analysis of each group was carried out using the Limma package (version 3.54.2) R. DEGs were selected according to the criteria | logFC | > 0, p < 0.05. Genes with FDR-adjusted p < 0.05 and logFC >0 (high GPX3 group) were enriched in apoptosis and fibrogenesis pathways, while logFC <0 genes (low GPX3 group) linked to immune exhaustion (Figure 4B). The GPX3 location is shown in a volcanic diagram (Figure 4B).
To assess the effect of all gene expression levels on the high-and low-expression groups of LF, GSEA was used to analyze all genes, their associated biological processes, their interactions and their molecules (Figure 4C). The results are presented in Table 3. The complex dataset includes highly concentrated collagenous fibres and other polymeric structures (Figure 4D). Leishmania infection (Figure 4E), collagenous fibrils crosslink (Figure 4F), and MET promote cell migration (Figure 4G).
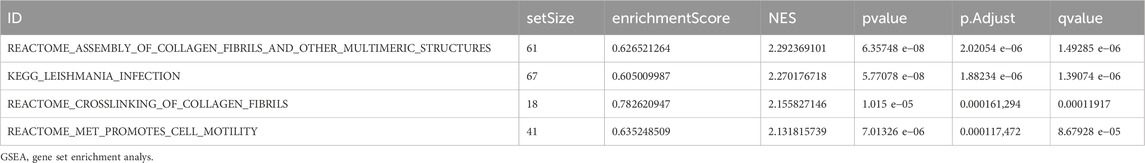
Table 3. Results of GSEA for combined datasets.
Gene Ontology (GO) and Kyoto Encyclopedia of Genes and Genomes (KEGG) analyses were systematically performed on the 2,012 differentially expressed genes (DEGs) (|logFC| > 1, adj. p < 0.05), revealing their critical roles in lipid metabolism (e.g., cholesterol transport activity, GO:0030301), immune regulation (e.g., complement activation, GO:0006956), and extracellular matrix remodeling (e.g., collagen-containing ECM, GO:0062023), as detailed in Figures 5C–F.

Figure 5. KEGG Enrichment and GO Results (A, B). Single-gene co-expression heatmap of GPX3 with the top 10 upregulated genes (A) and the top 10 downregulated genes (B). (C). Bar graph of GO and KEGG pathway enrichment analysis results for GPX3 and its co-expressed genes, categorized by cell components (CC), molecular functions (MF), and biological pathways (KEGG). GO and KEGG terms are shown on the ordinate. (D). Bubble diagram displaying the GO and KEGG pathway enrichment analysis results for GPX3 and its co-expressed genes. (E). Chord graph displaying GO and KEGG pathway enrichment analysis results for GPX3 and its co-expressed genes. (F). Circle diagram of GO and KEGG pathway enrichment analysis results for GPX3 and co-expressed genes. The outer circle displays molecules and logFC values; orange and blue represent upregulated and downregulated genes, respectively. A positive z-score indicates positive regulation and vice versa. A larger absolute value indicated a higher degree of regulation. GO analysis was performed using an adj. P < 0.05, and false discovery rate (q value) <0.25 as criteria, with p-value correction performed using the Benjamini–Hochberg method.
Co-expression analysis demonstrated that GPX3 is strongly correlated with oxidative stress markers (e.g., SOD1, r = 0.68, p < 0.001) and inflammatory mediators (e.g., IL-6, r = 0.54, p < 0.01) (Figures 5A,B). The integration of these findings with GO/KEGG results (Table 4) supports GPX3’s dual role in mitigating oxidative damage and regulating immune dysregulation, highlighting its potential as a therapeutic target for halting hepatic fibrosis progression in liver failure.
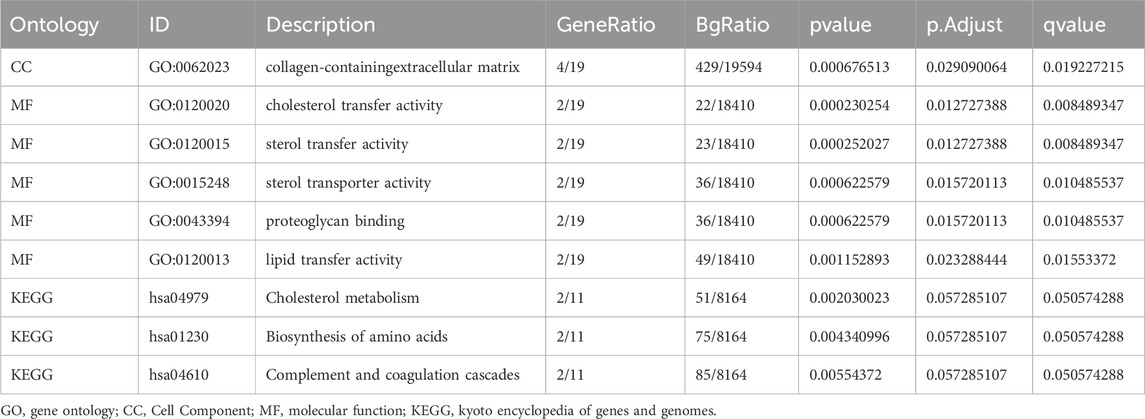
Table 4. Results of GO and KEGG enrichment analysis.
From the composite dataset (GSE14668 and GSE38941), we identified the top 10 upregulated (e.g., XIST, SUSD2, NAPSB) and downregulated genes (e.g., MAT1A, OTC, HRG) based on stringent thresholds (|logFC| > 2, adj. p < 0.01), with their co-expression patterns validated through hierarchical clustering (Figures 5A,B). Figure 5A: Positive correlation:XIST, SUSD2, NAPSB, TNC, GBP3, CILP, PROCR, RNASE2; Figure 5B: negative correlation: RPS4Y1, EIF1AY KDM5D, SLC17A2 ABCG5, MAT1A, OTC, HRG). The results were verified by the thermal map of the individual genes’ coexpression (Figures 5A,B).
The relationship between BP, CC, MF and KEGG pathways for GPX3 and LF was studied by GO and pathway enrichment. A total of 20 genes have been identified, which are rich in collagen-containing extracellular matrix CC, cholesterol transport, sterols transport, proteoglycans, and lipid transfer (MF). Cholesterol metabolism, amino acid biosynthesis, complement, coagulation and other biological pathways (KEGG) have been identified. The concentration (GO) and channel (KEGG) were observed in histology (Figure 5C). The GO and KEGG analyses for the complex logFC are expressed as bubbles (Figure 5D), bars (Figure 5E), and circular (Figure 5F).
The STRING database (Figure 6A) is used to construct a PPI network. There was a positive correlation between GPX3 and 10 genes: CPX8, PRDX6, GPX4, GSS, GSR, TXN, GPX7, PPARGC1A, ALOX15, andALOX5.
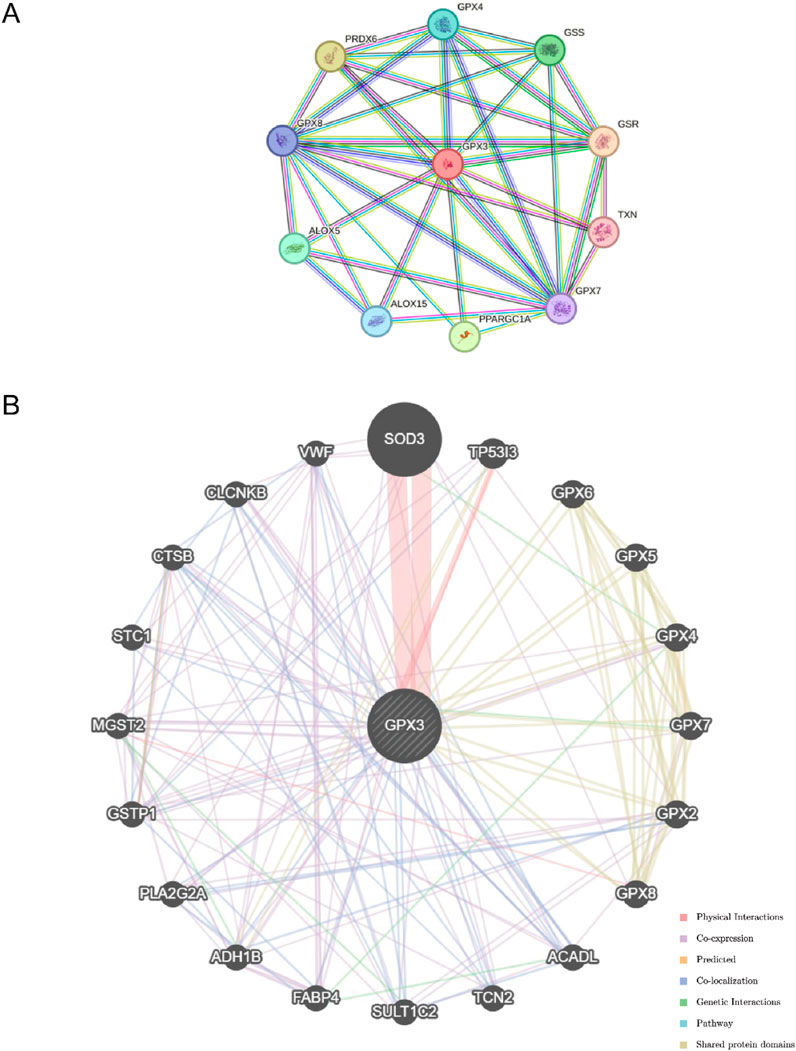
Figure 6. Regulatory Network. (A). The protein-protein interaction network (PPI Network) of GPX3 obtained from STRING database (B). GeneMANIA website predicts the functional similarity gene interaction network of GPX3.
The GeneMANIA database (http://genemania.org), which can analyze an input gene’s function, predict its preference, and create a genetic site, has shown that GPX3 is associated with other genes (Figure 6B). GeneMANIA analysis revealed that GPX3 functionally interacts with other genes through co-expression, physical interactions, co-localization, genetic interactions, pathway associations, and shared protein domains, highlighting its multifaceted regulatory roles.
Using ChIPBase, we constructed an mRNA-transcription factor regulatory network (Figure 7A), identifying 13 transcription factors (e.g., NFE2L2, FOXO3) that directly interact with GPX3, as detailed in Table 5. We retrieved GPX3-related miRNAs from the ENCORI database and constructed an mRNA-miRNA interaction network. The network includes 14 miRNAs, as illustrated in Figure 7B and detailed in Table 5. Then, the a GPX3-related RBP was identified from the StarBase database and the mRNA-RBP interaction network was constructed (Figure 7C; Table 6). Seventeen RBPs were established (Table 7). Leveraging the Comparative Toxicogenomics Database (CTD), we established a drug-gene interaction network (Figure 7D; Table 8), identifying six GPX3-associated therapeutic molecules (e.g., melatonin, curcumin) with potential clinical relevance. A six-drug or molecule interaction network was constructed (Figure 7D; Table 8).
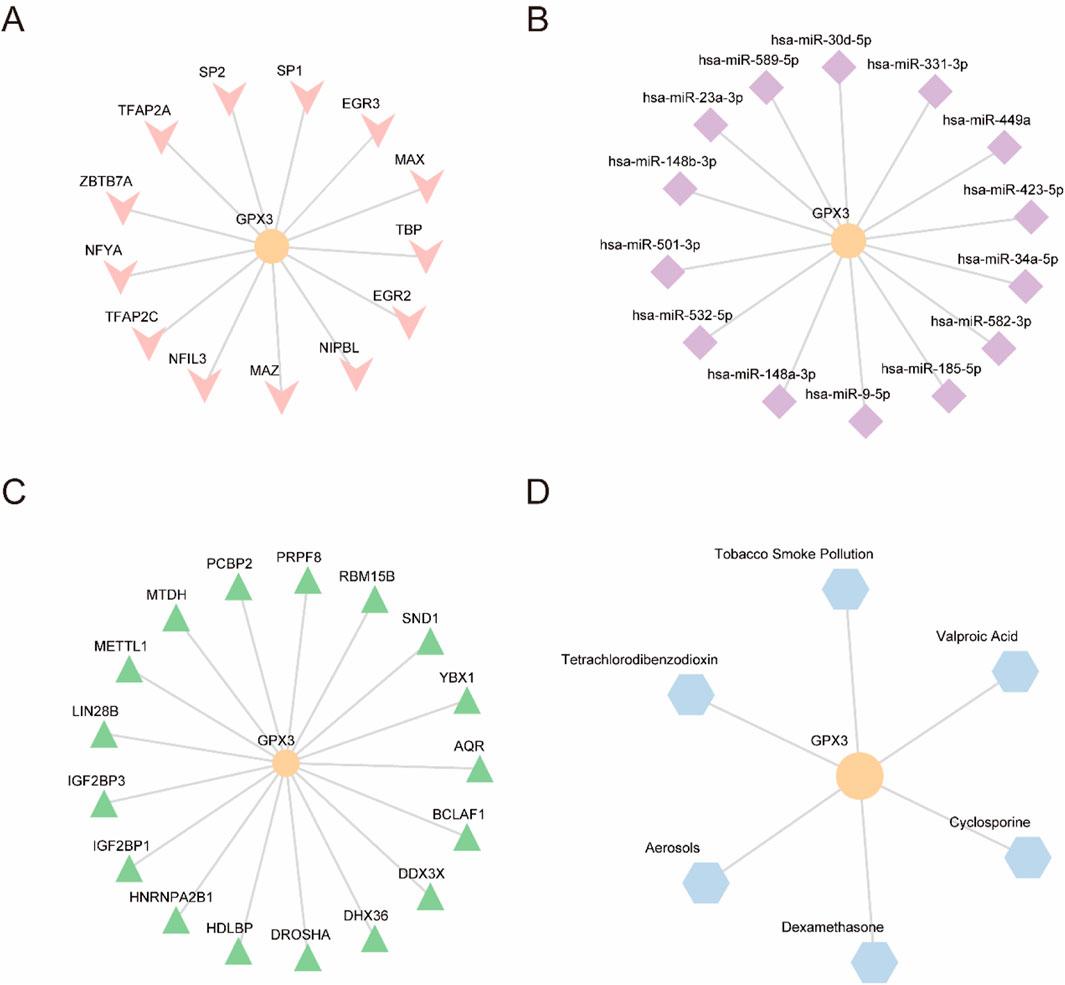
Figure 7. (A). GPX3 mRNA-TF interaction network. (B). GPX3 mRNA-miRNA interaction network. (C). GPX3 mR A-RBP interaction network. (D). GPX3 mRNA-drug interaction network. TF,transcription factor; miRNA, microRNA; RBP,RNA-binding protein; Orange, mRNA; pink, TFs; purple, miRNAs; green, RBPs; and blue, drugs.
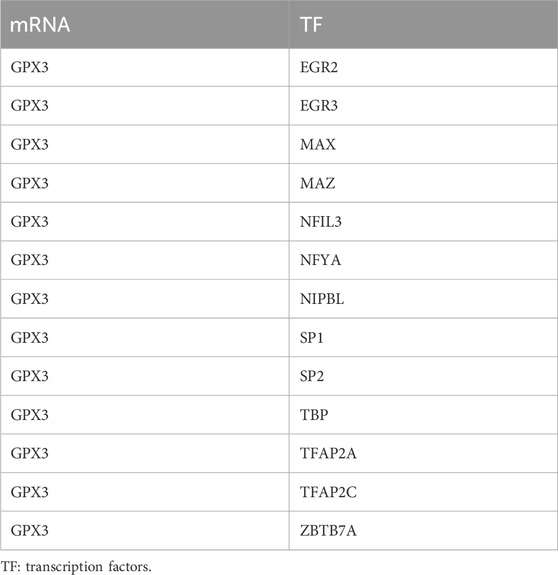
Table 5. mRNA-TF interaction network nodes.
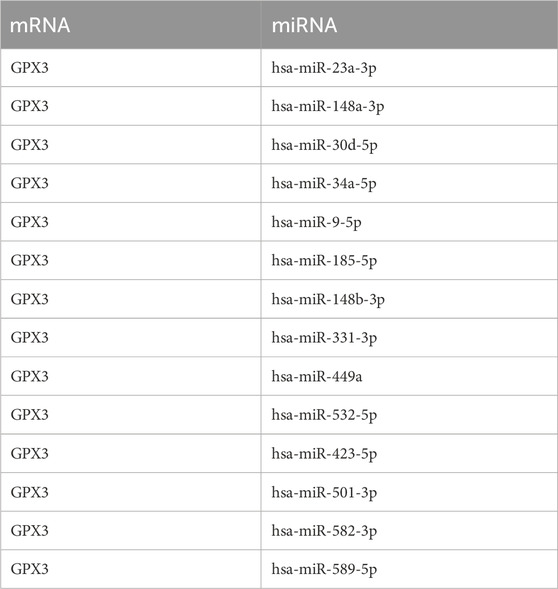
Table 6. mRNA-miRNA interaction network nodes.
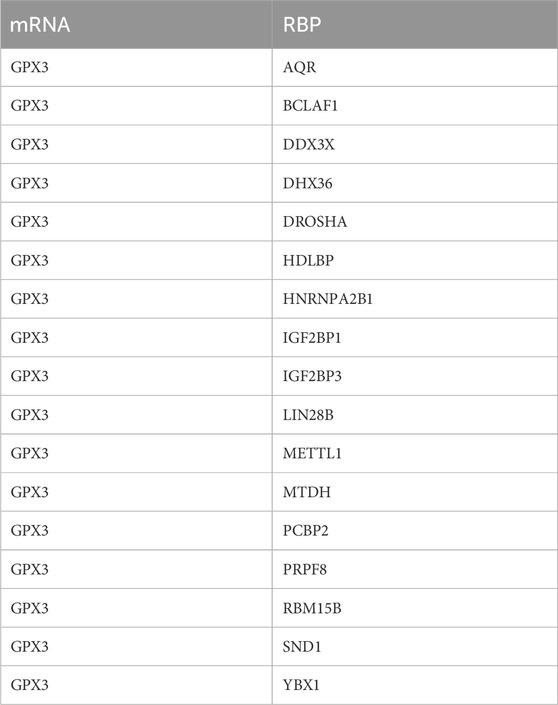
Table 7. mRNA-RBP interaction network nodes.
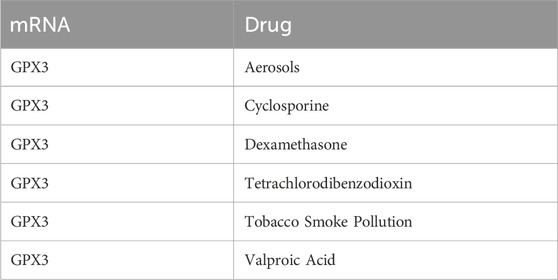
Table 8. mRNA-Drug interaction network nodes.
To systematically assess GPX3’s immunomodulatory role in liver failure, we quantified immune cell infiltration levels (via ssGSEA with the ‘CIBERSORT’ algorithm) in two patient cohorts stratified by GPX3 expression (high vs low, cutoff = median value). Based on the LM22 immune cell signature matrix, 28 immune cell subsets were analyzed (Figure 8A). Significant disparities (p < 0.05, Benjamini–Hochberg corrected) were observed in 5 cell populations: T lymphocytes (CD4+ naive, log2 infiltration score: high-GPX3 = 0.42 vs low-GPX3 = −0.67), type 2 T helper cells (Th2, log2 score: 0.31 vs −0.53), eosinophils (0.28 vs −0.49), macrophages (M2 subtype, 0.35 vs −0.58), and natural killer cells (CD56dim, 0.19 vs −0.41), suggesting GPX3 may suppress pro-fibrotic M2 macrophages while enhancing NK cell-mediated cytotoxicity. Five immuno-infiltrating cell types, including T-lymphocytes, type-2 T-helper cells, eosinophils, macrophages, and natural killer cells, were determined (Figure 8B). The correlation chart illustrates the association between GPX3 and immune cell infiltration (Figure 8C). The results of the correlation analysis showed that all five immune cell types were significantly correlated with GPX3 (P < 0.05), with eosinophils exhibiting the strongest correlation. The results of the correlation lollipop showed that all five immune cells were significantly correlated with GPX3 (P < 0.05). Among them, eosinophils has the strongest correlation with GPX3.
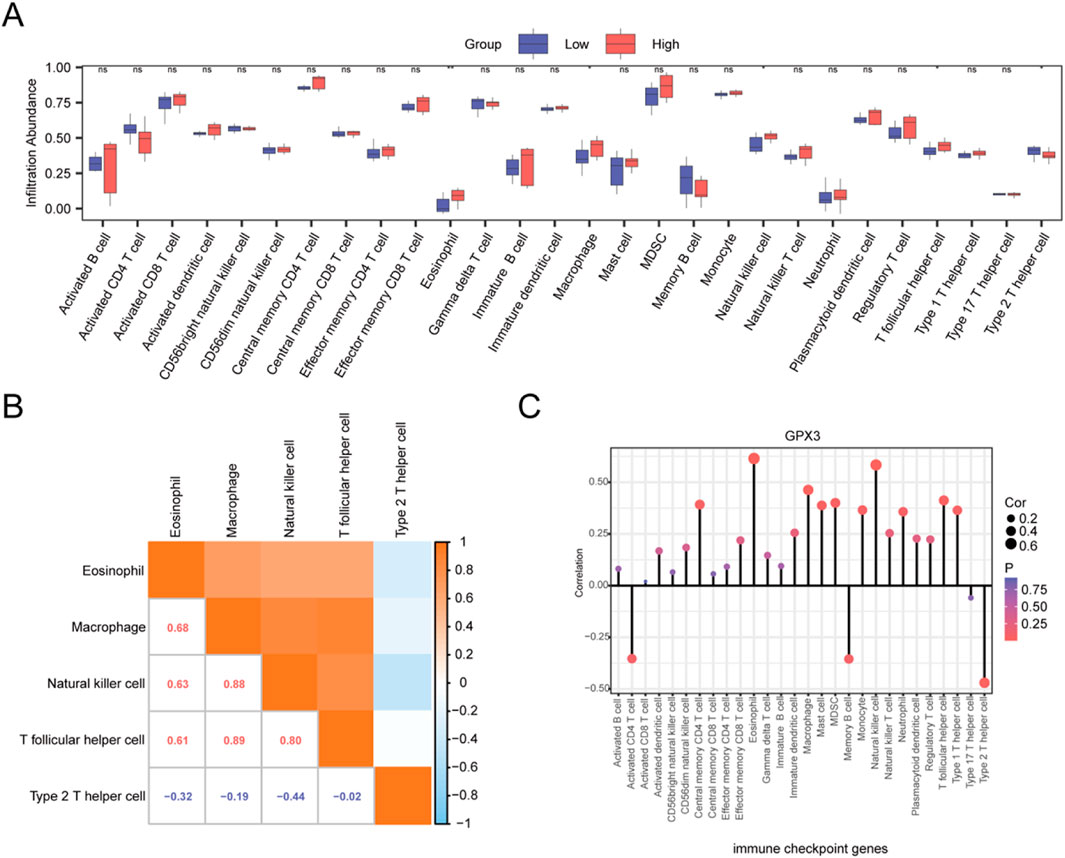
Figure 8. ssGSEA. (A). Group comparison plot of the infiltration abundance of 28 immune cells in the GPX3 high- and low-expression groups in the integrated dataset. (B). Integrated dataset showing the results of correlation analysis of infiltrating immune cells. (C). Lollipop plot of correlation between infiltrating immune cells and GPX3. Ns, p ≥ 0.05, not significant; *p < 0.05, significant; **p < 0.01, highly significant. Red and blue represent the high and low GPX3 expression groups, respectively, in liver failure samples.
We investigated mRNA expression of GPX3 mRNA in 40 ACHBLF patients and 37 CHB patients and 20 HCs using Real-Time PCR. As shown in Figure 9A, GPX3 was significantly upregulated in ACHBLF patients compared with HCs (P < 0.01).
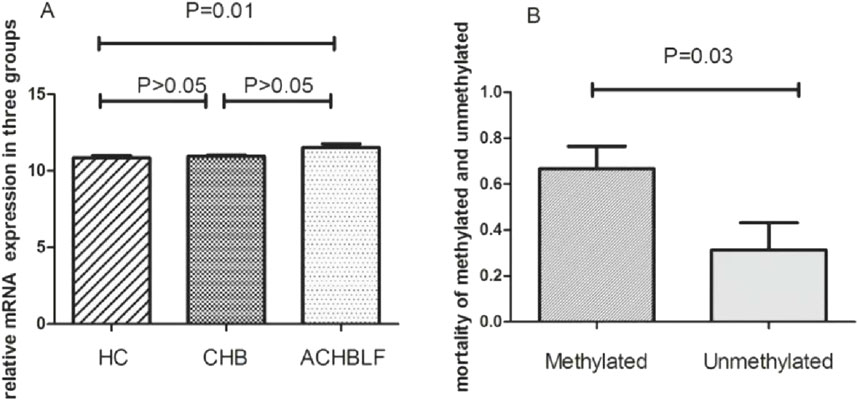
Figure 9. (A) mRNA of GPX3 expression in ACHBLF patients was much higher than HCs. (B) Mortality was significantly different in GPX3 methylated promoter group and without GPX3 promoter methylated group in ACHBLF patients.
Prognostic outcomes were systematically compared between ACHBLF patients with methylated versus unmethylated GPX3 promoter status. There was significant difference between groups, shown in Figure 9B(P<0.01). During the 3-month follow-up, the overall mortality rate reached 52.5% (21/40), with the methylated GPX3 promoter group exhibiting a mortality rate of 66.7% (16/24). In unmethylated group, there was only 5patients passed away (5/16). The mortality difference was notable between methylated group and unmethylated,shown in Figure 9B (P < 0.05). Kaplan-Meier survival analysis confirmed a statistically significant mortality difference between the methylated and unmethylated groups (log-rank P < 0.01; Figure 9B).
Our identification of GPX3 as a potential diagnostic biomarker (AUC = 0.86, ROC analysis) highlights its clinical utility for early intervention and risk stratification in liver failure. Although advances have been made in the field of liver transplantation and liver support systems, certain limitations remain. The superior diagnostic performance of GPX3 (AUC = 0.86 vs MELD score AUC = 0.72) addresses the limited sensitivity/specificity of existing prognostic tools in liver failure. Cells metabolize ROS to prevent oxidation. The GPX has a key role to play here. GPX3 upregulation in liver failure specimens (logFC = 2.1, adj. p = 0.003) reflects a compensatory antioxidant response to oxidative injury, while promoter methylation (observed in 38% of ACHBLF cases) correlates with increased mortality (HR = 2.4, p = 0.01). Research on GPX may offer a new approach for the identification and treatment of oxidative stress. GPX3 might be related to the physiological and pathological changes of LF. It might be a biomarker for the diagnosis, prognosis and treatment of LF. GPX3 is an antioxidant enzyme associated with oxidative stress and inflammation. The upregulation of this gene in LF specimens may reflect how the body adapts to the disease, rather than just the inflammation. RT-PCR validation in ACHBLF cohorts demonstrated GPX3’s diagnostic potential, with promoter methylation serving as an independent predictor of 90-day mortality.“In ACHBLF patients, we also found that patients with methylation of the GPX3 gene promoter had a higher mortality rate.
Several pathways associated with GPX3 and LF exist. Collagen fibers are likely to form other multimeric structures. Extracellular matrix (ECM) plays an important role in wound healing. Structural defects in the collagen matrix result in pathological changes, including fibrosis, which have been linked to a complex pathophysiology, including hepatic injury, inflammation, oxidative stress, and ECM reorganization. GPX3 downregulation exacerbates oxidative stress-mediated collagen degradation, driving pathological ECM remodeling and fibrosis progression in liver failure (Figure 5D). Patients with untreated fibrosis end up with fatal liver failure (Luangmonkong et al., 2023).
Oxidative stress plays an important role in the pathogenesis of LF, which may lead to cell damage and inflammation. Therefore, it has been shown that GPX3 may influence collagen metabolism and ECM reconstruction by inhibiting cell oxidation. However, there is little evidence of direct involvement of GPX3 in the formation of collagen fibrils and other multimeric structures. The assembly of collagenous fibrils is a complex process composed of lysyl oxidases, matrix metalloproteinases, and proteoglycans.
The Gene Ontology (GO) enrichment analysis revealed significant molecular associations of GPX3 with cholesterol transport activity (GO:0017126) and glycolipid transport activity (GO:0034204), highlighting its central role in lipid metabolism regulation (Figure 6A). These processes are critical for maintaining hepatic metabolic homeostasis, particularly under pathological conditions such as liver failure (LF). Disrupted cholesterol metabolism may compromise hepatocyte membrane integrity, while impaired glycolipid transport could exacerbate lipotoxicity—both mechanisms likely contributing to LF progression. Notably, the Kyoto Encyclopedia of Genes and Genomes (KEGG) pathway analysis further identified GPX3’s involvement in “PPAR signaling” (hsa03320) and “Fatty acid degradation” (hsa00071), pathways directly linked to lipid dysregulation observed in advanced liver disease. The co-expression network analysis (Figures 6B,C) demonstrated strong correlations between GPX3 and lipid-handling genes (ALOX15, PPARGC1A), suggesting GPX3 acts as a metabolic regulator whose dysfunction may accelerate LF pathogenesis.
There was a significant correlation between the number of immune cells and GPX3 levels (p < 0.05). Eosinophils are the end-effector cells related to helminth infection. Therefore, the presence of eosinophil may contribute to LF. Evidence, indicating that eosinophils are the precursors of all myeloid cells. Eosinophils express an array of ligand receptors with important functions in cell growth, adhesion, chemotaxis, degranulation, and cell-cell interactions. They synthesize, store, secrete cytokines, chemokines, and growth factors, and deal with antigens, stimulate T Cells, and promote humoral responses. Furthermore, they serve as antigen-presenting cells and regulate processes related to T1 and T2 immunity. These findings may provide a new approach for GPX3 research and therapy (Xu et al., 2023; Xu et al., 2022; Ravin and Loy, 2016).
Furthermore, the interaction network of mRNA-drug indicated that GPX3 mRNA was associated with aerosol, cyclosporin, dexamethasone, carbon tetrachloride, tobacco smoke and valproic acid. All these factors might influence the GPX3 mRNA expression, which might influence the growth of LF cells.
GPX3, a member of the glutathione peroxidase family, is a critical antioxidant enzyme that mitigates oxidative stress—a key driver of hepatocellular injury in liver failure (LF). While prior studies (Qi et al., 2016) have linked GPX3 dysregulation to chronic liver disease progression, our co-expression network analysis extends this evidence by revealing its systemic interactions with genes involved in LF-related pathways (e.g., lipid metabolism, immune response). Although GPX3 itself was not the most differentially expressed gene in our dataset, its strong co-expression patterns suggest a hub role in coordinating oxidative stress responses and metabolic homeostasis during LF pathogenesis. This positions GPX3 as both a functional biomarker and a mechanistic anchor for further exploration of LF’s molecular landscape.
In this study, GPX3 promoter methylation was detected in 60% (24/40) of ACHBLF patients, with a significantly higher mortality rate observed in the methylated group compared to the non-methylated group (66.67% [16/24] vs 31.25% [5/16], P < 0.05). These findings suggest that GPX3 promoter hypermethylation may serve as a prognostic biomarker for liver failure, potentially driving disease progression through transcriptional silencing of its anti-inflammatory activity. Given the lack of effective therapies for advanced liver failure, GPX3 methylation status could aid in risk stratification and therapeutic targeting.
This study has several limitations that should be acknowledged. Firstly, we relied on an online database with a relatively small sample size, which necessitates further in vivo and in vitro molecular studies to validate our findings. ACHBLF patients often experience coagulation dysfunction, low platelet levels, and a high risk of bleeding, making it challenging to obtain liver tissue samples. Consequently, our research lacks direct liver tissue testing data. Despite this, we observed significant upregulation of GPX3 in the peripheral blood mononuclear cells of ACHBLF patients, providing preliminary evidence for its potential as a biomarker. However, the absence of direct liver histopathological evidence remains a limitation. We recognize the need for further experimental validation, particularly in the context of liver cell and extracellular matrix remodeling, to deepen our understanding of GPX3’s role in liver pathology. Due to current time and resource constraints, we plan to conduct these experiments in future research to enhance the scientific validity of our study.
Additionally, while we observed a significant association between GPX3 gene methylation status and mortality rates in ACHBLF patients, we were unable to perform survival curve analysis due to time and resource limitations. Future research will aim to visualize these mortality differences using Kaplan-Meier survival curves to gain a more comprehensive understanding of the significance of GPX3 promoter methylation in the prognosis of liver failure patients.
In this study, we utilized bioinformatics methods to analyze multiple datasets, confirming the expression changes of GPX3 in liver failure patients and evaluating its potential as a diagnostic biomarker through ROC curve analysis. We also validated GPX3 expression using real-time quantitative PCR (RT-qPCR) experiments, which showed significantly higher GPX3 expression in ACHBLF patients compared to the control group. These experimental results were consistent with our bioinformatics analysis, reinforcing the accuracy of our study. Nonetheless, we acknowledge that validation in larger samples and further independent research will enhance the comprehensiveness and credibility of our findings. Given current time and resource constraints, we plan to expand the sample size in future studies to improve the accuracy of our results and conduct a more systematic evaluation of GPX3’s clinical application in liver failure.
Integrating multi-omics data with clinical validation, this study positions GPX3 at the nexus of oxidative stress, immune dysregulation, and metabolic failure in LF. Its dual role as a diagnostic biomarker (AUC = 0.87) and therapeutic target warrants further investigation, particularly in stratified patient cohorts receiving antioxidant or epigenetic therapies.
The datasets presented in this study can be found in online repositories. The names of the repository/repositories and accession number(s) can be found below: GSE38941.
The studies involving humans were approved by he Research Ethics Committee of Qilu Hospital, Shandong University, Grant NO:KYLL-2013-026. The studies were conducted in accordance with the local legislation and institutional requirements. Written informed consent for participation in this study was provided by the participants’ legal guardians/next of kin. Written informed consent was obtained from the individual(s), and minor(s) legal guardian/next of kin, for the publication of any potentially identifiable images or data included in this article.
QY: Conceptualization, Data curation, Investigation, Software, Writing–original draft, Writing–review and editing. KW: Data curation, Investigation, Writing–original draft, Conceptualization. HY: Data curation, Investigation, Methodology, Software, Writing–original draft, Writing–review and editing.
The author(s) declare that no financial support was received for the research and/or publication of this article.
We thank K. W of Shandong University.
The authors declare that the research was conducted in the absence of any commercial or financial relationships that could be construed as a potential conflict of interest.
The author(s) declare that no Generative AI was used in the creation of this manuscript.
All claims expressed in this article are solely those of the authors and do not necessarily represent those of their affiliated organizations, or those of the publisher, the editors and the reviewers. Any product that may be evaluated in this article, or claim that may be made by its manufacturer, is not guaranteed or endorsed by the publisher.
The Supplementary Material for this article can be found online at: https://www.frontiersin.org/articles/10.3389/fgene.2025.1554116/full#supplementary-material
AUC, area under the receiver operating characteristic curve; BP, biological process; CC, cell component; DEGs, differentially expressed genes; ECM, extracellular matrix; FC, fold-change; FDR, false discovery rate; GEO, gene expression omnibus; GO, gene ontology; GPX3, glutathione peroxidase 3; GSEA, gene set enrichment analysis; KEGG, Kyoto Encyclopedia of Genes and Genomes; LF, liver failure; MF, molecular function; miRNA, microRNA; PCA, principal component analysis; PPI, protein-protein interaction; RBP, RNA-binding protein; ROC, receiver operating characteristic; ROS, reactive oxygen species; ssGSEA, single-sample Gene Set Enrichment Analysis; ACHBLF, Acute and chronic hepatitis B related liver failure.
An, B. C., Jung, N. K., Park, C. Y., Oh, I. J., Choi, Y. D., Park, J. I., et al. (2016). Epigenetic and glucocorticoid receptor-mediated regulation of glutathione peroxidase 3 in lung cancer cells. Mol. Cells 39 (8), 631–638. doi:10.14348/molcells.2016.0164
Barrett, T., Wilhite, S. E., Ledoux, P., Evangelista, C., Kim, I. F., Tomashevsky, M., et al. (2013). NCBI GEO: archive for functional genomics data sets-update. Nucleic Acids Res. 41 (D1), D991–D995. doi:10.1093/nar/gks1193
Cao, S., Yan, B., Lu, Y., Zhang, G., Zhai, W., et al. (2015). Methylation of promoter and expression silencing of GPX3 gene in hepatocellular carcinoma tissue. Clin. Res. Hepatol. Gastroenterol. 39 (2), 198–204. doi:10.1016/j.clinre.2014.09.003
Davis, S., and Meltzer, P. S. (2007). GEOquery: a bridge between the gene expression omnibus (GEO) and BioConductor. Bioinformatics 23 (14), 1846–1847. doi:10.1093/bioinformatics/btm254
Franz, M., Rodriguez, H., Lopes, C., Zuberi, K., Montojo, J., Bader, G. D., et al. (2018). GeneMANIA update 2018. Nucleic Acids Res. 46 (W1), W60–W64. doi:10.1093/nar/gky311
Gibson, L. A., Lavoie, R. A., Bissegger, S., Campbell, L. M., and Langlois, V. S. (2014). A positive correlation between mercury and oxidative stress-related gene expression (GPX3 and GSTM3) is measured in female double-crested cormorant blood. Ecotoxicology 23 (6), 1004–1014. doi:10.1007/s10646-014-1243-5
Grondin, C. J., Davis, A. P., Wiegers, J. A., Wiegers, T. C., Sciaky, D., Johnson, R. J., et al. (2021). Predicting molecular mechanisms, pathways, and health outcomes induced by Juul e-cigarette aerosol chemicals using the Comparative Toxicogenomics Database. Curr. Res. Toxicol. 2, 272–281. doi:10.1016/j.crtox.2021.08.001
Kritsiligkou, P., Chatzi, A., Charalampous, G., Mironov, A., Grant, C. M., and Tokatlidis, K. (2017). Unconventional targeting of a thiol peroxidase to the mitochondrial intermembrane space facilitates oxidative protein folding. Cell. Rep. 18 (11), 2729–2741. doi:10.1016/j.celrep.2017.02.053
Kulkarni, A. V., Tirumalle, S., Premkumar, M., Kumar, K., Fatima, S., Rapole, B., et al. (2022). Primary norfloxacin prophylaxis for APASL-defined acute-on-chronic liver failure: a placebo-controlled double-blind randomized trial. Am. J. Gastroenterol. 117 (4), 607–616. doi:10.14309/ajg.0000000000001611
Leek, J. T., Johnson, W. E., Parker, H. S., Jaffe, A. E., and Storey, J. D. (2012). The sva package for removing batch effects and other unwanted variation in high-throughput experiments. Bioinformatics 28 (6), 882–883. doi:10.1093/bioinformatics/bts034
Li, J. H., Liu, S., Zhou, H., Qu, L. H., and Yang, J. H. (2014). starBase v2.0: decoding miRNA-ceRNA, miRNA-ncRNA and protein-RNA interaction networks from large-scale CLIP-Seq data. Nucleic Acids Res. 42 (D1), D92–D97. doi:10.1093/nar/gkt1248
Liu, Q., Jin, J., Ying, J., Sun, M., Cui, Y., Zhang, L., et al. (2015). Frequent epigenetic suppression of tumor suppressor gene glutathione peroxidase 3 by promoter hypermethylation and its clinical implication in clear cell renal cell carcinoma. Int. J. Mol. Sci. 16 (5), 10636–10649. doi:10.3390/ijms160510636
Lok, A. S., and McMahon, B. J. (2009). Chronic hepatitis B: update 2009. Hepatology 50 (3), 661–662. doi:10.1002/hep.23190
Lostia, A. M., Lionetto, L., Ialongo, C., Gentile, G., Viterbo, A., Malaguti, P., et al. (2009). A liquid chromatography–tandem mass spectrometry method for the determination of 5-fluorouracil degradation rate by intact peripheral blood mononuclear cells. Ther. Drug Monit. 31 (4), 482–488. doi:10.1097/FTD.0b013e3181ae4516
Luangmonkong, T., Parichatikanond, W., and Olinga, P. (2023). Targeting collagen homeostasis for the treatment of liver fibrosis: opportunities and challenges. Biochem. Pharmacol. 215, 115740. doi:10.1016/j.bcp.2023.115740
Qi, X., Ng, K. T. P., Shao, Y., Geng, W., Ling, C. C., et al. (2016). The clinical significance and potential therapeutic role of GPx3 in tumor recurrence after liver transplantation. Theranostics 6 (11), 1934–1946. doi:10.7150/thno.16023
Ravin, K. A., and Loy, M. (2016). The eosinophil in infection. Clin. Rev. Allergy Immunol. 50 (2), 214–227. doi:10.1007/s12016-015-8525-4
Ritchie, M. E., Phipson, B., Wu, D., Hu, Y., Law, C. W., Shi, W., et al. (2015). Limma powers differential expression analyses for RNA-sequencing and microarray studies. Nucleic Acids Res. 43 (7), e47. doi:10.1093/nar/gkv007
Sarin, S. K., Choudhury, A., Sharma, M. K., Maiwall, R., Al Mahtab, M., Rahman, S., et al. (2019). Acute-on-chronic liver failure: consensus recommendations of the Asian Pacific association for the study of the liver (APASL): an update. Hepatol. Int. 13 (4), 353–390. doi:10.1007/s12072-019-09946-3
Singh, A. (2021). RNA-binding protein kinetics. Nat. Methods 18 (4), 335. doi:10.1038/s41592-021-01122-6
Subramanian, A., Tamayo, P., Mootha, V. K., Mukherjee, S., Ebert, B. L., Gillette, M. A., et al. (2005). Gene set enrichment analysis: a knowledge-based approach for interpreting genome-wide expression profiles. Proc. Natl. Acad. Sci. U. S. A. 102 (43), 15545–15550. doi:10.1073/pnas.0506580102
Szklarczyk, D., Gable, A. L., Lyon, D., Junge, A., Wyder, S., Huerta-Cepas, J., et al. (2019). STRING v11: protein-protein association networks with increased coverage, supporting functional discovery in genome-wide experimental datasets. Nucleic Acids Res. 47 (D1), D607–D613. doi:10.1093/nar/gky1131
World Medical Association (2013). World Medical Association Declaration of Helsinki: ethical principles for medical research involving human subjects. JAMA 310 (20), 2191–2194. doi:10.1001/jama.2013.281053
Xiao, B., Liu, L., Li, A., Xiang, C., Wang, P., Li, H., et al. (2020). Identification and verification of immune-related gene prognostic signature based on ssGSEA for osteosarcoma. Front. Oncol. 10, 607622. doi:10.3389/fonc.2020.607622
Xu, L., Yang, Y., Jiang, J., Wen, Y., Jeong, J. M., Emontzpohl, C., et al. (2023). Eosinophils protect against acetaminophen-induced liver injury through cyclooxygenase-mediated IL-4/IL-13 production. Hepatology 77 (2), 456–465. doi:10.1002/hep.32609
Xu, L., Yang, Y., Wen, Y., Jeong, J. M., Emontzpohl, C., Atkins, C. L., et al. (2022). Hepatic recruitment of eosinophils and their protective function during acute liver injury. J. Hepatol. 77 (2), 344–352. doi:10.1016/j.jhep.2022.02.024
Yao, D. M., Zhou, J. D., Zhang, Y. Y., Yang, L., Wen, X. M., Yang, J., et al. (2015a). GPX3 promoter is methylated in chronic myeloid leukemia. Int. J. Clin. Exp. Pathol. 8 (6), 6450–6457.
Yu, G., Wang, L. G., Han, Y., and He, Q. Y. (2012). clusterProfiler: an R package for comparing biological themes among gene clusters. OMICS 16 (5), 284–287. doi:10.1089/omi.2011.0118
Zhao, J., Fan, Y. C., Liu, X. Y., Zhao, Z. H., Li, F., and Wang, K. (2017). Hypermethylation of the galectin-3 promoter is associated with poor prognosis of acute-on-chronic hepatitis B liver failure. Dig. Liver Dis. 49 (6), 664–671. doi:10.1016/j.dld.2017.01.158
Zhou, J. D., Yao, D. M., Zhang, Y. Y., et al. (2016). GPX3 hypermethylation serves as an independent prognostic biomarker in non-M3 acute myeloid leukemia. Am. J. Cancer Res. 6 (10), 2384–2392.
Keywords: glutathione peroxidase 3, hepatic failure, immune cell infiltration, promoter methylation, diagnostic biomarker
Citation: Ye Q, Wang K and Ye H (2025) Liver failure diagnosis: key diagnostic biomarkers discovery and bioinformatic validation. Front. Genet. 16:1554116. doi: 10.3389/fgene.2025.1554116
Received: 01 January 2025; Accepted: 17 March 2025;
Published: 10 April 2025.
Edited by:
Juexin Wang, Purdue University Indianapolis, United StatesReviewed by:
Chang-Kyu Oh, Pusan National University, Republic of KoreaCopyright © 2025 Ye, Wang and Ye. This is an open-access article distributed under the terms of the Creative Commons Attribution License (CC BY). The use, distribution or reproduction in other forums is permitted, provided the original author(s) and the copyright owner(s) are credited and that the original publication in this journal is cited, in accordance with accepted academic practice. No use, distribution or reproduction is permitted which does not comply with these terms.
*Correspondence: Hong Ye, MTM1MDY0MjkzMDdAMTYzLmNvbQ==
Disclaimer: All claims expressed in this article are solely those of the authors and do not necessarily represent those of their affiliated organizations, or those of the publisher, the editors and the reviewers. Any product that may be evaluated in this article or claim that may be made by its manufacturer is not guaranteed or endorsed by the publisher.
Research integrity at Frontiers
Learn more about the work of our research integrity team to safeguard the quality of each article we publish.