 Yongjiao Zhang1,2
 Sumei Lu
 Mingwei Zhong
94% of researchers rate our articles as excellent or good
Learn more about the work of our research integrity team to safeguard the quality of each article we publish.
Find out more
ORIGINAL RESEARCH article
Front. Genet., 06 February 2025
Sec. RNA
Volume 16 - 2025 | https://doi.org/10.3389/fgene.2025.1533637
Background: Obesity, a prevalent metabolic disorder, is linked to perturbations in the balance of gene expression regulation. Noncoding RNAs (ncRNAs), including long noncoding RNAs (lncRNAs), circular RNAs (circRNAs), and microRNAs (miRNAs), play pivotal roles in regulating gene expression. The aim of this study was to identify additional ncRNA candidates that are implicated in obesity, elucidating their potential as key regulators of the pathogenesis of obesity.
Methods: We identified distinct ncRNA expression profiles in omental adipose tissue in obese and healthy subjects through comprehensive whole-transcriptome sequencing. Subsequent analyses included functional annotation with GO and KEGG pathway mapping, validation via real-time quantitative polymerase chain reaction (qRT‒PCR), the exploration of protein‒protein interactions (PPIs), and the identification of key regulatory genes through network analysis.
Results: The results indicated that, compared with those in healthy individuals, various lncRNAs, circRNAs, and miRNAs were significantly differentially expressed in obese subjects. Further verifications of top changed gene expressions proved the most genes’ consistence with RNA-sequencing including 11 lncRNAs and 4 circRNAs. Gene network analysis highlighted the most significant features associated with metabolic pathways, specifically ENST00000605862, ENST00000558885, and ENST00000686149. Collectively, our findings suggest potential ncRNA therapeutic targets for obesity, including ENST00000605862, ENST00000558885, and ENST00000686149.
Obesity has become a prevalent chronic disease worldwide that is often accompanied by numerous complications. The World Health Organization (WHO) defines obesity as an excessive accumulation of body fat that may be detrimental to health, with a diagnosis based on a body mass index (BMI) of ≥30 kg/m2 (Zou and Pitchumoni, 2023). In 2023, an analysis of the obesity epidemiology in China revealed that 34.8% of the population was overweight and 14.1% was obese. Furthermore, individuals with a high BMI were found to have a higher prevalence of comorbidities, including diabetes, hypertension, dyslipidemia, fatty liver disease, chronic kidney disease, and carotid plaques (Chen et al., 2023). Therefore, effective treatment for obesity remains a critical public health priority.
Obesity is characterized by excess body fat, which is categorized into white adipose tissue (WAT) and brown adipose tissue (BAT) on the basis of its form and function (Squillaro et al., 2020). The process of adipose differentiation, or fat formation, is intricately regulated by the genome and involves both coding and noncoding RNAs (ncRNAs). A majority of the human genome is transcribed into RNAs that do not encode proteins; it is estimated that 51.8% of the human genome can be transcribed, with only up to 1.2% of genes coding for proteins, leaving the remainder as ncRNAs. NcRNAs are classified into various categories on the basis of their length, shape, and location, and the four major types are long noncoding RNA (lncRNA), circular RNA (circRNA), microRNA (miRNA), and PIWI-interacting RNA (piRNA) (Yan and Bu, 2021). LncRNAs, which are longer than 200 nucleotides, play crucial roles in gene regulation through cis- or trans-acting mechanisms (Khan et al., 2016). MiRNAs are short RNA molecules, 19 to 25 nucleotides in length, that modulate the posttranscriptional silencing of target genes and influence the expression of numerous genes within functional pathways (Lu and Rothenberg, 2018). CircRNAs represent a novel class of covalently closed, single-stranded endogenous ncRNAs, whereas piRNAs constitute a broad class of small ncRNAs associated with PIWI clade proteins in the Argonaute family (Wang et al., 2022). Additionally, lncRNAs, circRNAs, miRNAs, and mRNAs can form complex, miRNA-centered regulatory ceRNA networks involved in posttranscriptional regulation. Thus, the complex role of ncRNAs in the pathogenesis of obesity remains largely enigmatic, prompting us to conduct comprehensive ncRNA profiling in omental adipose tissue and to identify novel biomarkers for obesity.
Emerging evidence demonstrates the essential function of non-coding RNAs in regulation of adipose development and adipogenesis. Multiple LncRNAs were found to be regulated by transcription factors such as PPARγ and CEBPα during adipogenesis. For example, LncRNAs SRA(steroid receptor RNA activator),Plnc1 and IMFNCR regulate the transcriptional activity of PPAR and are involved in adipocyte differentiation (Fadini et al., 2010; Zhu et al., 2018; Zhang M. et al., 2019). And LncRNA TINCR enhances adipogenic differentiation in adipose tissue-derived mesenchymal stem cells (ADSC) by adsorbing miR-31 to promote the transcriptional activity of C/EBPα (Liu et al., 2018). While LncRNA CAAlnc1 inhibits adipogenesis in C3H10T1/2 cells by binding to HuR and blocking the transcription of RRARγ and C/EBPα (Shen et al., 2019), lncRNA XIST inhibits high-fat diet-induced obesity by binding to C/EBPα (Wu et al., 2022). Studies on miRNAs in obesity have found that MiRNAs are involved in the regulation of adipogenesis. Among them, MiR-146b is highly expressed in mature adipose and can affect visceral adipogenesis (Chen et al., 2014). MiR-210 can inhibit WNT signaling by targeting Tcf7l2, thus promoting adipogenesis (Qin et al., 2010). MiR-152 has been shown to inhibit preadipocyte proliferation and promote lipid accumulation in 3T3-L1 (Fan et al., 2019). Overexpression of miR-124a results in decreased lipid metabolism and cellular triacylglycerol (TG) accumulation (Das et al., 2015). In addition, studies on circRNAs and obesity have found that circRNAs are also important regulators of adipocyte development and function (Ru et al., 2023). For example, circSAMD4A can promote adipogenesis through miR-138-5p/EZH2 axis (Liu et al., 2020). In addition, deletion of circH19 enhances adipogenic differentiation of human adipose-derived stem cells (ADSC) (Zhu et al., 2020). However, adipogenesis is considered to be a complex process, and the study of ncRNAs is still in the preliminary stage, and many ncRNAs related to adipogenesis and their functions and regulatory mechanisms still need to be further investigated in greater depth.
In this study, we established comprehensive ncRNA profiles from human greater omentum adipose tissue and compared the profiles between obese individuals with healthy controls via whole-transcriptome sequencing. Subsequent validation via qRT‒PCR substantiated the sequencing results, reinforcing the reliability of our findings. These insights not only validate the importance of ncRNAs but also lay a theoretical foundation for further functional exploration of the roles of lncRNAs, circRNAs, and miRNAs in obesity, potentially offering novel perspectives on the pathogenesis of this condition.
The current study included a clinical cohort of 10 participants, consisting of 5 healthy and 5 obese individuals aged between 27 and 68 years. The body mass index (BMI) was calculated as the weight in kilograms divided by the square of the height in meters (kg/m2). Participants with a BMI between 25 and 28 were classified as healthy, whereas those with a BMI exceeding 30 were categorized as obese. Greater omentum adipose tissue samples were obtained from both healthy and obese patients who underwent laparoscopic Chol cystolithotomy in the general surgery department. All participants provided written informed consent, and the study received approval from the Ethics Committee of The First Affiliated Hospital of Shandong First Medical University, with reference number [2022] No. S628.
RNA sequencing was carried out by LC-Bio Technologies Company in Hangzhou, China. Total RNA extraction was performed with TRIzol reagent (Thermo Fisher Scientific, 15596018), followed by ribosomal RNA depletion with the Ribo-Zero Gold rRNA Removal Kit (Illumina, MRZG12324, San Diego, United States). The residual RNA was then fragmented into short segments and subjected to reverse transcription. The final cDNA library had an average insert size of 300 ± 50 bp and was sequenced on the Illumina NovaSeq 6000 platform. To ensure high-quality clean reads, the sequences were refined with Cutadapt (https://cutadapt.readthedocs.io/en/stable/,version:cutadapt-1.9). The raw RNA sequencing data, provided in fastq format by LC-Bio, were analyzed by the authors with DESeq2 software to assess the differences in expression between the two groups.
The first step involved filtering out any transcripts that overlapped with known mRNAs, known lncRNAs, and RNAs shorter than 200 bp. We then utilized CPC 0.9-r2 (http://cpc2.cbi.pku.edu.cn) and CNCI 2.0 (https://github.com/www-bioinfo-org/CNCl#install-cnci) with the default parameters to predict novel transcripts with coding potential. Transcripts with CPC scores <0.5 and CNCI scores <0 were retained and classified as novel lncRNAs. Additionally, the remaining transcripts with class codes (i, j, o, u, x) were considered novel lncRNAs.
Differential expression analysis was conducted using DESeq2 software to compare two distinct groups. mRNAs, and lncRNAs were identified as differentially expressed if they met the criteria of a false discovery rate (FDR) less than 0.05 and an absolute fold change of at least 2. Subsequently, the differentially expressed coding RNAs underwent enrichment analysis for GO functions and KEGG pathways to elucidate their biological roles and pathways.
Gene Ontology (GO) is an internationally recognized and standardized framework for the functional classification of genes. It provides a continuously updated controlled vocabulary and rigorously defined concepts that facilitate the comprehensive characterization of gene attributes and their corresponding products across diverse organisms. The GO framework encompasses three primary ontologies: molecular function (MF), cellular component (CC), and biological process (BP). Each fundamental element of GO is referred to as a GO term, which is assigned to a specific ontology category.
GO enrichment analysis was used to identify the GO terms that exhibited significant enrichment among the differentially expressed genes (DEGs) compared with the genomic background, allowing the isolation of DEGs associated with particular biological functions. Initially, all DEGs were mapped to GO terms in the Gene Ontology database (http://www.geneontology.org/), and the number of genes corresponding to each term was quantified. The identification of significantly enriched GO terms within the DEGs relative to the genomic background was achieved through the application of a hypergeometric test. The formula for calculating the P value is as follows:
In this context, N represents the total count of the genes that possess GO annotations, whereas n denotes the number of DEGs within this total. M signifies the aggregate number of genes associated with specific GO terms, and m indicates the quantity of DEGs within this subset. Specifically, N corresponds to the total background gene count (denoted as the TB gene number), n refers to the total number of significant genes (TS gene number), M represents the background gene count (B gene number), and m indicates the number of significant genes (S gene number). GO terms that fulfilled the criterion of p < 0.05 were classified as significantly enriched among the DEGs. This analytical approach successfully identified the primary biological functions represented by these DEGs.
Genes typically engage in interactions that contribute to specific biological functions. Analyzing pathways provides deeper insights into the biological roles of genes. The Kyoto Encyclopedia of Genes and Genomes (KEGG) serves as the principal public database related to biological pathways. Pathway enrichment analysis allows the identification of significantly enriched metabolic and signal transduction pathways among DEGs compared with the entire genomic background. The formula employed for these calculations mirrors that utilized in GO analysis. In this context, N denotes the total number of genes annotated within the KEGG, whereas n represents the count of DEGs within that total. Furthermore, M signifies the total number of genes assigned to specific pathways, and m indicates the number of DEGs within those pathways. Pathways that satisfied the condition of p < 0.05 were classified as significantly enriched pathways within the DEGs.
One diagram was generated to show the localization and abundance of noncoding RNAs in the genome with the program Circos.
A protein‒protein interaction (PPI) network of metabolic-associated DEGs was constructed with STRING (http://cn.string-db.org). Cytoscape software was used to visualize the PPI network. The network was ranked on the basis of the degree parameter calculated with the CytoNCA plugin of Cytoscape. The MCODE plugin in Cytoscape detected highly interconnected gene modules. To identify hub genes in the PPI network, the “cytoHubba” plugin of Cytoscape was used to score the genes. Finally, the results of the edge percolated component (EPC), degree, maximum neighborhood component (MNC), maximal clique centrality (MCC), closeness and radiality were used for the hub genes.
The top 10 upregulated and top 10 downregulated differentially expressed (DE) lncRNAs and the top 5 upregulated and top 5 downregulated DE circRNAs were all assessed as candidates via RT‒qPCR. Total RNA was extracted from human adipose samples via TRIzolTM reagent. First-strand complementary DNA was synthesized with the use of a PrimeScriptTM RT reagent kit. Afterward, qPCR was carried out with SuperReal PerMix Plus. To calculate the relative expression of the candidate genes, a twofold correlation method was used with β-actin as the reference gene. The qPCR primers used are listed in Table 1.

Table 1. PCR primers for RNA sequencing verification.
Categorical variables are expressed as counts with the corresponding percentages, whereas continuous variables are described as the means and standard deviations (SDs). The comparisons of candidate lncRNAs and circRNAs between groups were conducted with t tests. Pearson correlation was employed in this study. A P value less than 0.05 was considered to indicate statistical significance.
On the basis of the sequencing quality data, the study ultimately included 3 obese patients and 4 healthy individuals, with 2 obese patients and 1 healthy patient identified as outliers. The mean BMI significantly differed between the two groups, with an average of 50.43 kg/m2 in the obese group and an average of 26.13 kg/m2 in the healthy group. The levels of several biochemical indicators, including glucose, glycosylated hemoglobin, triglycerides, total cholesterol, high-density lipoprotein (HDL), and low-density lipoprotein (LDL), were markedly elevated in obese patients compared with the levels in healthy patients (Table 2).
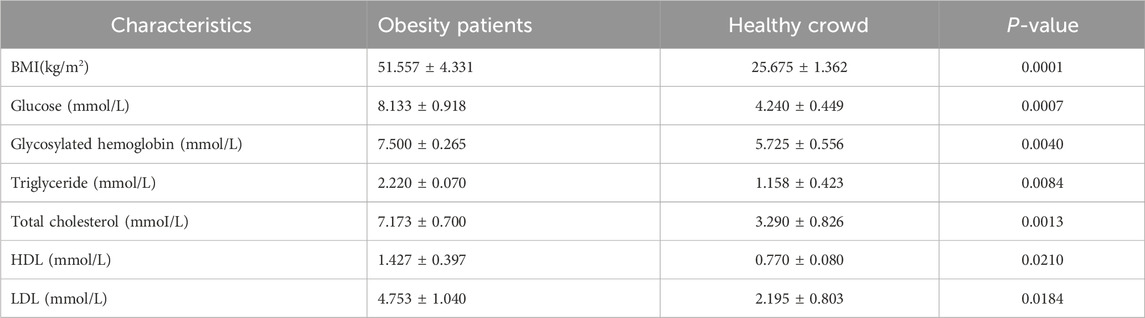
Table 2. Clinical characteristics of obesity patients and healthy crowd.
An overview of the general ncRNA profiles was initially compiled from the RNA sequencing data, including lncRNAs, miRNAs, and circRNAs. Figure 1A shows that a significant number of ncRNAs were DE (with a fold change ≥2 and P value <0.05), totaling 2642 lncRNAs, 154 circRNAs, and 195 miRNAs. Among these, 963 lncRNAs, 94 circRNAs, and 110 miRNAs were upregulated (Figure 1B), whereas 1679 lncRNAs, 60 circRNAs, and 85 miRNAs were downregulated (Figure 1C). The chromosomal locations of the DE genes are depicted in Figure 1D. Tables 3–5 present the top 10 upregulated and top 10 downregulated ncRNAs, including lncRNAs, circRNAs, and miRNAs, respectively. A graphical outline of the expression characteristics of the lncRNA, cricRNA, micRNA are shown in a hierarchical clustering analysis heatmap and a volcano plot (Figures 2A–F).
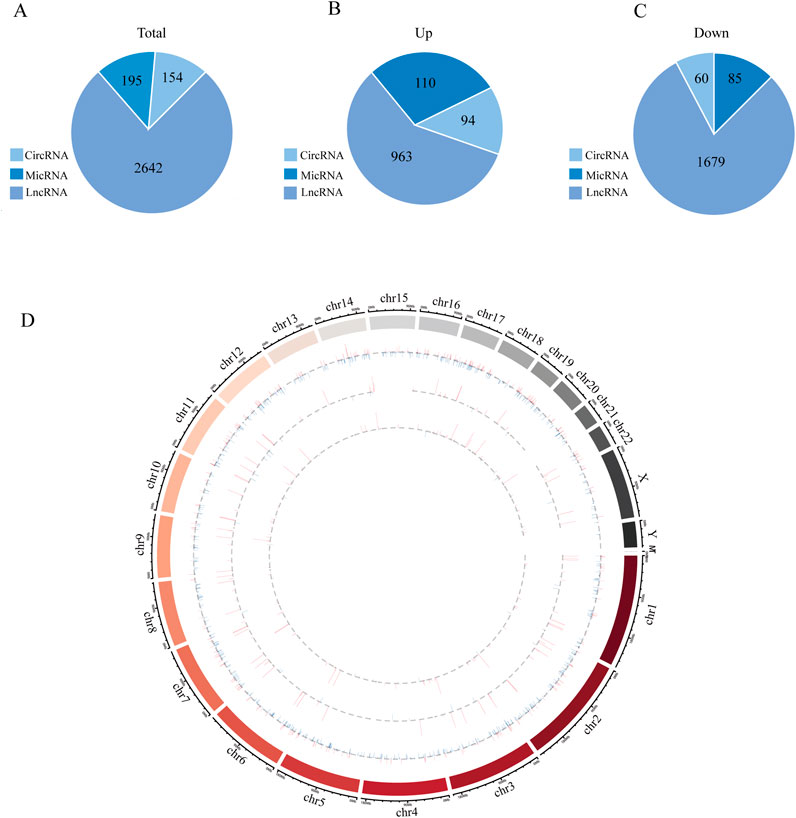
Figure 1. The high-throughput sequencing result between Obesity and Normal group. (A) The general expression profiles of lncRNAs, micRNAs and circRNAs between Obesity and Normal group. (B) Differentially upregulated lncRNAs, miRNAs and circRNAs between Obesity and Normal group. (C) Differentially downregulated lncRNAs, miRNAs and circRNAs between Obesity and Normal group. (D) The relative location information of ncRNAs in chromosome, the outermost circle represents chromosome location and then lncRNAs, circRNAs and micRNAs from outside to inside, respectively. The expression profiles of upregulated and downregulated RNAs are marked red and blue, respectively, and the height od each line represents differential expression profiles [log (FDR)].
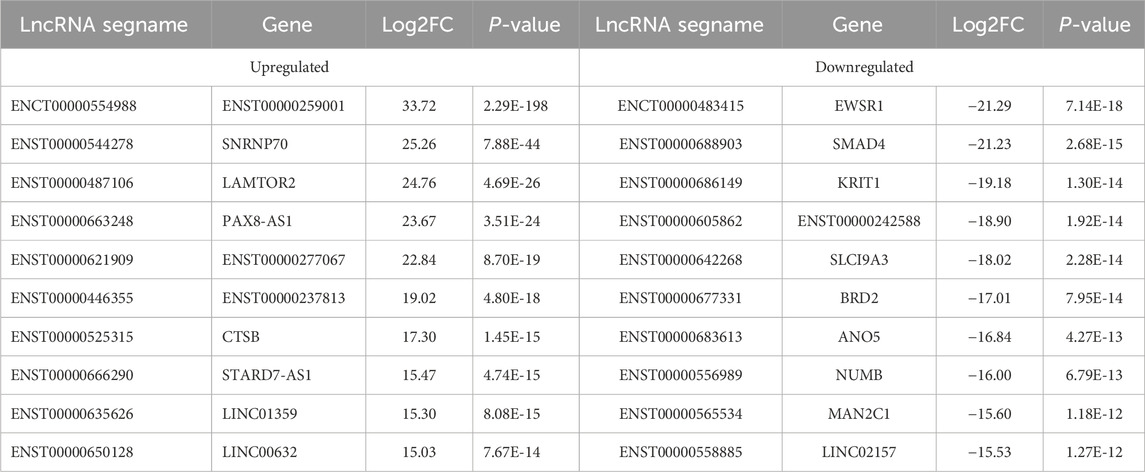
Table 3. The Top 10 upregulated and top 10 downregulated differenciated lncRNAs.
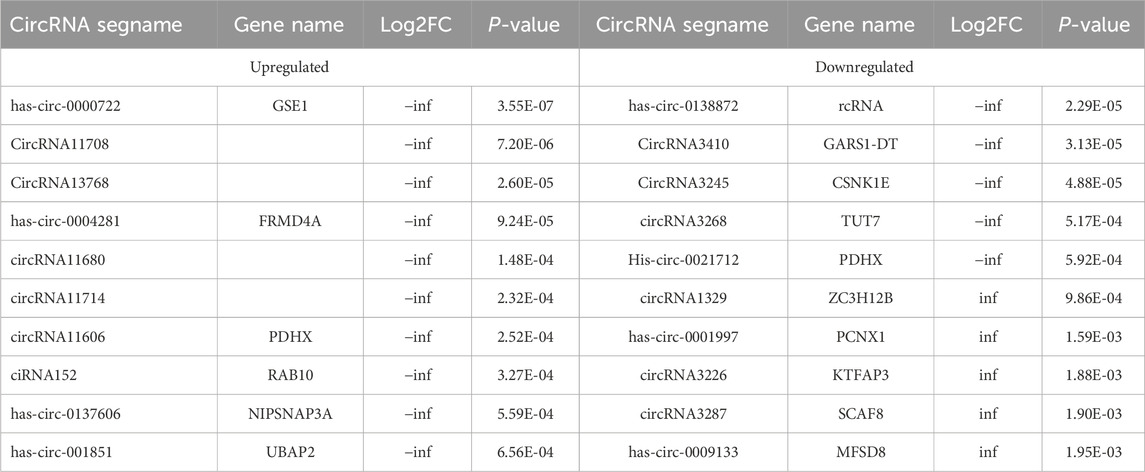
Table 4. The Top 10 upregulated and top 10 downregulated differenciated circRNAs.
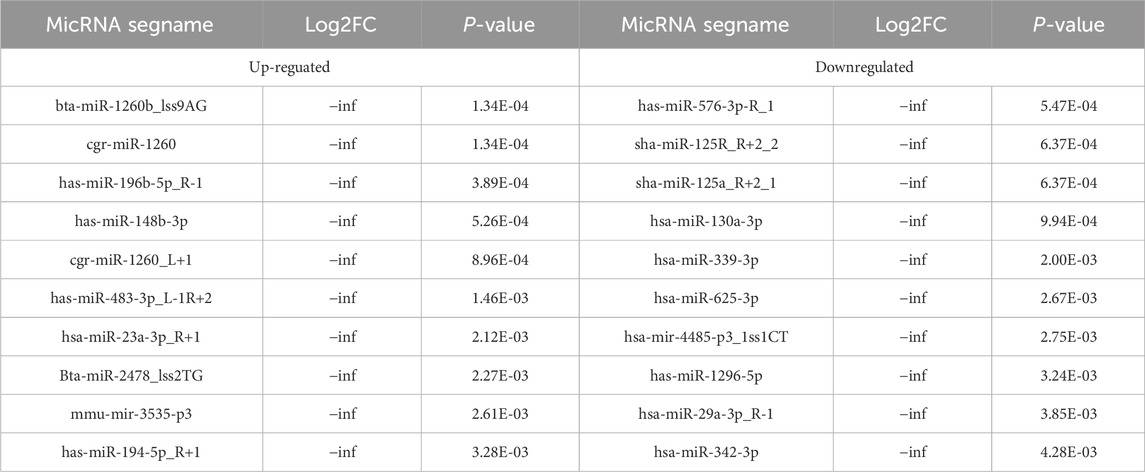
Table 5. The Top 10 upregulated and top 10 downregulated differenciated micRNAs.
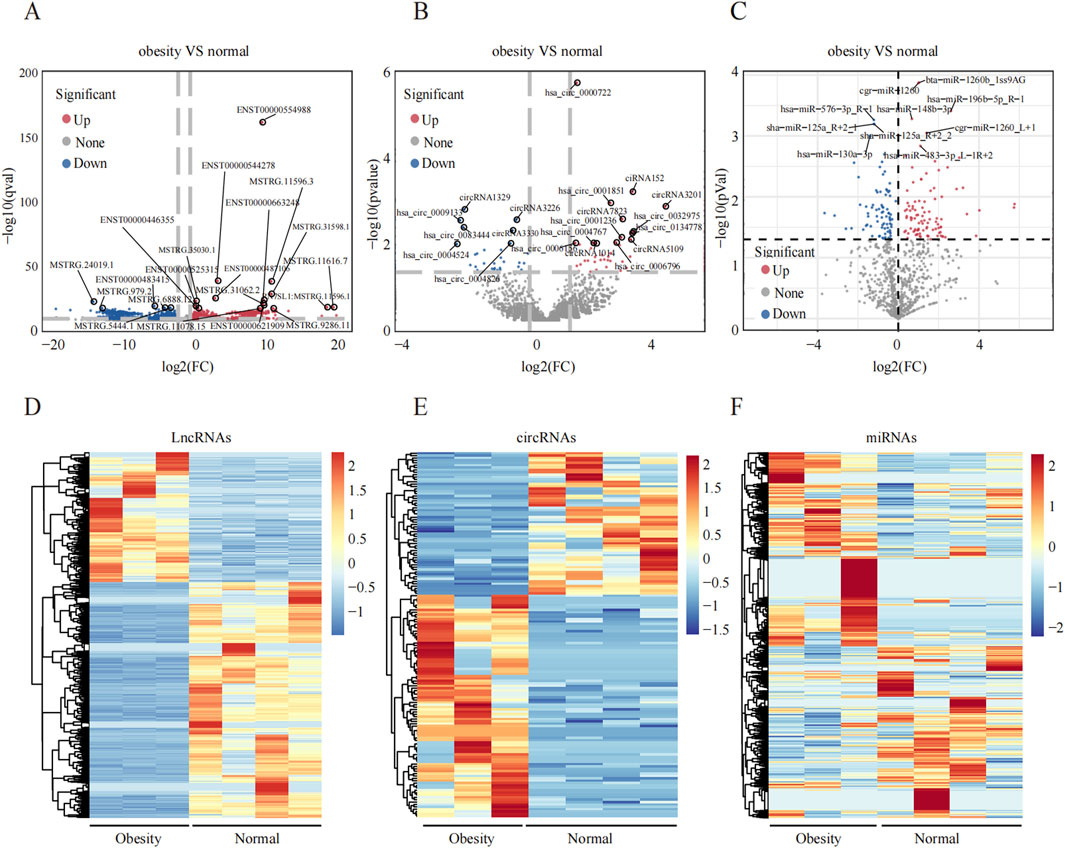
Figure 2. Differential expression profiles of ncRNAs in the greater omentum adipose tissue between obesity and normal individuals. (A–C) Volcano plot of DElncRNAs, DEmiRNAs and DEcircRNAs, respectively, the upregulated and downregulated DEncRNAs and marked red and blue. (D–F) The hierarchical clustering of DElncRNAs, DEmiRNAs and DEcircRNAs.
Enrichment analysis was conducted to uncover the potential roles of the DE lncRNAs, circRNAs, and miRNAs in metabolic pathways. GO analysis of the BP terms revealed that the DE lncRNAs and circRNAs were predominantly enriched in lipid metabolic processes. The GO analysis for cellular components (CCs) indicated that these DE lncRNAs and circRNAs might be associated with cellular compartments such as the “Cytoplasm, Membrane, and Nucleus,” whereas the DE miRNAs were enriched primarily in the Cytoplasmic Cytosol and Membrane. The GO analysis for molecular functions (MFs) suggested that the DE lncRNAs, circRNAs, and miRNAs could be involved in ATP binding (Figures 3A–C; Tables 6–8).
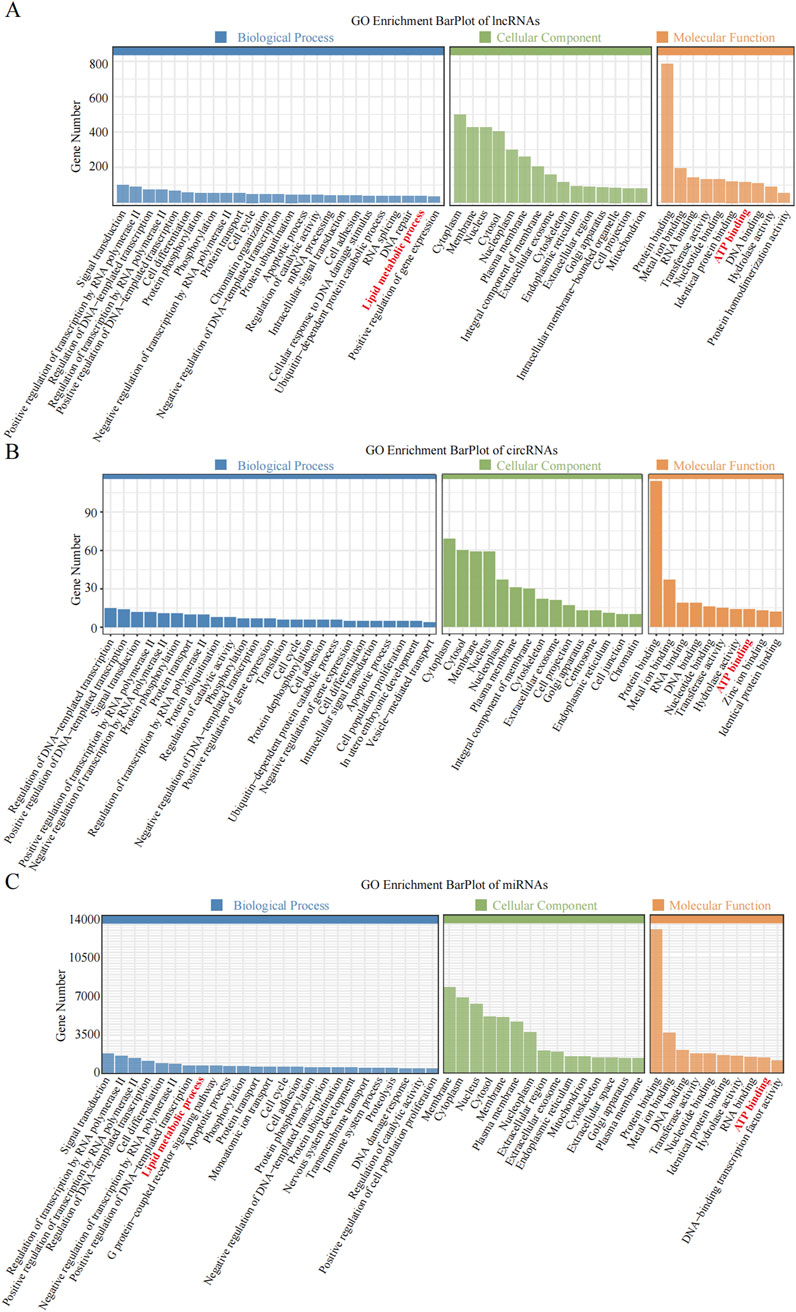
Figure 3. GO enrichment analysis of the differential non-coding RNA. (A–C) The Y-axis represents the number of DE non-coding RNA ((A) lncRNA; (B) circRNA; (C) miRNA), with individual GO term plotted on the X-axis. All GO term were grouped into three categories: biological process, cellular component, and molecular functions.
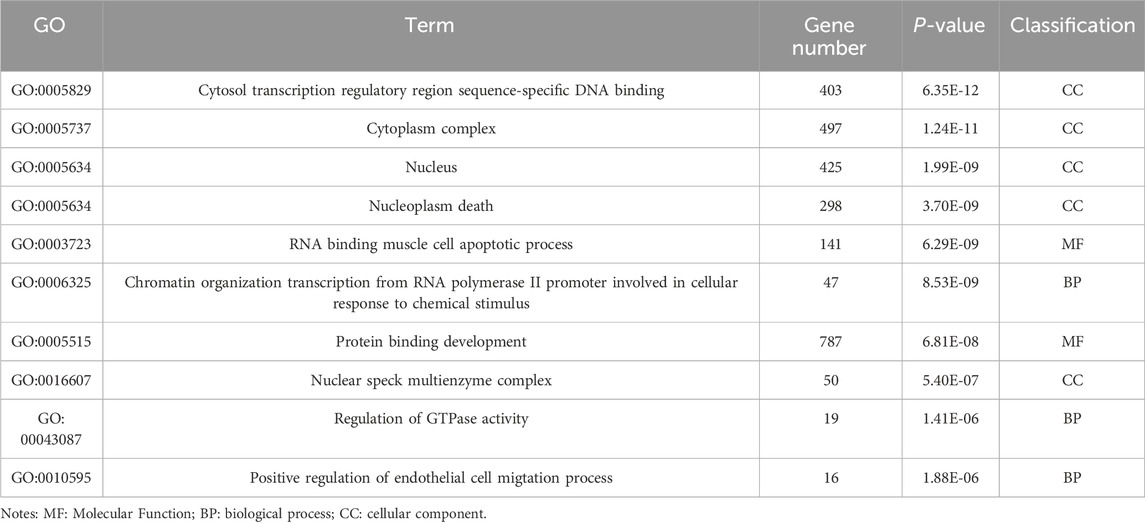
Table 6. GO enrichment results of differentially expressed genes (lncRNA).
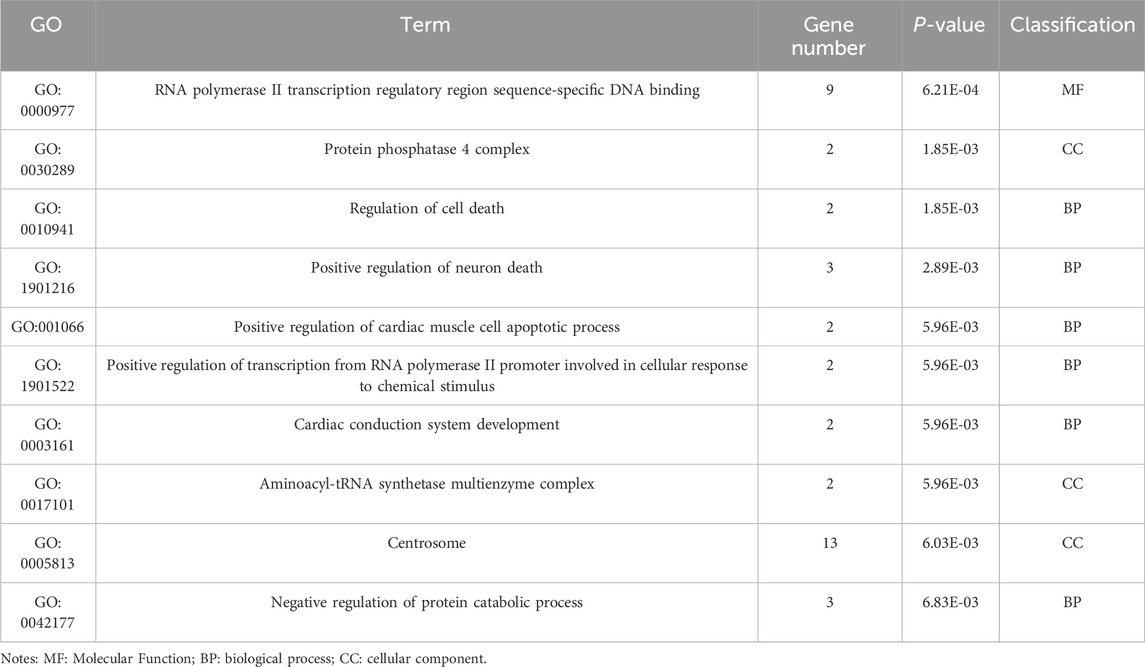
Table 7. GO enrichment results of differentially expressed genes (circRNA).
Table 8. GO enrichment results of differentially expressed genes (micRNA).
KEGG pathway analyses revealed that the DE lncRNAs were predominantly involved in the “glucagon signaling pathway within metabolic processes” (Figure 4A). The DE circRNAs were chiefly associated with the “AMPK signaling pathway and PPAR signaling pathway” (Figure 4B). AMPK, recognized as a master regulator of energy homeostasis and a principal sensor of nutrient availability, plays a crucial role in promoting catabolic processes while inhibiting anabolic metabolism (Jiang et al., 2021). The PPAR signaling pathway, which is crucial for hepatic lipid metabolism, has been implicated in the dysregulation of hepatic lipid metabolism and multiple metabolic disorders (Mao et al., 2021). The DE miRNAs were involved in metabolic pathways (Figure 4C) (Tables 9–11).
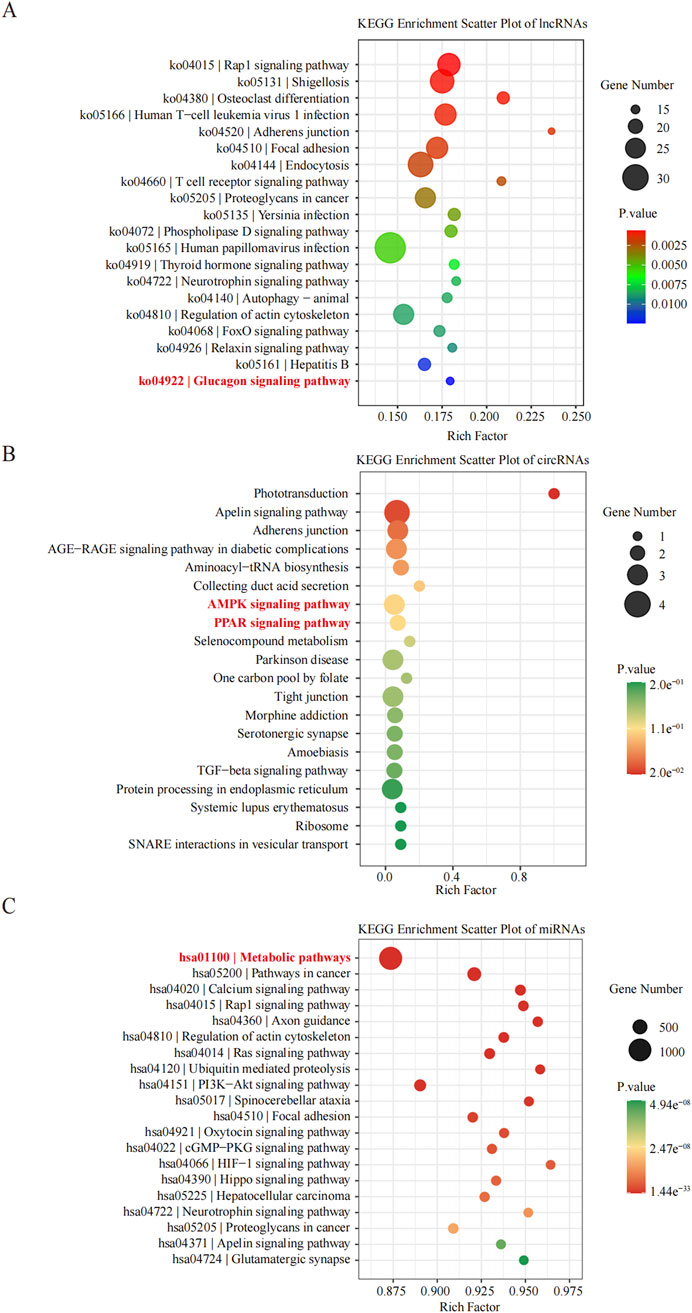
Figure 4. Histogram of Kyoto Encyclopedia of Genes and Genomes (KEGG) pathways enrichment in DE ncRNAs. (A–C) The X-axis represents the number of DE non-coding RNAs ((A) lncRNA; (B) circRNA; (C) miRNA) annotated in a pathway, with individual KEGG terms shown on the Y-axis.
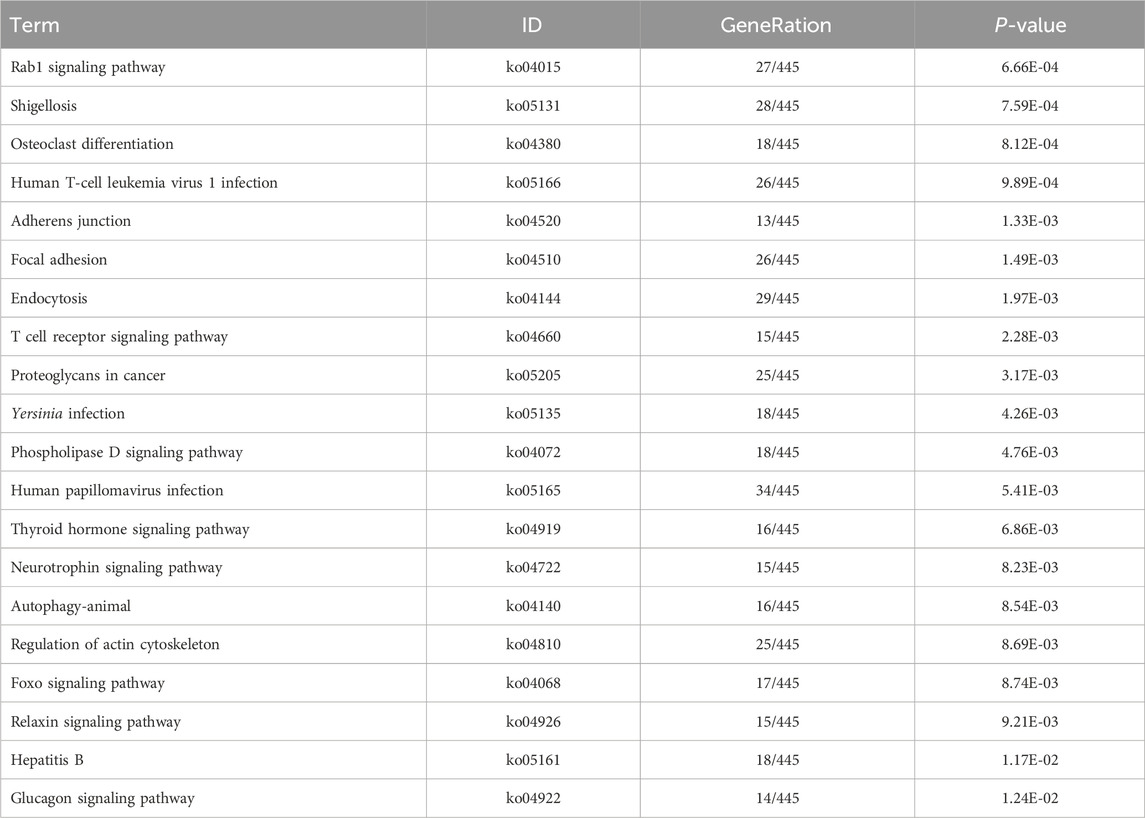
Table 9. KEGG enrichment pathway results of differentially expressed gene (lncRNA).
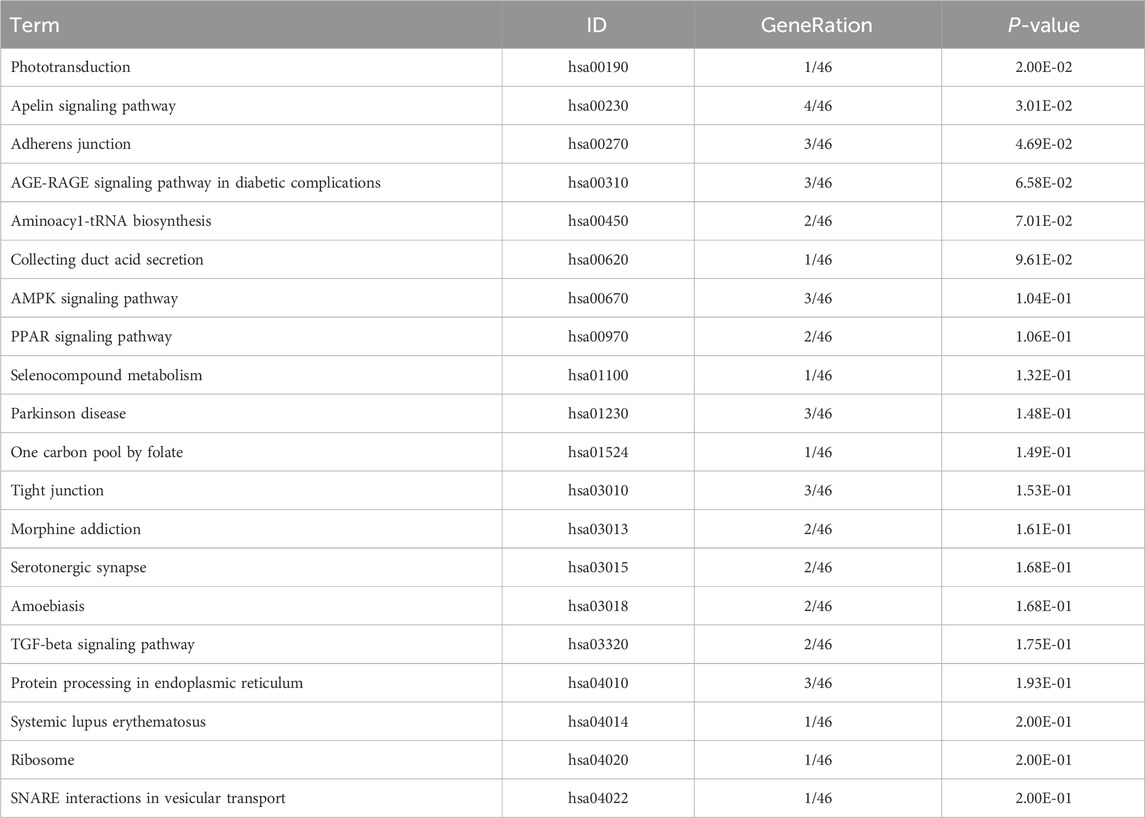
Table 10. KEGG enrichment pathway results of differentially expressed gene (circRNA).
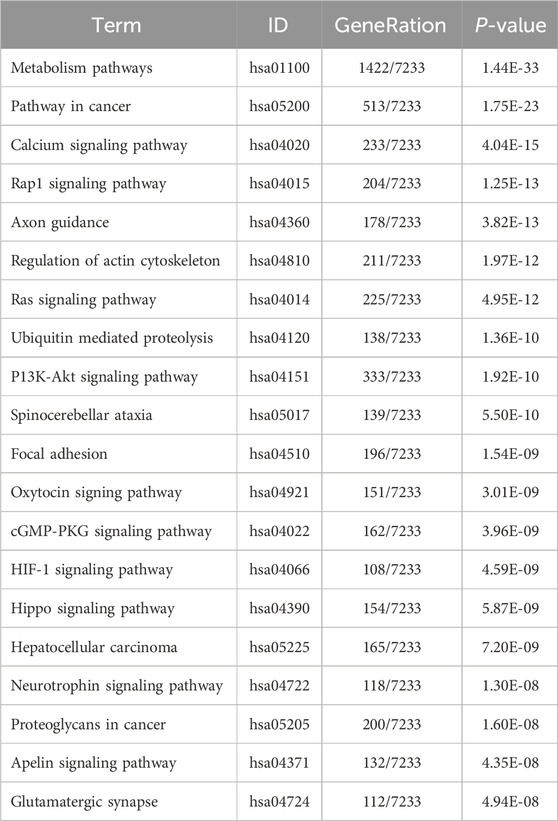
Table 11. KEGG enrichment pathway results of differentially expressed gene (micRNA).
We subsequently conducted qRT-PCR on human omentum adipose tissue samples to validate the top 10 DE lncRNAs and the top 5 DE circRNAs using a criteria by |log2FC| ≥2 with adjust P < 0.05, including both upregulated and downregulated candidates. As shown in Figure 5, the expression levels of the lncRNAs ENST00000554988, ENST00000446355, and ENST00000650128 and the circRNA hsa_circ_0000722 were significantly greater in obese individuals than in normal-weight individuals (P < 0.05), which aligns with the RNA-seq findings. Additionally, the expression of the lncRNAs ENST00000483415, ENST00000688903, ENST00000686149, ENST00000605862, ENST00000642268, ENST00000683613, ENST00000556989, and ENST00000558885 and the expression of the circRNAs circRNA3410, circRNA3245, and circRNA3268 were significantly downregulated in adipose tissue in obese individuals (P < 0.05), further corroborating the RNA-seq data.
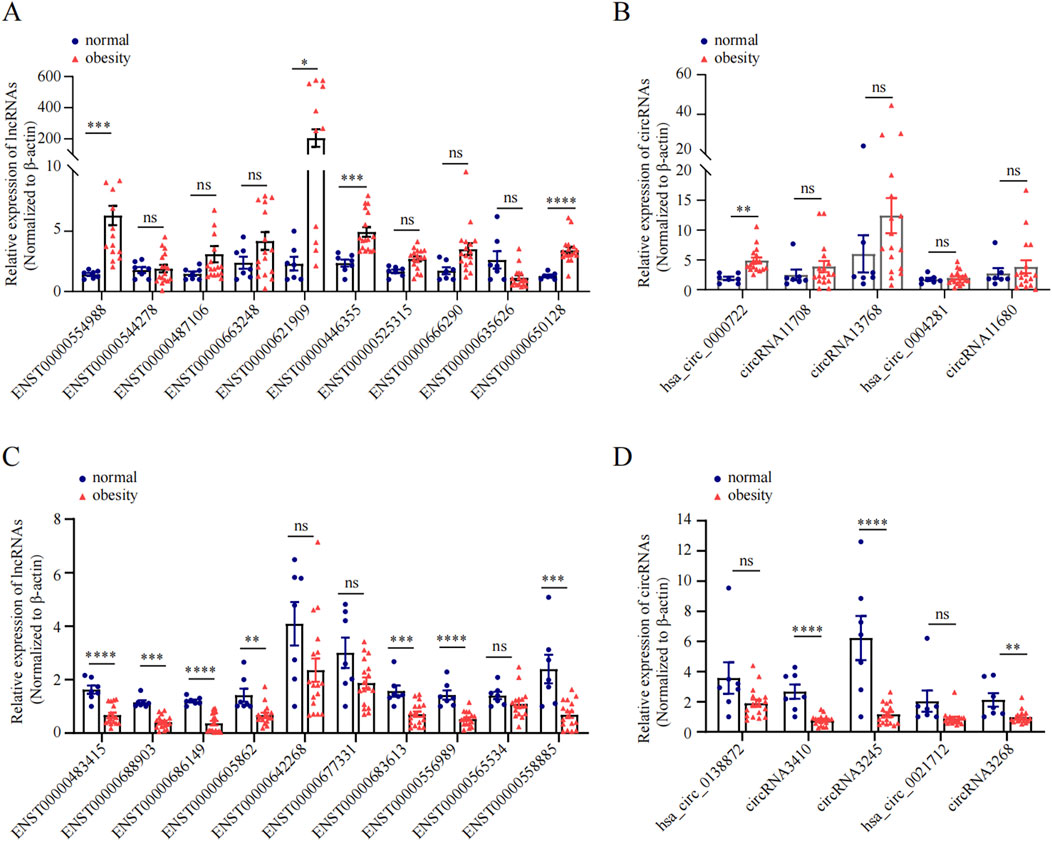
Figure 5. qRT-PCR validation of DE ncRNAs in obese and normal visceral adipose tissues. (A, C): The relative expression of top 10 upregulated and top 10 downregulated lncRNA between obesity and normal body weight individuals. (B, D): The relative expression of top 5 upregulated and top 5 downregulated circRNAs between obesity and normal body weight individuals.
To deepen our understanding of the identified ncRNAs, we constructed a ceRNA regulatory network incorporating the 15 most DE ncRNAs, comprising 11 lncRNAs and 4 circRNAs. We then targeted all the DE mRNAs obtained from RNA-seq to identify those associated with these 15 ceRNAs. Subsequent enrichment analyses were performed to annotate the mRNAs within this ceRNA regulatory network. Notably, a significant number of mRNAs were enriched in lipid metabolic processes, as indicated by the BP term in the GO analysis (Figure 6A). Furthermore, KEGG analysis revealed that the most significantly enriched pathway was metabolic pathways, involving 166 DE mRNAs (Figure 6B). Thus, by targeting DE mRNAs and conducting enrichment analyses, we revealed a close relationship between these 15 ceRNAs and metabolic pathways, suggesting their potential regulatory role in obesity.
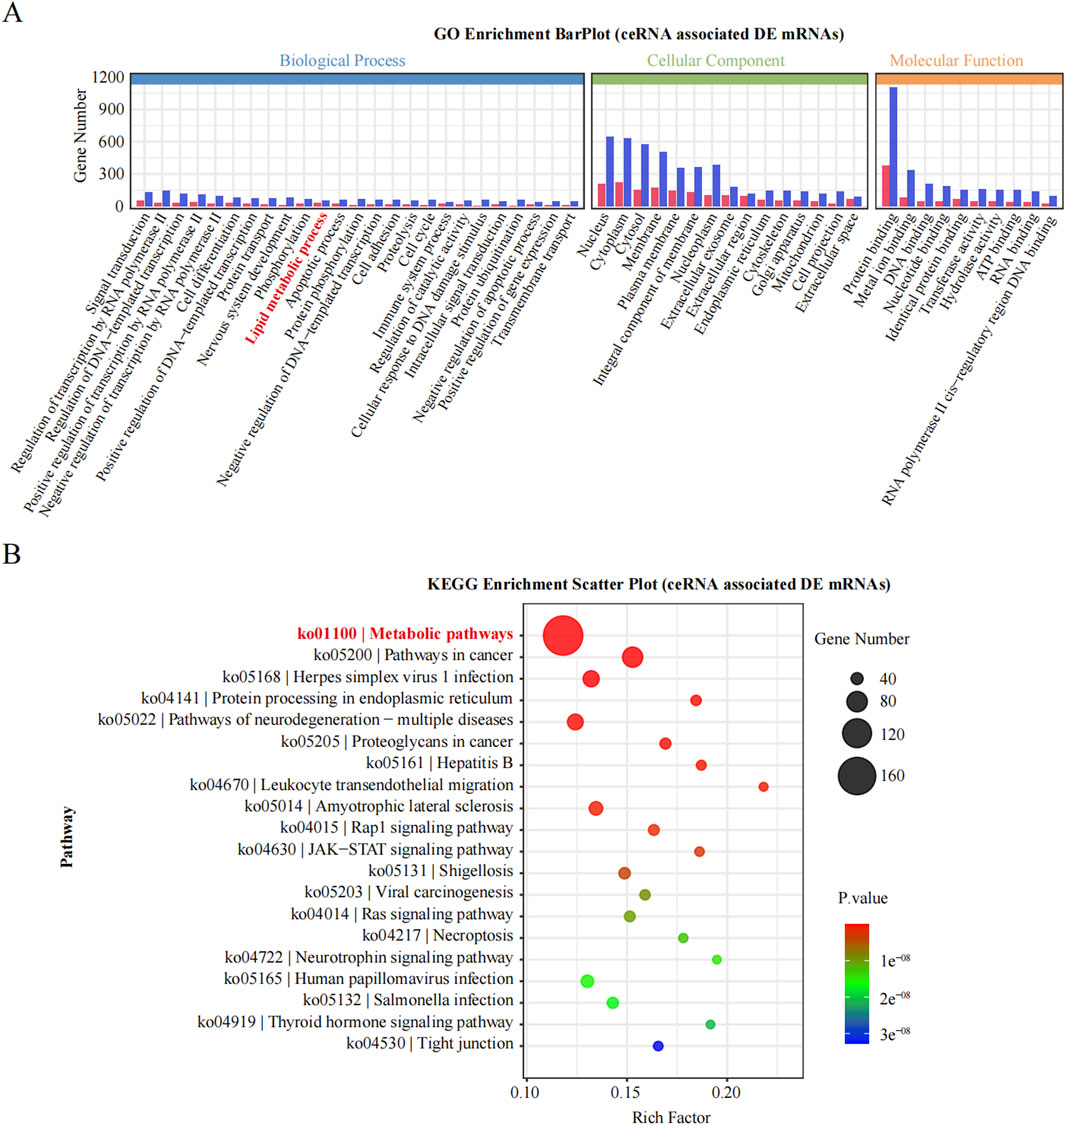
Figure 6. GO and KEGG enrichment analysis of DE genes. (A): The significantly enriched GO of BP, MF and CC. (B): The significantly enriched KEGG pathways of DE gene.
To pinpoint the hub genes among the 166 DE genes related to metabolic pathways, we utilized Cytoscape software to construct a PPI network comprising 158 nodes and 624 edges (Figure 7A). We ranked the network on the basis of the degree parameter, which was calculated with the CytoNCA plugin in Cytoscape. Genes with higher degree values were considered to play more significant roles in the network.
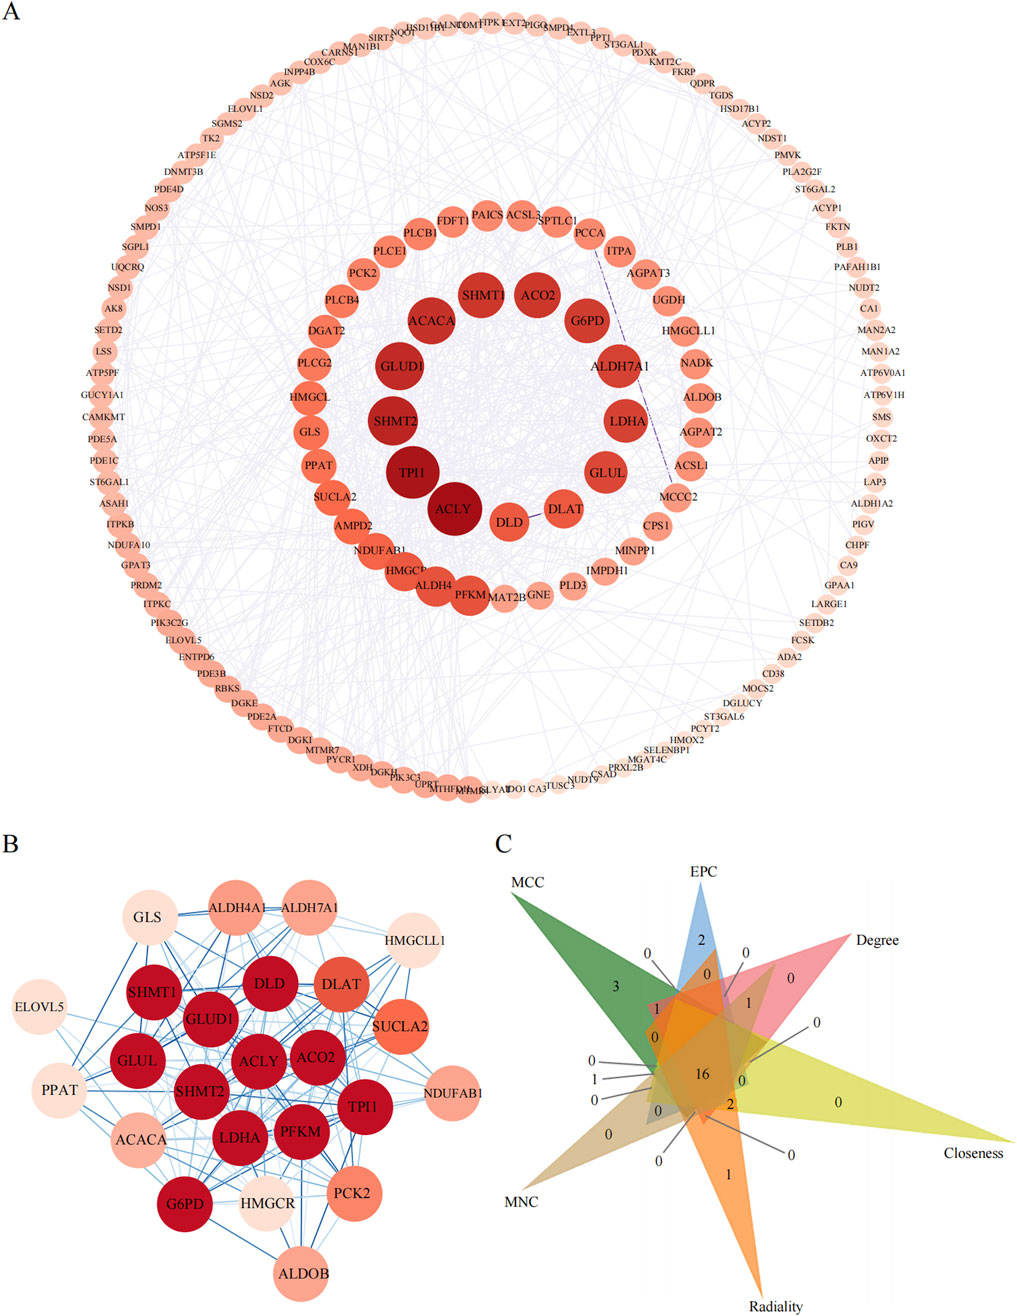
Figure 7. The PPI analyses of metabolic pathway associate EDGs. (A): PPI network of metabolic pathway associate DEGs. (B): The most significant gene clustering module identified by MCODE plugin of Cytoscape software. (C): Venn diagram of 6 similar algorithms (MCC, EPC, Degree, Closeness, Radiality, MNC) in cytoHubba plugin which screened out 16 overlapping hub genes.
We then assessed the coexpression network involving lncRNAs and their target genes. Within this coexpression network, the top three lncRNAs identified were ENST00000605862, ENST00000558885, and ENST00000686149. These findings suggest that these three lncRNAs are closely associated with metabolic pathways, indicating potential functional relatedness or regulatory interactions. The MCODE plugin in Cytoscape was employed to identify the most densely connected gene module, which included 24 common genes (Figure 7B). We subsequently integrated the results from six similar algorithms in cytoHubba to determine the most critical genes within the network. These algorithms included the maximum connectivity (MCC), edge percolated component (EPC), degree, closeness, radiality, and maximum neighborhood component (MNC). The top 25 hub genes identified by these six algorithms were intersected, yielding a final set of 16 hub genes (Figure 7C). A brief overview of the 16 hub genes, including G6PD, ACACA, TPI1, ALDH7A1, GLUD1, DLAT, GLUL, LDHA, GLS, SHMT2, ACLY, SHMT1, PFKM, SUCLA2, DLD, and SCO2, is provided. Among these 16 hub genes, eight have been previously reported to be strongly associated with obesity (Matsumura et al., 2024; Khatiwada et al., 2021; Chen et al., 2021; Pan et al., 2023), namely, G6PD, ACACA, TPI1, DLAT, ACLY, DLD, and ACO2, highlighting their relevance to metabolic processes.
We then evaluated the coexpression network of the DE lncRNAs validated by qRT‒PCR and the eight metabolism-related genes highlighted in Figure 7C. In this coexpression network, ENST00000605862, ENST00000558885, and ENST00000686419 were most closely associated with these metabolic genes (Figure 8A). To further investigate the potential regulatory roles of the DE lncRNAs in metabolic pathways, we conducted additional analyses of ENST00000605862, ENST00000558885, and ENST00000686149. ENST00000605862 was targeted by 36 miRNAs, which in turn regulated the eight DE genes (Figure 8B). ENST00000558885 was targeted by 20 miRNAs, and these miRNAs also regulated the eight DE genes (Figure 8C). ENST00000686149 was targeted by 24 miRNAs, with these miRNAs regulating the same eight DE genes (Figure 8D).
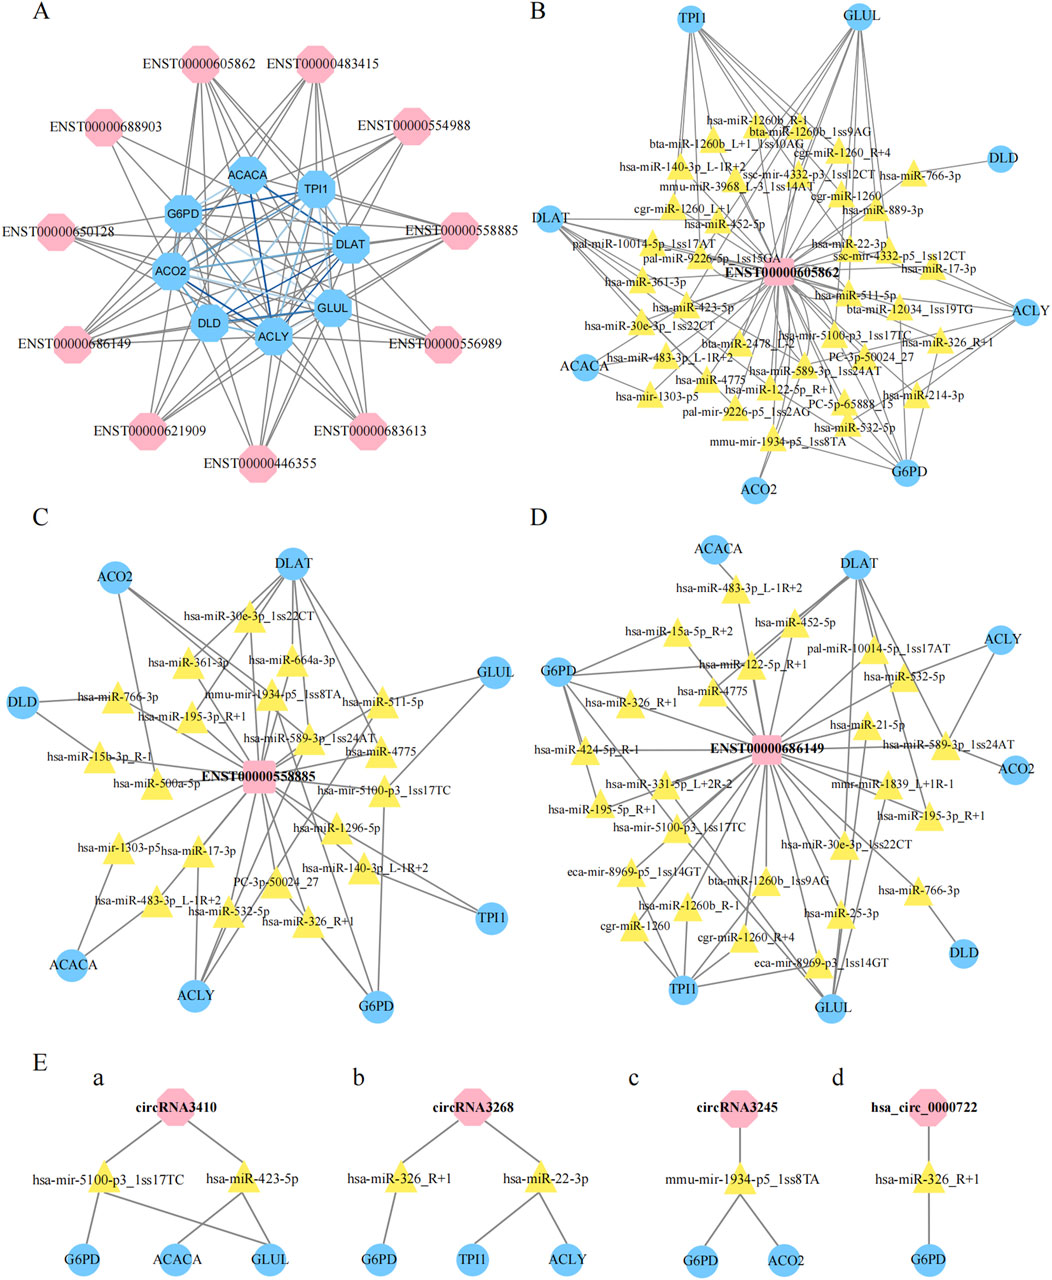
Figure 8. Construction of non-codings co-expression network. (A): Construction of lncRNAs-proteins co-expression network, the blue hexagon represented gene, and the pink hexagon represented lncRNA, the grizzly lines link gene to lncRNA, blue lines link gene to gene. (B–D): Construction of LncRNAs-micRNNAs -proteins co-expression network, the pink square represented lncRNA, the yellow triangle represented micRNA, and the blue oval represented gene. (E): The pink hexagon represented lncRNA, the yellow triangle represented micRNA, and the blue oval represented gene.
In addition, we focused on four differential circRNAs, namely, hsa_circ_0000722, circRNA3410, circRNA3245 and circRNA3268, for coexpression network analysis. We found that circRNA3410 was targeted by two miRNAs, which regulated G6PD, ACACA, and GLUL (Figure 8E/a). CircRNA3268 was also targeted by two miRNAs, which regulated G6PD, TPI1, and ACLY (Figure 8E/b). CircRNA3245 was targeted by mmu-miR-1934-5p_1ss8TA, which in turn targeted G6PD and ACO2 (Figure 8E/c). Finally, hsa_circ_0000722 was targeted by hsa-miR-326_R+1, which specifically targeted G6PD (Figure 8E/d).
In this study, we delineated the ncRNA profiles of human omentum adipose tissue in obese and healthy subjects through high-throughput RNA sequencing coupled with comprehensive analysis via multiple databases. Greater omentum adipose tissue, a distinct form of visceral fat, is known to play pivotal roles in the development of obesity. Here, we present a detailed characterization of the involved ncRNAs, with a particular emphasis on the differential expression patterns of lncRNAs, circRNAs, and miRNAs. The ncRNA profiles established in this study are poised to broaden our understanding of the mechanisms underlying obesity, contributing to the growing body of research in this field.
In recent years, with the development of basic research on obesity and related metabolic diseases, lncRNAs have been identified as having substantial potential as biomarkers in fat metabolism-related diseases. Many lncRNAs are adipose-enriched, strongly induced during adipogenesis, and bound at their promoters by key transcription factors, such as peroxisome proliferator-activated receptor γ (PPARγ) and CCATT/enhancer-binding protein α (CEBPα) (Sun et al., 2013). Recent studies have shown that lncRNAs have clinical applicability, are convenient biomarkers for disease diagnosis (An et al., 2020), and, compared with mRNAs, exhibit greater tissue specificity and often function in a tissue-specific manner (Ruan et al., 2020). Studies have shown that lnc-dPrdm16 is required for brown adipocyte differentiation and revealed that conserved lncRNAs are regulators of brown adipogenesis (Ding et al., 2018). To understand more about the biological effects of lncRNAs in WAT, we performed full-gene sequencing of 7 human samples (3 from obese patients and 4 from healthy controls) via RNA sequencing. We ultimately obtained 2642 DE lncRNAs, which with 963 upregulated lncRNAs and 1679 downregulated lncRNAs. We then validated the top 10 DE lncRNAs via qRT‒PCR. The results confirmed that four of the 10 upregulated and seven of the 10 downregulated lncRNAs were consistent with the RNA-seq findings. These lncRNAs represent key targets that merit further investigation.
We then further analyzed these 11 lncRNAs, and the analysis generated multiple findings suggesting that ENST00000605862, ENST00000558885 and ENST00000686149 may play important roles in obesity. Most importantly, we found that the strongest associations were between ENST00000605862 and metabolism-related genes. However, since most human lncRNAs are human- or primate specific, identifying the potential functionality of lncRNAs and further investigating their functions in vivo is extremely challenging. Fortunately, a recently published article reported that the human-derived lncRNA ENST00000605862 is homologous to murine-derived ENSMUSG00000092090. These findings may provide a basis for further investigations of the functions of this lncRNA.
Cardiovascular disease (CVD), diabetes, hypertension, and atherosclerosis are associated with the dysregulation of circRNAs in closed cells. Studies in vitro and in vivo suggest that circRNAs play a role in adipogenesis, WAT browning, obesity, obesity-induced inflammation and insulin resistance. In experiments involving animal adipose tissue, the analysis of pig subcutaneous adipose tissue revealed that circRNA-11897 and circRNA-26852 are DE in obesity (Li et al., 2018). Similarly, Zhang Z. et al. (2019) and Zhang T. et al. (2019) validated the findings in mouse adipose tissue and reported that circARF3 and circNrxn2 are associated with adipose tissue inflammation and WAT browning. Over the past few years, experiments using human adipose tissue have shown that circ-0136134, hsa-circ-0017650, hsa-circRNA9227, circTshz2-1 and circArhgap5-2 are closely related to adipogenesis (Arcinas et al., 2019; Sun et al., 2019). In the present study, we identified 154 DE circRNAs via greater omentum adipose tissue sequencing, with 94 upregulated circRNAs and 60 downregulated circRNAs. We checked the sequencing data and verified the top 10 DE circRNAs. Consistent changes were detected in hsa_circ_0000722, circRNA3410, circRNA3245 and circRNA3268, indicating the high reliability of the sequencing data. These data provide additional potential circRNAs for the regulation of obesity occurrence.
Numerous miRNAs are present in human adipose tissue and influence adipocyte differentiation, β-cell quantity, and the insulin signature (Ghafouri-Fard and Taheri, 2021). Wang et al. (2010) evaluated the expression signatures of 799 miRNAs in human adipocytes during differentiation and in subcutaneous fat samples from nonobese and obese subjects. They identified 50 DE miRNAs between obese and nonobese individuals. In the present study, we utilized human greater omentum adipose tissue and annotated 763 miRNAs, and the results were highly consistent with those in previous reports. Among these miRNAs, 195 were DE, with 94 significantly upregulated mRNAs and 85 significantly downregulated mRNAs. Our genome-wide miRNA profiling study identified additional DE miRNAs, and individual differences may be mainly responsible for these differences. Further research is needed to understand precisely how miRNA activity is involved in the processes underlying the development of obesity,at as well as how miRNAs can be utilized for disease management.
A large number of studies have now reported that targeting ncRNAs is an attractive approach for treating various diseases. However, no LncRNA targeting therapeutics have yet reached clinical translation, and most of the research has been on non-coding and tumor therapy with little research on obesity (Nappi, 2024). Our results highlighted specific lncRNAs ENST00000605862, ENST00000558885, and ENST00000686149 as potential biomarkers for obesity and analyze their functions and roles in metabolic pathways and their relationships with metabolic genes. It was emphasized that lncRNAs may be potential targets as obesity treatment. However, the role of lncRNAs in metabolic pathways lacks experimental validation beyond bioinformatics predictions. The conclusions drawn about the therapeutic potential of the identified ncRNAs are speculative and should be tempered until further experimental validation is performed.
In summary, our study delineated the ncRNA profiles in omentum adipose tissue from obese human patients. We identified numerous lncRNAs, circRNAs, and miRNAs that are significantly DE. Further ceRNA network analysis of the identified DE ceRNAs with mRNAs revealed that ceRNAs play a significant regulatory role in metabolic processes. Even though integrated analysis across multiple databases identified the lncRNAs ENST000000558885, ENST000000605862, and ENST000000686149 as potential biomarkers for obesity, our study cohort was small and relied on bioinformatic analyses without further experimental validation in vivo in animals, so followup should be required to design further experiments to validate the analysis. Overall, our study significantly contributes to the understanding of ncRNAs in obesity.
The data presented in the study are deposited in the GEO repository, accession number GSE286454.
The study received approval from the Ethics Committee of The First Affiliated Hospital of Shandong First Medical University, with reference number [2022] No. S628. The studies were conducted in accordance with the local legislation and institutional requirements. The participants provided their written informed consent to participate in this study.
YZ: Writing–original draft. AC: Writing–original draft. SL: Methodology, Supervision, Writing–review and editing. DL: Writing–original draft. XX: Writing–original draft. XL: Writing–original draft, Writing–review and editing. MZ: Writing–review and editing. FG: Writing–review and editing.
The author(s) declare that no financial support was received for the research, authorship, and/or publication of this article. This work was supported by Shandong First Medical University (Shandong Academy of Medical Sciences) Youth Science Foundation Funding Program (Grant No. 202201-083), the Natural Science Foundation of Shandong Province, China (Grant No. ZR2023MH031; No. ZR2023QH232).
The authors declare that the research was conducted in the absence of any commercial or financial relationships that could be construed as a potential conflict of interest.
The author(s) declare that no Generative AI was used in the creation of this manuscript.
All claims expressed in this article are solely those of the authors and do not necessarily represent those of their affiliated organizations, or those of the publisher, the editors and the reviewers. Any product that may be evaluated in this article, or claim that may be made by its manufacturer, is not guaranteed or endorsed by the publisher.
An, T., Zhang, J., Liu, Y. F., Wu, Y. X., Lian, J., Wang, T. Y., et al. (2020). Combined analysis of whole-exon sequencing and lncRNA sequencing in type 2 diabetes mellitus patients with obesity. J. Cell. Mol. Med. 24 (4), 2451–2463. doi:10.1111/jcmm.14932
Arcinas, C., Tan, W., Fang, W., Desai, T. P., Teh, D. C. S., Degirmenci, U., et al. (2019). Adipose circular RNAs exhibit dynamic regulation in obesity and functional role in adipogenesis. Nat. Metab. 1 (7), 688–703. doi:10.1038/s42255-019-0078-z
Chen, K., Shen, Z., Gu, W., Lyu, Z., Qi, X., Mu, Y., et al. (2023). Prevalence of obesity and associated complications in China: a cross-sectional, real-world study in 15.8 million adults. Diabetes Obes. Metab. 25 (11), 3390–3399. doi:10.1111/dom.15238
Chen, L., Dai, Y.-M., Ji, C.-B., Yang, L., Shi, C.-M., Xu, G.-F., et al. (2014). MiR-146b is a regulator of human visceral preadipocyte proliferation and differentiation and its expression is altered in human obesity. Mol. Cell. Endocrinol. 393 (1-2), 65–74. doi:10.1016/j.mce.2014.05.022
Chen, S., Liu, X., Peng, C., Tan, C., Sun, H., Liu, H., et al. (2021). The phytochemical hyperforin triggers thermogenesis in adipose tissue via a Dlat-AMPK signaling axis to curb obesity. Cell Metab. 33 (3), 565–580.e7. doi:10.1016/j.cmet.2021.02.007
Das, S., Stadelmeyer, E., Schauer, S., Schwarz, A., Strohmaier, H., Claudel, T., et al. (2015). Micro RNA-124a regulates lipolysis via adipose triglyceride lipase and comparative gene identification 58. Int. J. Mol. Sci. 16 (4), 8555–8568. doi:10.3390/ijms16048555
Ding, C., Lim, Y. C., Chia, S. Y., Walet, A. C. E., Xu, S., Lo, K. A., et al. (2018). De novo reconstruction of human adipose transcriptome reveals conserved lncRNAs as regulators of brown adipogenesis. Nat. Commun. 9 (1), 1329. doi:10.1038/s41467-018-03754-3
Fadini, G. P., Xu, B., Gerin, I., Miao, H., Vu-Phan, D., Johnson, C. N., et al. (2010). Multiple roles for the non-coding RNA SRA in regulation of adipogenesis and insulin sensitivity. PLoS ONE 5 (12), e14199. doi:10.1371/journal.pone.0014199
Fan, Y., Gan, M., Tan, Y., Chen, L., Shen, L., Niu, L., et al. (2019). Mir-152 regulates 3T3-L1 preadipocyte proliferation and differentiation. Molecules 24 (18), 3379. doi:10.3390/molecules24183379
Ghafouri-Fard, S., and Taheri, M. (2021). The expression profile and role of non-coding RNAs in obesity. Eur. J. Pharmacol. 892, 173809. doi:10.1016/j.ejphar.2020.173809
Jiang, P., Ren, L., Zhi, L., Yu, Z., Lv, F., Xu, F., et al. (2021). Negative regulation of AMPK signaling by high glucose via E3 ubiquitin ligase MG53. Mol. Cell 81 (3), 629–637.e5. doi:10.1016/j.molcel.2020.12.008
Khan, S. Y., Hackett, S. F., and Riazuddin, S. A. (2016). Non-coding RNA profiling of the developing murine lens. Exp. Eye Res. 145, 347–351. doi:10.1016/j.exer.2016.01.010
Khatiwada, S., Lecomte, V., Fenech, M. F., Morris, M. J., and Maloney, C. A. (2021). Effects of micronutrient supplementation on glucose and hepatic lipid metabolism in a rat model of diet induced obesity. Cells 10 (7), 1751. doi:10.3390/cells10071751
Li, A., Huang, W., Zhang, X., Xie, L., and Miao, X. (2018). Identification and characterization of CircRNAs of two pig breeds as a new biomarker in metabolism-related diseases. Cell. Physiology Biochem. 47 (6), 2458–2470. doi:10.1159/000491619
Liu, Y., Liu, H., Li, Y., Mao, R., Yang, H., Zhang, Y., et al. (2020). Circular RNA SAMD4A controls adipogenesis in obesity through the miR-138-5p/EZH2 axis. Theranostics 10 (10), 4705–4719. doi:10.7150/thno.42417
Liu, Y., Wang, Y., He, X., Zhang, S., Wang, K., Wu, H., et al. (2018). LncRNA TINCR/miR-31-5p/C/EBP-α feedback loop modulates the adipogenic differentiation process in human adipose tissue-derived mesenchymal stem cells. Stem Cell Res. 32, 35–42. doi:10.1016/j.scr.2018.08.016
Lu, T. X., and Rothenberg, M. E. (2018). MicroRNA. J. Allergy Clin. Immunol. 141 (4), 1202–1207. doi:10.1016/j.jaci.2017.08.034
Mao, Z., Feng, M., Li, Z., Zhou, M., Xu, L., Pan, K., et al. (2021). ETV5 regulates hepatic fatty acid metabolism through PPAR signaling pathway. Diabetes 70 (1), 214–226. doi:10.2337/db20-0619
Matsumura, S., Signoretti, C., Fatehi, S., Tumenbayar, B. I., D’Addario, C., Nimmer, E., et al. (2024). Loss-of-function G6PD variant moderated high-fat diet-induced obesity, adipocyte hypertrophy, and fatty liver in male rats. J. Biol. Chem. 300 (7), 107460. doi:10.1016/j.jbc.2024.107460
Nappi, F. (2024). Non-coding RNA-targeted therapy: a state-of-the-art review. Int. J. Mol. Sci. 25 (7), 3630. doi:10.3390/ijms25073630
Pan, X., Ye, L., Guo, X., Wang, W., Zhang, Z., Wang, Q., et al. (2023). Glutamine production by glul promotes thermogenic adipocyte differentiation through prdm9-mediated H3K4me3 and transcriptional reprogramming. Diabetes 72 (11), 1574–1596. doi:10.2337/db23-0162
Qin, L., Chen, Y., Niu, Y., Chen, W., Wang, Q., Xiao, S., et al. (2010). A deep investigation into the adipogenesis mechanism: profile of microRNAs regulating adipogenesis by modulating the canonical Wnt/beta-catenin signaling pathway. BMC Genomics 11 (1), 320. doi:10.1186/1471-2164-11-320
Ru, W., Zhang, S., Liu, J., Liu, W., Huang, B., and Chen, H. (2023). Non-coding RNAs and adipogenesis. Int. J. Mol. Sci. 24 (12), 9978. doi:10.3390/ijms24129978
Ruan, X., Li, P., Chen, Y., Shi, Y., Pirooznia, M., Seifuddin, F., et al. (2020). In vivo functional analysis of non-conserved human lncRNAs associated with cardiometabolic traits. Nat. Commun. 11 (1), 45. doi:10.1038/s41467-019-13688-z
Shen, L., Han, J., Wang, H., Meng, Q., Chen, L., Liu, Y., et al. (2019). Cachexia-related long noncoding RNA, CAAlnc1, suppresses adipogenesis by blocking the binding of HuR to adipogenic transcription factor mRNAs. Int. J. Cancer 145 (7), 1809–1821. doi:10.1002/ijc.32236
Squillaro, T., Peluso, G., Galderisi, U., and Di Bernardo, G. (2020). Long non-coding RNAs in regulation of adipogenesis and adipose tissue function. Elife 9, e59053. doi:10.7554/eLife.59053
Sun, L., Goff, L. A., Trapnell, C., Alexander, R., Lo, K. A., Hacisuleyman, E., et al. (2013). Long noncoding RNAs regulate adipogenesis. Proc. Natl. Acad. Sci. 110 (9), 3387–3392. doi:10.1073/pnas.1222643110
Sun, W., Sun, X., Chu, W., Yu, S., Dong, F., and Xu, G. (2019). CircRNA expression profiles in human visceral preadipocytes and adipocytes. Mol. Med. Rep. 21, 815–821. doi:10.3892/mmr.2019.10886
Wang, X., Ramat, A., Simonelig, M., and Liu, M.-F. (2022). Emerging roles and functional mechanisms of PIWI-interacting RNAs. Nat. Rev. Mol. Cell Biol. 24 (2), 123–141. doi:10.1038/s41580-022-00528-0
Wang, Y., Ortega, F. J., Moreno-Navarrete, J. M., Pardo, G., Sabater, M., Hummel, M., et al. (2010). MiRNA expression profile of human subcutaneous adipose and during adipocyte differentiation. PLoS ONE. 5 (2), e9022. doi:10.1371/journal.pone.0009022
Wu, C., Fang, S., Zhang, H., Li, X., Du, Y., Zhang, Y., et al. (2022). Long noncoding RNA XIST regulates brown preadipocytes differentiation and combats high-fat diet induced obesity by targeting C/EBPα. Mol. Med. 28 (1), 6. doi:10.1186/s10020-022-00434-3
Yan, H., and Bu, P. (2021). Non-coding RNA in cancer. Essays Biochem. 65 (4), 625–639. doi:10.1042/EBC20200032
Zhang, M., Li, F., Sun, J.-W., Li, D.-H., Li, W.-T., Jiang, R.-R., et al. (2019a). LncRNA IMFNCR promotes intramuscular adipocyte differentiation by sponging miR-128-3p and miR-27b-3p. Front. Genet. 10, 42. doi:10.3389/fgene.2019.00042
Zhang, T., Zhang, Z., Xia, T., Liu, C., and Sun, C. (2019c). circNrxn2 promoted WAT browning via sponging miR-103 to relieve its inhibition of FGF10 in HFD mice. Mol. Ther. - Nucleic Acids 17, 551–562. doi:10.1016/j.omtn.2019.06.019
Zhang, Z., Zhang, T., Feng, R., Huang, H., Xia, T., and Sun, C. (2019b). circARF3 alleviates mitophagy-mediated inflammation by targeting miR-103/TRAF3 in mouse adipose tissue. Mol. Ther. - Nucleic Acids 14, 192–203. doi:10.1016/j.omtn.2018.11.014
Zhu, E., Zhang, J., Li, Y., Yuan, H., Zhou, J., and Wang, B. (2018). Long noncoding RNA Plnc1 controls adipocyte differentiation by regulating peroxisome proliferator-activated receptor γ. FASEB J. 33 (2), 2396–2408. doi:10.1096/fj.201800739RRR
Zhu, Y., Gui, W., Lin, X., and Li, H. (2020). Knock-down of circular RNA H19 induces human adipose-derived stem cells adipogenic differentiation via a mechanism involving the polypyrimidine tract-binding protein 1. Exp. Cell Res. 387 (2), 111753. doi:10.1016/j.yexcr.2019.111753
Keywords: obesity, RNA sequencing (RNA-seq), noncoding RNA (ncRNA), omental adipose tissue, lncRNA
Citation: Zhang Y, Chen A, Lu S, Liu D, Xuan X, Lei X, Zhong M and Gao F (2025) Noncoding RNA profiling in omentum adipose tissue from obese patients and the identification of novel metabolic biomarkers. Front. Genet. 16:1533637. doi: 10.3389/fgene.2025.1533637
Received: 03 December 2024; Accepted: 15 January 2025;
Published: 06 February 2025.
Edited by:
Yuan Zhou, Peking University, ChinaReviewed by:
Zhiqiang Wang, Guangxi Academy of Medical Sciences, ChinaCopyright © 2025 Zhang, Chen, Lu, Liu, Xuan, Lei, Zhong and Gao. This is an open-access article distributed under the terms of the Creative Commons Attribution License (CC BY). The use, distribution or reproduction in other forums is permitted, provided the original author(s) and the copyright owner(s) are credited and that the original publication in this journal is cited, in accordance with accepted academic practice. No use, distribution or reproduction is permitted which does not comply with these terms.
*Correspondence: Fei Gao, NDQ4NjE3MDAzQHFxLmNvbQ==; Mingwei Zhong, em13Z3pAMTI2LmNvbQ==; Xiaofei Lei, MzU5NTI3ODEyQHFxLmNvbQ==
Disclaimer: All claims expressed in this article are solely those of the authors and do not necessarily represent those of their affiliated organizations, or those of the publisher, the editors and the reviewers. Any product that may be evaluated in this article or claim that may be made by its manufacturer is not guaranteed or endorsed by the publisher.
Research integrity at Frontiers
Learn more about the work of our research integrity team to safeguard the quality of each article we publish.