
95% of researchers rate our articles as excellent or good
Learn more about the work of our research integrity team to safeguard the quality of each article we publish.
Find out more
ORIGINAL RESEARCH article
Front. Genet. , 20 March 2025
Sec. Computational Genomics
Volume 16 - 2025 | https://doi.org/10.3389/fgene.2025.1527300
 Xu Gao1,2
 Mengfan Yan1,2Chengwei Zhang1,2Gang Wu1,2Jiandong Shang1,2Congxiang Zhang1,2
 Kecheng Yang1,2*
Determining drug-target affinity (DTA) is a pivotal step in drug discovery, where in silico methods can significantly improve efficiency and reduce costs. Artificial intelligence (AI), especially deep learning models, can automatically extract high-dimensional features from the biological sequences of drug molecules and target proteins. This technology demonstrates lower complexity in DTA prediction compared to traditional experimental methods, particularly when handling large-scale data. In this study, we introduce a multimodal deep neural network model for DTA prediction, referred to as MDNN-DTA. This model employs Graph Convolutional Networks (GCN) and Convolutional Neural Networks (CNN) to extract features from the drug and protein sequences, respectively. One notable strength of our method is its ability to accurately predict DTA directly from the sequences of the target proteins, obviating the need for protein 3D structures, which are frequently unavailable in drug discovery. To comprehensively extract features from the protein sequence, we leverage an ESM pre-trained model for extracting biochemical features and design a specific Protein Feature Extraction (PFE) block for capturing both global and local features of the protein sequence. Furthermore, a Protein Feature Fusion (PFF) Block is engineered to augment the integration of multi-scale protein features derived from the abovementioned techniques. We then compare MDNN-DTA with other models on the same dataset, conducting a series of ablation experiments to assess the performance and efficacy of each component. The results highlight the advantages and effectiveness of the MDNN-DTA method.
Drug discovery is a long-term and complex process (Xue et al., 2018) that often involves the discovery of just one effective molecule among
The aim of DTA prediction is to anticipate the interaction strength or binding capacity between drugs and target proteins through computational models or algorithms, also known as binding affinity prediction. This endeavor contributes to understanding the mechanism of drug action, refining drug design, and expediting the drug discovery process (Jarada et al., 2020). Binding affinity is closely related to dissociation constant
Early DTA prediction works primarily rely on the drug structures and the sequence information of the target proteins, typically employing calculation methods (Mousavian and Masoudi-Nejad, 2014; Chen et al., 2016) based on physical and chemical principles to predict their interactions. However, these approaches exhibit high computational complexity and struggle with efficient screening and predicting large-scale compound and protein libraries. During the rapid development of machine learning technology, approaches for predicting DTA based on feature engineering have emerged. Traditional machine learning methods, such as Feed-forward Neural Network (FNN), Support Vector Machine (SVM), and Random Forest (RF) (Lenselink et al., 2017; Mayr et al., 2018; Olayan et al., 2018; He et al., 2017; Chu et al., 2021; Ezzat et al., 2017; Pahikkala et al., 2015), extract features from the structures or sequences of drug molecules and target proteins to establish prediction models. Although traditional machine learning methods are capable of handling high-dimensional and complex data, feature engineering is time-consuming, and the prediction results often lack accuracy. These limitations have hindered the widespread adoption of machine learning in the field of DTA prediction.
With the success of deep learning, various deep learning networks have been employed in DTA prediction. DeepDTA (Öztürk et al., 2018) is initially proposed to extract molecular features from drug molecules using convolutional neural networks (CNNs) and construct DTA prediction models using protein sequence data. Additionally, AttentionDTA (Zhao et al., 2019) similarly employs one-dimensional convolution to capture the underlying relationships between the atoms of drug molecules and the amino acid sequences of proteins, achieving more accurate prediction results compared to DeepDTA. Subsequently, Transformer-based models have stood out in various natural language processing (NLP) tasks. For instance, MT-DTI (Shin et al., 2019) utilizes Transformer to encode word embeddings of drug and protein sequences, aiming to learn hidden associations between the two from raw sequence data. In order to better simulate the biological characteristics of drug molecules and target proteins, GraphDTA (Nguyen et al., 2021) represents compounds as topological graphs and evaluates several types of graph neural network (GNN) variants, including graph convolution network (GCN), graph isomorphism network (GIN) and graph attention network (GAT). DGraphDTA (Sun et al., 2010) extends GraphDTA by representing drug molecules and protein sequences as two-dimensional graphs, incorporating a protein structure prediction method called contact maps to enhance protein structure estimation. Another graph neural network approach, MGraphDTA (Yang et al., 2022), applies multiscale techniques to learn features across various scales, from shallow to deep. By aggregating these features, it generates comprehensive multiscale representations for both drug molecules and proteins, which are then rationalized from a chemical perspective. MDCT-DTA (Zhu Z. et al., 2024) introduces a multi-scale graph diffusion convolution module to capture the complex interactions between drug molecule graph nodes, while a CNN-Transformer block is used to capture the interactions and interdependencies between different amino acids. These graph-based methods not only effectively address the issues of limited complex samples and high computational costs but also overcome the limitations of SMILES (Simplified Molecular Input Line Entry System) in drug representation. Furthermore, molecular graph representation is more aligned with the natural structural description of compounds, which is why GNNs are widely adopted in current mainstream methods.
Although all these methods show promising prediction results, they may still face certain challenges. Mainstream biological sequence feature extraction methods include MLP, CNN, LSTM (Chen et al., 2020), each have limitations when applied individually. As illustrated in Figure 1A, relying solely on one of these methods may not be sufficient to fully capture the features of drug molecules and proteins. In particular, both 1D and 2D convolutions typically rely on fixed-size kernels, which limits their ability to effectively extract comprehensive features. While the small kernels can capture local patterns in biological sequences, they overlook global contextual information. 2D convolutions, by stacking layers, can expand the receptive field to capture global information. Nevertheless, longer biological sequences result in significantly higher computational costs. LSTM, with its gating mechanism, effectively manages the transmission and forgetting of information, allowing it to retain local features or short-term dependencies in sequences. While it is possible to modify LSTM to capture longer-range dependencies through design adjustments, its ability to handle long-term dependencies remains limited. In contrast, the fully connected structure of MLP means that all features of the input biological sequence participate in the computation together, allowing for the calculation of global features but neglecting local features. Moreover, there is currently no widely recognized and effective method for converting protein sequences into graph structures that preserves both their global and local patterns. A commonly used graph conversion method represents protein sequences in a graph structure, where nodes denote amino acids and edges represent interactions between them. However, the sequence information of proteins is linear, and the order of amino acids is crucial. GCNs are primarily designed for graph-structured data, focusing on the topological relationships between nodes rather than directly modeling the sequential information of the nodes. As shown in Figure 1B, when converting the amino acids of a protein sequence into nodes of a graph structure, there is a significant difference from the original order of the amino acids. In contrast, drug molecules can naturally be represented using graph structures. Most DTA prediction methods commonly convert their sequences into graph structures using bioinformatics tools (Jiang et al., 2020; Zhang et al., 2022; Zhu et al., 2023b; Wang et al., 2024). This method is inherently tied to the biochemical properties of the molecules. Drug molecules can be perceived as structures comprising atoms and chemical bonds between them. Graph structures adeptly capture this interconnection between atoms and bonds, with nodes symbolizing atoms and edges representing chemical bonds. Given these advantages, we employ this approach in our study to process drug sequences.
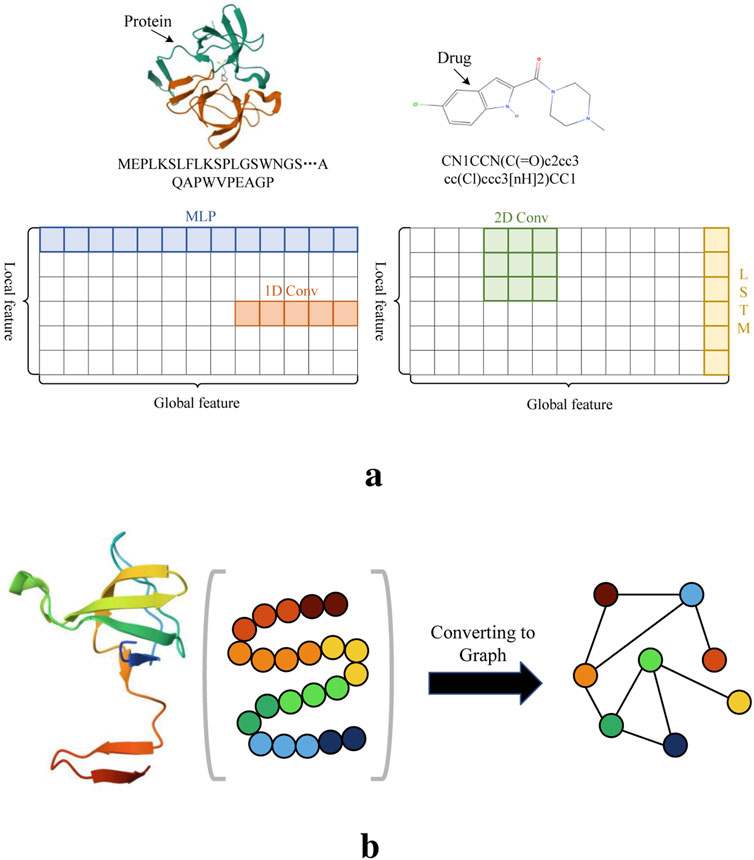
Figure 1. Illustration of several feature extraction methods and amino acid sequences. (A) The receptive fields of several sequence feature extraction methods. (B) The order of amino acids after converting the protein into a graph structure differs from the original structure.
To address the aforementioned issues, we decide to choose CNNs to identify important patterns and substructures in the sequences through convolutional and pooling layers, thereby extracting local features from protein sequences. Utilizing a CNN-based approach as a local feature extractor for proteins aids in preventing potential information loss and unreasonable structural representations that can occur during the conversion of protein sequences into graph formats. Furthermore, we design a global feature extractor that utilizes an MLP, which works in conjunction with the previously mentioned local feature extractor to form a Protein Feature Extraction (PFE) Block, allowing for the acquisition of more comprehensive information from protein sequences.
The main contributions of this study can be summarized as follows:
Our MDNN-DTA model consists of three parts: sequence input, feature extraction, and affinity prediction (Figure 2). The feature extraction process is the focus of our work, encompassing the Drug Feature Extraction Block along with the PFE block and PEE block for processing protein sequences. In MDNN-DTA, drug molecules are represented in SMILES format. The drug branch converts each molecule’s sequence into a graph structure and utilizes a GCN-based Drug Feature Extraction Block to capture its sequence features. Meanwhile, proteins are processed by embedding their amino acid sequences, and the proposed PFE Block extracts both their global and local features. Furthermore, the study integrates a pre-trained protein model, ESM, to augment the feature extraction process of protein sequences. MDNN-DTA enhances protein feature representation by incorporating multi-scale protein features through an attention-based Protein Feature Fusion PFF Block. Lastly, the features of drug molecules and target proteins are merged and fed into multiple fully connected layers for affinity prediction. Detailed descriptions of each component in the model will be provided in the following sections.
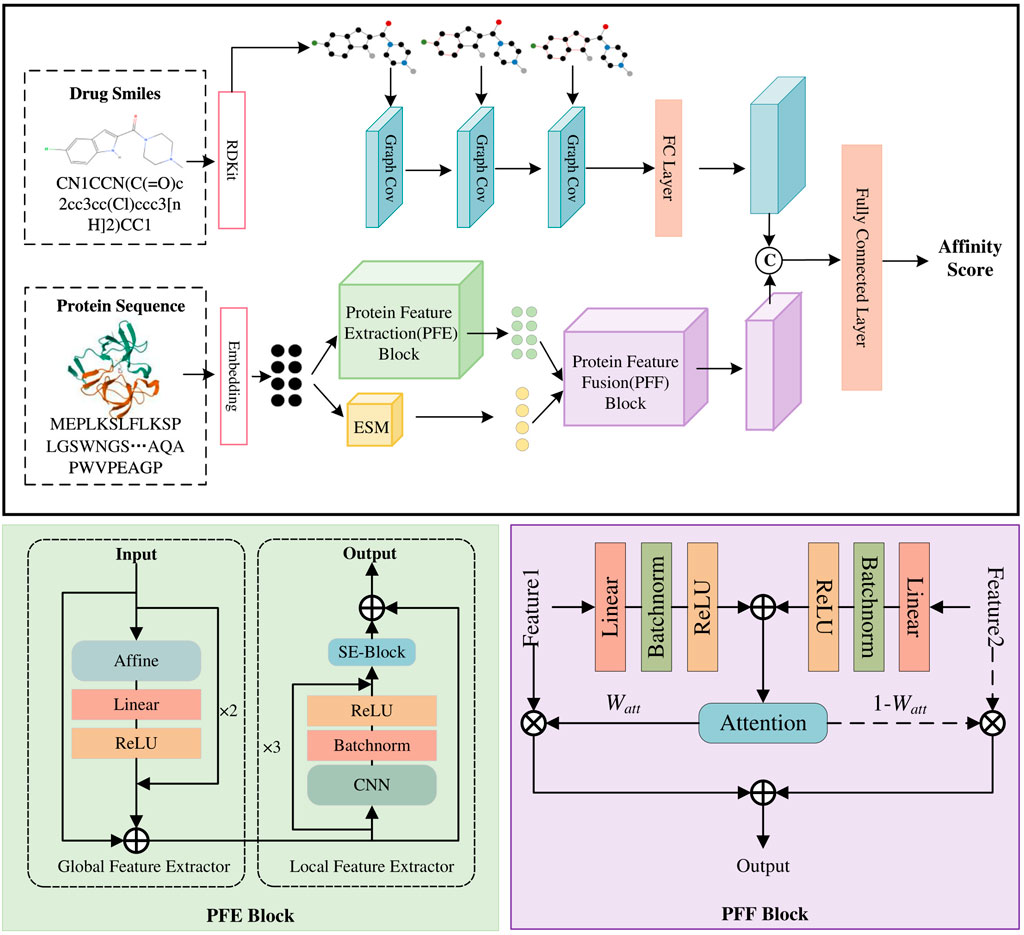
Figure 2. The model architecture of MDNN-DTA. The MDNN-DTA includes a Drug Feature Extraction block as well as a Protein Feature Extraction (PEE) Block and a Protein Feature Fusion (PEF) Block designed by us.
The input drug molecules are in SMILES format, a specification that succinctly describes molecular structures using ASCII strings. We employ TorchDrug (Zhu et al., 2022) and RDKit libraries to extract nodes, edge features, and adjacency matrices from the SMILES of drug molecules. Figure 3 illustrates the methodology employed in this paper to construct the node and edge features of the drug graphs. The node and edge features of drug molecules are represented using one-hot vectors, encompassing nine types of node features and four types of edge features, as detailed in Table 1. These features have been utilized in prior studies (Wu et al., 2021; Wu et al., 2024; Suviriyapaisal and Wichadakul, 2023).
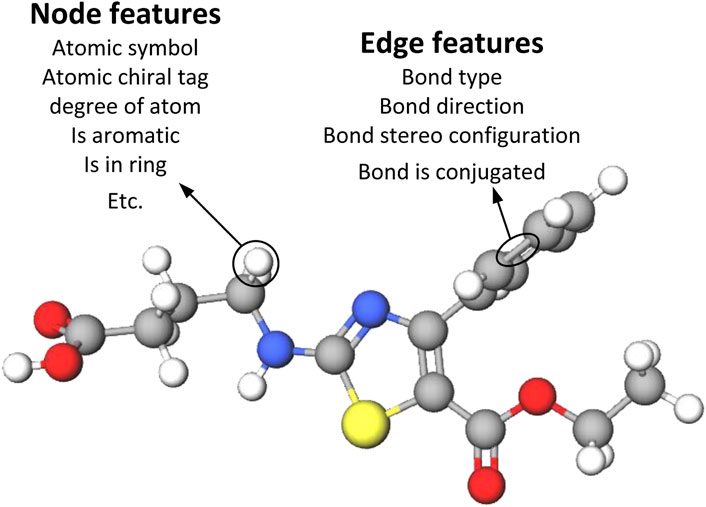
Figure 3. Representation of drugs using node and edge features. Atomic level drug molecular graph with 9 node features and 4 edge features.
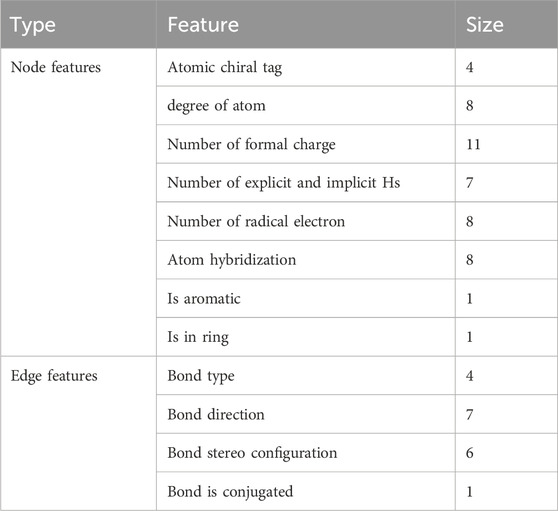
Table 1. Node and edge one-hot features for drug representation.
For protein sequences, we construct an integer dictionary of FASTA sequences in order to map each character to an integer. For example, the MLK3 (Rattanasinchai and Gallo, 2016) protein subsequence “VQIARGM” can be encoded as [22, 17, 9, 1, 18, 7, 13] according to the protein dictionary {“V”:22, “Q”:17, “I”:9, “A”:1, “R”:18, “G”:7, “M”:13}. This encoding method enables the representation of the protein sequence as an integer sequence. To facilitate training, we decide that the maximum length of the protein sequence is fixed at 1,200, so that the maximum length covers at least 80
Since protein structures are much more complex compared to drug molecules, this study leverages a pre-trained model called Evolutionary Scale Modeling (ESM) (Meier et al., 2021) to extract more precise and comprehensive features from protein sequences. ESM is a Transformer-based protein language model that excels in capturing detailed feature representations from sequences, surpassing traditional amino acid feature extraction methods (Suviriyapaisal and Wichadakul, 2023). Details about ESM will be discussed in the subsequent sections.
Drug molecules are non-Euclidean chemical structures composed of entities (atoms) and relationships (bonds), containing rich semantic information and intricate spatial structures. In this paper, we construct a Drug Feature Extraction Block based on GCN. We define the drug molecule graph as
where
In order to enrich the feature representation of nodes and edges in the drug graph, the study incorporates the edge features of drug molecules into the graph message-passing process of GCN with Equation 3.
where the
Sequence features of proteins include global and local features. Its local features refer to some local patterns in the protein sequence, such as structural domains, helical domains, and so on. CNNs can construct textual features by incorporating spatial correlations between the features, thereby effectively capturing these localized features in protein sequences. Therefore, the PFE Block adopts a CNN-based approach to extract features from protein sequences. However, traditional CNN methods are limited by their convolutional kernels and can only extract local features of the sequence, ignoring the global features of the proteins, such as the protein’s folding state and functional domains along the entire chain. To address these limitations, the proposed PFE Block employs two sub-modules: a global feature extractor and a local feature extractor, as shown in Figure 2.
The global feature extractor consists of an affine block, a L-R layer (a linear layer and a ReLU activation layer), and the residual method. Inspired by ResMLP (Touvron et al., 2022), we utilize residual connections to enhance the learning capability of the multi-layer perceptron (MLP) architecture. The global feature extractor aims to extract the global features of the entire protein amino acid sequence through the MLP without disrupting the sequence order, and then pass these features to subsequent operations. The architecture can be expressed as Equation 4, where
As illustrated in Equation 4,
Our local feature extractor combines the advantages of CNN methods to capture local pattern features of proteins through appropriately sized convolutional receptive fields. The application of an SE attention mechanism enables this extractor to focus on the importance of various channels, thereby generating feature vectors that are more aligned with the natural amino acid sequence. The local feature extractor consists of three CNN Blocks and a SE-Block (Hu et al., 2018), and its extraction process is represented as Equation 6.
where
where the squeeze operation is the compression of a
The flow of the SE-Block is illustrated in Figure 4. Here,
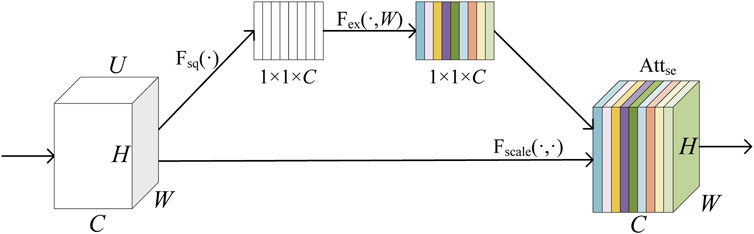
Figure 4. Schematic diagram of SE-Block.
Specifically, the local feature extractor utilizes a convolutional layer to capture the local patterns of the protein sequence and then adjusts the channel weights adaptively through the SE attention mechanism, which enhances the importance of the local features. Additionally, to ensure the integrity of the features, the local feature extractor also uses the residual method to add the global information of the protein sequence directly to the local features.
Although protein features can be extracted independently based on the nature of each amino acid, such as residue signatures, aliphatic group, and polarity, the function of a protein changes when amino acids are linked together to form a complex structure. Hence, the study employs a pre-trained model known as ESM (Meier et al., 2021; Lin et al., 2023), which is a deep neural network model specialized for processing protein sequences. Biologically, the protein sequence of an organism is not a random arrangement of amino acids. Instead, it is shaped and constrained by the principles of natural selection. Compared with the amino acid embedding approach, the ESM protein language model incorporates biological knowledge such as chemical properties, structural domains, and conserved sites of amino acids. This enhancement improves the model’s capacity to comprehend and represent protein sequences.
Specifically, the ESM-1v utilized in this paper is a generalized protein language model trained on the UR90 dataset (Medrano and Urton, 2018) with 250 million protein sequences. This dataset comprises 98 million distinct protein sequences, with each residue containing 1,280 dimensions of embedded features. However, ESM has a limitation on sequence length because it is trained with a fixed context size of 1,024 tokens for positional embedding. Therefore, for protein sequences longer than 1,024 amino acids, a random sampling method will be employed to truncate the protein sequence length to 1,024 tokens per training batch in order to obtain sample sequences. We refer to the features extracted by the ESM-1v pre-trained model as complementary features of the protein sequence.
From the previous two sections, we can see that our model captures two parts of the protein sequence features: the sequence features extracted by the PFE Block, which include both global and local features, and the biological characteristics supplemented by the ESM pre-trained model. To integrate these two parts of the features into a more complete protein representation and enhance the representational power of the model, we construct a PFF block based on attention, as demonstrated in Figure 2. The specific representation can be formulated as Equations 9, 10.
where
where

Figure 5. Schematic diagram of Attention Block.
This attention-based PFF Block provides a method for effectively integrating the two parts of the protein sequence features, thereby enabling better interaction between protein features and drug features and improving the accuracy of the affinity prediction model.
After the drug and target protein sequences undergo their respective feature extraction processes, their features need to be fused to predict affinity. In MDNN-DTA, we concatenate the drug and protein features before inputting them into multiple fully connected layers to obtain the affinity score. The model utilizes three fully connected layers with 1,024, 512, and 128 neurons, respectively. Each linear layer is connected by batch normalization layers and ReLU activation functions. Meanwhile, the model training process employs the Mean Square Error (MSE) as the loss function, calculated as the sum of squares of the difference between the predicted value
In this study, two widely recognized and publicly available datasets, Davis (Davis et al., 2011; Zhu et al., 2023a), KIBA (Öztürk et al., 2018; Tang et al., 2014) and BindingDB (Gilson et al., 2016), are utilized to carry out model performance evaluation experiments. The specific information of the datasets is presented in Table 2.
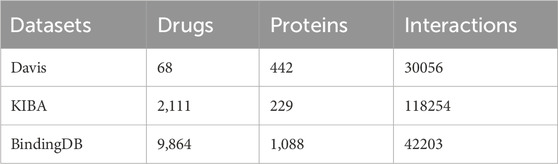
Table 2. Statistics of the two datasets.
The Davis dataset comprises 442 kinase proteins, 68 inhibitors, and 30,056 drug-target interactions with binding affinities obtained by measuring
The KIBA dataset also comprises kinase inhibitor interactions, but the difference between the two datasets lies in its construction from various sources of biological activity. The metrics of the KIBA dataset include inhibition constants
To ensure the fairness of the experiment and the reliability of the evaluation, the study uses a five-fold cross-validation (Shar et al., 2016) approach for model comparison and selection. In each fold, all methods share the same training, validation, and test sets. The entire dataset is randomly divided into five parts, with four parts used for five-fold cross-validation and the remaining part serving as an independent test dataset. Subsequently, a candidate model is selected to evaluate its performance on an independent test set after the training is completed. Firstly, the experiment selects the candidate model with the best average results from the validation set results for each fold. Secondly, the candidate models are evaluated using the weights of each fold for predicting the independent test set. Finally, the final results are calculated by averaging the test results obtained for each fold.
In this paper, we use MSE, Consistency Index (CI) and the Pearson correlation coefficient as the main metrics for DTA prediction task. The MSE, as shown in Equation 12, is a commonly used metric to quantify the difference between the predicted and true values. A smaller MSE indicates that the predicted values of the model are closer to the true values, reflecting better model performance. The CI value evaluates the predictive capability of the model and is defined as the proportion of labeled pairs for which the predicted result aligns with the actual result. A larger value of CI indicates a stronger predictive ability of the model. The formula for CI is defined as shown in Equation 14, where
The Pearson correlation coefficient, as described in Equation 16, where
All experiments in this study are conducted on an Nvidia RTX 4090 machine. MDNN-DTA is implemented using Python 3.8.18 and PyTorch 1.13.1 and trained using the AdamW optimizer (Loshchilov, 2017). The learning rate is initially set to 0.001 and decays by 80
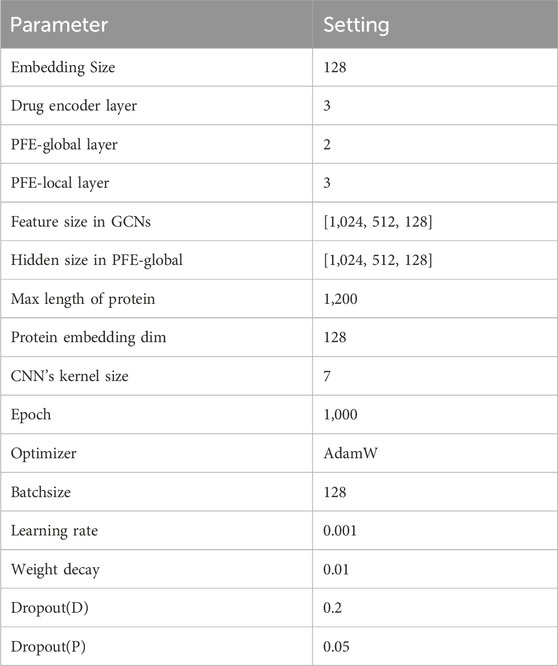
Table 3. Parameterization of our model.
To assess the superiority of MDNN-DTA, we compared it with some state-of-the-art models, DeepDTA (Öztürk et al., 2018), WideDTA (Öztürk et al., 2019), MT-DTI (Shin et al., 2019), GraphDTA (Nguyen et al., 2021), etc. These models utilize various approaches, such as single networks of CNN, Transformer, GNN, GCN, or a combination of different networks. The evaluation metrics include MSE, CI, and Pearson correlation coefficient. To ensure a fair comparison, we used the same benchmark datasets of Davis, KIBA and BindingDB as well as the same performance metrics for evaluation. The results of our experiments are shown in Table 4, where the parameters are calculated from the model architecture.
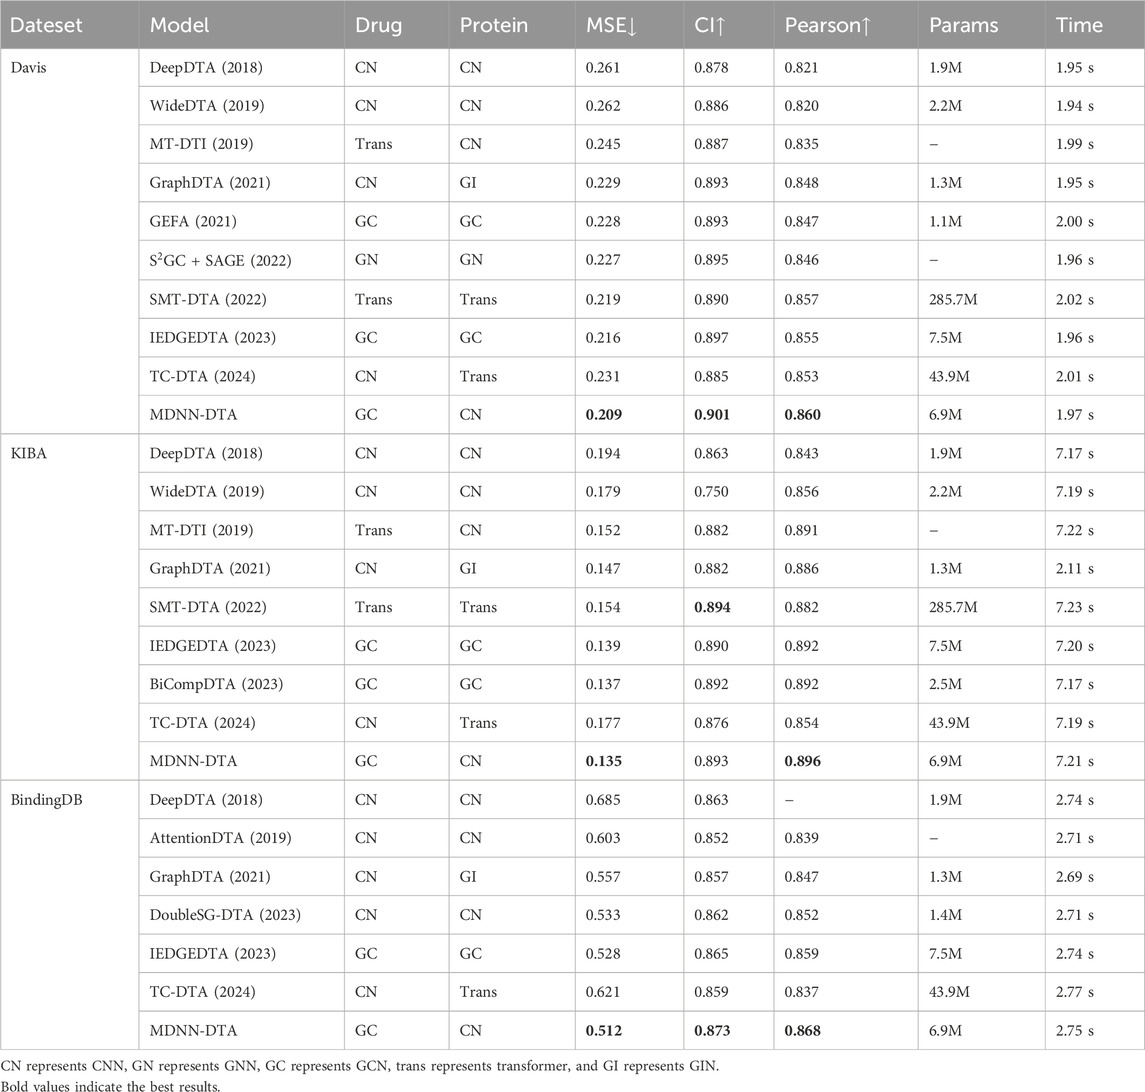
Table 4. Model performance on the Davis, KIBA and BindingDB datasets.
Table 4 demonstrates that MDNN-DTA achieves the best results on all benchmark datasets. On the Davis dataset, compared to the IEDGEDTA model, which uses GCN methods to extract features from drug and protein sequences, MDNN-DTA shows an improvement of 3.2
Similarly, on the KIBA dataset, MDNN-DTA also achieves optimal results. The proposed model reduces the MSE by 1.2
Considering the BindingDB dataset, the MDNN-DTA model reaches an MSE of 0.512, which is 15.1
Additionally, Table 4 shows the inference time per batch during the model training process. We compare the models using the same batch size on the same dataset. Overall, models using the Transformer architecture have slightly higher inference times per batch compared to those using GCN and CNN methods. The inference time per batch is positively correlated with the number of interactions in the dataset. That is, when there are more interaction relationships in the dataset, the inference time increases accordingly. This result indicates that while the Transformer architecture performs better on complex relationships, it also comes with higher computational overhead.
All the experimental results emphasize the significance of choosing suitable feature extraction methods tailored to drug molecules and target proteins. The linear sequential nature of protein sequences significantly contributes to improving the accuracy of the model’s predictions.
For the ablation experiments, we first analyze the effectiveness of both the PFE Block and the PFF Block in MDNN-DTA. Subsequently, we conducted ablation analysis on each component of the PFE Block to enhance our understanding of the protein feature extractor. Lastly, we explore the importance of ESM pre-training models in feature extraction and perform related ablation and comparison experiments. Lastly, concerning the Drug Feature Extraction Block, we also explore the influence of the depth of GCN on the prediction accuracy of DTA by stacking varying numbers of GCN layers.
The difference between the ablation experiments performed in this section lies in the non-identical feature extraction methods. Our baseline approach is to use the Drug Feature Extraction Block for drug molecules and the same CNN Block for protein sequences as in the PFE Block. The CNN Block contains a 1D convolutional layer, a batch normalization layer, and a ReLU layer. In the protein feature fusion stage, the final protein feature vector is obtained simply through direct concatenation. Model-1 utilizes the PFE Block to derive protein features but replaces the original PFF Block with a direct concatenation of the protein’s multi-scale features. Conversely, Model-2 extracts protein sequence features exclusively through the CNN Block and applies the PFF Block to integrate the multi-scale features. The results are shown in Table 5.
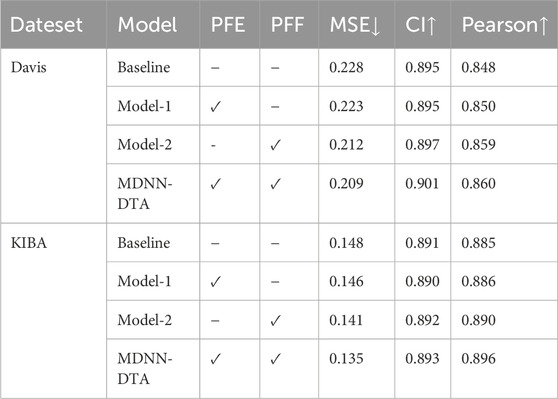
Table 5. Ablation experiments to test the performance of PFF and PFE Blocks.
Table 5 shows that our PFE Block (Model-1) improves the performance of the baseline method. The reason is that the proposed module extracts more comprehensive features (both local and global) of the protein, which is essential for accurate and reliable DTA prediction. The experimental results of Model-2 demonstrate that our PFF Block significantly outperforms the simple concatenation approach. This is because we introduced an attention-based weighting parameter, which dynamically adjusts the importance of different features, allowing for a more flexible and comprehensive integration of multi-scale protein features. As a result, the feature fusion module can better integrate the multi-scale features of proteins. It is evident that the independent use of the PFE and PFF blocks yields results not better than those obtained by their combined use. Although both the PFE and PFF blocks provide certain advantages over the baseline model, the results from Model-1 indicate that focusing solely on multi-scale feature extraction without considering the effectiveness of fusion does not lead to high prediction accuracy. Similarly, the results from Model-2 indicate that merely considering the weighted fusion of multi-scale features without emphasizing the completeness of feature extraction also fails to yield optimal results for the model. By combining these two blocks, we find that MDNN-DTA achieves the best performance in the experiments. Compared to the baseline method, the MSE decreases by 8.3
The PFE Block contains three components: the Affine Block, the L-R Layer, and the SE-Block. The Affine Block and the L-R Layer are responsible for global feature extraction, while the SE-Block is the attention strategy in the local feature extractor. To understand the role of these components on the performance of the affinity prediction of the model, we conduct detailed ablation experiments on each component in Table 6: 1. Using three convolutional blocks instead of all three components for feature extraction (Model-1); 2. Adding only the SE-Block to Model 1 (Model-2); 3. Adding the Affine block to Model 2 (Model-3).
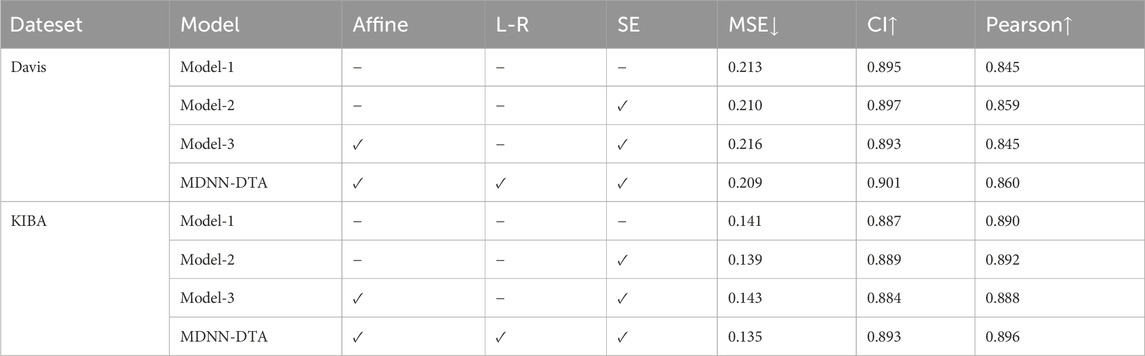
Table 6. Comparison of the effects of the components in the PFE Block.
Comparing the results of Model-1 with Model-2, we can see that the presence of the SE Block improves the result in all three metrics. This is because the SE attention mechanism enhances the representation of features by learning the significance of each channel. It amplifies channels rich in information while suppressing those with less, leading to a more accurate characterization of features. Taking into account the results of Model-2 and Model-3, simply adding the Affine block to the Model-2 configuration does not improve the accuracy of the prediction. Instead, it leads to an increase of 2.7
To validate the effectiveness of the ESM pre-trained model in protein feature extraction, this study design an ablation experiment comparing the model’s prediction performance with and without the ESM-1v pre-trained model. Additionally, we compare ESM-1v with another pre-trained model, ProtT5, to evaluate their differences in prediction accuracy. All experiments are conducted on the Davis dataset, and the results are shown in Table 7. The experimental results show that the ESM-1v pre-trained model significantly improves protein feature extraction. Compared to ProtT5 and the model without pre-training, it better captures the sequence features of proteins and enhances the model’s prediction accuracy. The MSE decreases by 0.04, while the CI value increases by 0.06. ProtT5, as another pre-trained model, performs better than the model without pre-training but still falls short compared to ESM-1v. This may be due to the larger training dataset and more optimized parameters of ESM-1v. The prediction performance of MDNN-DTA without a pre-trained model deteriorates, with the MSE increasing by 0.07 and the CI decreasing by 0.04. This indicates that directly extracting features based on protein sequences may not be sufficient to capture the complex information within the sequences, while the biochemical information in pre-trained models meets the model’s needs and provides more accurate predictions.

Table 7. Impact of pre-trained models on prediction results.
In MDNN-DTA, we design a PFF block based on the self-attention mechanism to perform weighted fusion of multi-scale features from proteins. To better understand the relationship between different features, we not only visualize the attention weights of the self-attention mechanism but also compare the results with those from the unweighted fusion approach in Table 7. The results show that, without weighted fusion, the model’s prediction accuracy decreases, with the MSE increasing by 0.02 compared to the baseline. Figure 6 illustrates the attention weights (

Figure 6. Attention visualization of PFF Block. The blue areas represent higher weights, while the yellow areas represent lower weights.
The model parameter size is an important part of deep learning model analysis. While a larger parameter size may improve the model’s accuracy, it also increases training time. To better analyze the effects of parameter size across different models, we design the following models for comparison testing. Baseline-1: The drug sequence uses GCN, while the protein sequence uses CNN for feature extraction. Baseline-2: On top of Baseline-1, the protein branch’s CNN is replaced with Transformer. Model-1: The MDNN-DTA model, using the original architecture. Model-2: The parameter size of the MDNN-DTA original architecture is simplified to that of Baseline-1. Model-3: The parameter size of the MDNN-DTA original architecture is simplified to that of Baseline-2. Model-4: The parameter size of Baseline-2 is expanded to match that of Model-1. The experimental results are shown in Table 8. Baseline-1 and Baseline-2 provide basic comparison benchmarks. While Baseline-1 is faster in training speed, Baseline-2 performs slightly better in MSE and CI, indicating that the Transformer feature extractor is more effective than the traditional CNN method in processing protein sequences. Model-1 provides the best performance (lowest MSE and highest CI), but its total parameter size is significantly higher, and the inference time is also longer, indicating that the complexity of the architecture indeed improves the model’s performance but also increases the computational cost. By simplifying the parameter size of the MDNN-DTA model, Model-2 and Model-3 reduce the computational load while still maintaining high performance. Compared to the baseline-1/2 methods, Model-4 exhibits lower MSE and higher CI results. However, both computation time and MSE increase compared to Model-1 (MDNN). These results suggest that while increasing the parameter size may partially enhance the model’s learning capacity, a well-designed architecture and effective feature extraction methods are also essential for improving performance.
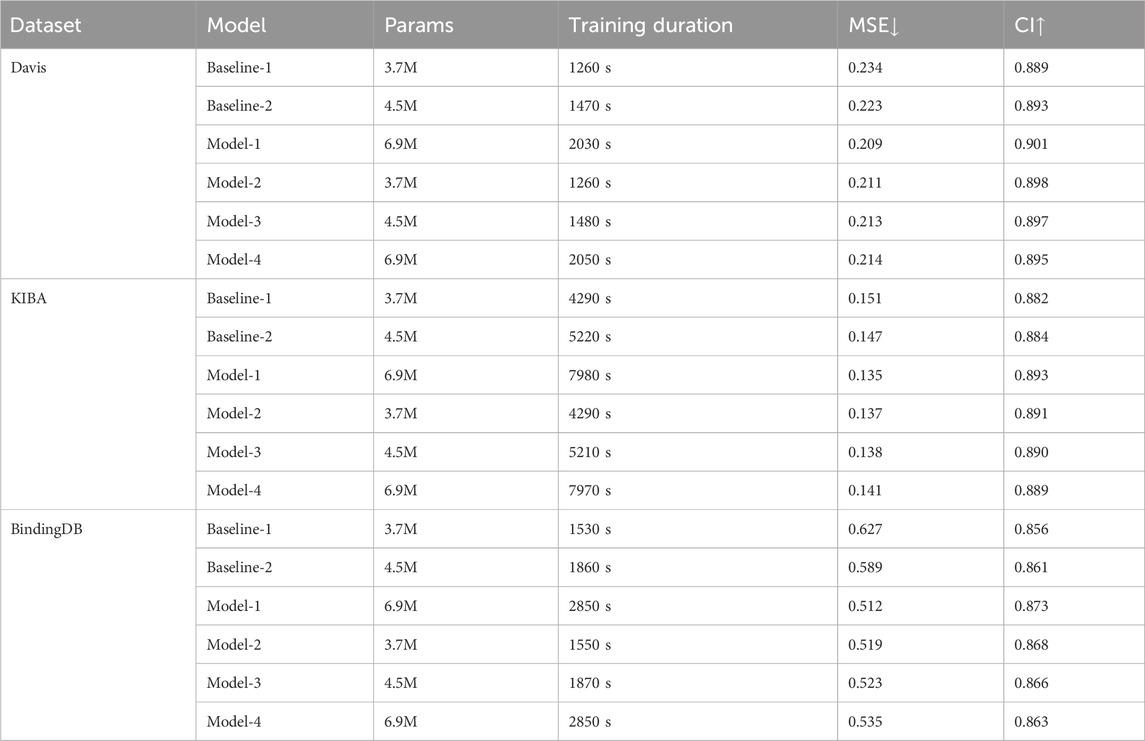
Table 8. Results of the number of parameters and training time for different models on the different datasets.
The precision of drug feature extraction depends on the graph computational capability of the GCN. To evaluate the effect of GCN depth on prediction performance, ablation experiments were conducted, too. Figure 7 demonstrates that a continuous improvement is observed as the number of layers increases to three: the MSE decreases, while both the CI and the Pearson correlation coefficient increase. Conversely, further increasing the number of GCN layers beyond three layers leads to a deterioration in experimental outcomes, yielding results that are inferior to those obtained with a single GCN layer. This trend arises from the fact that each GCN layer primarily processes first-order neighborhood information through spectral graph convolution. While stacking multiple convolutions enables the propagation of higher-order neighborhood information, an excessive number of GCN layers can cause a gradual convergence of node feature vectors within clusters, leading to homogeneity—a phenomenon known as “oversmoothing”. This oversmoothing can negatively impact the model’s decision-making capabilities. Therefore, optimizing the depth of the GCN enhances the efficiency of drug feature extraction, ultimately improving the predictive accuracy of the Multimodal Neural Network for Drug-Target Affinity (MDNN-DTA).

Figure 7. Effect of convolution kernel size on the training process. The horizontal axis represents the training batch, and the vertical axis represents the Loss during the training process. (A) MSE results on Davis datasets. (B) CI results on Davis datasets. (C) Pearson results on Davis datasets. (D) MSE results on KIBA datasets. (E) CI results on KIBA datasets. (F) Pearson results on KIBA datasets.
Accurate DTA prediction can significantly accelerate the process of identifying promising drug candidates in the drug discovery campaign. In this work, we proposed a multimodal deep neural network model for DTA prediction, using different feature extraction blocks to extract effective features from the sequences of drug molecules and target proteins directly. A uniquely designed PFE Block can concurrently capture both global and local features within the protein, while an attention-based PFF Block can integrating multi-scale features of proteins effectively. The superiority of our MDNN-DTA model was demonstrated by comparing with a series of other models. Additionally, ablation experiments gained deeper understanding of the design principles and feasibility of the model components. Altogether, our model shows promising utilization in DTA prediction and provide inspiration to construct new DTA prediction models. Although MDNN-DTA is dedicated to extracting features from the 1D biological sequences of drugs and proteins and has achieved promising results, the contribution of the 3D structure of proteins to affinity prediction cannot be overlooked. We will continue to explore how to integrate the biological 3D structure with the 1D sequences to achieve more accurate affinity prediction results.
The data presented in the study are deposited in the https://github.com/nuyoaHymf/MDNN-DTA.
XG: Conceptualization, Funding acquisition, Project administration, Supervision, Writing–original draft, Writing–review and editing. MY: Conceptualization, Data curation, Software, Visualization, Writing–original draft, Writing–review and editing. ChZ: Data curation, Investigation, Writing–review and editing. GW: Investigation, Writing–review and editing. JS: Writing–review and editing. CoZ: Data curation, Investigation, Writing–review and editing. KY: Data curation, Funding acquisition, Investigation, Writing–review and editing.
The author(s) declare that financial support was received for the research, authorship, and/or publication of this article. This research was funded by the Key R&D Program of Henan Province (Grant NO: 241111114200) and GHfund (Grant No. 202407016681).
We sincerely thank the National Supercomputing Zhengzhou Center for their support of this manuscript. We also extend our gratitude to our peers for their valuable inspiration and practical assistance in the preparation of this work.
The authors declare that the research was conducted in the absence of any commercial or financial relationships that could be construed as a potential conflict of interest.
The authors declare that no Generative AI was used in the creation of this manuscript.
All claims expressed in this article are solely those of the authors and do not necessarily represent those of their affiliated organizations, or those of the publisher, the editors and the reviewers. Any product that may be evaluated in this article, or claim that may be made by its manufacturer, is not guaranteed or endorsed by the publisher.
The Supplementary Material for this article can be found online at: https://www.frontiersin.org/articles/10.3389/fgene.2025.1527300/full#supplementary-material
Bano, I., Butt, U. D., and Mohsan, S. A. H. (2023). “New challenges in drug discovery,” in Novel Platforms for Drug Delivery Applications. Editors S. Das, S. Thomas, and P. P. Das (Cambridge: Elsevier), 619–643.
Cer, R. Z., Mudunuri, U., Stephens, R., and Lebeda, F. J. (2009). Ic 50-to-k i: a web-based tool for converting ic 50 to k i values for inhibitors of enzyme activity and ligand binding. Nucleic acids Res. 37, W441–W445. doi:10.1093/nar/gkp253
Chen, L., Tan, X., Wang, D., Zhong, F., Liu, X., Yang, T., et al. (2020). Transformercpi: improving compound–protein interaction prediction by sequence-based deep learning with self-attention mechanism and label reversal experiments. Bioinformatics 36, 4406–4414. doi:10.1093/bioinformatics/btaa524
Chen, X., Yan, C. C., Zhang, X., Zhang, X., Dai, F., Yin, J., et al. (2016). Drug–target interaction prediction: databases, web servers and computational models. Briefings Bioinforma. 17, 696–712. doi:10.1093/bib/bbv066
Chu, Y., Kaushik, A. C., Wang, X., Wang, W., Zhang, Y., Shan, X., et al. (2021). Dti-cdf: a cascade deep forest model towards the prediction of drug-target interactions based on hybrid features. Briefings Bioinforma. 22, 451–462. doi:10.1093/bib/bbz152
[Dataset] Lenselink, E., Ten Dijke, N., Bongers, B., Papadatos, G., van Vlijmen, H., Kowalczyk, W., et al. (2017). Beyond the hype: deep neural networks outperform established methods using a chembl bioactivity benchmark set. J. Cheminform. 9, 45. doi:10.1186/s13321-017-0232-0
[Dataset] Thafar, M., Raies, A., Albaradei, S., Essack, M., and Bajic, V. (2019). Comparison study of computational prediction tools for drug-target binding affinities. Front. Chem. 7, 782. doi:10.3389/fchem.2019.00782
Davis, M. I., Hunt, J. P., Herrgard, S., Ciceri, P., Wodicka, L. M., Pallares, G., et al. (2011). Comprehensive analysis of kinase inhibitor selectivity. Nat. Biotechnol. 29, 1046–1051. doi:10.1038/nbt.1990
Ezzat, A., Wu, M., Li, X.-L., and Kwoh, C.-K. (2017). Drug-target interaction prediction using ensemble learning and dimensionality reduction. Methods 129, 81–88. doi:10.1016/j.ymeth.2017.05.016
Gilson, M. K., Liu, T., Baitaluk, M., Nicola, G., Hwang, L., and Chong, J. (2016). Bindingdb in 2015: a public database for medicinal chemistry, computational chemistry and systems pharmacology. Nucleic acids Res. 44, D1045–D1053. doi:10.1093/nar/gkv1072
He, T., Heidemeyer, M., Ban, F., Cherkasov, A., and Ester, M. (2017). Simboost: a read-across approach for predicting drug–target binding affinities using gradient boosting machines. J. cheminformatics 9, 24–14. doi:10.1186/s13321-017-0209-z
Hu, J., Shen, L., and Sun, G. (2018). “Squeeze-and-excitation networks,” in Proceedings of the IEEE conference on computer vision and pattern recognition. Editors G. S. Jie Hu, and Li Shen (IEEE), 7132–7141.
Hua, Y., Song, X., Feng, Z., and Wu, X. (2023). Mfr-dta: a multi-functional and robust model for predicting drug–target binding affinity and region. Bioinformatics 39, btad056. doi:10.1093/bioinformatics/btad056
Jarada, T. N., Rokne, J. G., and Alhajj, R. (2020). A review of computational drug repositioning: strategies, approaches, opportunities, challenges, and directions. J. cheminformatics 12, 46–23. doi:10.1186/s13321-020-00450-7
Jiang, M., Li, Z., Zhang, S., Wang, S., Wang, X., Yuan, Q., et al. (2020). Drug-target affinity prediction using graph neural network and contact maps. RSC Adv. 10, 20701–20712. doi:10.1039/D0RA02297G
Kim, S. (2021). Exploring chemical information in pubchem. Curr. Protoc. 1, e217. doi:10.1002/cpz1.217
Lin, Z., Akin, H., Rao, R., Hie, B., Zhu, Z., Lu, W., et al. (2023). Evolutionary-scale prediction of atomic-level protein structure with a language model. Science 379, 1123–1130. doi:10.1126/science.ade2574
Loshchilov, I. (2017). Decoupled weight decay regularization. arXiv preprint arXiv:1711.05101. doi:10.48550/arXiv.1711.05101
Mayr, A., Klambauer, G., Unterthiner, T., Steijaert, M., Wegner, J. K., Ceulemans, H., et al. (2018). Large-scale comparison of machine learning methods for drug target prediction on chembl. Chem. Sci. 9, 5441–5451. doi:10.1039/C8SC00148K
Medrano, M., and Urton, G. (2018). Toward the decipherment of a set of mid-colonial khipus from the santa valley, coastal Peru. Ethnohistory 65, 1–23. doi:10.1215/00141801-4260638
Meier, J., Rao, R., Verkuil, R., Liu, J., Sercu, T., and Rives, A. (2021). Language models enable zero-shot prediction of the effects of mutations on protein function. Adv. neural Inf. Process. Syst. 34, 29287–29303. doi:10.1101/2021.07.09.450648
Mousavian, Z., and Masoudi-Nejad, A. (2014). Drug–target interaction prediction via chemogenomic space: learning-based methods. Expert Opin. drug metabolism and Toxicol. 10, 1273–1287. doi:10.1517/17425255.2014.950222
Nguyen, T., Le, H., Quinn, T. P., Nguyen, T., Le, T. D., and Venkatesh, S. (2021). Graphdta: predicting drug–target binding affinity with graph neural networks. Bioinformatics 37, 1140–1147. doi:10.1093/bioinformatics/btaa921
Olayan, R. S., Ashoor, H., and Bajic, V. B. (2018). Ddr: efficient computational method to predict drug–target interactions using graph mining and machine learning approaches. Bioinformatics 34, 1164–1173. doi:10.1093/bioinformatics/btx731
Öztürk, H., Özgür, A., and Ozkirimli, E. (2018). Deepdta: deep drug–target binding affinity prediction. Bioinformatics 34, i821–i829. doi:10.1093/bioinformatics/bty593
Öztürk, H., Ozkirimli, E., and Özgür, A. (2019). Widedta: prediction of drug-target binding affinity. arXiv preprint arXiv:1902.04166. doi:10.48550/arXiv.1902.04166
Pahikkala, T., Airola, A., Pietilä, S., Shakyawar, S., Szwajda, A., Tang, J., et al. (2015). Toward more realistic drug-target interaction predictions. Briefings Bioinforma. 16, 325–337. doi:10.1093/bib/bbu010
Pang, S., Zhang, K., Wang, S., Zhang, Y., He, S., Wu, W., et al. (2021). “Hgdd: a drug-disease high-order association information extraction method for drug repurposing via hypergraph,” in International Symposium on Bioinformatics Research and Applications. Editors Y. Wei, M. Li, P. Skums, and Z. Cai (Springer), 424–435.
Qian, Y., Ni, W., Xianyu, X., Tao, L., and Wang, Q. (2023). DoubleSG-DTA: deep learning for drug discovery: case study on the non-small cell lung cancer with EGFRT mutation. Pharmaceutics 15, 675. doi:10.3390/pharmaceutics15020675
Rattanasinchai, C., and Gallo, K. A. (2016). Mlk3 signaling in cancer invasion. Cancers 8, 51. doi:10.3390/cancers8050051
Shar, P. A., Tao, W., Gao, S., Huang, C., Li, B., Zhang, W., et al. (2016). Pred-binding: large-scale protein-ligand binding affinity prediction. J. enzyme inhibition Med. Chem. 31, 1443–1450. doi:10.3109/14756366.2016.1144594
Shin, B., Park, S., Kang, K., and Ho, J. (2019). Self-attention based molecule representation for predicting drug-target interaction. arXiv preprint arXiv:1908.06760 106, 230–248. doi:10.48550/arXiv.1908.06760
Shukla, R., and Tripathi, T. (2021). Molecular dynamics simulation in drug discovery: opportunities and challenges. in Innovations and Implementations of Computer Aided Drug Discovery Strategies in Rational Drug Design, 295–316. doi:10.1007/978-981-15-8936-2_12
Sun, F., Sun, J., and Zhao, Q. (2022). A deep learning method for predicting metabolite–disease associations via graph neural network. Briefings Bioinforma. 23, bbac266. doi:10.1093/bib/bbac266
Sun, L.-D., Cheng, H., Wang, Z.-X., Zhang, A.-P., Wang, P.-G., Xu, J.-H., et al. (2010). Association analyses identify six new psoriasis susceptibility loci in the Chinese population. Nat. Genet. 42, 1005–1009. doi:10.1038/ng.690
Suviriyapaisal, N., and Wichadakul, D. (2023). iedgedta: integrated edge information and 1d graph convolutional neural networks for binding affinity prediction. RSC Adv. 13, 25218–25228. doi:10.1039/D3RA03796G
Tang, J., Szwajda, A., Shakyawar, S., Xu, T., Hintsanen, P., Wennerberg, K., et al. (2014). Making sense of large-scale kinase inhibitor bioactivity data sets: a comparative and integrative analysis. J. Chem. Inf. Model. 54, 735–743. doi:10.1021/ci400709d
Touvron, H., Bojanowski, P., Caron, M., Cord, M., El-Nouby, A., Grave, E., et al. (2022). Resmlp: feedforward networks for image classification with data-efficient training. IEEE Trans. Pattern Analysis Mach. Intell. 45, 5314–5321. doi:10.1109/TPAMI.2022.3206148
Wang, J., Zhang, L., Sun, J., Yang, X., Wu, W., Chen, W., et al. (2024). Predicting drug-induced liver injury using graph attention mechanism and molecular fingerprints. Methods 221, 18–26. doi:10.1016/j.ymeth.2023.11.014
Wu, H., Liu, J., Jiang, T., Zou, Q., Qi, S., Cui, Z., et al. (2024). Attentionmgt-dta: a multi-modal drug-target affinity prediction using graph transformer and attention mechanism. Neural Netw. 169, 623–636. doi:10.1016/j.neunet.2023.11.018
Wu, J., He, X., Wang, X., Wang, Q., Chen, W., Lian, J., et al. (2022). Graph convolution machine for context-aware recommender system. Front. Comput. Sci. 16, 166614. doi:10.1007/s11704-021-0261-8
Wu, Z., Jiang, D., Wang, J., Hsieh, C.-Y., Cao, D., and Hou, T. (2021). Mining toxicity information from large amounts of toxicity data. J. Med. Chem. 64, 6924–6936. doi:10.1021/acs.jmedchem.1c00421
Xue, H., Li, J., Xie, H., and Wang, Y. (2018). Review of drug repositioning approaches and resources. Int. J. Biol. Sci. 14, 1232–1244. doi:10.7150/ijbs.24612
Yang, Z., Zhong, W., Zhao, L., and Chen, C. Y.-C. (2022). Mgraphdta: deep multiscale graph neural network for explainable drug-target binding affinity prediction. Chem. Sci. 13, 816–833. doi:10.1039/D1SC05180F
Zhang, Z., Chen, L., Zhong, F., Wang, D., Jiang, J., Zhang, S., et al. (2022). Graph neural network approaches for drug-target interactions. Curr. Opin. Struct. Biol. 73, 102327. doi:10.1016/j.sbi.2021.102327
Zhao, Q., Xiao, F., Yang, M., Li, Y., and Wang, J. (2019). “Attentiondta: prediction of drug–target binding affinity using attention model,” in 2019 IEEE international conference on bioinformatics and biomedicine (BIBM) (IEEE), 64–69.
Zhou, W., Wang, Y., Lu, A., and Zhang, G. (2016). Systems pharmacology in small molecular drug discovery. Int. J. Mol. Sci. 17, 246. doi:10.3390/ijms17020246
Zhu, F., Niu, Q., Li, X., Zhao, Q., Su, H., and Shuai, J. (2024a). Fm-fcn: a neural network with filtering modules for accurate vital signs extraction. Research 7, 0361. doi:10.34133/research.0361
Zhu, Z., Shi, C., Zhang, Z., Liu, S., Xu, M., Yuan, X., et al. (2022). Torchdrug: a powerful and flexible machine learning platform for drug discovery. arXiv preprint arXiv:2202.08320. doi:10.48550/arXiv.2202.08320
Zhu, Z., Yao, Z., Qi, G., Mazur, N., Yang, P., and Cong, B. (2023a). Associative learning mechanism for drug-target interaction prediction. CAAI Trans. Intell. Technol. 8, 1558–1577. doi:10.1049/cit2.12194
Zhu, Z., Yao, Z., Zheng, X., Qi, G., Li, Y., Mazur, N., et al. (2023b). Drug–target affinity prediction method based on multi-scale information interaction and graph optimization. Comput. Biol. Med. 167, 107621. doi:10.1016/j.compbiomed.2023.107621
Keywords: drug-target affinity prediction, multimodal network, attention mechanism, deep learning, feature extraction
Citation: Gao X, Yan M, Zhang C, Wu G, Shang J, Zhang C and Yang K (2025) MDNN-DTA: a multimodal deep neural network for drug-target affinity prediction. Front. Genet. 16:1527300. doi: 10.3389/fgene.2025.1527300
Received: 13 November 2024; Accepted: 24 February 2025;
Published: 20 March 2025.
Edited by:
Andrey Ivanov, Emory University, United StatesReviewed by:
Fangping Wan, University of Pennsylvania, United StatesCopyright © 2025 Gao, Yan, Zhang, Wu, Shang, Zhang and Yang. This is an open-access article distributed under the terms of the Creative Commons Attribution License (CC BY). The use, distribution or reproduction in other forums is permitted, provided the original author(s) and the copyright owner(s) are credited and that the original publication in this journal is cited, in accordance with accepted academic practice. No use, distribution or reproduction is permitted which does not comply with these terms.
*Correspondence: Kecheng Yang, eWFuZ2tjaEB6enUuZWR1LmNu
Disclaimer: All claims expressed in this article are solely those of the authors and do not necessarily represent those of their affiliated organizations, or those of the publisher, the editors and the reviewers. Any product that may be evaluated in this article or claim that may be made by its manufacturer is not guaranteed or endorsed by the publisher.
Research integrity at Frontiers
Learn more about the work of our research integrity team to safeguard the quality of each article we publish.