
94% of researchers rate our articles as excellent or good
Learn more about the work of our research integrity team to safeguard the quality of each article we publish.
Find out more
ORIGINAL RESEARCH article
Front. Genet., 24 December 2024
Sec. Genomics of Plants and the Phytoecosystem
Volume 15 - 2024 | https://doi.org/10.3389/fgene.2024.1495891
This article is part of the Research TopicApplied Research on Plant Organelle Genomes and Key GenesView all 3 articles
 Chong Sun1,2†
 Huamin Liu2†
 Yuan Guo2
 Xueqian Fu2
 Xinxin Zhu3
 Han Liu2,4
 Ning Tang2
 Zexiong Chen2
 Yiqing Liu1,2
 Xia Liu2*
Background: Zanthoxylum L., an important genus in the Rutaceae family, has great edible and medical values. However, the high degree of morphological similarity among Zanthoxylum species and the lack of sufficient chloroplast (cp) genomic resources have greatly impeded germplasm identification and phylogenetic analyses of Zanthoxylum.
Methods: Here we assembled cp genomes of five widespread species (Zanthoxylum bungeanum, Z. armatum, Z. nitidum, Z. ailanthoides and Z. piasezkii) in China as a case study, comparative analysis of these assembled cp genomes.
Results: Each of them, ranging from 157,231 to 158,728 bp, has a quadripartite structure. Except for one extra gene in Z. piasezkii, 132 genes were identified in each species, including 87 encode protein genes, 37 transfer ribose nucleic acid (tRNA) genes, and eight ribosomal RNA (rRNA) genes. Substantial variation was observed among these five cp genome sequences in the IR/SC boundary regions. Variation in insertions and deletions were observed in the cp genomes of the five species over three different intervals, and a large number of single-nucleotide polymorphism variants were detected in the rps3-rpl22-rps19 region. Phylogenetic analysis of complete cp genome sequences revealed the evolutionary relationships among 23 Zanthoxylum species (29 samples).
Conclusion: Comparative analysis revealed that rps3-rpl22-rps19 is a highly variable divergent region in Zanthoxylum that could be developed as candidate markers for phylogenetic studies and species identification. This study identified a pair of molecular markers from hypervariable regions that can be used to distinguish between the five Zanthoxylum species and validated their utility. Overall, the results of this study provide new insights into the genetic breeding, germplasm exploration, and phylogeny of Zanthoxylum species.
Ancestral populations of Chinese peppers inhabit the mountain regions in Shanxi, Henan, Hunan, Gansu, Hubei and Sichuan Provinces and are highly adapted to a cold and dry environment, which may indicate the presence of an important gene pool. However, wild populations are largely absent from marginal regions or have been replaced by cultivated populations (Zhang M. et al., 2017; Zeng, 2000). Therefore, the identification and evaluation of Chinese pepper genetic resources are important for their effective utilization and preservation.
Plant chloroplasts are the principal sites of photosynthesis and carbon fixation (Douglas, 1998). The genetic information in the chloroplast genomes contains valuable information for molecular evolution, phylogeny, and species identification (Zeng et al., 2017; Yang and Ji, 2017; Xu et al., 2018). Chloroplast genomes in angiosperms typically contain a quadripartite circular structure with one large copy (LSC), one small copy (SSC), and two copies of inverted repeats (IR) (Yang et al., 2014). In addition, chloroplast genomes can also be mapped rapidly, efficiently, and affordably using next-generation sequencing techniques.
There are several species of Zanthoxylum in the Rutaceae family, a group of shrub or arboreal plants found across Asia, Africa, Oceania, and North America (Huang, 1997). Among them, 45 species and 13 varieties are found in China, which is considered one of the major diversity centers for Zanthoxylum (Feng et al., 2020). Among these, five wild Chinese pepper resources are the most common in China, including Zanthoxylum bungeanum Maxim., Zanthoxylum armatum DC., Zanthoxylum nitidum (Roxb.) DC., Zanthoxylum ailanthoides Sied. et. Zucc. and Zanthoxylum piasezkii Maxim. The fruits of Zanthoxylum have been used as spices throughout eastern Asia for centuries. In traditional Chinese medicine, the roots, stems and leaves of many Zanthoxylum species are used to treat toothache, stomachache, neuralgia, rheumatic arthralgia, sore throat and snakebites (Yang et al., 2008). Z. nitidum, particularly, has a variety of physiological uses, and it even has anticancer and anti-inflammatory properties (Li and Wang, 2013).
Currently, majority of research on Zanthoxylum species is focused on its chemical components and pharmacological properties (Yang et al., 2008), and phylogenetic analysis using chloroplast markers including trnL-trnF and matK (Wang et al., 2016; Feng et al., 2017; Li et al., 2019), but chloroplast whole-genome comparison and phylogenetic analyses of Zanthoxylum species are less common. Phenotypes may be easily affected by environmental changes. For example, Z. bungeanum and Z. nitidum have different morphological types in different distribution areas (Huang, 1997; Qin et al., 2019). Phenotypic identification requires some special tissues and organs to identify, and sometimes it is difficult to accurately identify and classify. Therefore, molecular identification of Zanthoxylum species in China is needed. In this study, the complete chloroplast genomes of the five widespread Zanthoxylum species (Z. bungeanum, Z. armatum, Z. nitidum, Z. ailanthoides and Z. piasezkii) were sequenced, assembled and comparatively analyzed with those from fifteen previously published Zanthoxylum species. The genomes of the different species differ clearly at the molecular level and can be used to identify and divide them. Identifying repeated sequences and observing the overall structure of chloroplast genomes may help develop SSR markers that can be used to analyze the genetic diversity of Zanthoxylum species. In addition, by analyzing the entire chloroplast genome, we can better resolve deep-level relationships within the plant taxa in the future, which is of great significance for formal species authentication. Our findings will supply rich fundamental data on chloroplast genetic diversity and evolutionary relationships and contribute to Zanthoxylum species genetic resources for further research in this genus.
Fresh leaves of Z. piasezkii, Z. bungeanum and Z. armatum were collected from Sichuan Academy of Botanical Engineering, Neijiang City, Sichuan Province, China, and leaves of Z. ailanthoides and Z. nitidum were obtained from South China Botanical Garden in Guangzhou, China. Information of the samples is listed in Supplementary Table S1. Voucher specimens of the five Zanthoxylum species (voucher numbers: 18LCS, 18LHJ1, 19L-ZY1, 19L-LMZ, and 19L-CY1) were preserved in the herbarium of Chongqing University of Arts and Sciences, Chongqing, China. The fresh leaves were collected and dried with silica gel. Using an improved CTAB protocol (Allen et al., 2006), 100 mg leaf tissue was used to isolate the genome. After DNA isolation and quality testing, DNA fragments were used to build 350 bp short-insert libraries, which were then sequenced on the BGISEQ-500 using PE 150 bp (BGI, Shenzhen, China) following the manufacturer’s protocol.
High-quality clean paired-end reads were mapped to the reference chloroplast of Z. bungeanum (accession number: NC_031386) obtained from GenBank using Bowtie 2 v.2.3.4.3 (Langmead and Salzberg, 2012) with default parameters. NOVOPlasty v.2.6.2 (Dierckxsens et al., 2017) used three coding gene sequences with the greatest coverage for de novo assembly of the chloroplast genome. Genes annotation and analysis were performed using the GeSeq (Tillich et al., 2017) and CPGAVAS2 (Shi et al., 2019) software. The tRNA genes were detected using tRNAscan-SE v2.0 (Chan and Lowe, 2019), and then manually adjusted and confirmed using Geneious v9.1.8 (Kearse et al., 2012). The circular genome map was drawn by Organellar GenomeDRAW tool (OG-DRAW) v.1.3.1 (Greiner et al., 2019) for further comparison of the gene order and content with default settings. A similar method was applied to the annotation of the other genomes obtained from GenBank for comparative analysis. The assembled complete plastome sequences of the five species have been submitted to GenBank with the accession numbers MW206785, MW206786, MW602887, MW602879, and MW478808.
Codonw software (Sharp and Li, 1987) was used to calculate the Relative Synonymous Codon Usage (RSCU) for each codon in each genome. These plastome junction regions were compared using the IRscope + online program (Amiryousefi et al., 2018) to determine the position of their junctions between IR, SSC, and LSC. Shuffle-LAGAN mode (Brudno et al., 2003) in mVISTA 2.0 (Frazer et al., 2004) was used to visualize divergent regions with the Z. ailanthoides (MW478808) genome as a reference. The nucleotide sequence polymorphism was determined using DnaSP v6.12.03 (Rozas et al., 2017) with a 15 bp step size and a 200 bp window length. The program REPuter (Kurtz et al., 2001) with adjusted parameters was used to identify long repeat sequences (forward, palindrome, complement and reverse repeats) in the five plastomes. The minimum repeat size was determined to be 25 bp, and the two repeat copies had greater than 90% similarity. SSRs with minimal repeat numbers of 8, 5, 3, 3, 3, and three were detected for mononucleotide, dinucleotide, trinucleotide, tetranucleotide, pentanucleotide, and hexanucleotide repeats, respectively, and were used in MISA v1.01 (Beier et al., 2017).
The genome sequences of fifteen plastomes of the Zanthoxylum species were downloaded from the NCBI database, and the five newly assembled Zanthoxylum chloroplast genomes were used to analyze the phylogenetic relationships; Phellodendron chinense and Tetradium ruticarpum were set as the outgroups. The samples information is listed in Supplementary Table S2. Alignment was performed using MAFFT v7.0 with default parameters (Katoh and Standley, 2016), and then manual adjustment of multiple sequence alignment was performed with BioEdit software (Hall, 1999). PhyML v2.4.4 (Guindon and Gascuel, 2003) and MrBayes v3.2.6 (Ronquist and Huelsenbeck, 2003) were used to construct the phylogenetic relationships. Nucleotide substitution models were determined using jModelTest v2.1.1 (Posada, 2008). ML analyses were conducted using a GTR + I + G model with 1000 replicates.
Molecular markers were developed based on variable regions of cp genomes to discriminate among the five Zanthoxylum species using Geneious Prime software (Kearse et al., 2012). PCR amplification was conducted using a pair of primers designed using Geneious Prime (Kearse et al., 2012). PCR reactions and the thermal cycling conditions were followed as described in Chong et al. (2022). Finally, the PCR products were visualized using 1% agarose gel electrophoresis and subsequently subject to Sanger sequencing.
Five Zanthoxylum species were sequenced, revealing a typical quadripatite structure, with a range in length from 157,231 (Z. ailanthoides) to 158,728 bp (Z. piasezkii) (Figure 1; Table 1). There are two inverted repeat (IRs, 26,408-27,651 bp) regions in the plastid genome, IRa and IRb, each separated by a large single-copy sequence (LSC, 84, 368–86, 122 bp) and a small single-copy sequence (SSC, 17, 603–18, 293 bp). There was a slight variation in the GC content of plastomes among the five species, ranging from 38.4% to 38.5% (Table 1). Most Zanthoxylum species possess 132 genes encoded by their plastomes, which include 87 protein-coding, 37 transfer RNA (tRNA) and eight ribosomal RNA (rRNA) genes (Figure 1A; Table 1; Table 2), while there were 133 genes (88 protein-coding genes) in Z. piasezkii (Figure 1B; Table 1; Table 2). The main difference was that there were two rpl22 genes in Z. piasezkii, which were located on the IR side of the junction between IR and LSC. The length of rpl22 in Z. piasezkii was relatively short, only 168 bp, while that in other four species were relatively long, ranging from 255 to 450 bp, which is only located across the LSC/IRb junction.
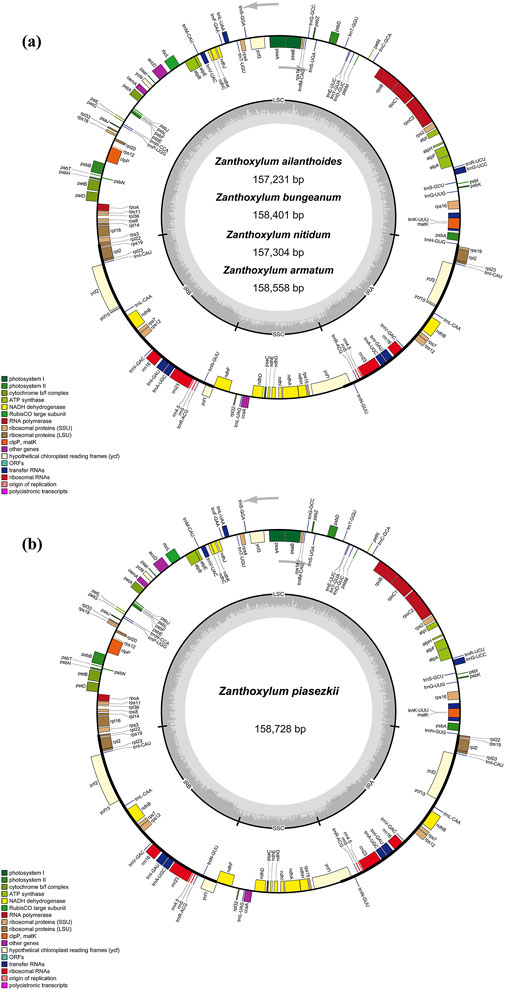
Figure 1. Gene map of the complete chloroplast genome of five Zanthoxylum species. Gene map of chloroplast genome of (A) Zanthoxylum ailanthoides, Zanthoxylum bungeanum, Zanthoxylum nitidum, Zanthoxylum armatum; (B) Zanthoxylum piasezkii. Genes in the circle are transcribed clockwise, while those outside are transcribed counter clockwise. The light gray inner circle and the dark gray shading in the inner circle corresponds to the AT and GC content, respectively. Genes belonging to different functional groups are shown with various colors.
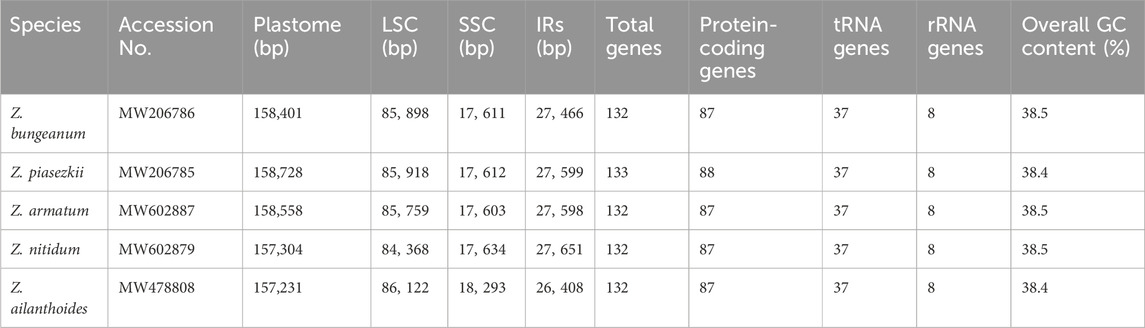
Table 1. The new sequenced and annotated complete chloroplast genomes of Zanthoxylum species.
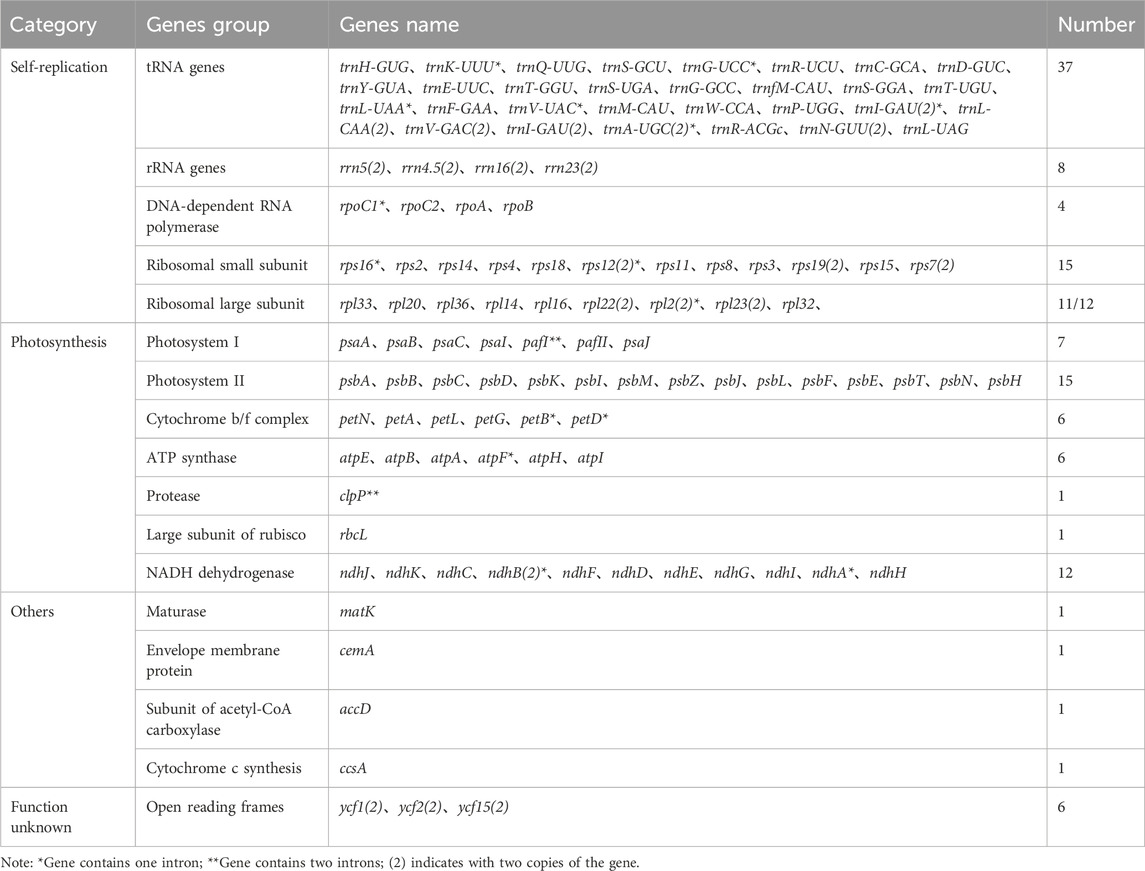
Table 2. Annotated gene classification of the chloroplast genome of Zanthoxylum species.
Among these genes, nine protein-coding genes (rps19, rps7, rpl2, rpl23, rpl22, ycf2, ycf15, ndhB, and ycf1), seven tRNA genes (trnR-ACG, trnN-GUU, trnA-UGC, trnV-GAC, trnL-GAU, trnL-CAA, and trnL-CAU) and four rRNA genes (rrn5, rrn16, rrn4.5, and rrn23) were duplicated in the IR regions. Additionally, 19 genes, including 13 protein-coding genes and six tRNA genes, had two exons, while four protein-coding genes (pafI, clpP1, and two rps12) had three exons (Supplementary Table S3).
All of the protein-coding genes were composed of 25,825–26,512 codons in the chloroplast genomes of the five species of Zanthoxylum (Figure 2; Supplementary Table S4). Among these codons, leucine, arginine and serine represent the most abundant amino acids, whereas methionine (1.10%–1.15%) has the lowest abundance. Based on the relative synonymous codon usage (RSCU) statistical analysis all amino acids have more than one synonymous codon, except for methionine (AUG) and tryptophan (UGG) (RSCU = 1). Moreover, half of the codons had RSCU > 1, and most of those (29/31, 93.5%) ended with A or U. The rest of the codons had RSCU < 1, and most of those (28/31, 90.3%) ended with G or C (Supplementary Table S4).
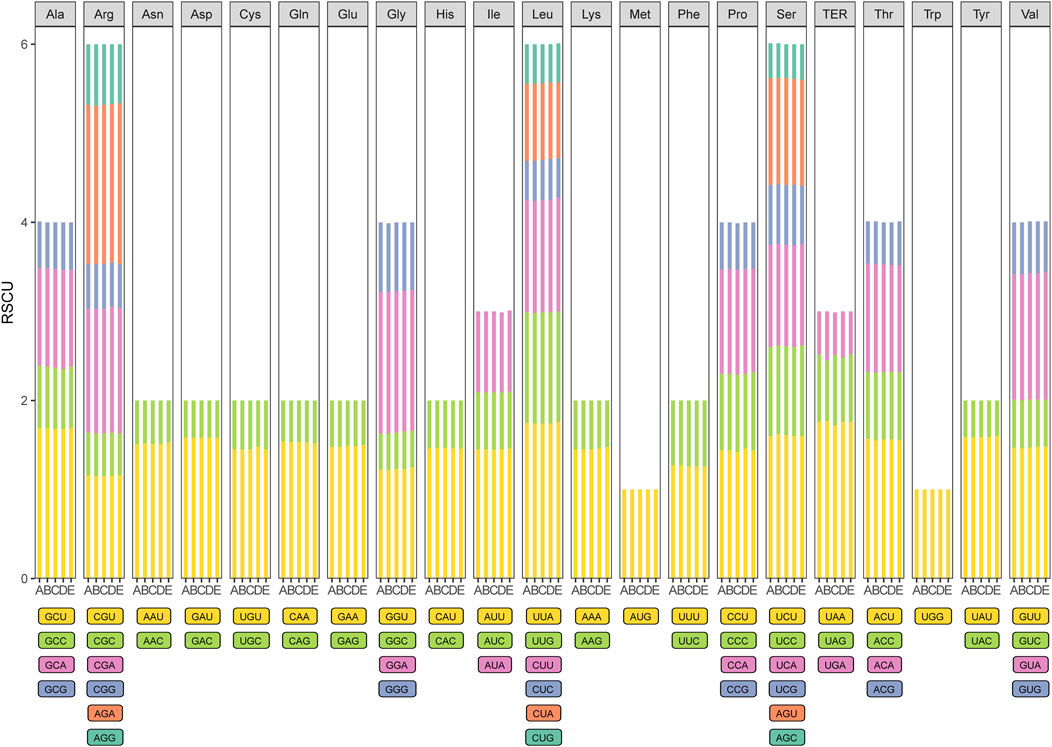
Figure 2. Codon content of 20 amino acid and stop codons in all protein-coding genes of the five chloroplast genomes. The histogram from the left-hand side of each amino acid shows codon usage within Zanthoxylum (From left to right: A: Zanthoxylum bungeanum; B: Zanthoxylum piasezkii; C: Zanthoxylum armatum; D: Zanthoxylum nitidum; E: Zanthoxylum ailanthoides).
The sequence divergence of the cpDNA of five species (Z. nitidum, Z. bungeanum, Z. armatum, Z. ailanthoides and Z. piasezkii) was drawn by mVISTA, with Z. armatum (MW602887) as a reference (Figure 3). Z. ailanthoides’ entire chloroplast sequence revealed sequence variation different from the four other species. The comparison among the five cpDNAs showed that the intensity of variation in the IR region was low, and the most variation was observed in the LSC regions and in the combined sites of the IR and LSC regions. Furthermore, the sequence divergence among the five entire cp genomes was evaluated for the nucleotide diversity (Pi) value (Figure 4). In terms of rps19-psbA, rps16-psbK, psbL-atpA, rpoB-petN, rsbZ-rps14, and ndhF displayed the highest Pi values, whereas rsbZ-rps14 displayed the most variability. These divergent areas might serve as molecular markers for identifying Zanthoxylum plants and systematic evolution analyses.
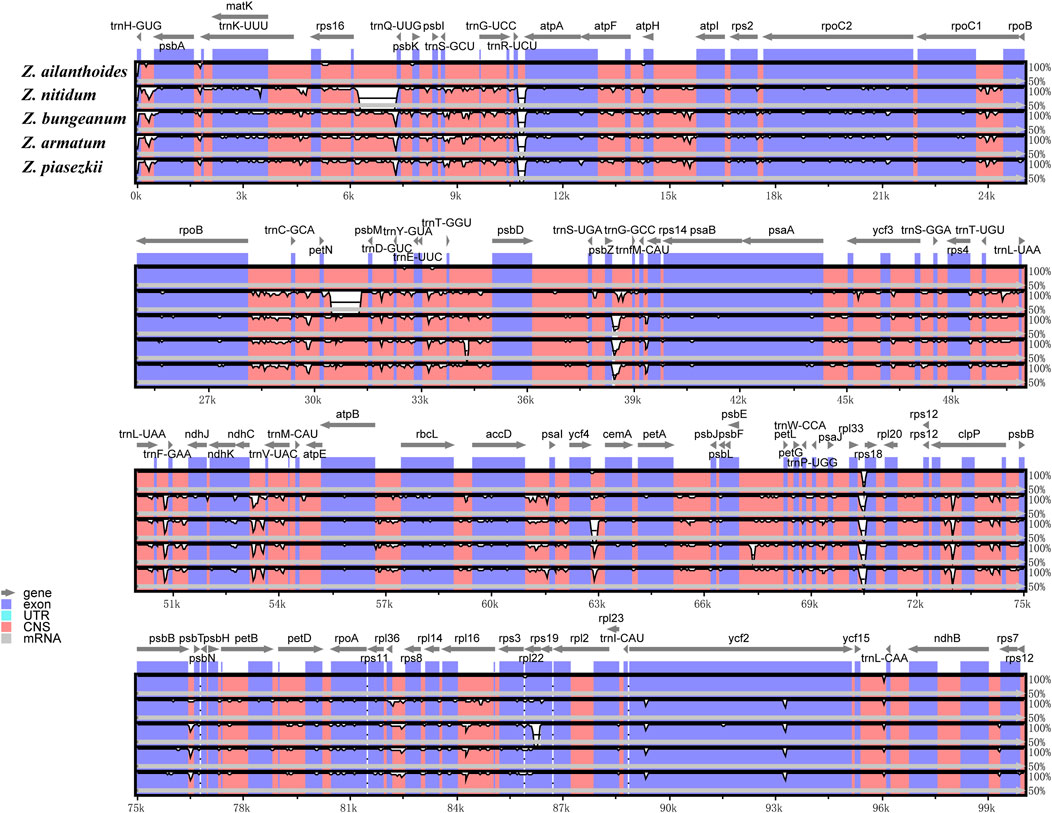
Figure 3. Comparison of the five chloroplast genomes of Zanthoxylum by using mVISTA. Grey arrows indicate genes orientation, and thick black lines above the alignment indicate IR position. Plots were based on a 70% identity cut-off, and the Y-scale represents the percent identity from 50% to 100%. The color-coded of genome regions refer as protein-coding (exon; blue), conserved non-coding sequences (CNS; pink), and white peaks represent divergences in the chloroplast genomes.
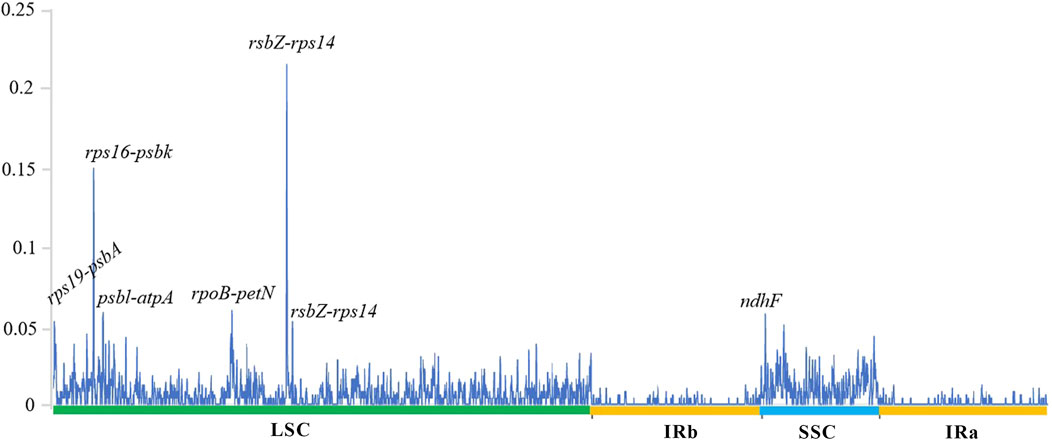
Figure 4. Comparison of the nucleotide variability (Pi) values among the five species chloroplast genomes. The X-axis indicates the genes with high Pi values, the Y-axis indicates the Pi values.
The IR regions of the five chloroplast genomes ranged in size from 26,408 bp (Z. ailanthoides) to 27,651 bp (Z. nitidum) (Table 1; Figure 1). We compared the IR borders in five widespread Zanthoxylum species, and the results showed that the IR junction regions showed slight changes (Figure 5). The rps3 and rps19 genes were fully located in the LSC and IR regions for five Zanthoxylum species, respectively. It is worth noting that the rpl22 gene was situated in the LSC/IRb border for Z. ailanthoides, Z. nitidum, Z. bungeanum, and Z. armatum, while the rpl22 gene of Z. piasezkii was truncated in the IRa and IRb regions (Figure 5). The ycf1 was located in the SSC/IR borders, and 5,487 bp of this gene extended into the IRa region. The ycf1 gene was situated in IRb/SSC boundary having equal size 205 bp expanded into the SSC region for Z. nitidum, Z. bungeanum, Z. armatum, and Z. piasezkii, with only four bp expanded into the SSC region for Z. ailanthoides. The photosynthetic ndhF gene was situated in the SSC region in Z. ailanthoides, and 23 bp of this gene extended from the SSC region to the IRb region in the Z. nitidum, Z. piasezkii, Z. bungeanum, and Z. armatum cp genomes. The rpl2 gene was located in the IRa region in the cp genomes of the five samples, the trnH sequences gaps in the LSC region were 5 bp, 36 bp, 211 bp, 52 bp, and 53 bp away from the IRa/LSC junction.
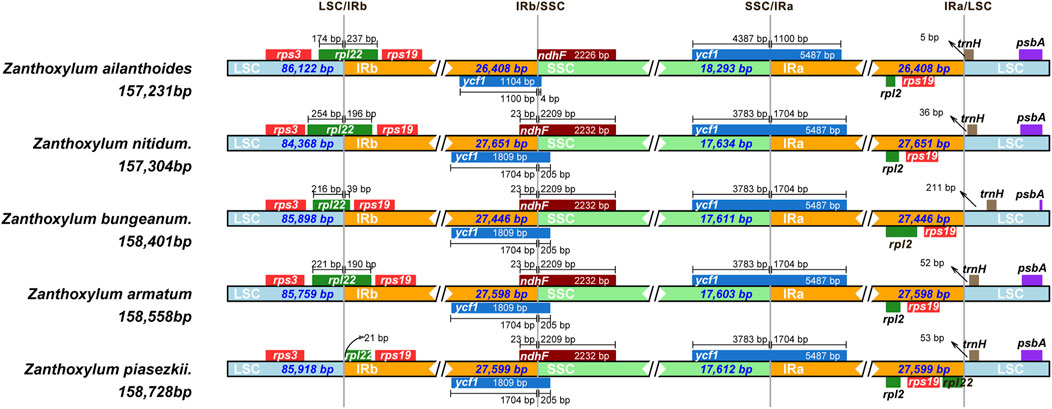
Figure 5. Comparison of the junctions of the LSC, SSC and IR regions in the chloroplast genomes of five Zanthoxylum species.
For the repeat structure analysis in the five chloroplast genomes (Figure 6 and Supplementary Table S5), palindromic repeats were not found in all five species. Most repeats were between 20 and 39 bp in length, while the longest forward repeats were 73 bp in length and found in the LSC region in the plastidial genomes of the five species of Zanthoxylum. The total number of SSRs was also identified in the chloroplast genomes of the five species (Figure 7; Supplementary Table S6). Only four types of SSRs (mononucleotide, dinucleotides, trinucleotides, tetranucleotides repeat motifs) were identified in the five species. Most of these SSRs had mononucleotide repeats, with A/T repeats being the most common, with 97.1% and 96.7% found in Z. nitidum and Z. armatum, respectively, while Z. nitidum, Zanthoxylum pinasezkii and Z. bungeanum are all characterized by AT/TA repeats in their dinucleotide repeat motifs (all 100%). The five species of Zanthoxylum all comprised AAAT/ATTT and ACAT/ATGT repeats.
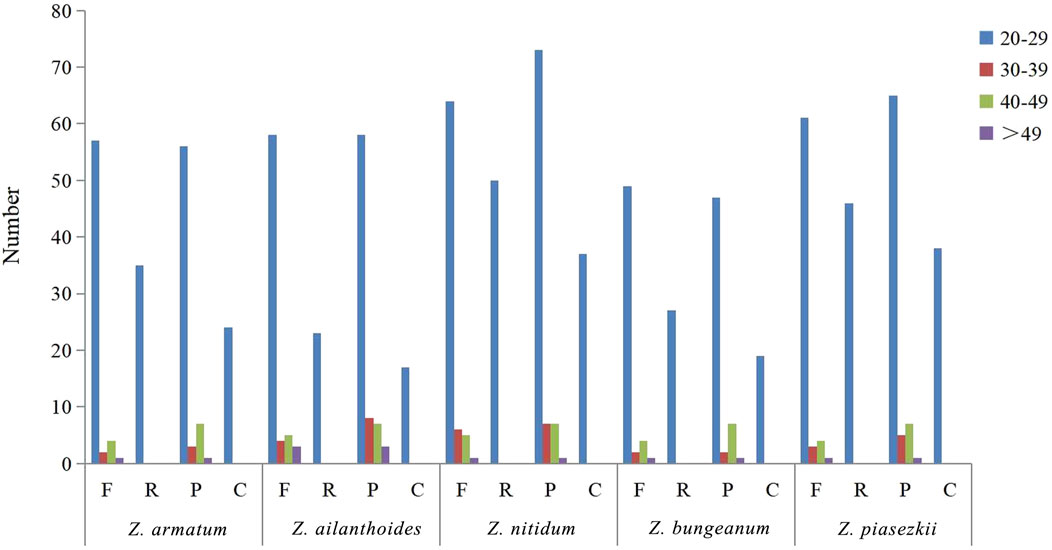
Figure 6. Repeat sequences in five chloroplast genomes. F, R, P, and C indicate forward, reverse, palindrome, and complement repeat types, respectively. Different colors are used to indicate repeats with different lengths.
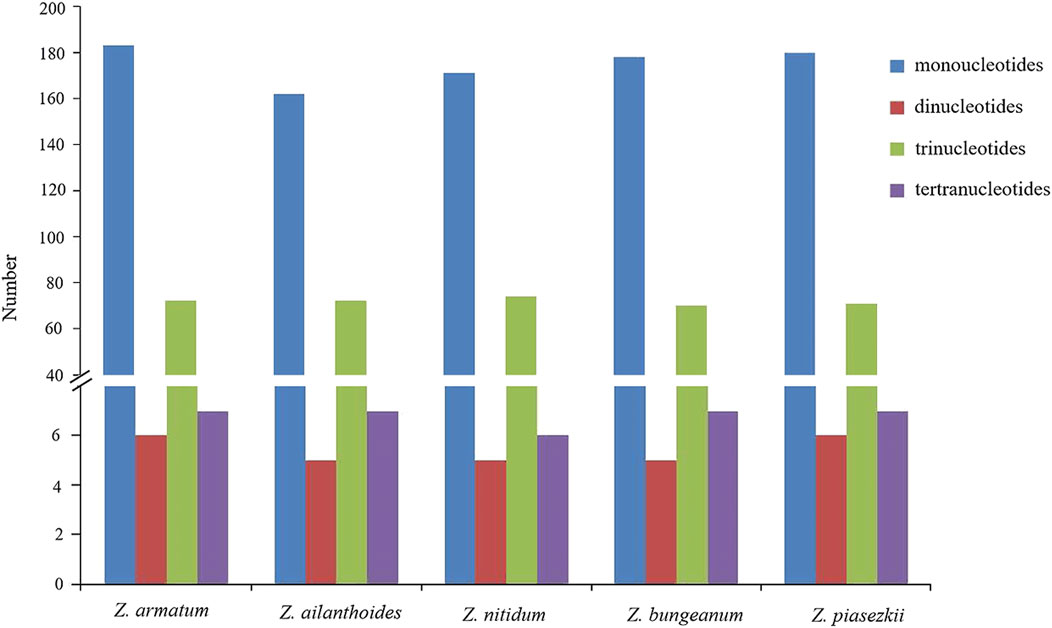
Figure 7. Analysis of simple sequence repeats (SSRs) in five Zanthoxylum chloroplast genomes.
The maximum likelihood (ML) and Bayesian inference (BI) methods were used to construct a phylogenetic tree using 29 Zanthoxylum plastid genome sequences (160,430 bp), and P. chinense and T. ruticarpum were used as outgroups. The phylogenetic trees constructed by the two methods were similar topology with only slight differences in the support values in some branches (Figure 8). All Zanthoxylum species formed a high-resolution clade. Zanthoxylum paniculatum and Zanthoxylum madagascariense were in the basal position and clustered together to form a single branch and then sisters to twelve species of the subgenus Fagara of Zanthoxylum. Zanthoxylum tragodes is the sister species of eight subgenus Zanthoxylum species (14 samples). However, it is worth noting that Z. nitidum and Z. nitidum var. tomentosum belongs to subgenus Fagara based on the record in the Flora of China (Huang, 1997), but rather than being grouped together subgenus Fagara branch, they were sister to subgenus Zanthoxylum species.
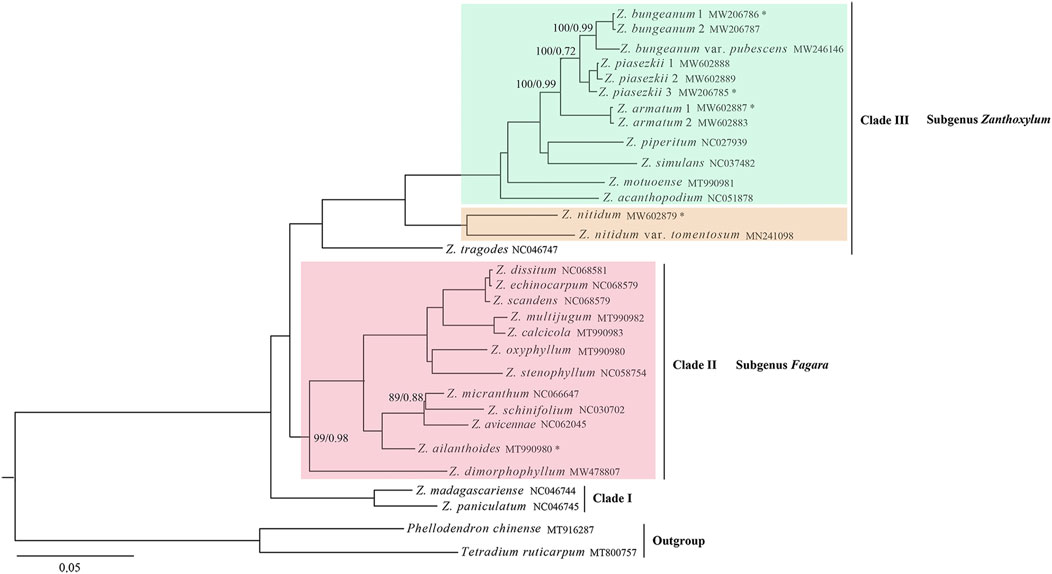
Figure 8. Phylogenetic relationships of the 29 members within Zanthoxylum based on the whole cp genomes using ML and BI analysis. Marked with an asterisk corresponds to the newly sequenced species in this study. Phellodendron chinense and Tetradium ruticarpum were used as the outgroups. Numbers above nodes are support values (ML bootstrap support values and Bayesian posterior probability values), no value is displayed on the node indicates the support rate is 100/1.00.
The specific primer pairs were designed for the conserved sequences on either side of the variation regions according to the cp genomes analysis to develop molecular markers that could be used to discriminate among these five Zanthoxylum species. The target fragments were amplified in the five Zanthoxylum samples. These primer pairs could be used to distinguish Z. bungeanum by PCR (Figure 9), and the PCR products of the five Zanthoxylum species were sequenced. The genome sequence obtained by high-throughput sequencing was compared with the sequence obtained by PCR product sequencing (Figure 10); variation in indels was observed over three intervals in the rps3-rpl22-rps19 region (Figure 10a). The P1 mutation region was located in the rps3-rpl22 region, the P2 mutation region was located in the rpl22 genes, and the P3 mutation region was located in the rpl22-rps19 region; the P2 mutation region was the largest (Figure 10; Figure 10A). This region was 156 bp smaller in the Z. bungeanum cp genome than the other four samples cp genomes, indicating that it can be used as a marker for the identification of Z. bungeanum (Figure 9). A base mutation was present in Z. piasezkii in the rpl22 gene in the P2 region, but this mutation was not present in other species (Figures 10A,C); this base mutation resulted in the change of a T base in the middle of the TTA codon to a G base, which resulted in the premature termination of the rpl22 gene. In the P1 region (Figure 10B), Z. bungeanum had a 7 bp deletion that was absent in the other species, and Z. ailanthoides had a three bp deletion that was absent in the other samples, with the exception of Z. bungeanum, indicating that the region could be developed markers for identifying Z. bungeanum and Z. ailanthoides. A single base insertion (A) was present in the rpl22 gene of Z. nitidum relative to the rpl22 genes in other species (Figure 10B), and this insertion resulted in a frameshift mutation in the rpl22 gene of Z. nitidum and thus an increase in its length. This site could be used for the identification of Z. nitidum. A 7 bp insertion present in Z. nitidum was also observed in the other three species in the P3 mutation region (Figure 10D), which could be used as a marker for the identification of Z. nitidum.
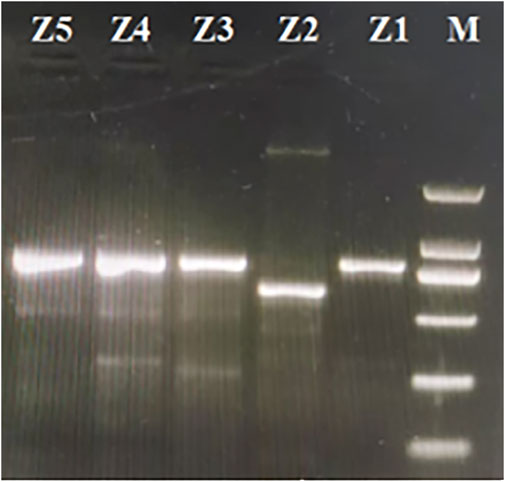
Figure 9. Gel electrophoresis of the amplification products using the designed primers. Lane M is the DL2000 marker. The lanes from right to left (marked Z1, Z2, Z3, Z2, and Z5) correspond to the products amplified from Zanthoxylum nitidum, Zanthoxylum bungeanum, Zanthoxylum ailanthoides, Zanthoxylum piasezkii and Zanthoxylum armatum, respectively.
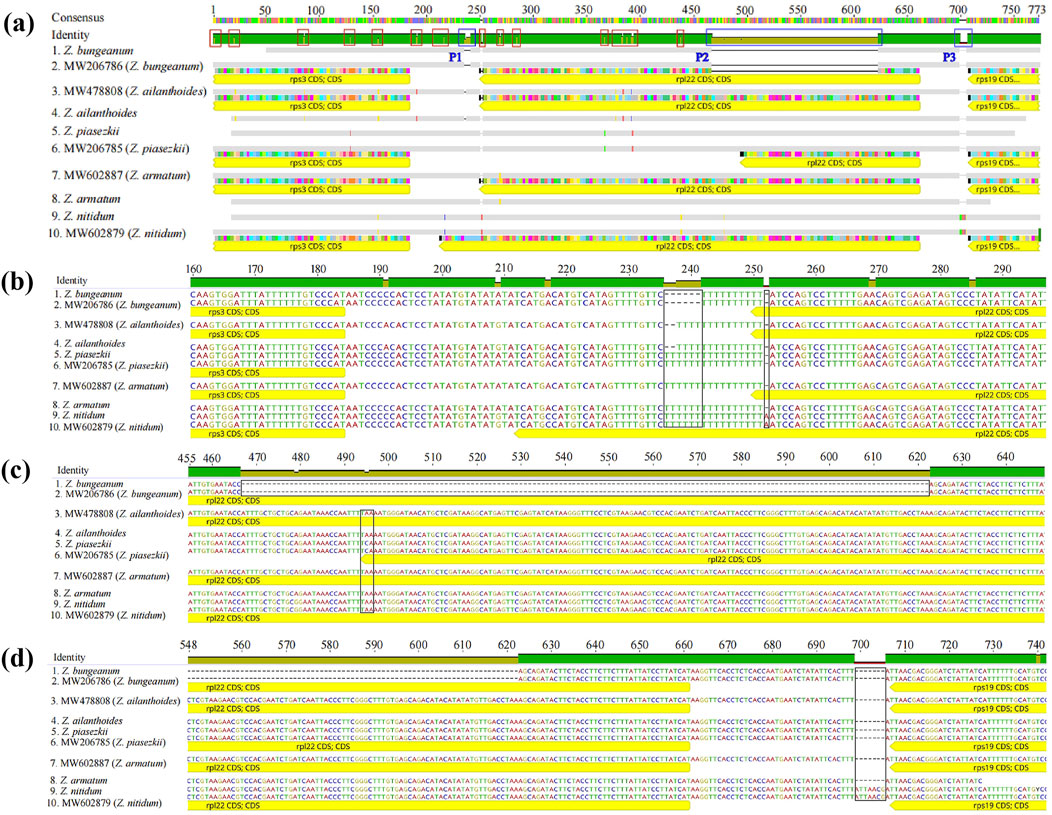
Figure 10. Sequence alignment of PCR products for the five Zanthoxylum species. (A) Overall view of the alignment of the PCR products and assembly sequences. 1, 4, 5, 8, and 9 correspond to the sequences from the PCR products, and 2, 3, 6, 7, and 10 correspond to the assembled sequences. (B, C, D) show larger versions of the blue frames from left to right (marked P1, P2, and P3, respectively) in (A); The red frame indicates the 18 SNPs in the rps3-rpl22-rps19 region, and the black frame indicates the area of variation.
This study examined the chloroplast genomes of five Zanthoxylum species. It was found that all five species had a typical structure and order of characteristics, which were consistent with the characteristics of angiosperms (He et al., 2017). There was less divergence among the coding regions than among the noncoding regions, and the inverted repeat regions (IRs) were more conserved than the single-copy (SC) regions. Similar results have also been found in the chloroplast genomes of other genera, including Saposhnikovia (Bao et al., 2022), Gynostemma (Zhang X. et al., 2017), Fritillaria (Yu et al., 2018), Rehmannia (Zeng et al., 2017), and Aconitum (Park et al., 2017). Zanthoxylum chloroplast genomes exhibited a lower GC content than AT content, a phenomenon seen in other angiosperm chloroplast genomes (Yang et al., 2010; Asaf et al., 2017; Raubeson et al., 2007). In addition, the results showed that the GC content was highest in IR regions, possibly due to the large quantities of rRNA present there.
SSRs (simple sequence repeats) are widely used to study plant populations, identify species, and infer their evolutionary history (Provan, 2000; Flannery et al., 2006). Li et al. (Li et al., 2019) developed SSRs derived from the chloroplast genome (cpSSRs) to analyze the genetic diversity among Zanthoxylum species. In our study, 246–268 SSRs were identified in the five plastid genomes (Figure 7; Supplementary Table S6). The number of poly(C)/(G) SSRs in the Zanthoxylum cp genome is much lower than that of poly (A)/(T) (Supplementary Table S6), which is consistent with previous findings (Zhao et al., 2021). In addition, Zanthoxylum’s phylogenetic relationships were revealed using effective markers designed based on the five chloroplast genomes. Overall, Zanthoxylum species will benefit from these newly identified cpSSR markers, contributing to understanding their diversity, genetic structure, and differentiation in the future.
Border contractions and expansions within the IR region, a dominant area for changes in the length of the chloroplast genomes and the shifts in the IR region borders, are common evolutionary events (Kode et al., 2005; Raubeson et al., 2007; Yao et al., 2015), are prevalent in many species, and play essential roles in plant evolution (Zhang et al., 2013; Wang et al., 2008). Many reports have indicated that IR regions are the most conserved regions of the chloroplast genome in most plant species (Daniell et al., 2016), but some studies have also reported that many chloroplast genome sequences in most plant species are rearranged, including the inversions and reinversions in the LSC and SSC regions (Doyle et al., 1992; Palmer et al., 1987; Cosner et al., 1997). In our study, the length of the chloroplast genomes of the five Zanthoxylum species (157,231-158,728 bp) did not change significantly which is consistent with the results reported by other researchers (Zhao et al., 2021). Although the IR junction regions of the five Zanthoxylum species were not significantly different, our results showed that apart from the photosynthetic ndhF genes of subgenus Zanthoxylum, which exhibited an identical (23 bp) distance from the SSC to the IRb regions for Z. bungeanum, Z. armatum, and Z. piasezkii (Figure 5), the ndhF genes of Z. nitidum also has this characteristic, which is different from previous research (Cosner et al., 1997), it may be related to not including the Z. nitidum sample in the previous study. The trnH sequence gaps in LSC have significantly different distances away from the IRa/LSC border in the five Zanthoxylum chloroplast genomes. Hence, the psbA-trnH intergenic spacer region was selected as a candidate DNA barcode sequence to distinguish similar species (Yao et al., 2009) and even at the family level (Degtjareva et al., 2012; Aldrich et al., 1988). Therefore, the psbA-trnH sequence region to develop DNA barcoding for Z. nitidum, Z. bungeanum, Z. armatum, and Z. piasezkii.
Chloroplast genome sequencing, especially the application of next-generation sequencing, has become simpler and easier with its continuous development (Xu et al., 2020). Currently, researchers have widely used the entire chloroplast genome sequence to conduct evolution, classification, and phylogenetic studies of angiosperms (Borsch and Quandt, 2009; Dong et al., 2012; Tong et al., 2016). Our study included 23 Zanthoxylum species with robust phylogenetic relationships based on ML and BI. The results showed that almost all relationships inferred from chloroplast genome data were generally highly supported based on the two methods (Figure 8). Zanthoxylum species were all clustered together to form a single clade with high resolution. It is noteworthy that Z. nitidum, Z. nitidum var. tomentosum in subgenus Fagara and Z. tragodes clustered together to form a single clade and sister to other subgenus Zanthoxylum species, supported Z. nitidum belonging to subgenus Zanthoxylum instead of subgenus Fagara, which showed some differences from the record in the Flora of China (Huang, 1997). However, the English version of the Flora of China (Zhang et al., 2008) did not mention the subgeneric classification of the genus Zanthoxylum. Actually, the morphological taxonomy of Z. nitidum remains controversial due to the abundance of phenotypic variations (Qin et al., 2019), morphological boundaries between varieties or types within Z. nitidum species should be re-evaluated (Qin et al., 2019). Hence, the accurate taxonomic delimitation of Z. nitidum remains to be further study with more substantial evidence based on more samples, genomic data, and phenotypic traits (Qin et al., 2022). In addition, Z. paniculatum and Z. madagascariense were in the basal position clustered together to form a single branch and then were sisters to other Zanthoxylum species. The two species may suggest a new subgenus. The traditional classification systems of Zanthoxylum that rely solely on external forms (petals and calyx) may be imperfect. Therefore, the existing classification of the genus Zanthoxylum can be further researched and updated by including more samples in the future. Overall, our research provides robust phylogenetic relationships of Zanthoxylum based on the entire chloroplast genome, which might provide insights into the genetic diversity, molecular breeding, and plastome evolution of the genus Zanthoxylum.
A large number of indels (3 indel) and SNP sites (17 SNPs) were observed in the rps3-rpl22-rps19 region (Figure 10A), this highly variable region of the cp genomes can be used as a marker for the identification of Zanthoxylum species. We designed specific primer pairs (F: GAGCAATTCCCTCAACACCG; R: GGGAGAATTTGCGCCCACTA) for the different regions of these five Zanthoxylum species. The target fragments were amplified in all five Zanthoxylum samples. This DNA barcode developed in this study could be used to distinguish these five Zanthoxylum species (Figures 9, 10). Therefore, rps3-rpl22-rps19 region are proposed as barcodes for rapid and accurate identification of Zanthoxylum species.
In this study, we analyzed five species that are widely distributed and cultivated in China. The results showed that the genome length and gene content of the genus Zanthoxylum were comparatively conserved, while the IR-SC boundary regions were variable between the chloroplast genomes of the five Zanthoxylum species. The whole rpl22 gene in the Z. piasezkii species was different from other Zanthoxylum species and could be used as a marker to identify Z. piasezkii. We identified SSR sites and seven variable regions that may be used to develop tools to study Zanthoxylum species in the future. A phylogenetic tree was constructed with the whole chloroplast genome to better understand the genetic relationships of the Zanthoxylum species. This result supports Z. nitidum belongs to subgenus Zanthoxylum instead of subgenus Fagara, which seems to suggest that the earlier intrageneric classifications need to be further refined. As to whether Zanthoxylum should be further divided into two subgenera, we will include more samples for further study in our future research. In brief, our research provides extensive genetic resources for studying the chloroplast genome of Zanthoxylum and provides valuable reference information for species identification and conservation.
The datasets presented in this study can be found in online repositories. The names of the repository/repositories and accession number(s) can be found in the article/Supplementary Material.
CS: Formal Analysis, Resources, Writing–original draft. HuL: Data curation, Writing–original draft. YG: Formal Analysis, Resources, Writing–original draft. XF: Formal Analysis, Writing–original draft. XZ: Resources, Writing–review and editing. HaL: Formal Analysis, Writing–original draft. NT: Data curation, Writing–review and editing. ZC: Project administration, Supervision, Writing–review and editing. YL: Project administration, Writing–review and editing. XL: Funding acquisition, Supervision, Writing–review and editing.
The author(s) declare that financial support was received for the research, authorship, and/or publication of this article. This research was funded by the National Natural Science Foundation of China (NO. 31901324), Scientific Research Projects of Chongqing Science and Technology Bureau (NO. CSTB2024NSCQ-MSX0353; CSTB2022NSCQ-MSX1558), Youth Projects of Chongqing Municipal Education Commission (NO. KJQN202201337; KJQN202101320; KJQN202201332), China Scholarship Fund, Projects for Innovative Research Groups of Chongqing Universities (No. CXQT21028), and Chongqing talent program for Zexiong Chen. Chongqing postdoctoral special funding project (2021XM2010).
We give special thanks to the staff of Kunming Botanical Garden (Yunnan, China), Shenzhen Xianhu Botanical Garden (Guangdong, China), South China Botanical Garden (Guangdong, China), and Sichuan Academy of Botanical Engineering (Sichuan, China) for collecting plant material used for experiments. We are very grateful to Namrata Pradhan (Royal Botanic Gardens, Kew, United Kingdom) for polishing the language of my manuscript. We are also grateful to some people for their assistance with fieldwork, for data analysis, for giving comments on the manuscript paper.
The authors declare that the research was conducted in the absence of any commercial or financial relationships that could be construed as a potential conflict of interest.
All claims expressed in this article are solely those of the authors and do not necessarily represent those of their affiliated organizations, or those of the publisher, the editors and the reviewers. Any product that may be evaluated in this article, or claim that may be made by its manufacturer, is not guaranteed or endorsed by the publisher.
The Supplementary Material for this article can be found online at: https://www.frontiersin.org/articles/10.3389/fgene.2024.1495891/full#supplementary-material
Aldrich, J., Cherney, B. W., Merlin, E., and Christopherson, L. (1988). The role of insertions/deletions in the evolution of the intergenic region between psbA and trnH in the chloroplast genome. Curr. Genet. 14, 137–146. doi:10.1007/BF00569337
Allen, G., Flores-Vergara, M., Krasynanski, S., Kumar, S., and Thompson, W. F. (2006). A modified protocol for rapid DNA isolation from plant tissues using cetyltrimethylammonium bromide. Nat. Protoc. 1, 2320–2325. doi:10.1038/nprot.2006.384
Amiryousefi, A., Hyvönen, J., and Poczai, P. (2018). IRscope: an online program to visualize the junction sites of chloroplast genomes. Bioinformatics 34, 3030–3031. doi:10.1093/bioinformatics/bty220
Asaf, S., Khan, A. L., Khan, M. A., Waqas, M., Kang, S. M., Yun, B. W., et al. (2017). Chloroplast genomes of Arabidopsis halleri ssp. gemmifera and Arabidopsis lyrata ssp. petraea: structures and comparative analysis. Sci. Rep. 7, 7556. doi:10.1038/S41598-017-07891-5
Bao, Z. Z., Zhu, Z. Y., Zhang, H. J., Zhong, Y., Wang, W. Q., Zhang, J. Z., et al. (2022). The complete chloroplast genome of Saposhnikovia divaricata. Mitochondrial DNA Part B 7 (9), 360–361. doi:10.1080/23802359.2019.1704200
Beier, S., Thiel, T., Münch, T., Scholz, U., and Mascher, M. (2017). MISA-web: a web server for microsatellite prediction. Bioinformatics 33, 2583–2585. doi:10.1093/bioinformatics/btx198
Borsch, T., and Quandt, D. (2009). Mutational dynamics and phylogenetic utility of noncoding chloroplast DNA. Plant Syst. Evol. 282, 169–199. doi:10.1007/s00606-009-0210-8
Brudno, M., Do, C. B., Cooper, G. M., Kim, M. F., Davydov, E., Program, N. C. S., et al. (2003). LAGAN and Multi-LAGAN: efficient tools for large-scale multiple alignment of genomic DNA. Genome Res. 13, 721–731. doi:10.1101/GR.926603
Chan, P. P., and Lowe, T. M. (2019). tRNAscan-SE: searching for tRNA genes in genomic sequences. Methods Mol. Biol. 1962, 1–14. doi:10.1007/978-1-4939-9173-0_1
Chong, X. R., Li, Y., Yan, M. L., Wang, Y., Li, M. Z., Zhou, Y. W., et al. (2022). Comparative chloroplast genome analysis of 10 Ilex species and the development of species-specific identification markers. Ind. Crop Prod. 187, 115408. doi:10.1016/J.INDCROP.2022.115408
Cosner, M. E., Jansen, R. K., Palmer, J. D., and Downie, S. R. (1997). The highly rearranged chloroplast genome of Trachelium caeruleum (Campanulaceae): multiple inversions, inverted repeat expansion and contraction, transposition, insertions/deletions, and several repeat families. Curr. Genet. 31, 419–429. doi:10.1007/s002940050225
Daniell, H., Lin, C. S., Yu, M., and Chang, W. J. (2016). Chloroplast genomes: diversity, evolution, and applications in genetic engineering. Genome Biol. 17, 134. doi:10.1186/s13059-016-1004-2
Degtjareva, G. V., Logacheva, M. D., Samigullin, T. H., Terentieva, E. I., and Valiejo-Roman, C. M. (2012). Organization of chloroplast psbA-trnH intergenic spacer in dicotyledonous angiosperms of the family Umbelliferae. Biochemistry 77, 1056–1064. doi:10.1134/S0006297912090131
Dierckxsens, N., Mardulyn, P., and Smits, G. (2017). NOVOPlasty: de novo assembly of organelle genomes from whole genome data. Nucleic Acids Res. 45, 18. doi:10.1093/nar/gkw955
Dong, W. P., Liu, J., Yu, J., Wang, L., and Zhou, S. L. (2012). Highly variable chloroplast markers for evaluating plant phylogeny at low taxonomic levels and for DNA barcoding. PLoS ONE 7, e35071. doi:10.1371/journal.pone.0035071
Douglas, S. E. (1998). Plastid evolution: origins, diversity, trends. Curr. Opin. Genet. Dev. 8, 655–661. doi:10.1016/s0959-437x(98)80033-6
Doyle, J. J., Davis, J. I., Soreng, R. J., Garvin, D., and Anderson, M. J. (1992). Chloroplast DNA inversions and the origin of the grass family (Poaceae). Proc. Natl. Acad. Sci. USA. 89, 7722–7726. doi:10.1073/pnas.89.16.7722
Feng, S. J., Liu, Z. S., Hu, Y., Tian, J. Y., Yang, T. X., and Wei, A. Z. (2020). Genomic analysis reveals the genetic diversity, population structure, evolutionary history and relationships of Chinese pepper. Hort. Res. 7, 158. doi:10.1038/s41438-020-00376-z
Feng, S. J., Zhao, L. L., Liu, Z. S., Liu, Y. L., Yang, T. X., and Wei, A. Z. (2017). De novo transcriptome assembly of Zanthoxylum bungeanum using illumina sequencing for evolutionary analysis and simple sequence repeat marker development. Sci. Rep. 7, 16754. doi:10.1038/s41598-017-15911-7
Flannery, M. L., Mitchell, F. J., Coyne, S., Kavanagh, T. A., Burke, J. I., Salamin, N., et al. (2006). Plastid genome characterisation in Brassica and Brassicaceae using a new set of nine SSRs. Theor. Appl. Genet. 113, 1221–1231. doi:10.1007/s00122-006-0377-0
Frazer, K. A., Pachter, L., Poliakov, A., Rubin, E. M., and Dubchak, I. (2004). VISTA: computational tools for comparative genomics. Nucleic Acids Res. 32, W273–W279. doi:10.1093/nar/gkh458
Greiner, S., Lehwark, P., and Bock, R. (2019). OrganellarGenomeDRAW (OGDRAW) Version 1.3.1: expanded toolkit for the graphical visualization of organellar genomes. Nucleic Acids Res. 47, W59-W64–W64. doi:10.1093/nar/gkz238
Guindon, S., and Gascuel, O. (2003). A simple, fast, and accurate algorithm to estimate large phylogenies by maximum likelihood. Syst. Biol. 52, 696–704. doi:10.1080/10635150390235520
Hall, T. A. (1999). BioEdit: a user-friendly biological sequence alignment editor and analysis program for windows 95/98/NT. Nucleic Acids Symp. Ser. 41, 95–98. doi:10.1021/bk-1999-0734.ch008
He, L., Qian, J., Li, X., Sun, Z., Xu, X., and Chen, S. (2017). Complete chloroplast genome of medicinal plant Lonicera japonica: genome rearrangement, intron gain and loss, and implications for phylogenetic studies. Molecules 22, 249. doi:10.3390/molecules22020249
Katoh, K., and Standley, D. M. (2016). Mafft multiple sequence alignment software version 7: improvements in performance and usability. Mol. Biol. Evol. 30, 772–780. doi:10.1093/molbev/mst010
Kearse, M., Moir, R., Wilson, A., Stones-Havas, S., Cheung, M., Sturrock, S., et al. (2012). Geneious basic: an integrated and extendable desktop software platform for the organization and analysis of sequence data. Bioinformatics 28, 1647–1649. doi:10.1093/bioinformatics/bts199
Kode, V., Mudd, E. A., Iamtham, S., and Day, A. (2005). The tobacco plastid accD gene is essential and is required for leaf development. Plant J. 44, 237–244. doi:10.1111/j.1365-313X.2005.02533.x
Kurtz, S., Choudhuri, J. V., Ohlebusch, E., Schleiermacher, C., Stoye, J., and Giegerich, R. (2001). Reputer: the manifold applications of repeat analysis on a genomic scale. Nucleic Acids Res. 29, 4633–4642. doi:10.1093/NAR/29.22.4633
Langmead, B., and Salzberg, S. L. (2012). Fast gapped-read alignment with Bowtie 2. Nat. Methods 9, 357–359. doi:10.1038/nmeth.1923
Li, S. Q., Wei, Y., Liu, H. Y., Zhang, Z. D., Zhang, Y., Wang, L. H., et al. (2019). Development of chloroplast SSR markers of Zanthoxylum bungeanum and their generality for interspecies and intraspecies. J. Zhejiang A&F Univ. 36, 1241–1246. doi:10.11833/j.issn.2095-0756.2019.06.023
Li, Y. Z., and Wang, H. Y. (2013). Research progress on chemical constituents and pharmacological activities of Zanthoxylum nitidum. J China Pharm. 31, 2966–2968.
Palmer, J. D., Nugent, J. M., and Herbon, L. A. (1987). Unusual structure of geranium chloroplast DNA: a triple-sized inverted repeat, extensive gene duplications, multiple inversions, and two repeat families. Proc. Natl. Acad. Sci. USA. 84, 769–773. doi:10.1073/pnas.84.3.769
Park, I., Kim, W. J., Yang, S. Y., Yeo, S. M., Li, H. L., and Moon, B. C. (2017). The complete chloroplast genome sequence of Aconitum coreanum and Aconitum carmichaelii and comparative analysis with other Aconitum species. PLoS One 12 (9), e0184257. doi:10.1371/journal.pone.0184257
Posada, D. (2008). jModelTest: phylogenetic model averaging. Mol. Biol. Evol. 25, 1253–1256. doi:10.1093/molbev/msn083
Provan, J. (2000). Novel chloroplast microsatellites reveal cytoplasmic variation in Arabidopsis thaliana. Mol. Ecol. 9, 2183–2185. doi:10.1046/j.1365-294x.2000.01053-16.x
Qin, Y. R., Hu, R. C., Zhao, H., Wei, G. Y., Lu, Z. Q., and Huang, Y. F. (2022). Taxonomic delimitation and molecular identification of clusters within the species Zanthoxylum nitidum (Rutaceae) in China. Phytokeys 196, 1–20. doi:10.3897/phytokeys.196.79566
Qin, Y. R., Jiang, Z. O., Lai, M. X., Huang, Y. F., and Wang, X. H. (2019). Botanical origin research and simultaneous determination of five effective components of Zanthoxylum nitidum. Guangxi Zhi Wu 39, 531–539. doi:10.11931/guihaia.gxzw201804012
Raubeson, L. A., Peery, R., Chumley, T. W., Dziubek, C., Fourcade, H. M., Boore, J. L., et al. (2007). Comparative chloroplast genomics: analyses including new sequences from the angiosperms Nuphar advena and Ranunculus macranthus. BMC Genom 8, 174. doi:10.1186/1471-2164-8-174
Ronquist, F., and Huelsenbeck, J. P. (2003). MrBayes 3: bayesian phylogenetic inference under mixed models. Bioinformatics 19, 1572–1574. doi:10.1093/bioinformatics/btg180
Rozas, J., Ferrer-Mata, A., Sánchez-DelBarrio, J. C., Guirao-Rico, S., Librado, P., Ramos-Onsins, S. E., et al. (2017). DnaSP 6: DNA sequence polymorphism analysis of large data sets. Mol. Biol. Evol. 34, 3299–3302. doi:10.1093/molbev/msx248
Sharp, P. M., and Li, W. H. (1987). The codon Adaptation Index--a measure of directional synonymous codon usage bias, and its potential applications. Nucleic Acids Res. 15, 1281–1295. doi:10.1093/nar/15.3.1281
Shi, L. C., Chen, H. M., Jiang, M., Wang, L. Q., Wu, X., Huang, L. F., et al. (2019). CPGAVAS2, an integrated plastome sequence annotator and analyzer. Nucleic Acids Res. 47 (W1), W65-W73–W73. doi:10.1093/nar/gkz345
Tillich, M., Lehwark, P., Pellizzer, T., Ulbricht-Jones, E. S., Fischer, A., Bock, R., et al. (2017). GeSeq-Versatile and accurate annotation of organelle genomes. Nucleic Acids Res. 45, W6-W11–W11. doi:10.1093/nar/gkx391
Tong, W., Kim, T. S., and Park, Y. J. (2016). Rice chloroplast genome variation architecture and phylogenetic dissection in diverse Oryza species assessed by whole-genome resequencing. Rice 9, 57. doi:10.1186/s12284-016-0129-y
Wang, F., Yan, K. W., Mei, G. R., Lu, J. Y., Pan, H. H., Chen, H. P., et al. (2016). Authentication of homology of medicine and food huajiao by DNA barcoding sequences. Sci. Technol. Food. 37, 138–141. doi:10.13386/j.issn1002-0306.2016.01.019
Wang, R. J., Cheng, C. L., Chang, C. C., Wu, C. L., Su, T. M., and Chaw, S. M. (2008). Dynamics and evolution of the inverted repeat-large single copy junctions in the chloroplast genomes of monocots. BMC Evol. Biol. 8, 36. doi:10.1186/1471-2148-8-36
Xu, J. Y., Shen, X. F., Liao, B. S., Xu, J., and Hou, D. Y. (2020). Comparing and phylogenetic analysis chloroplast genome of three Achyranthes species. Sci. Rep. 10, 10818. doi:10.1038/s41598-020-67679-y
Xu, X. D., Wen, J., Wang, W., and Zheng, W. (2018). The complete chloroplast genome of the threatened Prunus cerasoides, a rare winter blooming cherry in the Himalayan region. Conserv. Genet. Resour. 10, 499–502. doi:10.1007/s12686-017-0859-1
Yang, C. H., Cheng, M. J., Chiang, M. Y., Kuo, Y. H., Wang, C. J., and Chen, I. S. (2008). Dihydrobenzo[c] phenanthridine alkaloids from stem bark of Zanthoxylum nitidum. J. Nat. Prod. 71 (4), 669–673. doi:10.1021/np700745f
Yang, M., Zhang, X. W., Liu, G. M., Yin, Y. X., Chen, K. F., Yun, Q. Z., et al. (2010). The complete chloroplast genome sequence of date palm (Phoenix dactylifera L.). PLoS ONE 5 (9), e12762. doi:10.1371/journal.pone.0012762
Yang, Y., Dang, Y. Y., Li, Q., Lu, J. J., Li, X. W., Wang, Y. T., et al. (2014). Complete chloroplast genome sequence of poisonous and medicinal plant Datura stramonium: organizations and implications for genetic engineering. PLoS ONE 9, e110656. doi:10.1371/journal.pone.0110656
Yang, Z. Y., and Ji, Y. H. (2017). Comparative and phylogenetic analyses of the complete chloroplast genomes of three Arcto-Tertiary Relicts: Camptotheca acuminata, Davidia involucrata, and Nyssa sinensis. Front. Plant. Sci. 8, 1536. doi:10.3389/fpls.2017.01536
Yao, H., Song, J. Y., Ma, X. Y., Liu, C., Li, Y., Xu, H. X., et al. (2009). Identification of Dendrobium species by a candidate DNA barcode sequence: the chloroplast psbA-trnH intergenic region. Planta Med. 75, 667–669. doi:10.1055/s-0029-1185385
Yao, X. H., Tang, P., Li, Z. Z., Li, D. W., Liu, Y. F., and Huang, H. W. (2015). The first complete chloroplast genome sequences in Actinidiaceae: genome structure and comparative analysis. PLoS ONE 10, e0129347. doi:10.1371/journal.pone.0129347
Yu, B., Zhang, M. F., Xue, J., Dong, R., Du, Y. P., and Zhang, X. H. (2018). Chloroplast genomic resources for phylogeny and DNA barcoding: a case study on Fritillaria. Sci. Rep. 8, 1184. doi:10.1038/s41598-018-19591-9
Zeng, J. J. (2000). The cultivated origin and distribution of Chinese pepper (in Chinese). Agr. Hist. China. 19, 68–75.
Zeng, S. Y., Zhou, T., Han, K., Yang, Y. C., Zhao, J. H., and Liu, Z. L. (2017). The complete chloroplast genome sequences of six Rehmannia species. Genes 8, 103. doi:10.3390/genes8030103
Zhang, H., Li, C., Miao, H., and Xiong, S. (2013). Insights from the complete chloroplast genome into the evolution of Sesamum indicum L. PLoS One 8, e80508. doi:10.1371/journal.pone.0080508
Zhang, M., Wang, J. L., Zhu, L., Li, T., Jiang, W. D., Zhou, J., et al. (2017a). Zanthoxylum bungeanum Maxim. (Rutaceae): a systematic review of its traditional uses, botany, phytochemistry, pharmacology, pharmacokinetics, and toxicology. Int. J. Mol. Sci. 18, 2172. doi:10.3390/ijms18102172
Zhang, X., Zhou, T., Kabwal, N., Zhao, Y. M., Bai, G. Q., and Zhao, G. F. (2017b). Completion of eight Gynostemma BL. (Cucurbitaceae) chloroplast genomes: characterization, comparative analysis, and phylogenetic relationships. Front. Plant. Sci. 8, 1583. doi:10.3389/fpls.2017.01583
Zhao, K. H., Li, L. Q., Quan, H., Yang, J. B., Zhang, Z. R., Liao, Z. H., et al. (2021). Comparative analyses of chloroplast genomes from 14 Zanthoxylum species: identification of variable DNA markers and phylogenetic relationships within the genus. Front. Plant Sci. 11, 605793. doi:10.3389/FPLS.2020.605793
Keywords: zanthoxylum, complete chloroplast genome, phylogeny, species discrimination zanthoxylum, species discrimination, molecular markers
Citation: Sun C, Liu H, Guo Y, Fu X, Zhu X, Liu H, Tang N, Chen Z, Liu Y and Liu X (2024) Comparative chloroplast genome analysis of five widespread species (Zanthoxylum L.) and development of molecular markers for their discrimination. Front. Genet. 15:1495891. doi: 10.3389/fgene.2024.1495891
Received: 13 September 2024; Accepted: 10 December 2024;
Published: 24 December 2024.
Edited by:
Feibing Wang, Huaiyin Institute of Technology, ChinaReviewed by:
Zhiqiang Lu, Chinese Academy of Sciences (CAS), ChinaCopyright © 2024 Sun, Liu, Guo, Fu, Zhu, Liu, Tang, Chen, Liu and Liu. This is an open-access article distributed under the terms of the Creative Commons Attribution License (CC BY). The use, distribution or reproduction in other forums is permitted, provided the original author(s) and the copyright owner(s) are credited and that the original publication in this journal is cited, in accordance with accepted academic practice. No use, distribution or reproduction is permitted which does not comply with these terms.
*Correspondence: Xia Liu, bGl1eGlhdmlwOEAxNjMuY29t
†These authors have contributed equally to this work
Disclaimer: All claims expressed in this article are solely those of the authors and do not necessarily represent those of their affiliated organizations, or those of the publisher, the editors and the reviewers. Any product that may be evaluated in this article or claim that may be made by its manufacturer is not guaranteed or endorsed by the publisher.
Research integrity at Frontiers
Learn more about the work of our research integrity team to safeguard the quality of each article we publish.