 Amarise Little
 Rebecca A. Deek
 Angela Zhang
 Ni Zhao
 Wodan Ling
 Michael C. Wu
94% of researchers rate our articles as excellent or good
Learn more about the work of our research integrity team to safeguard the quality of each article we publish.
Find out more
ORIGINAL RESEARCH article
Front. Genet. , 15 November 2024
Sec. Statistical Genetics and Methodology
Volume 15 - 2024 | https://doi.org/10.3389/fgene.2024.1480972
This article is part of the Research Topic Statistical Approaches, Applications, and Software for Longitudinal Microbiome Data Analysis and Microbiome Multi-Omics Data Integration View all 8 articles
Introduction: Repeated measures microbiome studies, including longitudinal and clustered designs, offer valuable insights into the dynamics of microbial communities and their associations with various health outcomes. However, visualizing such multivariate data poses significant challenges, particularly in distinguishing meaningful biological patterns from noise introduced by covariates and the complexities of repeated measures.
Methods: In this study, we propose a framework to enhance the visualization of repeated measures microbiome data using Principal Coordinates Analysis (PCoA) adjusted for covariates through linear mixed models (LMM). Our method adjusts for confounding variables and accounts for the repeated measures structure of the data, enabling clearer identification of microbial community variations across time points or clusters.
Results: We demonstrate the utility of our approach through simulated scenarios and real datasets, showing that it effectively mitigates the influence of nuisance covariates and highlights key axes of microbiome variation.
Discussion: This refined visualization technique provides a robust tool for researchers to explore and understand microbial community dynamics in repeated measures microbiome studies.
Cross-sectional studies of the human microbiome have identified a wide range of outcomes and exposures associated with the human microbiome ranging from type 2 diabetes (Qin et al., 2012; Larsen et al., 2010) to colorectal cancer (Zackular et al., 2014; Feng et al., 2015). These findings have shed light on the biological mechanisms underlying many conditions and provided critical clues as to novel therapeutic and risk reduction interventions, but a serious weakness of many of these classical studies is the limited information on how the microbiome changes over time and how these changes may affect outcomes. This has motivated the development of longitudinal microbiome studies where specimens are collected and profiled over a period of time. These studies promise comprehensive opportunities to gain better insight into topics such as how the microbiome varies over the course of a treatment (Lawrence et al., 2014; Jackson et al., 2016) and how the microbiome may sit within the causal pathway of some conditions (Turnbaugh et al., 2006; Wang et al., 2018), among many other opportunities. However, despite the potential and promises, serious analytical challenges persist.
Visualization is a particular challenge in longitudinal microbiome studies, yet it represents an important and standard step in most microbiome data analysis workflows. As in the analysis of other omics data types, visualization allows for the assessment of outlying samples and quality control. However, within the context of microbiome studies, it takes on an additional role by allowing for an understanding of microbial community structures in relation to metadata. The most popular approach for visualizing microbiome data is through Principal Coordinates Analysis (PCoA) (Gower, 2014) in which individual samples are plotted on a scatter plot. Like classical principal component analysis (PCA), the coordinates of each sample are determined based on capturing the greatest variability in the data, but whereas PCA focuses on linear transformations, PCoA allows for better capture of nonlinear transformations. Operationally, PCoA is performed by calculating a matrix of pair-wise dissimilarity between samples, where the dissimilarity measure is thought to be ecologically relevant and captures certain aspects of community structure (e.g., phylogeny, presence/absence, and abundance of taxa, etc.). The dissimilarity matrix is then transformed to a matrix of pair-wise similarity through Gower centering, and the principal coordinates are calculated as the eigenvectors of the similarity matrix. Such analyses have enabled a better understanding of many conditions and even the discovery of possible enterotypes (clusters) (The Human Microbiome Project Consortium, 2012; Arumugam et al., 2011).
In longitudinal microbiome studies, PCoA could provide information on how community structures change over time and how these changes correlate with variables of interest. However, guidance on how to carry out PCoA in longitudinal studies including multiple samples from the same subjects is lacking. PCoA strategies for repeated measures, such as in longitudinal studies, face additional challenges due to the inherent correlation between repeated observations from the same subjects. Currently, data across all subjects and time points are amalgamated, and plots are generated in the same way as in cross-sectional studies. This approach, however, may not be suitable when the goal is to analyze the temporal dynamics or subject-specific effects.
In longitudinal studies, factors such as subject clustering, irrelevant variables, and time effects often dominate the variability, overshadowing structures related to the variables of interest. Applying PCoA without adjustments for repeated measures may obscure important temporal patterns or subject-level effects, as the method assumes that all samples are independent. For example, high correlation between samples from the same subject can distort shifts over time or distort relationships with other variables.
How to accommodate these obfuscating effects in longitudinal analysis remains unclear. Our proposed method accounts for repeated measures by incorporating random effects and covariates to model within-subject correlations. This approach yields more accurate visualizations of temporal changes and effects of interest, ensuring that the primary sources of variability reflect the variables of interest rather than confounding factors.
For longitudinal microbiome studies, we propose a strategy to mitigate the effects of variables and data characteristics that may obscure the primary structures of interest in PCoA plots. This approach is also applicable to other repeated measures study designs, such as clustered microbiome measurements from individuals sharing households. Therefore, throughout this discussion, we will refer to repeated measures designs more broadly. Our proposed framework involves removing the confounding effects from the pair-wise similarity matrix while accommodating the repeated-measure nature of the data. Our framework is similar to covariate-adjusted PCoA (Shi et al., 2020), which is used for cross-sectional studies, but it also accounts for correlation among observations by incorporating random effects in a linear mixed model (LMM). Specifically, we estimate the similarity matrix, adjust out potential obfuscating effects from each PC of the similarity matrix using LMMs, and reconstruct the similarity matrix for usual PCoA analysis using the residuals from the LMM. Since there are multiple notions of residuals in LMMs (Verbeke et al., 1997), we consider multiple concepts of residuals (including marginal and standardized residuals) and provide guidance on their recommended use.
We find that our approach effectively distills the most important axes of microbiome community variation while reducing the influence of nuisance covariates in our visualizations, all while leveraging shared information across distinct time points. However, we also found that relying on marginal or conditional residuals from LMMs can be inadequate for certain analytic objectives, as unwanted structures may persist. This persistence is due to dependencies introduced by the replacement of parameters with their estimates, a challenge that is particularly pronounced in dependent data (Wakefield, 2013). To overcome these challenges, we further recommend standardization of residuals as an essential step to mitigate dependencies when the dependencies are not of primary interest. Collectively, we find that our approach and recommendations offer the ability to facilitate understanding of shifts in community structure in relation to time or other variables of interest.
In the following sections, we first review PCoA before describing our proposed strategies for adjusting out uninteresting effects. We then apply our approach within simulated examples to illustrate the potential utility and to offer specific guidance. Finally, we demonstrate the utility of our approach in two real data sets before concluding with a brief discussion.
In this section, we briefly review the usual PCoA and covariate adjusted PCoA for cross-sectional studies before presenting our proposed strategy for accommodating repeated measures study designs. We then discuss the simulation setup for some illustrative scenarios.
Consider a cross-sectional (single time point) microbiome profiling study in which the abundances of
PCoA begins by constructing a matrix of pair-wise dissimilarities between each pair of samples,
After calculation of
where
The PCs represent lower-dimensional embeddings of the data. For visualization, the top PCs are plotted against each other to generate PCoA plots. Specifically, the PCoA plot is a scatter plot where each point corresponds to a separate sample, and the coordinates of each point (sample) are determined by the value of the PCs. In practice, only the top few (sometimes only the top two) PCs are used for visualization, even though the proportion of variability explained may be modest.
A limitation of PCoA is that the PC directions can be driven by confounding variables, denoted
Essentially, one is re-centering
One way of justifying this approach is the following. We first calculate the matrix
By regressing out the effect of the covariates
Importantly, however, although aPCoA is useful for removing covariate effects, it cannot directly handle repeated measures designs. This approach assumes that each sample is independent, which is not the case for repeated measures data. In such data, samples taken from the same subject over time are correlated, and failing to account for this correlation can result in misleading visualizations where the effects of repeated measures dominate the patterns of interest.
In contrast, our method, detailed in the following section, extends traditional aPCoA by incorporating linear mixed models (LMMs) that account for both fixed effects (e.g., treatment, age) and random effects (e.g., subject-level variability) to properly adjust for the repeated measures structure. By adjusting for within-subject correlations, this method ensures that temporal changes in microbiome profiles are more accurately captured, and that variability due to repeated measures does not obscure key patterns related to covariates or treatment effects.
As before, we assume that we have profiled
As earlier, the goal is to adjust
With these considerations in mind, we propose the following steps for our method, which are also illustrated in the workflow in Figure 1. Before applying it, we recommend normalizing the microbiome data to account for differences in library sizes across samples. Specifically, we suggest using the centered log-ratio (CLR) transformation on relative abundances in conjunction with the Aitchison kernel matrix. By expressing each feature as a log-ratio relative to the geometric mean of all relative abundances in a sample, CLR reduces the influence of total sequencing depth, making the data more comparable across samples. Additionally, CLR-transformed data are more amenable to linear transformations, which makes them particularly well-suited for methods that rely on linear modeling, such as our approach. The Aitchison kernel is ideal for compositional microbiome data, as it respects the relative nature of the data and ensures that variations in sequencing depth do not bias the results. Throughout the rest of the text, we use the Aitchison kernel for these reasons. However, if an alternative kernel matrix, such as Bray-Curtis, is needed, then relative abundance data may be more appropriate, as CLR-transformed data are not suitable for such distance measures. Therefore, users should choose between raw count, relative abundance, or CLR-transformed data based on the kernel matrix and specific analysis objectives, with the Aitchison kernel being the preferred choice for compositional data.
1. Kernel Construction: Embed microbiome data
2. Kernel PCA: We then obtain kernel PCs,
3. Retain Key Kernel PCs: Retain the top
4. Covariate Adjustment: Regress kernel PC
where
5. Standardize Residuals: Obtain estimated standardized residuals
Now,
6. PCoA on Reconstructed Adjusted Kernel Matrix: Then as in aPCoA, we reconstruct the adjusted kernel matrix
7. Visualize: The top PCs, or first few columns, of
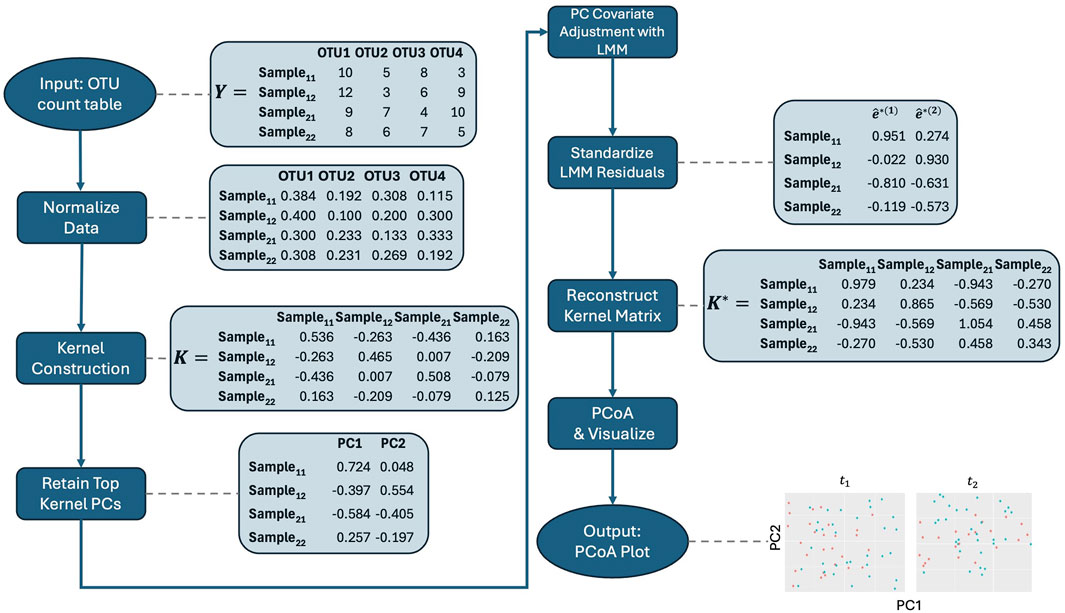
Figure 1. Workflow for the adjusted PCoA method applied to repeated measures microbiome data. The process starts with data normalization, followed by kernel construction. Kernel principal coordinates are extracted and adjusted for covariates using linear mixed models. The residuals are standardized, and the adjusted kernel matrix is reconstructed before visualizing the top principal coordinates using PCoA. Note that the data shown are illustrative and do not directly lead to the final plot displayed in the figure.
Note that in Step 3, we drop a few of the PCs that explain very small proportions of the variability. This step is not theoretically necessary but is important in practice as the low variability of the tail eigenvectors leads to difficulties in fitting the mixed models. Due to the low percentage of variability explained, their removal typically does not affect the overall visualization.
For supplementary analyses comparing the proposed kernel-based aPCoA and aPCoA on CLR-transformed data, please refer to the Supplementary Material.
The core of our proposed strategy for PCoA with repeated measures is to adjust out the effects of variables that obscure or confound visualization. The specific variables that should be included inside of
Time-invariant covariates are variables that remain constant over time, such as treatment arm, sex, and binary smoking history. We first explore a simulated example where we aim to visualize how microbiome profiles evolve in relation to a time-invariant covariate (treatment arm, in this simulation). However, this visualization is obscured by the influence of another time-invariant covariate (sex, in this simulation). Specifically, we consider a hypothetical microbiome study where a treatment assigned at baseline affects community diversity over time for some individuals. Our goal is to visually assess whether microbiome profiles differ across treatment arms, but the influence of sex obscures this visualization, so we wish to adjust for it.
For this scenario, we simulated a longitudinal dataset with repeated measurements from
Let
To simulate taxa counts at
We repeat these steps to generate taxa counts for
We compared the proposed method described in Section 2.2 to the aPCoA method for cross-sectional studies, as outlined in Section 2.1, and to an approach where we only adjusted for sex as a fixed effect.
For the aPCoA approach, we first stratified all data points by time. Within each stratum, we embedded the simulated microbial counts into an Aitchison distance, generated a kernel matrix, and obtained the kernel PCs. We then regressed each kernel PC on sex in a linear model, computed the residuals, and derived the PCs from the resulting residuals matrix. Finally, we plotted PC2 against PC1 for each time point.
For the fixed-effect-only approach, we embedded all simulated microbial counts
For the proposed aPCoA approach for repeated measures, we embedded the simulated microbial counts
While the first example focused on two time-invariant covariates, we now consider a situation where the primary interest remains a time-invariant covariate (again, treatment). However, in this scenario, a time-varying covariate influences the microbiome profiles over time, obscuring the visualization of the time-invariant effect. A hypothetical example might involve a treatment effect of interest, but with some subjects falling ill at various points during the study. The illness impacts the microbiome profiles, but the timing of sickness varies across subjects.
For this scenario, we simulated data on
For subsequent time points,
We compared the proposed method described in Section 2.2 to the aPCoA method for cross-sectional studies, as outlined in Section 2.1, and to an approach where we only adjusted for sickness status as a fixed effect.
For the aPCoA approach, we first stratified all data points by time. Within each stratum, we embedded the simulated microbial counts into an Aitchison distance, generated a kernel matrix, and obtained the kernel PCs. We then regressed each kernel PC on sickness status in a linear model, computed the residuals, and derived the PCs from the resulting residuals matrix. Finally, we plotted PC2 against PC1 for each time point.
For the fixed-effect-only approach, we embedded all simulated microbial counts
For the proposed aPCoA approach for repeated measures, we embedded the simulated microbial counts
Here, we address a related yet distinct issue. Instead of repeated measurements arising from a longitudinal study design, repeated measures in this case result from the hierarchical structure of the data, where observations are nested within higher-level units. For example, we may have microbiome measurements from multiple members of the same households or from multiple body sites within individuals. Unlike in the previous two sections, these data are not longitudinal, but they may exhibit cluster heterogeneity that we may or may not wish to highlight in visualizations.
In this simulation, the observations are microbiome measurements from individuals within families sharing a household. Each family member undergoes a different treatment during a trial, which affects their microbiome profiles. The similarity in microbiome profiles due to household membership obscures the treatment effect we aim to visualize. Without addressing the clustering effect, data points would naturally cluster based on household membership. By effectively mitigating the clustering effect, we allow other sources of variation to emerge in the visualizations.
We simulated data for
We generated
We aimed to compare visualizations that either account for or ignore the confounding effect of cluster (familial) membership on the treatment effect. We applied the standard PCoA approach as in Section 2.1, making no adjustments. We compared this to the proposed aPCoA approach for repeated measures as in Section 2.2. Following the same procedure as before, we retained the top
The standard PCoA plots of PC2 vs. PC1 visualize microbiome profiles without accounting for cluster membership, while the aPCoA plots using standardized residuals account for this clustering effect.
Figure 2A shows the aPCoA for cross-sectional data plots of microbiome profiles stratified by time point and one can see that the treatment effect is difficult to distinguish, particularly at earlier times, with the plotted points on top of each other due to the effects of sex. The difference due to treatment is not apparent until

Figure 2. Adjusted principal coordinates analysis (aPCoA) plots of a simulated longitudinal dataset where a time-invariant covariate (sex) obscures the treatment effect (
Figure 2B shows that adjusting using a linear model to account only for the fixed effect of sex is insufficient to fully remove the sex effect. While the separation between treatment and control groups is slightly more discernible compared to the unadjusted case in Figure 2A, the plots still indicate a strong influence of sex, particularly at later time points (e.g.,
Figure 2C demonstrates that the proposed aPCoA method for repeated measures successfully removes the confounding sex effect. Unlike in Figure 2B, where the sex effect dominates, in Figure 2C, the separation between treatment and control groups is clearly visible across all time points after baseline, with no clear separation of the male and female subjects. This indicates that the method effectively adjusts for the sex effect, allowing the treatment effect to emerge distinctly in the visualization. Compared to the plot in Figure 2A, the plot in Figure 2C illustrates the differences in community profiles earlier, which better reflects the true underlying model. This demonstrates the utility in borrowing information across all time points and the value of having longitudinal data. Moreover, the data points appear to segregate in a more meaningful way; treatment points migrate towards the right side of the plot as time progresses. This trend would not be guaranteed if we simply stratified microbiome profiles by time without proper adjustment, as the PCoA rotations at each time point would not necessarily be consistent with rotations at other time points.
Figure 3A displays the standard aPCoA plot, stratified by time. Similar to the previous section, the treatment effect is difficult to discern, and no distinct patterns emerge, indicating that the variability in the microbiome profiles is largely dominated by other factors.
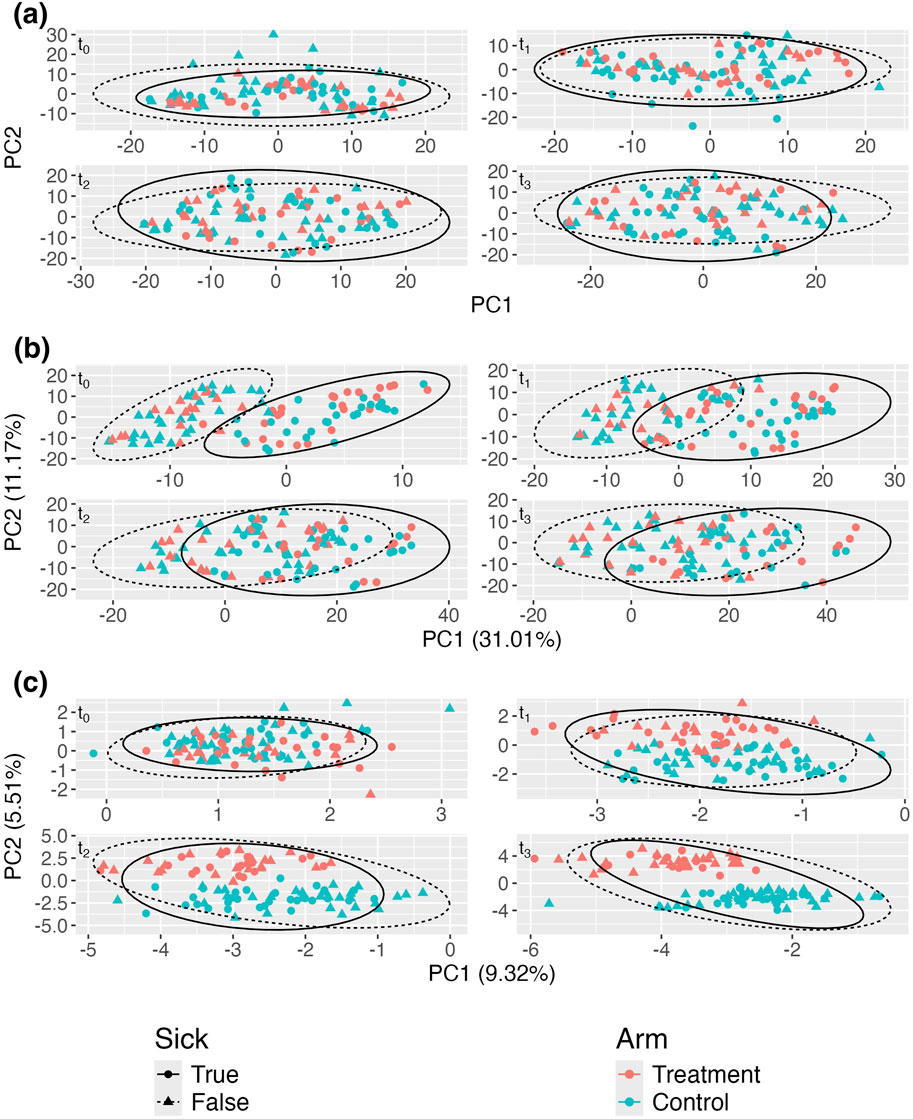
Figure 3. Adjusted principal coordinates analysis (aPCoA) plots of a simulated longitudinal dataset where a time-varying covariate (sickness status) confounds the treatment effect (
In Figure 3B, despite adjusting for sickness status as a fixed effect, the variability continues to be primarily driven by sickness. Due to the impact of repeated measures, the plot still propagates the variability associated with sickness status, further obscuring the treatment effect. However, Figure 3C reveals a much clearer distinction between treatment and control groups after adjusting for sickness status and person-specific random intercepts. This adjustment effectively isolates the treatment effect, demonstrating its influence more distinctly in the data. The comparison between these plots underscores the importance of incorporating random effects to account for confounding variables, like sickness status, to accurately visualize treatment effects in longitudinal studies.
The standard PCoA plot and aPCoA for repeated measures are shown in Figure 4. When using standard PCoA, the clustering effect due to family membership is not removed, making it challenging to visualize the treatment arm effect, as subjects cluster by family. However, using the proposed approach effectively removes the cluster effect, revealing clear segregation by treatment arm.
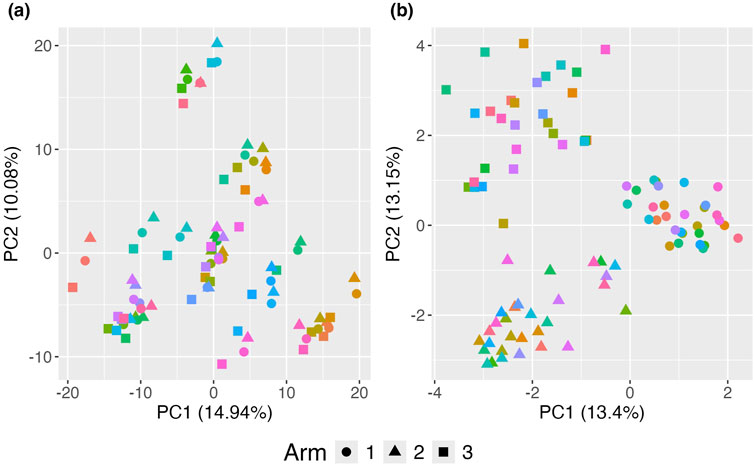
Figure 4. Principal Coordinates Analysis (PCoA) plots illustrating the impact of clustering on the visualization of treatment effects. (A) Standard PCoA plot without any adjustments, showing microbiome profiles without accounting for familial clustering. The variability due to clustering obscures the treatment effect, making it difficult to distinguish between treatment arms. (B) Proposed adjusted PCoA (aPCoA) plot for repeated measures, accounting for familial clustering. The treatment effect becomes clearer, with distinct separation between treatment arms, emphasizing the importance of adjusting for clustering in the analysis. Different families are represented by different colors, and treatment arms are indicated by different shapes.
While this example focuses on a scenario where the primary interest is in the treatment effect, there may be situations where understanding clusters is of greater importance. In such cases, not adjusting for clustering might better reveal the variability of interest. Moreover, in such situations, aPCoA still allows for the option to adjust for other variables that may be less relevant.
We applied our proposed framework to data on 126 subjects from the Menopause Strategies: Finding Lasting Answers for Symptoms and Health (MsFLASH) Vaginal Health Trial. The trial aimed to identify microbial, immune, or metabolic markers associated with response to topical treatment for postmenopausal symptoms of vaginal discomfort. Over the course of a 12-week randomized trial, postmenopausal women were randomly assigned to a vaginal discomfort treatment of vaginal estradiol tablet plus placebo gel (arm 1), vaginal moisturizing gel plus placebo tablet (arm 2), or placebo gel and tablet (arm 3). Investigators profiled vaginal microbiota samples taken at 0, 4, and 12 weeks via 16S ribosomal RNA gene sequencing (Mitchell et al., 2021).
To visualize the data, we restricted our analysis to patients who had complete data measured at all three visits. We excluded taxa with zero counts across all patient measurements, resulting in 373 taxa. We used our proposed strategy with Aitchison distance, age at enrollment as a fixed effect in the LMM and included a random intercept for each subject. Adjusted PCoA plots using standardized residuals are show in Figure 5.

Figure 5. Adjusted Principal Coordinates Analysis (aPCoA) plot for repeated measures of vaginal microbiome profiles from the MsFLASH trial, evaluating the impact of vaginal estradiol tablets and/or vaginal moisturizing gel at 0, 4, and 12 weeks. Points are colored by treatment arm: vaginal estradiol tablet plus placebo gel (Arm 1), vaginal moisturizing gel plus placebo tablet (Arm 2), and placebo gel and tablet (Arm 3).
At Week 0, the clusters of data points for all groups overlap substantially, indicating a similar microbiome composition among the groups at the baseline. By Week 4, the data points start to show more separation, particularly for arm 3, although there is still considerable overlap among the groups. At Week 12, the separation between groups becomes more pronounced, especially for the arms 2 and 3, suggesting that microbiome composition changes over time are treatment-dependent.
Overall, the aPCoA plot indicates that while there are pre-treatment similarities in microbiome composition among the groups (which is as expected since subjects had not yet been treated), distinct changes emerge over the 12-week period, highlighting the temporal dynamics of the vaginal microbiome in response to the treatments.
We further applied the proposed framework to the data from the DIABIMMUNE study. The study examined the gut microbiome of 39 children via 16S rRNA sequencing of stool samples and clinical information during their first 3 years of life (Yassour et al., 2016). Microbiome data were collected from participants aged between 40 and 1,105 days. Each participant underwent 16 to 32 repeated microbiome assessments, with a median of 26 measurements per individual, resulting in a total of 1,018 observations across the study. We excluded taxa that had zero counts for all measurements, leaving us with 178 taxa. We performed the steps as in 2.2 on all observations, but for the visualization in step 7, we restricted attention to the observations that occurred during the first 200 days of life.
As earlier, we used Aitchison distance and in our procedure retained the top
In Figure 6, panel (a) presents the data without accounting for repeated measurements on subjects using the standard PCoA approach, where the two time groups exhibit significant overlap. In contrast, panel (b) shows the data when repeated measurements on subjects are considered using the proposed approach. Compared to panel (a), clear separation emerges, with the earlier time group forming a tighter cluster and the later time group exhibiting a broader spread. This indicates that microbiome compositions in this sample evolve over time. However, this evolution is obscured when repeated measurements are not accounted for, as seen in the standard PCoA approach, where points from the same subjects tend to cluster together.
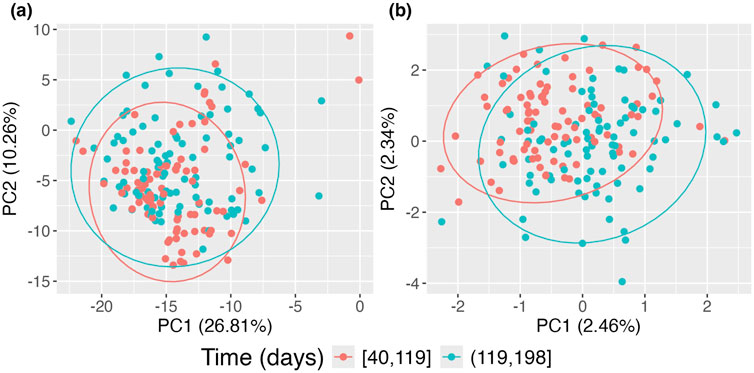
Figure 6. Principal Coordinates Analysis (PCoA) plots of DIABIMMUNE data restricted to the first 200 days of life. (A) Standard PCoA plot; (B) adjusted PCoA approach for repeated measures. Points are colored according to time of observation.
The results of the proposed kernel-based aPCoA analysis revealed clear temporal patterns. We also performed supplementary comparisons using CLR-transformed aPCoA, and the results are provided in the Supplementary Material for further insight on the differences between these approaches.
While PCoA is useful for visualizing microbiome data, it is challenging to visualize data from longitudinal and clustered measures due to obscuring variables and inherent clustering. Following the approach of adjusted PCoA for cross-sectional data, we presented a general strategy for adjusting out variables that may obscure effects within a linear mixed model framework. Our results demonstrate the importance of accounting for repeated measures in microbiome studies. While traditional PCoA and aPCoA provides useful insights into microbiome structure for cross-sectional data, it does not account for the correlations between repeated samples from the same subjects, which can obscure the temporal dynamics and subject-level effects. By incorporating linear mixed models to adjust for these correlations, our approach provides more accurate visualizations of temporal patterns and treatment effects, allowing researchers to more effectively explore how microbiome profiles evolve over time. This method is particularly valuable for longitudinal studies, where repeated measures are common and require careful handling to avoid biased results.
Although we presented some possible cases, we emphasize that no single approach is universally appropriate for all situations. One must carefully consider which variables to adjust and whether to reduce effects of clustering, depending on the study and analytic objectives. In general, we suggest constructing unadjusted plots, over time, to identify major variables that may be making the visualization more challenging. These can then be included as fixed and random effects as appropriate. Similarly, visualization of clustering effects can be used to ascertain whether adjustment would be helpful.
One facet of our approach is that the proportion of variability explained by variables may change after adjustment. The proportion explained by variables of interest could increase or decrease depending on the variable and the specific study, but in either case, one should avoid testing associations between beta-diversity and variables of interest [e.g., permanova (Anderson, 2001; Zhao et al., 2015)] using the corrected PCs or the corrected similarity matrices.
Our proposed strategy relies heavily on linear mixed models and accordingly, is similarly constrained by the limitations of the LMM. In particular, LMMs typically assume normality of the outcomes (in this case the PCs rather than the taxonomic abundances) and random effects, and we have focused only on modeling linear main effects of the variables. Similarly, sufficiently large sample size is necessary to fit these models stably. While it is possible to consider more sophisticated models that mitigate these limitations within the context of LMMs, we emphasize that our focus is on visualization rather than formal inference. Therefore, deviations from the usual distributional assumptions do not affect the statistical validity of the visualization. The requirement for sufficient sample size is important, but as longitudinal microbiome studies continue to get larger, this issue will be resolved. However, larger sample sizes will further emphasize the need for adjusted procedures like ours to uncover more subtle signals.
Our proposed kernel-based aPCoA method provided more distinct separation and clearer visualization of temporal patterns compared to the simpler CLR-transformed aPCoA approach. While the results from the CLR-transformed method were broadly consistent, the visualizations were less distinct and failed to capture some of the more subtle temporal dynamics. These supplementary findings, detailed in the Supplementary Material, highlight the advantages of the kernel-based method in handling repeated measures and covariate adjustment, despite the potential trade-off in methodological complexity. The kernel-based approach ultimately offers better results in handling repeated measures and covariate adjustment, making it the superior choice in more complex datasets.
An important aspect of our approach is the preprocessing of input microbiome data, particularly the decision to normalize the data. The use of the centered log-ratio (CLR) transformation, paired with the Aitchison kernel matrix, proved effective in handling compositional microbiome data and addressing issues related to differences in sequencing depth. Normalization via CLR ensured that the data were comparable across samples, leading to more meaningful visualizations. However, users should carefully consider their choice of transformation and kernel matrix, as these decisions can significantly impact the results of the analysis.
In particular, when we constructed a Bray-Curtis kernel matrix using relative abundance data, the resulting visualizations were less meaningful, likely due to the kernel’s inability to appropriately account for the compositional nature of the data. This underscores the importance of choosing a kernel matrix and data transformation that align with the underlying structure of microbiome data. For studies where relative abundance is the focus or where compositionality is less of a concern, a Bray-Curtis kernel matrix may be suitable. However, for compositional data, the Aitchison kernel matrix, combined with CLR, remains the preferred choice due to its ability to properly handle the relative nature of microbiome datasets. In addition to these choices, some kernel matrices, such as UniFrac, account for phylogenetic relationships between taxa. In studies where evolutionary history plays a central role, a kernel matrix based on UniFrac could provide valuable insights by incorporating this phylogenetic information. However, for compositional data where relative abundances are of primary interest, the Aitchison kernel remains the preferred choice. Future research could further explore the impact of using different kernel matrices, such as phylogeny-aware approaches like UniFrac, to extend the applicability of our method to a broader range of microbiome studies.
Additionally, while the choice of normalization and kernel matrix plays a key role in the success of the method, the performance of our approach remains robust as long as appropriate preprocessing steps are applied. In future studies, exploring how different transformations and kernel matrices impact the visualization of longitudinal and repeated measures microbiome data could further enhance the applicability of this method across a wider range of microbiome studies.
The MsFLASH vaginal microbiota sequences have been deposited in the National Center for Biotechnology Information (NCBI) Sequence Read Archive (SRA), accession PRJNA788936. The DIABIMMUNE data have been deposited in NCBI BioProject, accession PRJNA290381.
AL: Conceptualization, Data curation, Formal Analysis, Investigation, Methodology, Software, Visualization, Writing–original draft, Writing–review and editing. RD: Data curation, Resources, Writing–review and editing. AZ: Conceptualization, Methodology, Writing–review and editing. NZ: Methodology, Writing–review and editing. WL: Conceptualization, Data curation, Methodology, Supervision, Writing–review and editing. MW: Conceptualization, Data curation, Formal Analysis, Investigation, Methodology, Supervision, Visualization, Writing–original draft, Writing–review and editing.
The author(s) declare that financial support was received for the research, authorship, and/or publication of this article. This research was supported by the National Institutes of Health (R01-GM151301, MCW; R01-GM155734, WL).
The authors declare that the research was conducted in the absence of any commercial or financial relationships that could be construed as a potential conflict of interest.
The author(s) declared that they were an editorial board member of Frontiers, at the time of submission. This had no impact on the peer review process and the final decision.
All claims expressed in this article are solely those of the authors and do not necessarily represent those of their affiliated organizations, or those of the publisher, the editors and the reviewers. Any product that may be evaluated in this article, or claim that may be made by its manufacturer, is not guaranteed or endorsed by the publisher.
The Supplementary Material for this article can be found online at: https://www.frontiersin.org/articles/10.3389/fgene.2024.1480972/full#supplementary-material
Aitchison, J. (1982). The statistical analysis of compositional data. J. R. Stat. Soc. Ser. B Stat. Methodol. 44 (2), 139–160. doi:10.1111/j.2517-6161.1982.tb01195.x
Anderson, M. J. (2001). A new method for non-parametric multivariate analysis of variance. Austral Ecol. 26 (1), 32–46. doi:10.1111/j.1442-9993.2001.tb00081.x
Arumugam, M., Raes, J., Pelletier, E., Le Paslier, D., Yamada, T., Mende, D. R., et al. (2011). Enterotypes of the human gut microbiome. Nature 473 (7346), 174–180. doi:10.1038/nature09944
Chen, J., Bittinger, K., Charlson, E. S., Hoffmann, C., Lewis, J., Wu, G. D., et al. (2012). Associating microbiome composition with environmental covariates using generalized UniFrac distances. Bioinformatics 28 (16), 2106–2113. doi:10.1093/bioinformatics/bts342
Feng, Q., Liang, S., Jia, H., Stadlmayr, A., Tang, L., Lan, Z., et al. (2015). Gut microbiome development along the colorectal adenoma–carcinoma sequence. Nat. Commun. 6 (1), 6528. doi:10.1038/ncomms7528
Gower, J. C. (2014). “Principal coordinates analysis,” in Principal coordinates analysis, 9. Wiley StatsRef: Statistics Reference Online, 1–7. doi:10.1002/9781118445112.stat05670.pub2
Jackson, M. A., Goodrich, J. K., Maxan, M.-E., Freedberg, D. E., Abrams, J. A., Poole, A. C., et al. (2016). Proton pump inhibitors alter the composition of the gut microbiota. Gut 65 (5), 749–756. doi:10.1136/gutjnl-2015-310861
Larsen, N., Vogensen, F. K., van den Berg, F. W. J., Nielsen, D. S., Anne, S. A., Pedersen, B. K., et al. (2010). Gut microbiota in human adults with type 2 diabetes differs from non-diabetic adults. PLoS ONE 5 (2), e9085. doi:10.1371/journal.pone.0009085
Lawrence, A. D., Maurice, C. F., Carmody, R. N., Gootenberg, D. B., Button, J. E., Wolfe, B. E., et al. (2014). Diet rapidly and reproducibly alters the human gut microbiome. Nature 505 (7484), 559–563. doi:10.1038/nature12820
Lozupone, C., and Knight, R. (2005). UniFrac: a new phylogenetic method for comparing microbial communities. Appl. Environ. Microbiol. 71 (12), 8228–8235. doi:10.1128/AEM.71.12.8228-8235.2005
Lozupone, C. A., Hamady, M., Kelley, S. T., and Knight, R. (2007). Quantitative and qualitative beta diversity measures lead to different insights into factors that structure microbial communities. Appl. Environ. Microbiol. 73 (5), 1576–1585. doi:10.1128/AEM.01996-06
Mitchell, C. M., Ma, N., Mitchell, A. J., Wu, M. C., Valint, D. J., Proll, S., et al. (2021). Association between postmenopausal vulvovaginal discomfort, vaginal microbiota, and mucosal inflammation. Am. J. Obstetrics Gynecol. 225 (2), 159.e1–159.e15. doi:10.1016/j.ajog.2021.02.034
Qin, J., Li, Y., Cai, Z., Li, S., Zhu, J., Zhang, F., et al. (2012). A metagenome-wide association study of gut microbiota in type 2 diabetes. Nature 490 (7418), 55–60. doi:10.1038/nature11450
Roger Bray, J., and Curtis, J. T. (1957). An ordination of the upland forest communities of southern Wisconsin. Ecol. Monogr. 27 (4), 325–349. doi:10.2307/1942268
Shi, Y., Zhang, L., Do, K.-A., Peterson, C. B., and Jenq, R. R. (2020). aPCoA: covariate adjusted principal coordinates analysis. Bioinformatics 36 (13), 4099–4101. doi:10.1093/bioinformatics/btaa276
The Human Microbiome Project Consortium (2012). Structure, function and diversity of the healthy human microbiome. Nature 486 (7402), 207–214. doi:10.1038/nature11234
Turnbaugh, P. J., Ley, R. E., Mahowald, M. A., Vincent, M., Mardis, E. R., and Gordon, J. I. (2006). An obesity-associated gut microbiome with increased capacity for energy harvest. Nature 444 (7122), 1027–1031. doi:10.1038/nature05414
Verbeke, G., Molenberghs, G., and Verbeke, G. (1997). Linear mixed models for longitudinal data. Springer.
Wang, Y., Wiesnoski, D. H., Helmink, B. A., Gopalakrishnan, V., Choi, K., DuPont, H. L., et al. (2018). Fecal microbiota transplantation for refractory immune checkpoint inhibitor-associated colitis. Nat. Med. 24 (12), 1804–1808. doi:10.1038/s41591-018-0238-9
Yassour, M., Vatanen, T., Siljander, H., Hämäläinen, A.-M., Härkönen, T., Ryhänen, S. J., et al. (2016). Natural history of the infant gut microbiome and impact of antibiotic treatment on bacterial strain diversity and stability. Tech. Rep. doi:10.1126/scitranslmed.aad0917
Zackular, J. P., Rogers, M. A. M., Ruffin, M. T., and Schloss, P. D. (2014). The human gut microbiome as a screening tool for colorectal cancer. Cancer Prev. Res. 7 (11), 1112–1121. doi:10.1158/1940-6207.CAPR-14-0129
Keywords: longitudinal, temporal, microbiome, PCoA, visualization method, kernel matrix
Citation: Little A, Deek RA, Zhang A, Zhao N, Ling W and Wu MC (2024) Enhanced visualization of microbiome data in repeated measures designs. Front. Genet. 15:1480972. doi: 10.3389/fgene.2024.1480972
Received: 14 August 2024; Accepted: 16 October 2024;
Published: 15 November 2024.
Edited by:
Huilin Li, New York University, United StatesReviewed by:
Haixiang Zhang, Tianjin University, ChinaCopyright © 2024 Little, Deek, Zhang, Zhao, Ling and Wu. This is an open-access article distributed under the terms of the Creative Commons Attribution License (CC BY). The use, distribution or reproduction in other forums is permitted, provided the original author(s) and the copyright owner(s) are credited and that the original publication in this journal is cited, in accordance with accepted academic practice. No use, distribution or reproduction is permitted which does not comply with these terms.
*Correspondence: Amarise Little, YW1hcmlzZUBmcmVkaHV0Y2gub3Jn
Disclaimer: All claims expressed in this article are solely those of the authors and do not necessarily represent those of their affiliated organizations, or those of the publisher, the editors and the reviewers. Any product that may be evaluated in this article or claim that may be made by its manufacturer is not guaranteed or endorsed by the publisher.
Research integrity at Frontiers
Learn more about the work of our research integrity team to safeguard the quality of each article we publish.