- 1Genomics Division, National Institute of Agricultural Sciences, Rural Development Administration, Jeonju, Republic of Korea
- 23BIGS Co., Ltd., Suwon, Republic of Korea
- 3Pear Research Institute, National Institute of Horticultural and Herbal Science, Rural Development Administration, Naju, Republic of Korea
Pears constitute an essential temperate crop and are primarily produced through interspecific hybridization owing to self-incompatibility that complicates their breeding history. To address this, we sequenced the complete chloroplast (cp) genomes of 18 Pyrus and one Malus species using the Illumina HiSeq4000 platform. The cp genomes ranged from 159,885 bp to 160,153 bp and exhibited a conserved circular DNA structure with an average GC content of 36.5%. Each cp genome contained 127 genes, including 83 protein-coding, 36 tRNA, and 8 rRNA genes. Divergence analysis with mVISTA showed high conservation in the coding regions and notable variations in the non-coding regions. All species shared 17 intron-containing genes, with ycf3 and clpP each having two introns. Five intron-containing genes (ndhB, rpl2, rps12, trnA-UGC, and trnE-UUC) were located in the inverted repeat regions, while trnL-UAA was located in the large single-copy region, with conserved intron lengths across Pomoideae. We identified polymorphic intron sequences in the rpl22, petB, clpP, ndhA, and rps16 genes and designed primers for these regions. Notably, the two Pyrus ussuriensis accessions Doonggeullebae and Cheongdangrori showed intron-length polymorphisms despite being classified as the same species. Phylogenetic analysis of the cp genome sequences revealed two major clusters, indicating distinct maternal lineages and evolutionary origins. This study underscores the importance of cp gene polymorphisms in P. fauriei, P. calleryana, P. ussuriensis, and P. pyrifolia, providing valuable insights into Pyrus evolution as well as aiding in the conservation and breeding of pear germplasm.
1 Introduction
Pears (Pyrus) are among the most highly valued fruit crops within the Rosaceae family and are some of the oldest cultivated fruits, with a history exceeding 3000 years (Rubtsov, 1944). These fruits are widely grown across diverse geographical regions, including Europe, North America, Central Asia, Asia Minor, and East Asia. Based on their geographical distribution, pears are classified into occidental (European) and oriental (Asian) pears (Hedrick et al., 1924). With 22 known species and over 5,000 varieties, pears are distributed across temperate regions in Europe, Asia, and northern parts of the United States (Monte-Corvo et al., 2001). The most prominent European pear is P. communis, while the main varieties of Asian pears include P. pyrifolia, P. bretschneideri, P. ussuriensis, P. calleryana, and P. fauriei. European pears are typically bell-shaped with smooth flesh and a strong aroma, whereas Asian pears are generally round with crisp flesh, mild flavor, and high sugar content (Wu et al., 2018).
Owing to their self-incompatibility, pears are frequently products of natural and artificial interspecific hybridization that have resulted in extensive genetic variations (Sassa et al., 1992; Claessen et al., 2019). Modern breeding programs aim to meet the increasing demand for pears by improving the available varieties through genetic selection and hybridization. To achieve these goals, a thorough understanding of the genetic diversity and relationships among pear accessions is crucial.
Chloroplast (cp) are dynamic photosynthetic organelles in green plant cells and contain their own genetic systems; cp genomes are characterized by small sizes, high copy numbers, uniparental inheritance, and low rates of recombination and mutation, serving as valuable genetic resources for species identification and phylogenetic studies (Wicke et al., 2011). Additionally, the study by Jansen et al. (2007) demonstrated that cp genomes show fewer genetic changes over time compared to nuclear genomes (Jiang et al., 2023). The stability and slow evolution of cp DNA make it particularly useful for resolving complex phylogenetic relationships in angiosperms; cp genome sequencing also provides insights into genetic relationships and evolutionary history across various plant families (Graham and Olmstead, 2000; Li et al., 2024). Compared to nuclear genomes, cp genomes are smaller, less prone to recombination, and have lower nucleotide substitution rates, making them ideal for phylogenetic and evolutionary studies (Allen, 2015; Abreu et al., 2018).
One of the defining characteristics of cp genomes is their slow evolutionary change; this makes cp genomes particularly useful for studying long-term evolutionary relationships and tracing lineage-specific variations (Wicke et al., 2011). Despite their structural conservation, cp genomes can undergo rearrangements, including deletions and duplications, which can contribute to phylogenomic analyses and understanding of species evolution (Graham and Olmstead, 2000).
Pear breeding programs have been underway for over a century to enhance the pear varieties and ensure their market sustainability. Interspecific hybridization has resulted in improved varieties with superior fruit qualities. Various cp-based molecular markers have been developed to distinguish accessions and understand the genetic as well as phylogenetic relationships among wild and domesticated plants (Dong et al., 2012; Bi et al., 2018; Li et al., 2020). For instance, studies on the genetic diversity and parentage of pear accessions using cp markers have provided significant insights into their breeding history and evolutionary trajectories (Ferradini et al., 2017; Li et al., 2018). Similarly, research on cp genome comparisons among the pear varieties has elucidated the phylogenetic relationships and genetic diversity within the genus Pyrus (Yue et al., 2018; Chung et al., 2019).
Sequencing the cp genomes of the Asian pear species is pivotal for elucidating their genetic relationships and evolutionary history. Advances in next-generation sequencing (NGS) technologies have accelerated cp genome availability in land plants, including those in the Rosaceae family. Comparative analyses of cp genomes across the Pyrus species have revealed conserved regions and genetic variations essential to the phylogenetic studies and breeding programs (Ferradini et al., 2017; Li et al., 2018; Yue et al., 2018).
In this study, we sequenced and assembled the complete cp genomes of 18 Pyrus and one Malus species to investigate the evolutionary history and genetic diversity within Pyrus. We focused on the conserved coding sequences (CDSs) and identified several intron-containing genes (clpP, ndhA, rps16, petB, and rpl22) with notable polymorphisms. Remarkably, two P. ussuriensis accessions Doonggeullebae (DG) and Cheongdangrori (CDR) exhibited intron-length polymorphisms despite being classified within the same species. This research provides significant insights into the genetic relationships and evolutionary dynamics of the Pyrus species to facilitate their conservation and breeding. Additionally, this study contributes to broader understanding of cp genome evolution as well as its application in phylogenetic and genetic studies in temperate fruit crops.
2 Results
2.1 Chloroplast genome characterization
2.1.1 General cp genome features
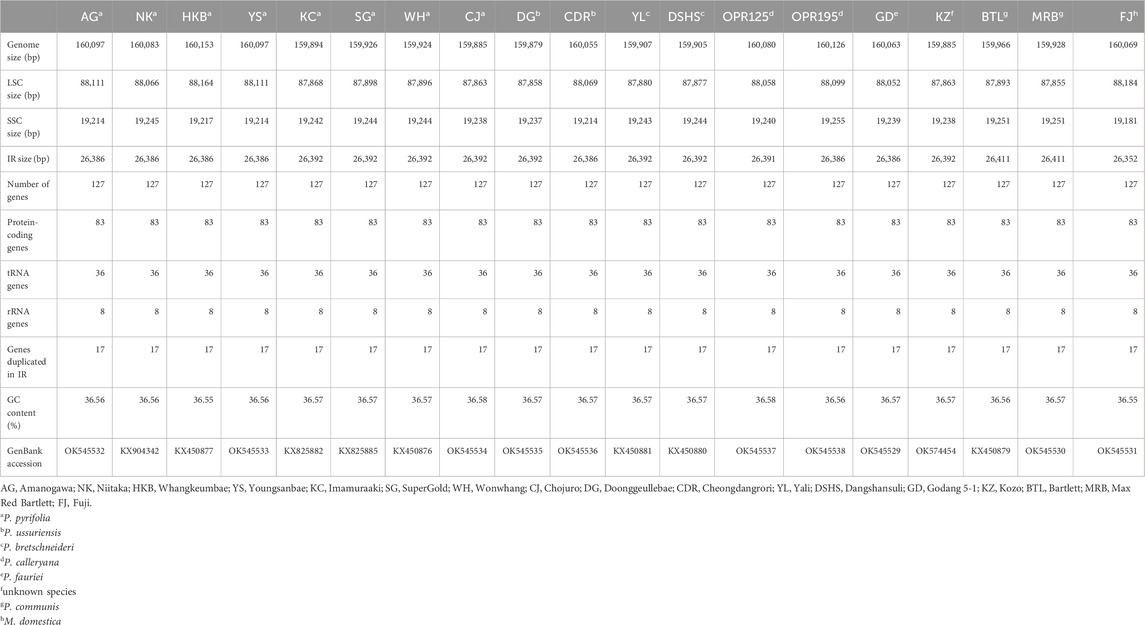
In this study, the cp genomes of 19 species (8 of P. pyrifolia, 2 of P. ussuriensis, 2 of P. bretschneideri, 2 of P. calleryana, 2 of P. communis, 1 of P. fauriei, 1 unknown, and 1 of M. domestica) were sequenced using the Illumina platform HiSeq4000. The accessions belonging to P. pyrifolia include Amanogawa (AG), Niitaka (NK), Whangkeumbae (HKB), Youngsanbae (YS), Imamuraaki (KC), SuperGold (SG), Wonwhang (WH), and Chojuro (CJ). The two accessions of P. ussuriensis are DG and CDR, and those of P. bretschneideri are Yali (YL) and Dangshansuli (DSHS); the two accessions of P. calleryana are OPR125 and OPR195; Bartlett (BTL) and Max Red Bartlett (MRB) are the two types of European pears (P. communis) used, and Godang 5-1 (GD) is the P. fauriei variety used; lastly, Fuji (FJ) variety of the M. domestica taxon and the unknown species Kozo (KZ) are sequenced. The cp genome sequences of the 19 species were deposited in GenBank, and their accession numbers are listed in Table 1. Similar to other land plants, all the assembled cp genomes exhibit conserved circular DNA and quadripartite structures (Figure 1). The lengths of the genomes ranged from 159 kb (10 species) to 160 kb (9 species) (Table 1). The DG variety of P. ussuriensis has the smallest genome size (159,879 bp), while the HKB variety (160,153 bp) has the largest genome size. Each of the 19 genomes included four parts, namely, a large single-copy (LSC), a small single-copy (SSC), and a pair of inverted repeat (IR) regions (denoted as IRa and IRb). The length of each region is displayed in Table 1. The average GC content of all the genomes was ∼36.5%, which was nearly identical in all 19 genomes analyzed herein. The GC contents of the LSC, SSC, and IR regions were ∼34%, ∼30%, and 43%, respectively, and the higher GC contents observed in the IR regions were attributed to the presence of four GC-rich duplicated rRNA genes. In total, all the Pyrus and the Malus species showed similar sizes, nucleotide compositions, and region arrangements.
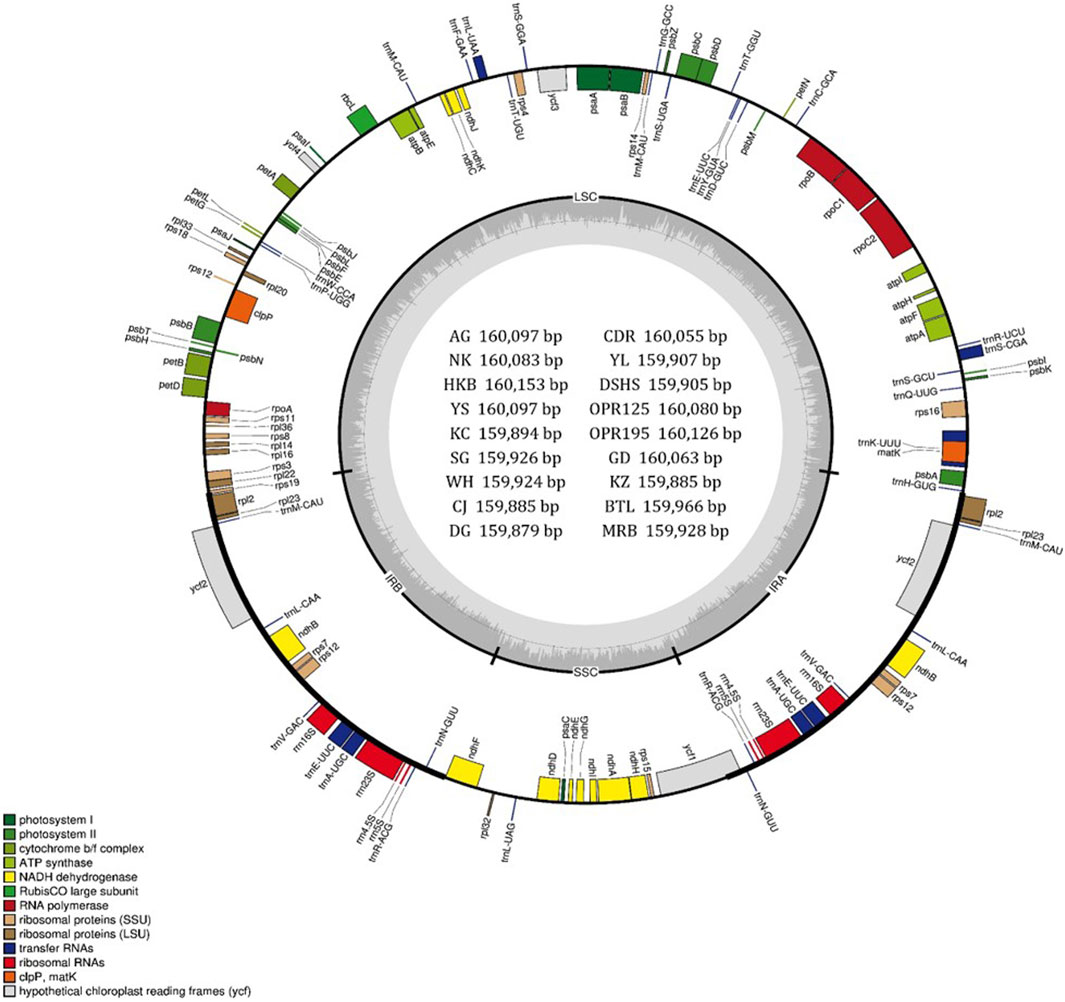
Figure 1. Gene map of the chloroplast (cp) genomes of 18 Pyrus species. The two thick lines indicate the extent of the inverted repeat (IRa and IRb) regions that divide the genome into the small single-copy (SSC) and large single-copy (LSC) regions. Genes on the outside of the circle are transcribed in the counterclockwise direction while those inside the circle are transcribed in the clockwise direction. Genes belonging to different functional groups are color-coded. The dark gray and light gray of the inner circle correspond to the GC and AT components, respectively. The map was drawn using OGDRAW. The cp genomes in the inner circle are Amanogawa (AG), Niitaka (NK), Whangkeumbae (HKB), Youngsanbae (YS), Imamuraaki (KC), SuperGold (SG), Wonwhang (WH), Chojuro (CJ), Doonggeullebae (DG), Cheongdangrori (CDR), Yali (YL), Dangshansuli (DSHS), Godang 5-1 (GD), Kozo (KZ), Bartlett (BTL), and Max Red Bartlett (MRB).
2.1.2 Gene structure
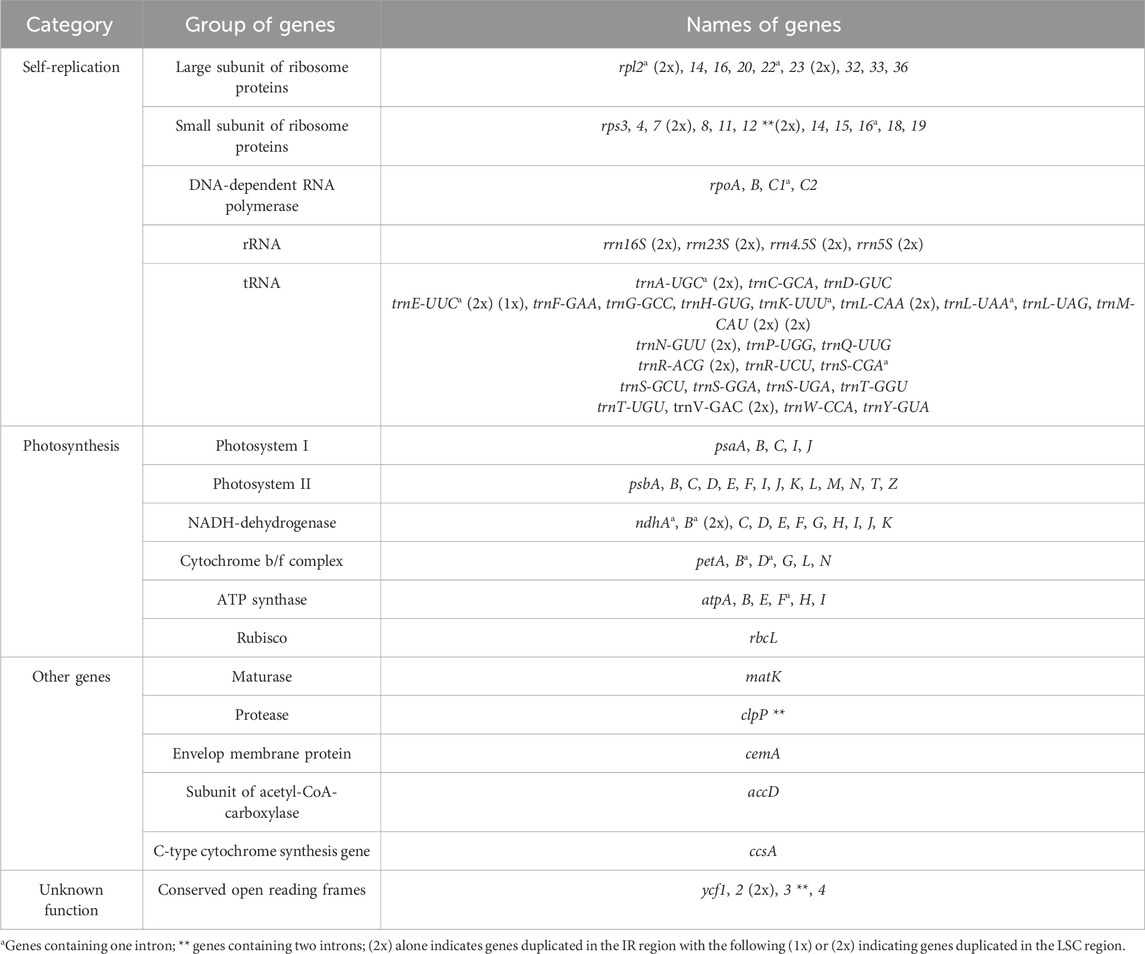
The cp gene numbers typically range from 110 to 130 in land plants, particularly in fruit trees of the Rosaceae family (Daniell et al, 2016; Xue et al, 2019). In this study, all the Pyrus and Malus species had the same number of functional genes (127 genes), including 83 protein-coding, 36 tRNA, and 8 rRNA genes (Table 2; Supplementary Table S1). There were 17 duplicate genes, namely, trnA-UGC, trnE-UUC, trnL-CAA, trnM-CAU, trnR-ACG, trnV-GAC, trnN-GUU, rps7, rps12, rpl2, rpl23, ndhB, ycf2, rrn16S, rrn23S, rrn4.5S, and rrn5S, in the IR region, and two genes trnE-UUC and trnM-CAU in the LSC region (Table 2). Furthermore, 17 intron-containing genes were found in all the sequenced species, of which 15 genes (trnA-UGC, trnE-UUC, trnK-UUU, trnL-UAA, trnS-CGA, rps12, rps16, rpl2, rpl22, rpoC, ndhA, ndhB, petB, petD, and atpF) have one intron, while ycf3 and clpP have two introns each (Supplementary Table S2).
2.2 Chloroplast genome characterization
2.2.1 Comparison of intron length
The one Malus and 18 Pyrus cp genomes possessed 17 common intron-containing genes (5 tRNA and 12 protein-coding genes). Five of these intron-containing genes located in the IR region, namely, ndhB, rpl2, rps12, trnA-UGC, and trnE-UUC, as well as the trnL-UAA gene located in the LSC region, appear to have the same intron lengths as those found in the Pomoideae conserved sequences. Highly polymorphic cp genomes in the Aster species were shown to have the same intron lengths for two genes (rpl2 and trnA-UGC) located in the IR region (Tyagi et al., 2020). We observed the same intron lengths in all pears with trnK-UUU, and the first introns of the ycf3 and rpoC1 genes as well as the second intron of the ycf3 gene showed Asian pear conserved sequences. One P. ussuriensis accession (CDR) and the AG group have the same CDSs in the cp genome (Supplementary Table S2). AG is the mother plant of NK, while HKB and YS are the progenies of NK. We named the AG group with AG, NK, HKB, and YS accessions as they have the same matrilineage. Additionally, in the KC group, KC and SG have the same mother cp background. Two of the cp genome sequences of P. bretschneideri shared the same intron lengths as the KC group. The large size variations in the genes clpP (35 bp, first with 10 bp and second with 25 bp), ndhA (28 bp), petB (11 bp), rpl22 (20 bp), and rps16 (43 bp) could assist the insertion–deletion (InDel) polymorphism markers in the classification of Pyrus and Pomoideae. We designed the primers for the exon region and amplified these regions to obtain the polymorphic intron lengths. Our previous study on the development of cp-genome-based InDel markers using clpP and ndhA involved detection of these intron-length polymorphisms in agarose gel. We denote KZ as an unclassified species; from the intron-length analysis, it was found that the intron length of KZ was exactly similar to that of the DG and KC groups; hence, we propose that its cp inheritance may be from P. ussuriensis or P. pyrifolia. Itai and Fujita (2008) noted in their study of the CAPS analysis of 1-aminocyclopropane-1-carboxylate synthase genes that KZ may belong to P. pyrifolia. Comparisons of the intron lengths of these versatile species with similar species showed that they are assembled and annotated uniformly. Because the complete cp genome was assembled and annotated in the same pipeline, this helped to correctly classify and compare the sequences.
2.2.2 Divergence analysis
The complete cp genome sequences of 18 Pyrus and one Malus species were compared using the mVISTA program (Supplementary Figure S1) and KC as the reference. The results clearly demonstrate that the genomes are highly conserved between the species. As reported previously in other genera (Alzahrani, 2021; Munyao et al, 2020) we observed that the conservation of the coding regions is greater than that of the non-coding regions. Additionally, the differences in the IR regions are less common than those of the single-copy regions. A comparison of the intron lengths in this study, in which five of the genes are located in the IR region, did not show variance in length (Table 3). The ycf2 gene showed a 6-bp difference between the species, and it was the only gene modification identified in the exon region. The other most significant divergent regions include rps16–trbQ, trnR–atpA, trnE–psbD, psbZ–trnG, trnT–trnL, ndhC–trnM, trnM–atpE, accD–psal, petB–petD, rps3–rpl22, ndhF–trnL, and ndhA (Supplementary Figure S1). The genomes of P. communis and M. domestica showed markedly more variations compared to those of the other Asian pear varieties.
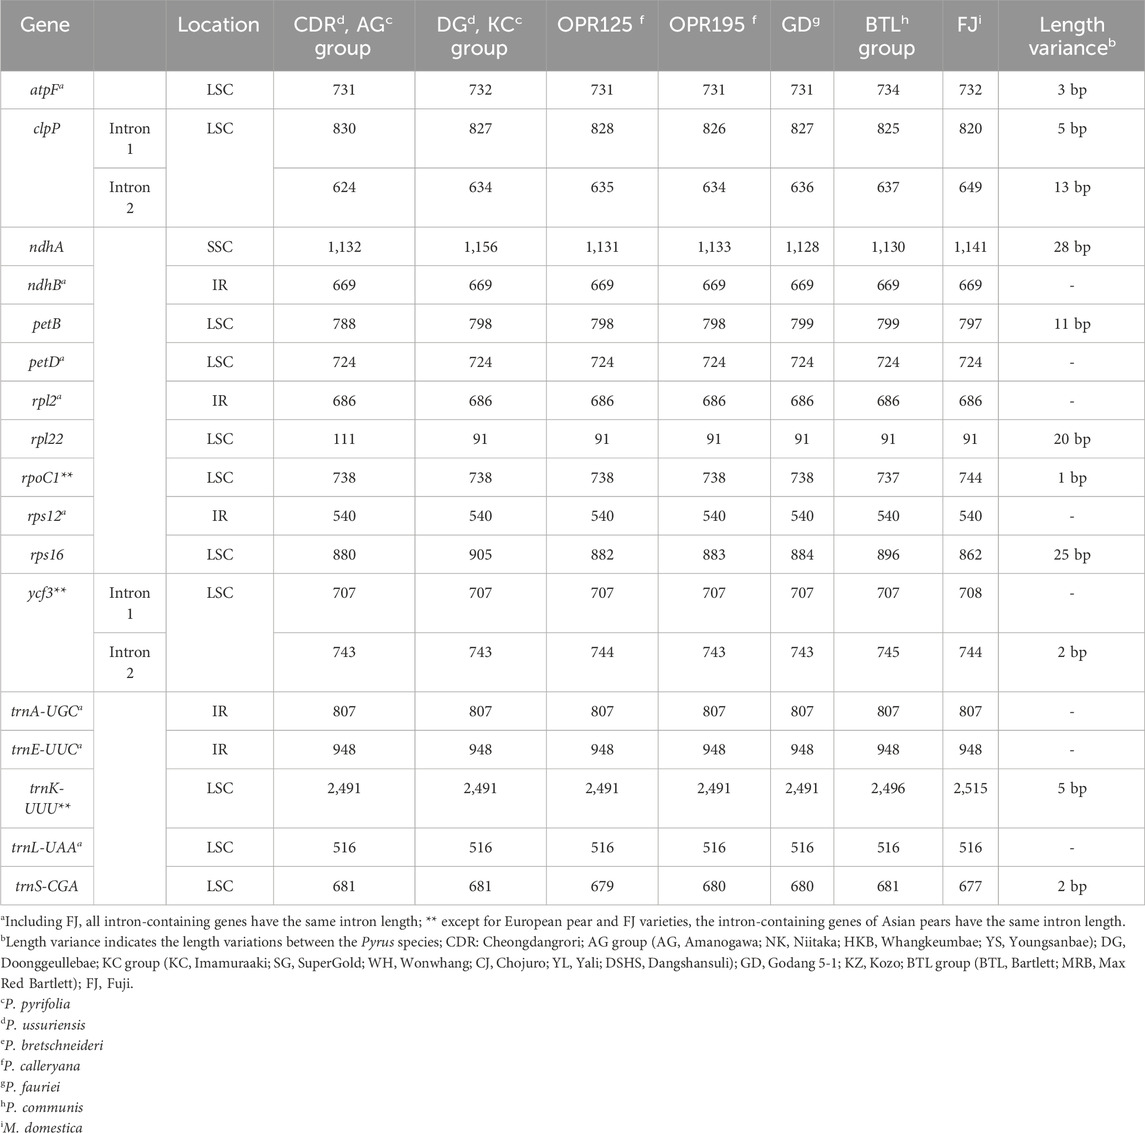
Table 3. Comparison of intron lengths in the chloroplast genomes of the 18 Pyrus and 1 Malus species.
To clarify the cp genome comparisons, four accessions were selected and analyzed using mVISTA with KC as the reference. Based on the sequence alignment, two P. ussuriensis accessions (CDR and DG) showed dynamic polymorphisms (Figure 2). Two deletion sequences with 22 bp in DG-trnT-GGU-psbD and 5 bp in DG-ndhF-rpl32 were detected as the cp genome of the KC reference, whereas numerous polymorphisms are detected in DG and CDR. These divergent regions could be used as potential markers for identifying the accessions of both Asian and European pears.
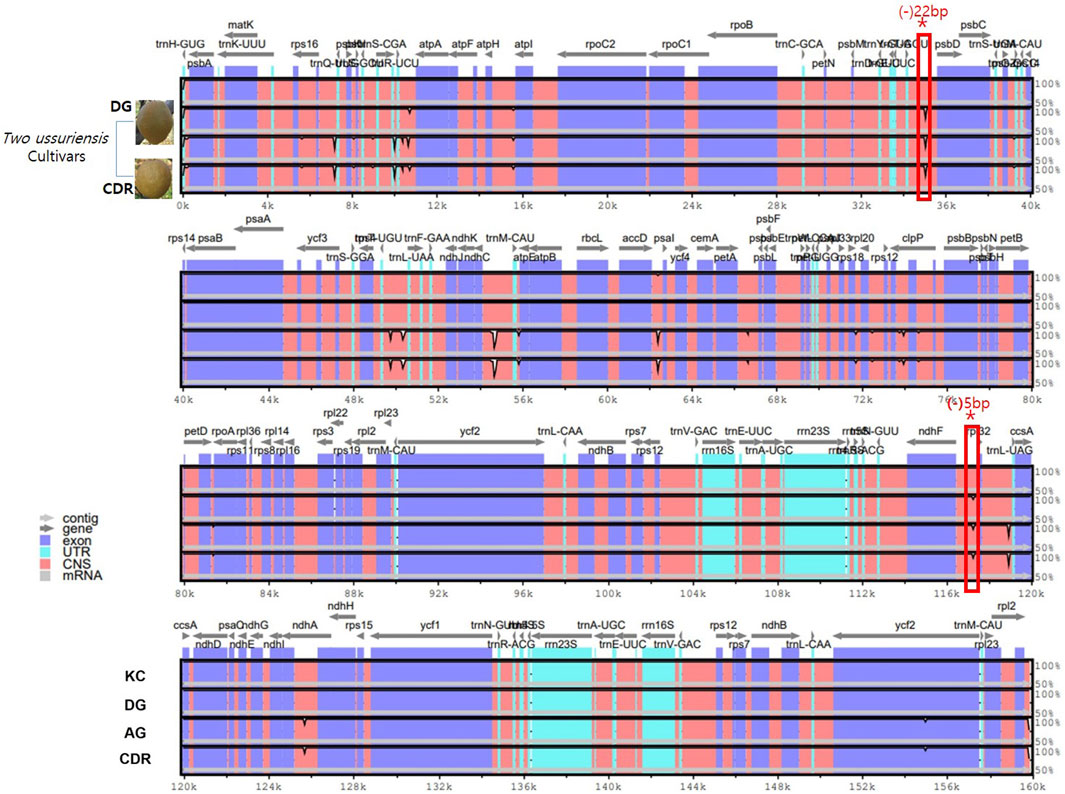
Figure 2. Divergence analysis using sequence alignment of four Pyrus cp genomes using mVISTA with KC as the reference. The vertical scale indicates the percentage of identity, which ranges from 50% to 100%. The horizontal axis indicates the coordinates within the cp genome. The genomic regions are color-coded. Two of the P. ussuriensis accessions are shown on lanes 2 and 4. The rectangular box highlighted in red color shows the detected deletion sequences for 22 bp in DG-trnT-GGU-psbD and 5 bp in DG-ndhF-rpl32 that are shared by DG and CDR.
2.2.3 Application of InDel polymorphism markers in the classification of Pyrus
We designed five primers for the set of genes rpl2, petB, clpP, ndhA, and rps16. These amplicon products were adjusted to approximately 400 bp each (Table 4). The amplified polymorphic patterns were divided into two groups; the first mainly showed two different sizes between the (DK, KC) and (CDR, AG) groups (Figure 3A); the second involved two differentiations between these groups along with versatile polymorphisms in the speciation (Figure 3B). The rpl22, petB, and clpP genes in the CDR and AG groups were detected with deleted sequences, while the other genes did not show any polymorphism (Figure 3A). Thus, we can have shared polymorphisms in the Pyrus species before its speciation. Figure 3B shows that the Pyrus genome also has other InDels with speciation evolution.
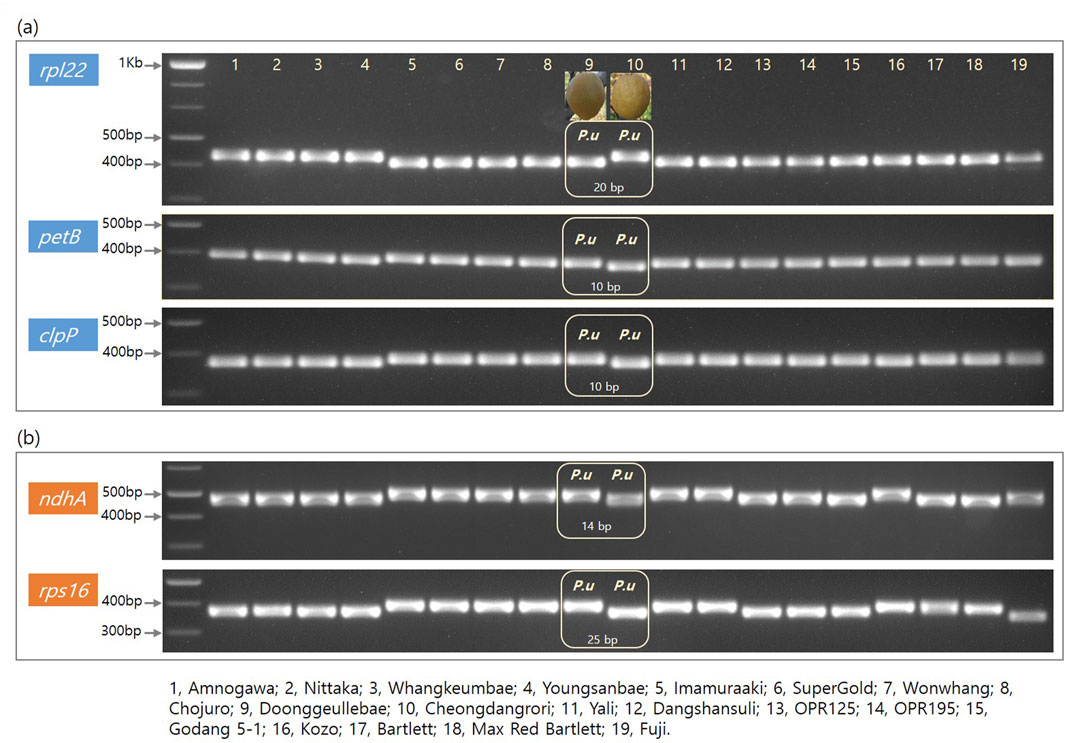
Figure 3. Electroporation photos for five genes from the cp genome of 18 Pyrus and one Malus species. Columns 1–19 are arranged in the following order: Amanogawa, Niitaka, Whangkeumbae, Youngsanbae, Imamuraaki, SuperGold, Wonwhang, Chojuro, Doonggeullebae, Cheongdangrori, Yali, Dangshansuli, OPR125, OPR195, Godang 5-1, Kozo, Bartlett, Max Red Bartlet, and Fuji. The gene names and size markers are shown along the left axis.
2.2.4 Phylogenetic analysis
Completed cp genomes, CDSs, and CDSs + introns of the LSC, SSC, and IR regions were used to construct a phylogenetic tree of the 18 Pyrus species, and the Malus species was used as the outgroup. The phylogenetic tree using the coding and intron sequences showed clustering of two groups (Figure 4). The first cluster comprised one P. ussuriensis (DG), four P. pyrifolia (KC, SG, WH, and CJ), two P. bretschneideri (YL and DSHS), and the unknown (KZ) species. The second cluster included one P. ussuriensis (CDR) and four P. pyrifolia (AG, YS, NK, and HKB) species. NK is the maternal species to YS and HKB, while AG is the maternal species to NK. Interestingly, two P. bretschneideri accessions (YL and DSHS) were also grouped in the DG and KC branches, even though these accessions are mainly cultivated in Mainland China. The OPR125 and OPR195 accessions of P. calleryana as well as GD accession of P. fauriei were found to be parental nodes in different branches. From this phylogenetic tree, it is clear that the two accession groups of Asian pears (AG and KC) originated from GD (P. fauriei). These results are consistent with the complete phylogenetic tree constructed using CDSs (Supplementary Figure S1A) and complete genomes (Supplementary Figure S1B); furthermore, the three different phylogenic trees are the same without GD and the OPR125 node when using cp CDSs.
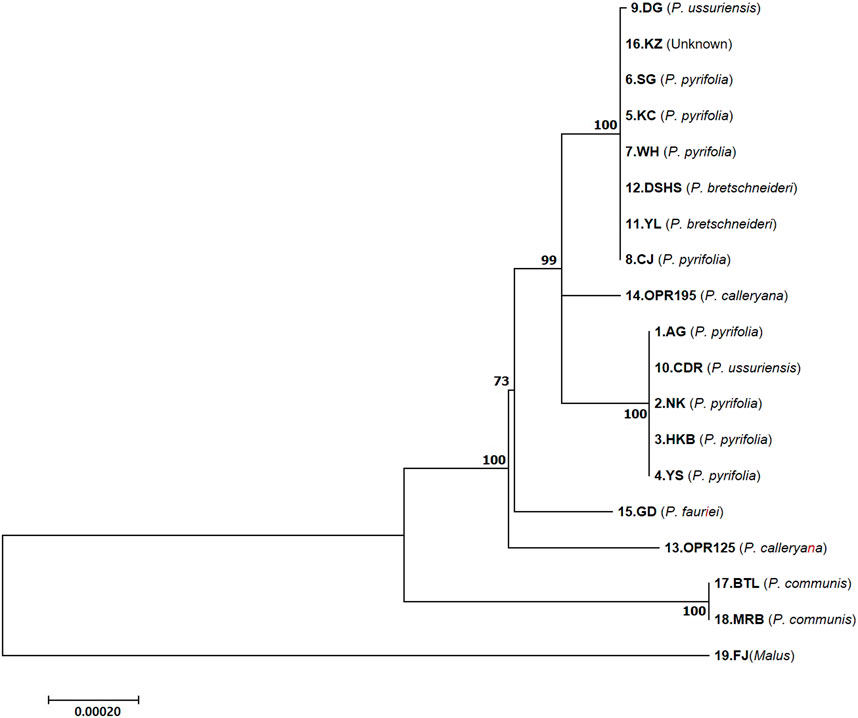
Figure 4. Maximum likelihood phylogenetic tree of the 18 Pyrus and one Malus species based on the coding sequences (CDSs) + introns of the different regions of the cp genomes. The bootstrap support values (>50%) from 1,000 replicates are indicated at the nodes. The numbers below and above the branch points represent the confidence levels of the relationships between the paired sequences, as determined by bootstrap statistical analysis. The tree is drawn to scale, with the branch lengths measured in terms of substitutions per site. DK, Doonggeullebae; KZ, Kozo; SG, SuperGold, KC, Imamuraaki; WH, Wonwhang; DSHS, Dangshansuli; YL, Yali; CJ, Chojuro; AG, Amanogawa; CDR, Cheongdangrori; NK, Niitaka; HKB, Whangkeumbae; YS, Youngsanbae; GD, Godang 5-1; BTL, Bartlett; MRB, Max Red Bartlett; FJ, Fuji.
3 Discussion
Recent research on the Rosaceae family has achieved significant strides in understanding its evolutionary dynamics and genetic diversity through cp genome analysis. A recently reported study involved sequencing and comparison of the cp genomes of several species within the Rubus genus. Eight newly assembled cp genomes were compared, and the most diverse regions were found to be the intergenic spacers, including rps16–trnQ, trnL–trnT, and rpl32–trnL–ccsA (Yu et al., 2022). In addition, comparative cp genomics of the Rubus family showed that there were significant differences in the lengths and positioning of four genes: rbcL and psaB are involved in photosynthesis, matK is associated with cp class II intron splicing, and rpl32 is related to protein synthesis. The authors suggested that these genes may have experienced special evolutionary history (Lu et al., 2024). Comparison of the entire cp genome sequence of the Qixiadaxiangshui pear showed several mutation hotspots with precise Pi values, such as ndhC-trnM-CAU and trnR-UCU-atpA. These regions are known to undergo faster nucleotide substitutions at the species level, providing important references for the development of DNA barcodes (Jiao et al., 2024). We report that the other most significant divergent regions include rps16–trbQ, trnR–atpA, trnE–psbD, psbZ–trnG, trnT–trnL, ndhC–trnM, trnM–atpE, accD–psal, petB–petD, rps3–rpl22, ndhF–trnL, and ndhA (Supplementary Figure S1). Almost all of the cp genome comparative analysis regions show codon usage changes and microsatellites. The current study is limited by the sample size and versatile species used; however, we expanded the study with seven species of pear and newly assembled their pipeline along with comparative analysis.
The analysis was confined to the cp genome, which represents only the maternal lineage. A more comprehensive understanding of evolutionary history would require additional research incorporating nuclear and mitochondrial genomes. The cp analysis of various species was aimed at examining these correlations along with compilation of the largest genetic resources. Reconstruction of the largest pedigree network for pear accessions and evaluation of the genetic diversity of the USDA-ARS national Pyrus collection study was published in 2020. This involved the Applied Biosystems Axiom Pear 70 K Genotyping Array and allowed high-density single-nucleotide polymorphism (SNP)-based genotyping of almost the entire collection. A total of 1,890 diploid Pyrus spp. samples, two haploids, and five intergenic hybrids (xPyronia = Pyrus × Cydonia; xSobopyrus = Sorbus × Pyrus) were found. Removal of the duplicates resulted in 1,331 unique genotypes. After filtering for missing data and Mendelian errors, a total of 62,673 SNPs remained (Montanari et al., 2020). We divided the two P. ussuriensis accessions as types I and II. Here, type I was mainly composed of P. pyrifolia and P. pyrifolia/ussuriensis hybrid (P. hybrid) accessions, which are the CDR and AG groups in this study. Type II were mostly clustered along the border regions and composed of P. calleryana, P. hybrid, P. communis pyraster, P. communis caucasica, P. pyrifolia, and P. communis accessions (Supplementary Figure S2).
De novo genome assembly of the wild pear (P. betulaefolia) is widely used as the rootstock. Dong et al. (2020) used a Venn diagram to obtain the shared and unique gene families among the P. betulaefolia, P. bretschneideri, and P. communis species. Orthologous clustering of these three sequenced pear genomes showed 22,658 gene families, which was far greater than those in the DSHS and Bartlett genomes in the phylogenetic analysis. However, P. betulaefolia and P. communis had 3,677 common gene families containing 9,272 common genes, which was larger than that between P. betulaefolia and P. bretschneideri that had 2,390 common gene families containing 5,629 common genes (Dong et al., 2020). There is no reproductive isolation in pear plants, which results in widespread interspecific hybridization. We seek to understand the evolution of the pear genome and construct its parentage clearly, which are limited by genome sequences of the different plant species and hybrid breeding technologies that affect the exact parentage history even with natural hybridization. Our InDel markers are amplified in the Malus species. Our study can therefore be expanded to the entire Pyrus germplasm collection to assist with the evaluation of the maternal heritage.
The evolution of the cp sequences is relatively slow and highly conserved between species within a genus (Dong et al., 2012). We utilized the InDel sequences and intron-length polymorphisms within the cp genomes to analyze the evolutionary relationships within the Rosaceae family and especially the Pyrus species. Based on our complete cp genome study, phylogenetic tree analysis, and development of five InDel markers and their applications, we suggest the pear evolution history (Figure 5). However, we did not study the P. betulaefolia and P. dimorphophylla accessions. We suggest that the three genes rpl22, petB, and clpP had deletion sequences in Pyrus in the LSC region neighboring the IRb region. The DG accession of P. ussuriensis forms the background of the AG group. The OPR195 and OPR125 wild pear accessions are derived from P. fauriei after undergoing three gene deletions each; there are also additional variations after speciation with the ndhA and rps16 genes. Type II P. ussuriensis comprises the DK cultivar, which is the ancestor of the KC cultivar and P. bretschneideri. The European pear is supposedly derived from the OPR125 variety of P. calleryana (Figure 5). The phylogenetic tree constructed using the complete cp genomes of the Rosaceae family had three branches of clustered species, with the Qixiadaxiangshui pear being clustered with the plants of the genera Crataegus and Malus on the same branch. The close clustering of the Qixiadaxiangshui (P. bretschneideri) pear with DSHS (P. bretschneideri), WH (P. pyrifolia), and YL (P. bretschneideri) suggests that these cultivars share a recent common ancestor (Jiao et al., 2024).
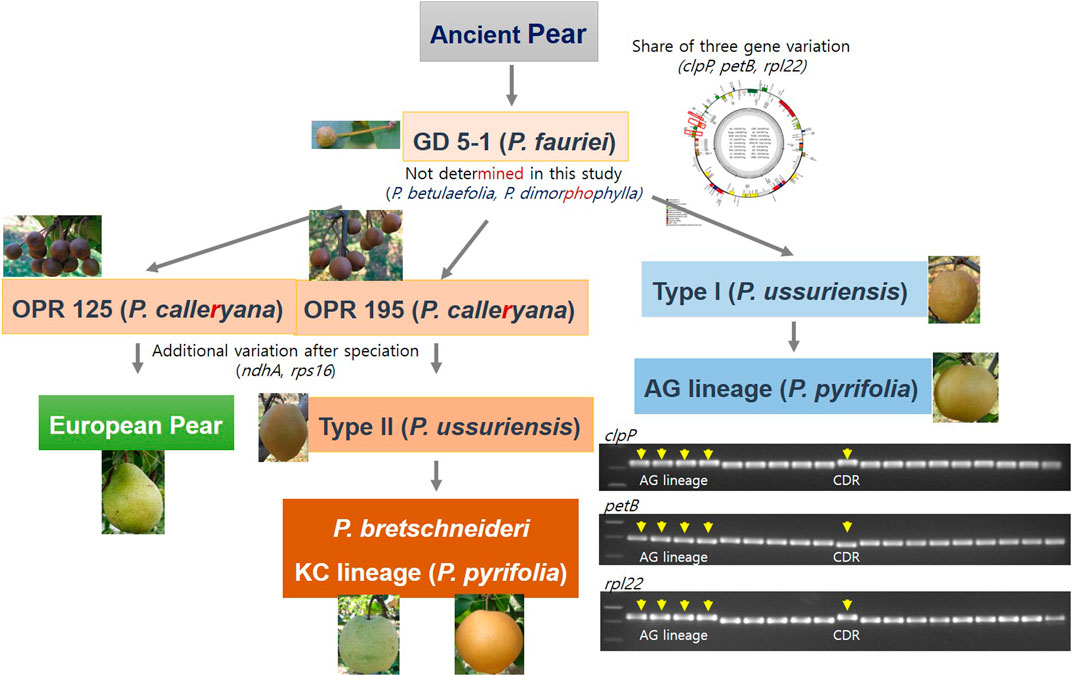
Figure 5. Evolutionary model of the versatile Pyrus species from the ancient pear variety. Five insertion–deletion markers were found in this study based on the analysis of 18 Pyrus and one Malus species.
Interestingly, two of the P. ussuriensis accessions have different fruit shapes; DK (type II) is ovate while CDR (type I) is round (Figure 5). One of the P. bretschneideri varieties had pyriform shape. Quantitative trait loci (QTL) analysis was carried out for HKB (P. pyrifolia, round) × YL (P. bretschneideri, pyriform) and high-resolution melting (HRM) markers were developed. The P. bretschneideri fruit shapes are versatile for the white pear (TSSR, round) and YL (pyriform).
We reported the InDel polymorphisms in the ndhA and clpP genes in 18 accessions of the Pyrus species. We used the findings from our previous study for comparisons and conducted complete cp genome sequencing as well as gene annotation. The plant genetics point toward good taste, color, and consumer requirement characteristics even for the intercross accessions obtained from breeding. Five InDel markers were determined in this study, which could assist in elucidating the maternal origins of the Asian and wild pear varieties. The results of this study can be used in the follow-up of other pear genetic resources to clarify pear genome evolution. It may also be necessary to integrate other types of molecular marker in the future for analyzing more recent evolutionary events.
4 Materials and methods
4.1 Plant materials
We used eight P. pyrifolia accessions (NK, HKB, AG, YS, WH, KC, SG, and CJ), an unknown accession (KZ), two P. ussuriensis accessions (DG and CDR), two P. bretschneideri accessions (YL and DSHS), one P. fauriei accession (GD), two European pear accessions (BTL and MRB), and a classified rootstock group with two P. calleryana accessions (OPR125 and OPR195) in this study. Additionally, the FJ accession of M. domestica was included in the sampling as an outgroup. The plant samples were collected from Naju (latitude: 35° 01′25.6″N, longitude: 126° 44′38.4″E), the Pear Research Station, NIHHS, RDA, Republic of Korea. Plastid genomic DNA was extracted from young leaves using a DNeasy Plant Mini kit (Qiagen, CA, United States of America) according to manufacturer instructions.
4.2 Chloroplast genome sequencing, assembly, and annotation
Whole-genome sequencing was performed using an Illumina genome analyzer (HiSeq4000, Illumina, United States of America) platform at Macrogen (http://www.macrogen.com/), Seoul, Republic of Korea. Genomic libraries with a 350 bp insert size were prepared using the paired-end standard protocol recommended by the manufacturer, and each sample was tagged separately with a different index. NGS was performed to obtain 25–30 Gb targets, and the total read bases (bp) were arranged from 24,000,528,290 (CJ) to 30,796,318,040 (MRB). The raw sequencing data were trimmed using the quality trim program in QIAGEN CLC Assembly Cell package version 4.2.1 (QIAGEN Digital Insights, Denmark) and used for de novo assembly of the cp genomes according to a previous study (Kim et al. 2015). In brief, trimmed high-quality reads were de novo assembled using the clc_novo_assemble program in QIAGEN CLC Assembly Cell, and the cp contigs were then selected and ordered through similarity searches with reported Pyrus cp genomes (MK488091.1, MK172841.1, MF521826.1, and LT996903.1). The selected contigs were merged, and their gaps were filled to generate the final complete cp genomes. The errors were corrected through read mapping and manual curation. The complete cp sequence was annotated using the GeSeq (Tillich et al, 2017) and Artemis (Carver et al, 2012) programs with reported Pyrus cp genomes. In addition, the precise gene spans were determined by manual curation using BLAST searches. Genes with CDS lengths different from those of other cp genomes were subjected to manual curation through comparisons with the other cp genomes. The circular cp genome map of the 18 Pyrus species was drawn using OGDRAW (Lohse et al., 2007).
4.3 Divergence analysis
The complete cp genome sequences of the 18 Pyrus and one Malus species were compared using mVISTA with LAGAN mode from the VISTA suite of tools (Mayor et al., 2000). The annotation of the KC variety was used as the reference. Pairwise alignment of the DNA sequences was performed with mVISTA and the AVID alignment algorithm; the mVISTA visualization module was used to display the global sequence alignment, with the genes displayed on top along with nucleotide variations of the base sequences.
4.4 InDel marker polymerase chain reaction (PCR) and electrophoresis
PCR analysis was performed in accordance with the procedures of Chung et al. (2019). The amplified fragments were electrophoresed with 2.5% agarose gels (Sigma, A0169, United States of America). The size markers were followed by the manufacturer’s 1 kb DNA ladder marker (Enzynomics, DM003, South Korea).
4.5 Phylogenetic analysis
The CDSs of 79 conserved protein-coding genes were extracted, and concatenated sequences were generated for each of the 19 cp genome sequences by combining their CDSs. In addition, the CDSs with introns of 78 conserved protein-coding genes (excluding the rps12 gene) were extracted, and concatenated sequences were generated for each of the 19 cp genome sequences. The concatenated sequences of CDSs and CDSs with introns were multiple aligned using the MAFFT program version 7 (https://mafft.cbrc.jp/alignment/server/index.html). (Katoh et al, 2019) Phylogenetic analyses were then performed on the aligned sequences using MEGA 7.0 (Kumar et al, 2016) with the maximum likelihood (ML) statistical method, general time reversible (GTR) substitution model, and bootstrapping with 1,000 replicates. For topological comparisons of the tree, whole cp genome sequences were used in the phylogenetic analyses.
Data availability statement
The datasets presented in this study can be found in online repositories. The names of the repositories and accession numbers can be found below: https://www.ncbi.nlm.nih.gov/, OK545532; https://www.ncbi.nlm.nih.gov/, KX904342; https://www.ncbi.nlm.nih.gov/, KX450877; https://www.ncbi.nlm.nih.gov/, OK545533; https://www.ncbi.nlm.nih.gov/, KX825882; https://www.ncbi.nlm.nih.gov/, KX825885; https://www.ncbi.nlm.nih.gov/, KX450876; https://www.ncbi.nlm.nih.gov/, OK545334; https://www.ncbi.nlm.nih.gov/, OK545335; https://www.ncbi.nlm.nih.gov/, OK545336; https://www.ncbi.nlm.nih.gov/, KX450881; https://www.ncbi.nlm.nih.gov/, KX450880; https://www.ncbi.nlm.nih.gov/, OK545337; https://www.ncbi.nlm.nih.gov/, OK545337; https://www.ncbi.nlm.nih.gov/, OK545229; https://www.ncbi.nlm.nih.gov/, OK574454; https://www.ncbi.nlm.nih.gov/, KX450879; https://www.ncbi.nlm.nih.gov/, OK545530; https://www.ncbi.nlm.nih.gov/, OK545531.
Author contributions
JK: conceptualization, funding acquisition, project administration, supervision, writing–original draft, and writing–review and editing. HC: data curation, investigation, validation, and writing–original draft. BP: investigation, software, visualization, and writing–original draft. KV: data curation, software, visualization, and writing–original draft. Y-KK: resources and writing–original draft.
Funding
The authors declare that financial support was received for the research, authorship, and/or publication of this article. This research was funded by a grant from the National Institute of Agricultural Sciences (no. PJ017425012024), Rural Development Administration, Republic of Korea.
Conflict of interest
Authors HC, BP, and KV were employed by 3BIGS Co., Ltd.
The remaining authors declare that the research was conducted in the absence of any commercial or financial relationships that could be construed as a potential conflict of interest.
Publisher’s note
All claims expressed in this article are solely those of the authors and do not necessarily represent those of their affiliated organizations or those of the publisher, editors, and reviewers. Any product that may be evaluated in this article or claim that may be made by its manufacturer is not guaranteed or endorsed by the publisher.
Supplementary material
The Supplementary Material for this article can be found online at: https://www.frontiersin.org/articles/10.3389/fgene.2024.1468596/full#supplementary-material
SUPPLEMENTARY FIGURE S1 | Divergence analysis: sequence alignment of 1 Malus and 18 Pyrus chloroplast genomes by mVISTA, with KC as the reference. The vertical axis indicates the percentage of identity in the range of 50%–100%. The horizontal axis indicates the coordinates within the chloroplast genome. The genomic regions are color-coded.
SUPPLEMENTARY FIGURE S2 | Pedigree network for all the trios and duos identified in this study. Each dot represents an accession, and species-based color-coding is used, as shown in the legend on the right-hand side. Relationships are shown with arrows from the parent to offspring accession. The blue box is type I P. ussuriensis, and the orange box is type II P. ussuriensis.
SUPPLEMENTARY FIGURE S3 | Maximum likelihood phylogenetic tree of the 18 Pyrus and 1 Malus species based on the (A) coding sequence regions and (B) complete chloroplast genomes. The bootstrap support values (>50%) from 1,000 replicates are indicated at the nodes.
References
Abreu, de, Lopes, N., Alves, R. J. V., Cardoso, S. R. S., Bertrand, Y. J. K., Sousa, F., et al. (2018). The use of chloroplast genome sequences to solve phylogenetic incongruences in Polystachya Hook (Orchidaceae Juss). PeerJ 6, e4916. doi:10.7717/peerj.4916
Allen, J. F. (2015). Why chloroplasts and mitochondria retain their own genomes and genetic systems: colocation for redox regulation of gene expression. Proc. Natl. Acad. Sci. 112 (33), 10231–10238. doi:10.1073/pnas.1500012112
Alzahrani, D. A. (2021). Complete chloroplast genome of abutilon fruticosum: genome structure, comparative and phylogenetic analysis. Plants 10 (2), 270. doi:10.3390/plants10020270
Bi, Yu, Zhang, M.-fang, Xue, J., Dong, R., Du, Y.-peng, and Zhang, X.-hai (2018). Chloroplast genomic resources for phylogeny and DNA barcoding: a case study on Fritillaria. Sci. Rep. 8 (1), 1184. doi:10.1038/s41598-018-19591-9
Carver, T., Harris, S. R., Berriman, M., Parkhill, J., and McQuillan, J. A. (2012). Artemis: an integrated platform for visualization and analysis of high-throughput sequence-based experimental data. Bioinformatics 28 (4), 464–469. doi:10.1093/bioinformatics/btr703
Chung, Ho Y., Won, So Y., Kim, Y.-K., and Jung, S. K. (2019). Development of the chloroplast genome-based InDel markers in Niitaka (Pyrus pyrifolia) and its application. Plant Biotech. Rep. 13 (1), 51–61. doi:10.1007/s11816-018-00513-0
Claessen, H., Keulemans, W., Poel, B. V. de, and De Storme, N. (2019). Finding a compatible partner: self-incompatibility in European pear (Pyrus communis); molecular control, genetic determination, and impact on fertilization and fruit set. Front. plant Sci. 10, 407. doi:10.3389/fpls.2019.00407
Daniell, H., Lin, C. S., Yu, M., and Chang, W. J. (2016). Chloroplast genomes: diversity, evolution, and applications in genetic engineering. Genome Biol. 17 (1), 134. doi:10.1186/s13059-016-1004-2
Dong, W., Liu, J., Yu, J., Wang, L., and Zhou, S. (2012). Highly variable chloroplast markers for evaluating plant phylogeny at low taxonomic levels and for DNA barcoding. PloS one 7 (4), e35071. doi:10.1371/journal.pone.0035071
Dong, X., Wang, Z., Tian, L., Zhang, Y., Qi, D., Huo, H., et al. (2020). De novo assembly of a wild pear (Pyrus betulaefolia) genome. Plant Biotechnol. J. 18 (2), 581–595. doi:10.1111/pbi.13226
Ferradini, N., Lancioni, H., Torricelli, R., Russi, L., Ragione, I. D., Cardinali, I., et al. (2017). Characterization and phylogenetic analysis of ancient Italian landraces of pear. Front. Plant Sci. 8, 751. doi:10.3389/fpls.2017.00751
Graham, S. W., and Olmstead, R. G. (2000). Utility of 17 chloroplast genes for inferring the phylogeny of the basal angiosperms. Am. J. Bot. 87 (11), 1712–1730. doi:10.2307/2656749
Hedrick, U. P., Howe, G. H., Morehouse Taylor, O., Francis, E. H., and Tukey, H. B. (1921). The pears of New York, 2. JB Lyon Company. https://www.biodiversitylibrary.org/bibliography/18239
Itai, A., and Fujita, N. (2008). Identification of climacteric and nonclimacteric phenotypes of Asian pear cultivars by CAPS analysis of 1-aminocyclopropane-1-carboxylate synthase genes. HortScience 43 (1), 119–121. doi:10.21273/hortsci.43.1.119
Jansen, R. K., Cai, Z., Raubeson, L. A., Daniell, H., Depamphilis, C. W., Leebens-Mack, J., et al. (2007). Analysis of 81 genes from 64 plastid genomes resolves relationships in angiosperms and identifies genome-scale evolutionary patterns. Proc. Natl. Acad. Sci. 104 (49), 19369–19374. doi:10.1073/pnas.0709121104
Jiang, D., Cai, X., Gong, M., Xia, M., Xing, H., Dong, S., et al. (2023). Complete chloroplast genomes provide insights into evolution and phylogeny of Zingiber (Zingiberaceae). BMC genomics 24 (1), 30. doi:10.1186/s12864-023-09115-9
Jiao, H., Chen, Q., Xiong, C., Wang, H., Ran, K., Dong, R., et al. (2024). Chloroplast genome profiling and phylogenetic insights of the “qixiadaxiangshui” pear (Pyrus bretschneideri rehd. 1). Horticulturae 10 (7), 744. doi:10.3390/horticulturae10070744
Katoh, K., Rozewicki, J., and Yamada, K. D. (2019). MAFFT online service: multiple sequence alignment, interactive sequence choice and visualization. Brief. Bioinform. 20 (4), 1160–1166. doi:10.1093/bib/bbx108
Kim, K., Lee, S. C., Lee, J., Yu, Y., Yang, K., Choi, B. S., et al. (2015). Complete chloroplast and ribosomal sequences for 30 accessions elucidate evolution of Oryza AA genome species. Sci. Rep. 5, 15655. doi:10.1038/srep15655
Kumar, S., Stecher, G., and Tamura, K. (2016). MEGA7: molecular evolutionary genetics analysis version 7.0 for bigger datasets. Mol. Biol. Evol. 33 (7), 1870–1874. doi:10.1093/molbev/msw054
Li, D.-M., Pan, Y.-Gu, Liu, H.-L., Yu, Bo, Huang, D., and Zhu, G.-Fa (2024). Thirteen complete chloroplast genomes of the costaceae family: insights into genome structure, selective pressure and phylogenetic relationships. BMC genomics 25 (1), 68. doi:10.1186/s12864-024-09996-4
Li, Q.-jie, Su, Na, Zhang, L., Tong, R.-chang, Zhang, X.-hui, Wang, J.-ru, et al. (2020). Chloroplast genomes elucidate diversity, phylogeny, and taxonomy of Pulsatilla (Ranunculaceae). Sci. Rep. 10 (1), 19781. doi:10.1038/s41598-020-76699-7
Li, Y., Zhang, J., Li, L., Gao, L., Xu, J., and Yang, M. (2018). Structural and comparative analysis of the complete chloroplast genome of Pyrus hopeiensis—“wild plants with a tiny population”—and three other Pyrus species. Int. J. Mol. Sci. 19 (10), 3262. doi:10.3390/ijms19103262
Lohse, M., Drechsel, O., and Bock, R. (2007). OrganellarGenomeDRAW (OGDRAW): a tool for the easy generation of high-quality custom graphical maps of plastid and mitochondrial genomes. Curr. Genet. 52 (5-6), 267–274. doi:10.1007/s00294-007-0161-y
Lu, Q., Tian, Q., Gu, W., Yang, C.-X., Wang, D.-J., and Yi, T.-S. (2024). Comparative genomics on chloroplasts of Rubus (Rosaceae). Genomics 116 (3), 110845. doi:10.1016/j.ygeno.2024.110845
Mayor, C., Brudno, M., Schwartz, J. R., Poliakov, A., Rubin, E. M., Frazer, K. A., et al. (2000). VISTA : visualizing global DNA sequence alignments of arbitrary length. Bioinformatics 16 (11), 1046–1047. doi:10.1093/bioinformatics/16.11.1046
Montanari, S., Postman, J., Bassil, N. V., and Neale, D. B. (2020). Reconstruction of the largest pedigree network for pear cultivars and evaluation of the genetic diversity of the USDA-ARS national Pyrus collection. G3 Genes, Genomes, Genet. 10 (9), 3285–3297. doi:10.1534/g3.120.401327
Monte-Corvo, L., Goulão, L., and Oliveira, C. (2001). ISSR analysis of cultivars of pear and suitability of molecular markers for clone discrimination. J. Am. Soc. Hortic. Sci. 126 (5), 517–522. doi:10.21273/jashs.126.5.517
Munyao, J. N., Dong, X., Yang, J. X., Mbandi, E. M., Wanga, V. O., Oulo, M. A., et al. (2020). Complete chloroplast genomes of chlorophytum comosum and chlorophytum gallabatense: genome structures, comparative and phylogenetic analysis. Plants 9 (3), 296. doi:10.3390/plants9030296
Rubtsov, G. A. (1944). Geographical distribution of the genus Pyrus and trends and factors in its evolution. Am. Nat. 78 (777), 358–366. doi:10.1086/281206
Sassa, H., Hirano, H., and Ikehashi, H. (1992). Self-incompatibility-related RNases in styles of Japanese pear (Pyrus serotina Rehd.). Plant cell physiology 33 (6), 811–814. doi:10.1093/oxfordjournals.pcp.a078322
Tillich, M., Lehwark, P., Pellizzer, T., Ulbricht-Jones, E. S., Fischer, A., Bock, R., et al. (2017). GeSeq–versatile and accurate annotation of organelle genomes. Nucleic Acids Res. 45 (W1), W6-W11–W11. doi:10.1093/nar/gkx391
Tyagi, S., Jung, J. A., Kim, J. S., and Won, S. Y. (2020). Comparative analysis of the complete chloroplast genome of Mainland aster spathulifolius and other aster species. Plants 9 (5), 568. doi:10.3390/plants9050568
Wicke, S., Schneeweiss, G. M., dePamphilis, C. W., Muller, K. F., and Quandt, D. (2011). The evolution of the plastid chromosome in land plants: gene content, gene order, gene function. Plant Mol. Biol. 76 (3-5), 273–297. doi:10.1007/s11103-011-9762-4
Wicke, S., Schneeweiss, G. M., Depamphilis, C. W., Müller, K. F., and Quandt, D. (2011). The evolution of the plastid chromosome in land plants: gene content, gene order, gene function. Plant Mol. Biol. 76, 273–297. doi:10.1007/s11103-011-9762-4
Wu, J., Wang, Y., Xu, J., Korban, S. S., Fei, Z., Tao, S., et al. (2018). Diversification and independent domestication of Asian and European pears. Genome Biol. 19, 77–16. doi:10.1186/s13059-018-1452-y
Xue, S., Shi, T., Luo, W., Ni, X., Iqbal, S., Ni, Z., et al. (2019). Comparative analysis of the complete chloroplast genome among Prunus mume, P. armeniaca, and P. salicina. Hortic. Res. 6, 89. doi:10.1038/s41438-019-0171-1
Yu, J., Fu, J., Fang, Y., Xiang, J., and Dong, H. (2022). Complete chloroplast genomes of Rubus species (Rosaceae) and comparative analysis within the genus. BMC genomics 23 (1), 32. doi:10.1186/s12864-021-08225-6
Yue, X., Zheng, X., Zong, Y., Jiang, S., Hu, C., Yu, P., et al. (2018). Combined analyses of chloroplast DNA haplotypes and microsatellite markers reveal new insights into the origin and dissemination route of cultivated pears native to East Asia. Front. Plant Sci. 9 (10), 591. doi:10.3389/fpls.2018.00591
Keywords: chloroplast genome, Pyrus ussuriensis, Pyrus pyrifolia, phylogeny, next-generation sequencing
Citation: Kim JS, Chung H, Park B, Veerappan K and Kim Y-K (2024) Chloroplast genome sequencing and divergence analysis of 18 Pyrus species: insights into intron length polymorphisms and evolutionary processes. Front. Genet. 15:1468596. doi: 10.3389/fgene.2024.1468596
Received: 22 July 2024; Accepted: 26 September 2024;
Published: 23 October 2024.
Edited by:
Qing Liu, Chinese Academy of Sciences (CAS), ChinaReviewed by:
Fardous Mohammad Safiul Azam, Neijiang Normal University, ChinaKapil Kumar Tiwari, Sardarkrushinagar Dantiwada Agricultural University, India
Copyright © 2024 Kim, Chung, Park, Veerappan and Kim. This is an open-access article distributed under the terms of the Creative Commons Attribution License (CC BY). The use, distribution or reproduction in other forums is permitted, provided the original author(s) and the copyright owner(s) are credited and that the original publication in this journal is cited, in accordance with accepted academic practice. No use, distribution or reproduction is permitted which does not comply with these terms.
*Correspondence: Jung Sun Kim, anNua2ltQGtvcmVhLmty
 Jung Sun Kim
 Hoyong Chung
 Bohyeon Park
 Karpagam Veerappan2
 Yoon-Kyung Kim