 Qing Ye
 Yaxin Sun
- 1School of Data Science and Artificial Intelligence, Wenzhou University of Technology, Wenzhou, China
- 2School of Computer Science and Technology (School of Artificial Intelligence), Zhejiang Normal University, Jinhua, China
- 3Zhejiang Aerospace Hengjia Data Technology Co. Ltd., Jiaxing, China
Computational drug-target affinity prediction has the potential to accelerate drug discovery. Currently, pre-training models have achieved significant success in various fields due to their ability to train the model using vast amounts of unlabeled data. However, given the scarcity of drug-target interaction data, pre-training models can only be trained separately on drug and target data, resulting in features that are insufficient for drug-target affinity prediction. To address this issue, in this paper, we design a graph neural pre-training-based drug-target affinity prediction method (GNPDTA). This approach comprises three stages. In the first stage, two pre-training models are utilized to extract low-level features from drug atom graphs and target residue graphs, leveraging a large number of unlabeled training samples. In the second stage, two 2D convolutional neural networks are employed to combine the extracted drug atom features and target residue features into high-level representations of drugs and targets. Finally, in the third stage, a predictor is used to predict the drug-target affinity. This approach fully utilizes both unlabeled and labeled training samples, enhancing the effectiveness of pre-training models for drug-target affinity prediction. In our experiments, GNPDTA outperforms other deep learning methods, validating the efficacy of our approach.
1 Introduction
Predicting drug-target affinity (DTAP) is a crucial research topic in drug development, which can be. used for discovering drug on-target and off-target effects. However, due to the increasing number of targets, it is difficult to fully validate the drug-target affinity (DTA) of drugs using biochemical experiments. In recent years, with the development of artificial intelligence technology, the use of computational methods for preliminary prediction of DTA has become an economically effective method. Graph neural networks (GNN) can extract features from graph-structured data and have been widely used in DTA, as drugs and targets are typically graph-structured data.
These methods can be divided into four categories. Firstly, numerous graphs have been created for drugs and targets, such as RDKit tool graph (Lin, 2020), sequence-predicted 2D contact maps (You and Shen, 2022), residue protein contact map (Jiang et al., 2020), R-radius subgraph (Tsubaki et al., 2019), weighted protein graphs (Jiang et al., 2022), which Secondly, numerous attention mechanisms have been incorporated into the GNN, such as the distance-aware molecule graph attention (Zhou et al., 2020), triplet-attention (Liao et al., 2022), atom aggregated graph (Lin, 2020), self-attention (Zhang et al., 2021; Liao et al., 2022), layer attention (Tang et al., 2023) and dynamically allocate attention (Meng et al., 2024). Thirdly, various deep learning frameworks have been devised for GNN-based DTAP, such as super-deep GNN (Yang et al., 2022), structure-aware interactive GNN (Li Shuangli et al., 2021), graph within GNN (Nguyen et al., 2022), hierarchical GNN (Chu et al., 2022), multiple output GNN (Ye et al., 2021), Data augmentation and feature fusion GNN (Fang et al., 2023), super edge GNN (Gu et al., 2023), diffusion GNN (Zhu et al., 2023), Molecular graphs and binding pocket graphs GNN (Wu et al., 2024), graph dilated convolution networks (Zhang et al., 2024), Bi-directional fusing intention network (Peng et al., 2024). Fourthly, GNNs have been utilized in conjunction with other network architectures for DTAP, such as recurrent neural network (Lin, 2020; You and Shen, 2022; Mukherjee et al., 2022), multi-subspace deep neural networks (Ye et al., 2023; Zhang Li et al., 2023).
Different graph can enhance understanding of atomic connectivity and residue interactions. The strengths of attention mechanisms lie in their ability to focus on relevant parts of the graph, enhancing the model’s representational power. Various deep learning frameworks offer diverse and innovative approaches for DTAP. Combining GNNs with other network architectures provides a comprehensive approach for DTAP, leveraging the strengths of different network types. Although the above deep neural networks based on GNNs can improve the performance of DTAP in various ways, most of the methods cannot address the issue of the scarcity of labeled training samples for DTA.
There have been some methods that have noticed this problem. A pre-trained language model based on bidirectional encoder representations from transformers is designed to extract semantic features of SMILES molecules (Qiu et al., 2024). Multiple Transformer-Encoder blocks were designed to capture and learn the proteomics, chemical, and pharmacological contexts (Monteiro et al., 2024). Transformer-based architecture was utilized to learn representation for drugs (Rafiei et al., 2024). GCN-BERT utilized two RoBERTa models to extract features for the drug and target (Lennox et al., 2021). CPCProt divided protein sequences into fxed-size segments and trained an autoregressor to distinguish subsequent segments of the same protein from random protein segments (Lu et al., 2020). SubMDTA proposed a self-supervised pretraining model based on substructure extraction and multi-scale features (Pan et al., 2023). ProtBert was utilized to extract the feature for the target (Zhang Xianfeng et al., 2023). Two modalities ProtBERT-BFD from ProtTrans2 and PSSM based descriptors are used to represent the target (Liyaqat et al., 2023). Four contrastive loss functions are considered to learn a more powerful model, such as Max-margin contrastive loss function, Triplet loss function, Multi-class N-pair Loss Objective, and NT-Xent loss function (Dehghan et al., 2024). These methods use pre-training to extract better features, but they fail to notice the significant difference between the pre-training objectives and samples, and the training objectives and samples for DTAP. Specifically, pre-training uses samples of drugs or targets individually, while DTAP utilizes samples of drug-target pairs for model training.
To overcome the beforementioned issues and further improve the DTAP performance of GNNs, this paper proposes a graph neural pre-training-based drug-target affinity (GNPDTA) prediction method. This approach divides the feature extraction for DTAP into two stages. In the first stage, a graph neural pre-training model is employed to extract low-level features of drugs and targets separately. During the process of drug-target affinity generation, we observe that drug-target affinity is generally related to their local fragments. Since target sequences tend to be longer, the pre-training model primarily extracts features of target fragments. Drug SMILES usually consist of 50 atoms, so the pre-training model focuses on extracting features of drug graph nodes. In the second stage, a convolutional neural network is utilized to combine the features of adjacent target fragments and drug graph nodes, resulting in features for predicting drug-target affinity.
GNPDTA has the following main contributions. One is that GNPDTA can Minimize discrepancy between pre-training and DTAP objectives. By devoting the initial stage exclusively to feature extraction, the proposed method effectively bridges the gap between pre-training objectives (which focus on individual drug or target samples) and DTAP objectives (which consider drug-target pairs). This ensures that the extracted features are highly pertinent to the DTAP task. Another is that The GNPDTA method introduces a two-stage approach tailored specifically for drug-target affinity prediction (DTAP). This strategy intelligently leverages distinct models and training methodologies at each stage, maximizing the utilization of both unlabeled and labeled data to enhance feature extraction effectiveness.
2 Materials and methods
2.1 Datasets
The GNPDTA method consists of two stages. In the first stage, a large amount of unlabeled data is used to train the pre-training model. For targets, the Swiss-Prot dataset (Swiss-Port dataset) is used for training the pre-training model, which includes 565,928 targets. For drugs, the CHEMBL dataset (Gaulton et al., 2017) is used for training the pre-training model, containing 2,105,464 drugs.
In the second stage, the proposed model was evaluated on five benchmark datasets of DTAP, namely, the Kiba (Tang et al., 2014), Davis (Davis et al., 2011), DTC (Tang et al., 2018), Metz (Metz et al., 2011), and Tox-Cast (US). The simple statistics for the sample information of these datasets are given in Table.1. It can be seen from Table.1 that there are only 2,111, 68, 5,983, 1,471, and 7,657 drugs and only 229, 442, 118, 170, and 328 targets on the above datasets. As a result, the prediction model could be hardly well trained only by these samples.
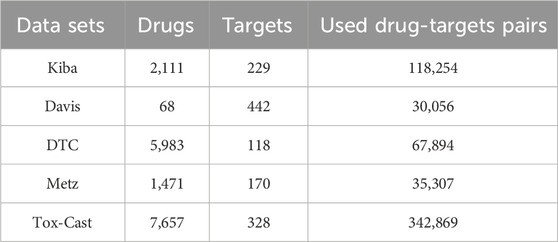
Table 1. Simple statistics for the sample information of five DTA datasets.
2.2 GNPDTA structure
The structure of GNPDTA is depicted in Figure 1. As can be observed from Figure 1, GNPDTA comprises seven parts, including pre-trained target graph isomorphism network (GIN), pre-trained drug GIN, target graph features, drug node features, 2D convolutional neural networks (CNN) Layers, drug-target features, and predictor. The pre-trained target GIN and pre-trained drug GIN are trained using a large number of unlabeled target training samples and unlabeled drug training samples, respectively, to extract low-level features of targets and drugs. Target graph features are the low-level features of targets extracted by the pre-trained target GIN. Drug node features are the low-level features of drugs extracted by the pre-trained drug GIN. Two 2D CNNs are used to extract high-level features of drugs and targets from target graph features and drug node features, respectively. Drug-target features are obtained by concatenating target graph features and drug node features. Predictor utilizes Drug-Target Features to predict DTA.
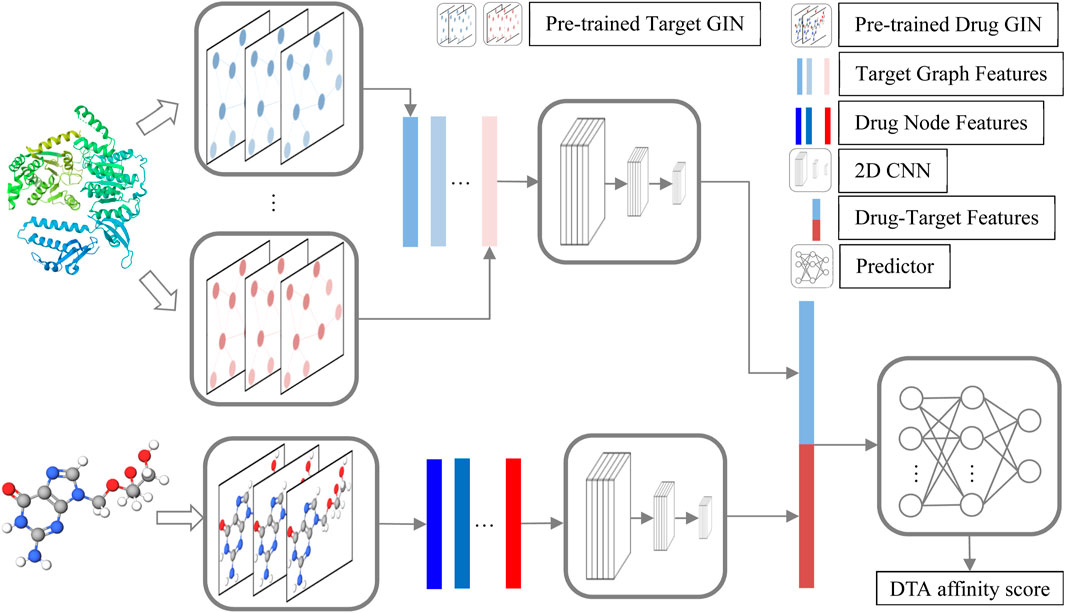
Figure 1. GNPDTA structure.
2.3 Low-level features extracted by pre-trained GIN
Pre-training models can utilize a large number of unlabeled samples, which can be used to overcome the problem of insufficient drug-target affinity data. Furthermore, the drug and the target are two typical graph structure data, where they take atoms as nodes and bonds as edges. Therefore, two graph pre-training GINs are considered to extract drug and target features, where GIN is one of the types of GNN. GIN is chosen, for the reason that GIN’s complete graph convolution approach enables it to capture global features in graph structures, resulting in stronger expressive power when dealing with complex graph structures, where the drug and target are all complex graph structures.
Pushing different molecules away by contrastive approaches and randomly masking the discrete values and pre-training GNNs to predict them by masked atoms modeling are two most used graph pre-training models for molecules. Because drugs and targets are mainly composed of a few atoms such as C, H, O, N, or S, and then the ability to learn the drug and the target characteristics through masked atoms modeling (MAM) may be relatively weak. Therefore, an unsupervised graph-level representation learning via mutual information maximization (INFOGRAPH) (Sun et al., 2020) is used to learn the drug and the target representation, which belongs to a contrastive approach.
The objective of INFOGRAPH is to maximize the mutual information (MI) between the representations of entire graphs and the representations of substructures of different granularity (Sun et al., 2020).Given N training graphs
where
The graph features of g can be defined as:
where
And then the mutual information between
where
The objective function defined by Equation 3 can be used to optimize
In numerous application domains, features derived from pre-trained models often facilitate the direct execution of downstream tasks. However, within the realm of drug-target affinity prediction, directly applying features extracted from pre-trained models poses challenges. This stems from the fact that, in other domains, the pre-training samples align with those of the downstream task. Conversely, in drug-target affinity prediction, pre-training typically involves separate drug and target samples, whereas the prediction itself necessitates drug-target pair samples. This disparity in training samples hinders the ability of pre-trained models to comprehensively represent drug-target pairs. Consequently, pre-trained GINs are primarily employed to extract low-level features for drugs and targets, while the extraction of high-level drug-target pair features is entrusted to supervised training objectives. This complex learning objective is segmented into two stages, allowing for a more effective utilization of the strengths of each stage.
A target sequence typically consists of hundreds to thousands of amino acids. However, when this target interacts with a drug molecule to generate affinity, it is usually a specific amino acid fragment within the sequence that plays a major role. As a result, to better extract low-level features from the target sequence, the sequence is first divided into multiple fragments. The ideal method would be to segment the sequence based on the contribution of each fragment to affinity, but obviously, this is a more challenging task than affinity prediction itself. Fortunately, as this paper only utilizes pre-trained models to extract low-level features, a precise fragment segmentation method is not required. Therefore, a sliding window approach is adopted for fragment segmentation.
For the training data of the pre-trained target GIN
After obtaining
K represents the number of fragments the target is divided into.
It can be seen from Equation 4 that the graph features of all segments of
A drug molecule typically consists of a few to several dozen atoms. When producing affinity with a target, most of the atoms in the drug contribute to this process. Therefore, the drug is not divided into multiple fragments but instead uses a pre-trained GIN to extract features for each atom of the drug, leveraging a large number of unlabeled training samples. The features that capture the influence of atoms and their relationships on affinity are further extracted by a supervised 2D CNN. For a large number of unlabeled training drugs, Equation 4 learns the pre-trained drug GIN
Given a drug SMILES
Equation 4 shows that the low-level feature extraction results of targets are composed of fragments. Equation 5 shows that the low-level feature extraction results of drugs are composed of drug nodes. The pre- trained model is not directly used to extract the low-level features of the entire target and the entire drug, whose main reasons are as following. Firstly, Drug-target affinity is mainly determined by the local parts of drugs and targets. Using pre-training to extract the low-level features of the entire target and the entire drug will lose many features that are effective for DTA. Secondly, the pre-trained models in Equations 4, 5 are trained using a large number of unlabeled targets and unlabeled drugs, respectively, while DTAP uses drug-target sample pairs. In terms of training samples and training objectives, the pre-trained models and DTAP are too different. As a result, directly using the pre-trained entire low-level features of targets and drugs cannot meet the requirements of DTAP.
However, using Equations 4, 5 to extract the low-level features of drug targets, the pre-trained model only needs to achieve the training goal of maintaining the features of drugs and targets as much as possible. The features that are beneficial to DTAP only need to be handed over to the next step of extracting high-level features of drugs and targets. This is also the reason why our method performs excellently.
Algorithm 1.Pseudo code of pre-training target GIN fG˘(.) and pre-training drug GIN fG⌢(.).
Input: Pre-training drugs
Output:
Algorithm:
Stage 1: Training
1: Divided fragments for
2: Used the RDKit tool to construct graphs
3: Used
Stage 2: Training
4: Used RDkit tool to construct graphs
5: Used
Pre-trained Target GIN and Pre-trained Drug GIN mainly extract low-level features for targets and drugs. They are trained using large amounts of unlabeled target samples and drug samples based on the INFOGRAPH loss function defined in Equation 3. These features aim to preserve as much information about the targets and drugs themselves as possible, but they do not have the direct capability to predict drug-target affinity.
For drugs, the median lengths of SMILESs are approximately 46, 53, 48, 45, and 28 respectively on KIBA, Davis, DTC, Metz, and Tox-Cast. Therefore, after pre-training, zero-padding and truncation methods are adopted to fix the number of drug nodes extracted from Formula 5 at 64, which can not only retain the nodes of most drugs but also avoid introducing too many zero paddings. For targets, the median lengths of sequences are approximately 620, 632, 673, 631, and 479 respectively on KIBA, Davis, DTC, Metz, and Tox-Cast. Therefore, after pre-training, K in Formula 4 is set to 64, which can not only maintain an appropriate overlap of sliding windows but also make the low-level feature dimensions of drugs and targets the same. In particular, this can remove a large amount of redundant data, because the low-level features of the target are composed of fragment features.
2.4 High-level features extracted by CNN and DTA predicted by predictor
As can be seen from Equation 4, target graph features are composed of linked graph features of adjacent amino acid fragments, and drug-target affinity is mainly determined by a subset of amino acid fragments, which exhibits a distinct local receptive field, making it suitable for further feature extraction from target graph features using convolutional neural networks. Similarly, from Equation 5, drug node features are composed of linked node features, and drug-target affinity is also primarily determined by a subset of nodes, exhibiting a clear local receptive field, thus suitable for further feature extraction from drug node features using convolutional neural networks. Additionally, convolutional neural networks require fewer parameters to train, which is beneficial for addressing the relatively small number of drug-target pair samples.
Given
where
The high- level features of
where
After extracting the high-level features of targets and drugs using Equations 6, 7, the drug-target pair features can be represented as:
After obtaining the drug-target pair features, a predictor can be used to predict the drug-target affinity. The predictor is defined as follows:
where
2.5 The proposed GNPDTA model
GNPDTA is summarized in Algorithm 2, which comprises two stages: supervised GNPDTA training and GNPDTA testing. In the supervised GNPDTA training, the first six steps, introduced in Section 3.2, are used to extract low-level features for training samples. The final four steps, introduced in Section 3.3, are responsible for extracting high-level features for the training samples. During the GNPDTA testing, steps 11–16 are used to extract low-level features, while steps 17, 18, and 19 are utilized to extract high-level features and predict the DTA score for the test sample. The code is available at https://github.com/yeqing0713/GNPDTA.
Algorithm 2.Pseudo code of GNPDTA.
Input: Training drugs
Output: the predicted DTA score
Algorithm:
Stage 1: supervised GNPDTA training
1: Divide target fragments for
2: Used the RDkit tool to create graphs for all target fragments.
3: Extracted low-level features for targets by Equation 4.
4: Extracted high-level features for targets by Equation 6.
5: Used the RDkit tool to create graphs for
6: Extracted low-level features for drugs by Equation 5.
7: Extracted high-level features for drugs by Equation 7.
8: Calculated drug-target pair features by Equation 8.
9: Predicted drug-target affinity by Equation 9.
10: Trained
Stage 2: GNPDTA testing
11: Divided target fragments by using an overlapping sliding window method.
12: Used the RDkit tool to create graphs for all target fragments.
13: Extracted low-level features for t by Equation 4.
14: Extracted high-level features for t by Equation 6.
15: Used the RDkit tool to create graphs for d.
16: Extracted low-level features for d by Equation 5.
17: Extracted high-level features for d by Equation 7.
18: Calculated the drug-target pair features for d and t by Equation 9.
19: Predicted the DTA between d and t by Equation 9.
Compared with other existing DTAP methods, GNPDTA boasts the following advantage: GNPDTA employs a two-stage strategy for DTAP feature extraction. The first stage employs a self-supervised approach to learn low-level features, which can leverage a large amount of unlabeled training samples. This approach also helps overcome the large discrepancy between the self-supervised training objective and the drug-target affinity prediction objective. In the second stage, a supervised method is used to learn high-level features and predict DTA, enabling the utilization of limited samples to train the DTA predictor. It also allows for better utilization of the low-level features extracted from the self-supervised method. This two-stage methodology maximizes the strengths of both models, ensuring the optimal utilization of training samples. Notably, it minimizes the divide between self-supervised learning and DTA prediction, thereby enhancing the effectiveness of the features extracted through self-supervised learning.
2.6 Architectural parameter
GNPDTA comprises a pre-trained drug GIN, a pre-trained target GIN, two 2D CNNs, and a predictor. These neural networks involve numerous architectural parameters. The pre-trained drug GIN and the pre-trained target GIN primarily require setting the number of hidden layers and hidden size, which are set to 6 and 60 respectively, considering that the numbers of tokens in the drug and target are only 62 and 25. The 2D CNN needs to specify the number of hidden layers, the numbers of filters, and the kernel sizes. Specifically, the number of hidden layers is set to 3, with the numbers of filters for each layer being 32, 64, 128, and the kernel sizes being 5, 5, 3. As can be seen, this is a shallow 2D CNN. The reason for only using a shallow 2D CNN is that the current labeled drug-target affinity databases are still relatively small, making it difficult to support the training of neural networks with a large number of parameters. The Predictor also needs to define the number of hidden layers and hidden size, where the number of hidden layers is set to 3, and the hidden size for each layer is set to 512, 128, 1, because the scale of labeled training data of DTA is relatively small, which can only support the training of models with relatively few parameters. The training batch size is set to 1,280, which is the largest size for my GPU, where my GPU memory is 16 GB.
3 Results
3.1 Experimental setting
In this section, five datasets, Kiba, Davis, DTC, Metz, and Tox-Cast, listed in Table 1 are used to validate the proposed method. The same train/test splits as specified in (Wu et al., 2024) were adopted for the experiments, with 80% of the data instances used for training and 20% reserved for testing.
To evaluate the DTA predictions, the concordance index (CI) and mean squared error (MSE) were employed as metrics. Specifically, CI measures the ranking of the predicted binding affinity, as described in (Wu et al., 2024), while MSE quantifies the difference between the vector of predicted values and the vector of actual values, as stated in (Liao et al., 2022).
3.2 Ablation study and statistical test
The main contribution of GNPDTA lies in bridging the gap between pre-training and DTA objectives. By dedicating the first stage solely to low-level feature extraction, GNPDTA successfully narrows the gap between the pre-training objectives and the DTAP objectives. This approach ensures that the features learned in the pre-training phase are more relevant and useful for the downstream DTAP task.
Therefore, this subsection will compare the experimental results of the following methods: NO Pre-trained GIN+2D CNN, 2D CNN, and Pre-trained GIN+1D CNN. Among them, NO Pre-trained GIN+2D CNN has the same framework as GNPDTA, but the GIN model is not trained using large-scale unlabeled training data. The 2D CNN removes the GIN part from the framework and only uses 2D CNN to extract features of drugs and targets. Pre-trained GIN+1D CNN replaces the 2D CNN in the GNPDTA framework with 1D CNN. NO Pre-trained GIN+2D CNN can verify the effect of using pre-training. 2D CNN can validate the effect of using GIN to extract low-level features. Pre-trained GIN+1D CNN can verify the effect of using 2D CNN. The experimental results are presented in Tables 2–4. In order to test and compare the stability of algorithms, the mean and standard deviation of experimental results are given on the histogram.
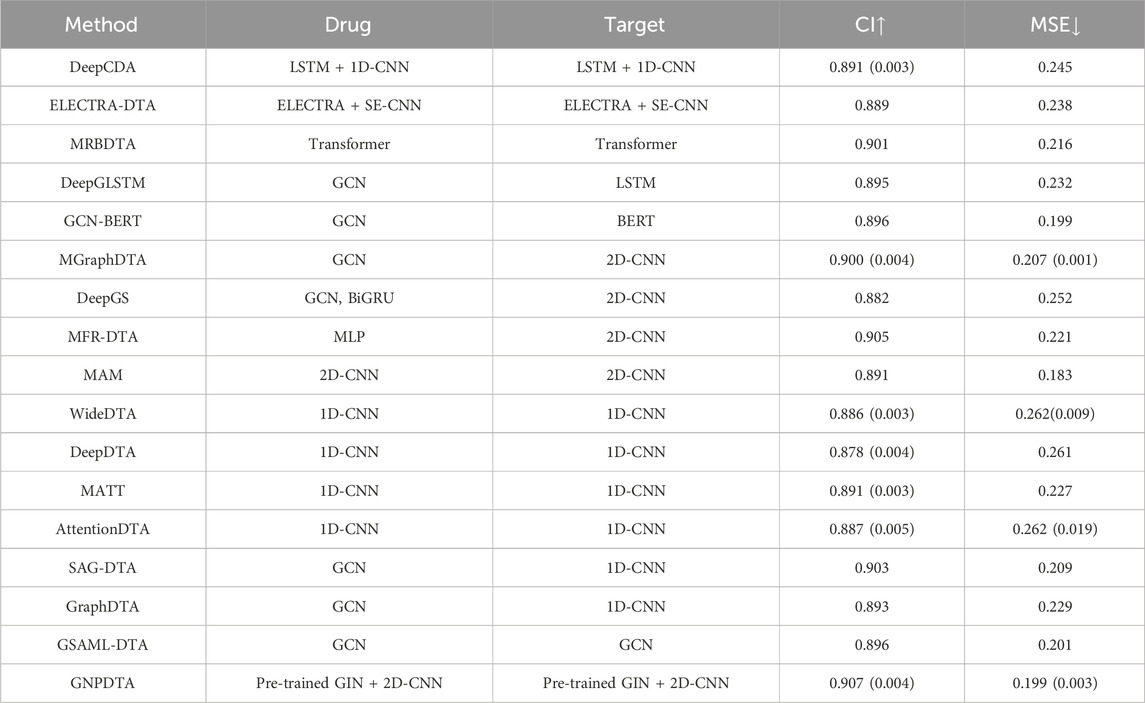
Table 2. Results of DTA on Davis.

Table 3. Results of DTA on Kiba.
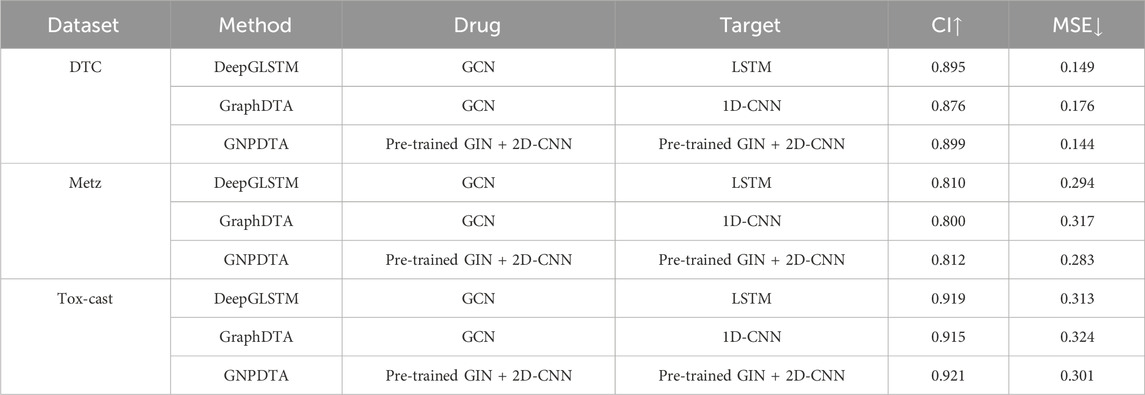
Table 4. Results of DTA on DTC, Metz and Tox-cast.
From the mean values on Figures 2–5, it can be observed that GNPDTA’s CI is higher than 2D CNN’s CI by 0.015 and 0.008 on the Davis and Kiba datasets, respectively. Meanwhile, GNPDTA’s MSE is lower than 2D CNN’s MSE by 0.036 and 0.019 on the Davis and Kiba datasets, respectively. This indicates that the use of GIN to initially extract features is more effective than directly using one-hot features for improving the prediction performance of DTA. GNPDTA’s CI is also higher than NO Pre-trained GIN+2D CNN’s CI by 0.004 and 0.004 on the Davis and Kiba datasets, respectively, while GNPDTA’s MSE is lower by 0.006 and 0.007. This demonstrates that using a large number of unlabeled training samples helps improve the DTA prediction performance. Additionally, GNPDTA’s CI is higher than Pre-trained GIN+1D CNN’s CI by 0.002 and 0.003 on the Davis and Kiba datasets, respectively, while GNPDTA’s MSE is lower than 2D CNN’s MSE by 0.005 and 0.002. This suggests that 2D CNN is better able to comprehensively utilize the primary features extracted by Pre-trained GIN. The reason is that 2D CNN not only extracts features between sequences but also combines existing features to create new ones.
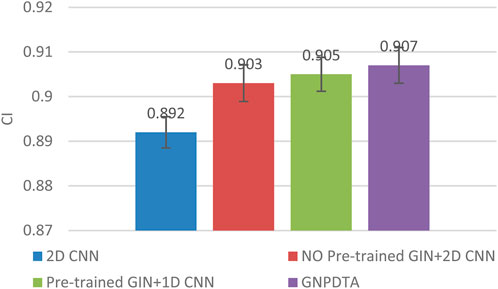
Figure 2. CI of DTA on Davis dataset based on ablation experiments.
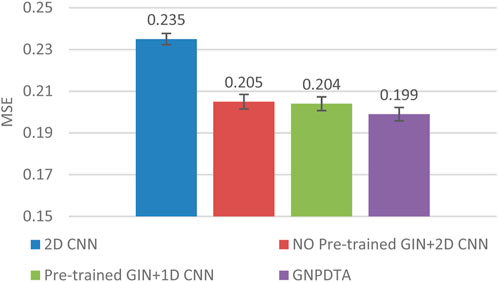
Figure 3. MSE of DTA on Davis dataset based on ablation experiments.
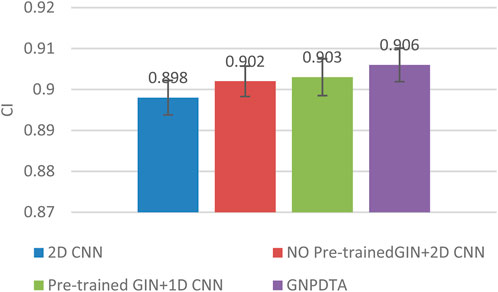
Figure 4. CI of DTA on Kiba dataset based on ablation experiments.
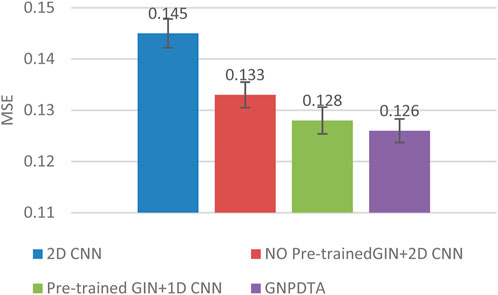
Figure 5. MSE of DTA on Kiba dataset based on ablation experiments.
From the variance on Figure 2, the standard deviations of CIs of the four methods on the Davis dataset are respectively 0.003, 0.004, 0.004, and 0.004. From the variance on Figure 3, the variances of MSEs of the four methods on the Davis dataset are respectively 0.003, 0.004, 0.003, and 0.003. From the variance on Figure 4, the variances of CIs of the four methods on the Kiba dataset are respectively 0.004, 0.004, 0.005, and 0.004. From the variance on Figure 5, the variances of MSEs of the four methods on the Kiba dataset are respectively 0.003, 0.003, 0.003, and 0.002. These data indicate that our method’s experimental results are relatively stable and have strong practical application capabilities.
3.3 Results of DTA on davis
In this subsection, GNPDTA is compared with numerous recent studies on Davis, including DeepDTA (Öztürk et al., 2018), MATT (Zeng et al., 2021), WideDTA (Öztürk et al., 2019), DeepCDA (Karim et al., 2020), ELECTRA-DTA (Wang et al., 2022), MAM (Aleb, 2021), MRBDTA (Zeng et al., 2023), AttentionDTA (Zhao et al., 2019), SAG-DTA (Zhang et al., 2021), GraphDTA (Nguyen et al., 2021), MGraphDTA (Yang et al., 2022), DeepGS (Lin, 2020), DeepGLSTM (Mukherjee et al., 2022), GCN-BERT (Lennox et al., 2021), GSAML-DTA (Nguyen et al., 2021), and MFR-DTA (Hu et al., 2023).
According to the principles of the feature extraction of methods, they can be broadly classified into several categories. Two-stage-based methods include DeepCDA and ELECTRA-DTA. Pre-training-based methods comprise DeepCDA, ELECTRA-DTA, MRBDTA, DeepGLSTM, and GCN-BERT. 2D-CNN-based methods are MGraphDTA, DeepGS, MFR-DTA, and MAM. 1D-CNN-based methods are WideDTA, DeepDTA, MATT, AttentionDTA, SAG-DTA, and GraphDTA. GCN-based methods cover DeepGLSTM, GCN-BERT, MGraphDTA, DeepGS, SAG-DTA, GraphDTA, GSAML-DTA, and DGraphDTA. The model evaluations of the DTA on Davis are listed in Table 2, where the best of each group on each dataset is shown in the bold font, “↑” represents that the larger the value in this column is, the better it is, “↓” represents that the smaller the value in this column is, the better it is. The value outside the parentheses is the mean, and the value inside the parentheses is the standard deviation. It can be seen from Table 2 that GNPDTA is the best among all compared methods on Davis.
Firstly, GNPDTA significantly outperforms two-stage-based methods. Specifically, the CI of GNPDTA is 0.016 and 0.018 higher, respectively, compared to that of DeepCDA and ELECTRA-DTA. Similarly, the MSE of GNPDTA is 0.046, and 0.039 lower, respectively, than that of DeepCDA and ELECTRA-DTA. Notably, the CI of GNPDTA is 0.016 higher than the CI of DeepCDA, which is the best-performing method among two-stage-based methods. Moreover, the MSE of GNPDTA is 0.046 lower than the MSE of DeepCDA. These results demonstrate that our method is more effective than the compared two-stage-based methods for DTAP.
Secondly, GNPDTA significantly outperforms pre-training-based methods. Specifically, the CI of GNPDTA is 0.016, 0.018, 0.006, 0.012, and 0.011 higher, respectively, compared to that of DeepCDA, ELECTRA-DTA, MRBDTA, DeepGLSTM and GCN-BERT. Similarly, the MSE of GNPDTA is 0.046, 0.039, 0.017, 0.033, and 0.0 lower, respectively, than that of DeepCDA, ELECTRA-DTA, MRBDTA, DeepGLSTM and GCN-BERT. Notably, the CI of GNPDTA is 0.0061 higher than the CI of MRBDTA, which is the best-performing method among CNN-based approaches. Moreover, the MSE of GNPDTA is 0.017 lower than the MSE of MRBDTA. These results demonstrate that our method is more effective than the compared two-stage-based methods for DTAP.
Thirdly, it is evident that GNPDTA surpasses 2D-CNN-based methods in terms of performance. Specifically, GNPDTA’s CI surpasses MGraphDTA, DeepGS, MFR-DTA, and MAM by 0.007, 0.025, 0.002 and 0.016, respectively. Similarly, its mean squared error (MSE) is lower, specifically 0.008, 0.053, 0.022 and −0.016 less, compared to MGraphDTA, DeepGS, MFR-DTA, and MAM. Notably, GNPDTA’s CI exceeds the CI of MFR-DTA, the top-performing CNN-based approach, by 0.007. Furthermore, GNPDTA’s MSE is 0.008 lower than MFR-DTA’s MSE. These findings clearly indicate that our proposed method exhibits superior efficacy compared to the examined two-stage-based methods for DTAP.
Fourthly, it is evident that GNPDTA surpasses 1D-CNN-based methods in terms of performance. Specifically, GNPDTA’s CI surpasses WideDTA, DeepDTA, MATT, AttentionDTA, SAG-DTA and GraphDTA by 0.021, 0.029, 0.016, 0.02, 0.004 and 0.014, respectively. Similarly, its mean squared error (MSE) is lower, specifically 0.063, 0.062, 0.028, 0.063, 0.01 and 0.03 less, compared to WideDTA, DeepDTA, MATT, AttentionDTA, SAG-DTA and GraphDTA. GNPDTA’s CI exceeds the CI of SAG-DTA, the top-performing CNN-based approach, by 0.004. Furthermore, GNPDTA’s MSE is 0.01 lower than SAG-DTA’s MSE. These findings clearly indicate that our proposed method exhibits superior efficacy compared to the examined two-stage-based methods for DTAP.
Fifthly, it is evident that GNPDTA surpasses 2D-CNN-based methods in terms of performance. Specifically, GNPDTA’s CI surpasses DeepGLSTM, GCN-BERT, MGraphDTA, DeepGS, SAG-DTA, GraphDTA, GSAML-DTA, DGraphDTA by 0.012, 0.011, 0.007, 0.025, 0.004, 0.014, 0.011 and 0.003, respectively. Similarly, its mean squared error (MSE) is lower, specifically 0.033, 0, 0.008, 0.053, 0.01, 0.03, 0.002 and 0.003 less, compared to DeepGLSTM, GCN-BERT, MGraphDTA, DeepGS, SAG-DTA, GraphDTA and GSAML-DTA. Notably, GNPDTA’s CI exceeds the CI of GSAML-DTA, the top-performing CNN-based approach, by 0.003. Furthermore, GNPDTA’s MSE is 0.003 lower than GSAML-DTA’s MSE. These findings clearly indicate that our proposed method exhibits superior efficacy compared to the examined two-stage-based methods for DTAP.
3.4 Results of DTA on Kiba
In this subsection, GNPDTA is also compared with numerous recent studies on Davis, including DeepDTA (Öztürk et al., 2018), MATT (Zeng et al., 2021), WideDTA (Öztürk et al., 2019), DeepCDA (Karim et al., 2020), ELECTRA-DTA (Wang et al., 2022), MAM (Aleb, 2021), MRBDTA (Zeng et al., 2023), AttentionDTA (Zhao et al., 2019), SAG-DTA (Hu et al., 2023), GraphDTA (Nguyen et al., 2021), MGraphDTA (Yang et al., 2022), DeepGS (Lin, 2020), DGraphDTA (Lu et al., 2020), DeepGLSTM (Mukherjee et al., 2022), GCN-BERT (Lennox et al., 2021), GSAML-DTA (Pan et al., 2023), and MFR-DTA (Zhang Xianfeng et al., 2023). The model evaluations of the DTA on Kiba are listed in Table 3, where the best of each group on each dataset is shown in the bold font, “↑” represents that the larger the value in this column is, the better it is, “↓” represents that the smaller the value in this column is, the better it is. It can be seen from Table 3 that GNPDTA is the best among all compared methods on Kiba.
Firstly, GNPDTA significantly outperforms two-stage-based methods. Specifically, the CI of GNPDTA is 0.017 and 0.017 higher, respectively, compared to that of DeepCDA and ELECTRA-DTA. Similarly, the MSE of GNPDTA is 0.05 and 0.036 lower, respectively, than that of DeepCDA and ELECTRA-DTA. Notably, the CI of GNPDTA is 0.017 higher than the CI of ELECTRA-DTA, which is the best-performing method among two-stage-based methods. Moreover, the MSE of GNPDTA is 0.036 lower than the MSE of ELECTRA-DTA. These results demonstrate that our method is more effective than the compared two-stage-based methods for DTAP.
Secondly, GNPDTA significantly outperforms pre-training-based methods. Specifically, the CI of GNPDTA is 0.017, 0.017, 0.006, 0.009, and 0.018 higher, respectively, compared to that of DeepCDA, ELECTRA-DTA, MRBDTA, DeepGLSTM and GCN-BERT. Similarly, the MSE of GNPDTA is 0.05, 0.036, 0.004, 0.007 and 0.023 lower, respectively, than that of DeepCDA, ELECTRA-DTA, MRBDTA, DeepGLSTM and GCN-BERT. Notably, the CI of GNPDTA is 0.006 higher than the CI of MRBDTA, which is the best-performing method among CNN-based approaches. Moreover, the MSE of GNPDTA is 0.004 lower than the MSE of MRBDTA. These results demonstrate that our method is more effective than the compared two-stage-based methods.
Thirdly, it is evident that GNPDTA surpasses 2D-CNN-based methods in terms of performance. Specifically, GNPDTA’s CI surpasses MGraphDTA, DeepGS, MFR-DTA, and MAM by 0.004, 0.046, 0.008 and 0.008, respectively. Similarly, its mean squared error (MSE) is lower, specifically 0.002, 0.067, 0.01 and −0.009 less, compared to MGraphDTA, DeepGS, MFR-DTA, and MAM. Notably, GNPDTA’s CI exceeds the CI of MGraphDTA, the top-performing CNN-based approach, by 0.004. Furthermore, GNPDTA’s MSE is 0.002 lower than MGraphDTA’s MSE. They clearly indicate that our proposed method exhibits superior efficacy compared to the examined two-stage-based methods for DTAP.
Fourthly, it is evident that GNPDTA surpasses 1D-CNN-based methods in terms of performance. Specifically, GNPDTA’s CI surpasses WideDTA, DeepDTA, MATT, AttentionDTA, SAG-DTA and GraphDTA by 0.031, 0.043, 0.017, 0.024, 0.014 and 0.015, respectively. Similarly, its mean squared error (MSE) is lower, specifically 0.053, 0.068, 0.024, 0.036, 0.004 and 0.013 less, compared to WideDTA, DeepDTA, MATT, AttentionDTA, SAG-DTA and GraphDTA. GNPDTA’s CI exceeds the CI of SAG-DTA, the top-performing CNN-based approach, by 0.014. Furthermore, GNPDTA’s MSE is 0.004 lower than SAG-DTA’s MSE. These findings clearly indicate that our proposed method exhibits superior efficacy compared to the examined two-stage-based methods for DTAP.
Fifthly, it is evident that GNPDTA surpasses 2D-CNN-based methods in terms of performance. Specifically, GNPDTA’s CI surpasses DeepGLSTM, GCN-BERT, MGraphDTA, DeepGS, SAG-DTA, GraphDTA, GSAML-DTA, DGraphDTA by 0.009, 0.018, 0.004, 0.046, 0.014, 0.015 and 0.006, respectively. Similarly, its mean squared error (MSE) is lower, specifically 0.007, 0.023, 0.002, 0.067, 0.004, 0.013 and 0.006 less, compared to DeepGLSTM, GCN-BERT, MGraphDTA, DeepGS, SAG-DTA, GraphDTA and GSAML-DTA. Notably, GNPDTA’s CI exceeds the CI of GSAML-DTA, the top-performing CNN-based approach, by 0.004. Furthermore, GNPDTA’s MSE is 0.002 lower than GSAML-DTA’s MSE. These findings clearly indicate that our proposed method exhibits superior efficacy compared to the examined two-stage-based methods for DTAP.
3.5 Results of DTA on DTC, Metz and Tox-cast
In this subsection, GNPDTA is compared against GraphDTA and DeepGLSTM on the DTC, Metz, and Tox-cast datasets. However, as only a limited number of deep learning methods have been validated on these three databases, our comparison is primarily focused on GraphDTA and DeepGLSTM. The resulting comparisons are presented in Table 4, where the best of each group on each dataset is shown in the bold font, “↑” represents that the larger the value in this column is, the better it is, “↓” represents that the smaller the value in this column is, the better it is. It can be seen from Table 2 that GNPDTA is the best among all compared methods on Davis.
From Table 4, it is evident that our proposed method outperforms others. Firstly, the CI of GNPDTA is higher than DeepGLSTM by 0.004, 0.002, and 0.002, respectively, while the MSE of GNPDTA is lower by 0.005, 0.011, and 0.012, respectively, on the DTC, Metz, and Tox-Cast datasets. Secondly, when comparing GNPDTA with GraphDTA on the same datasets, GNPDTA’s CI is higher by 0.023, 0.012, and 0.006, while its MSE is lower by 0.032, 0.034, and 0.023, respectively. These results demonstrate that combining pre-trained GIN with 2D CNN to learn high-level features for drugs and targets is beneficial for drug-target affinity prediction.
4 Discussion
In this paper, we introduce GNPDTA as a novel approach for predicting DTA, with the aim of addressing the significant discrepancy between the pre-training objectives and samples utilized in existing pre-training methods and their corresponding DTAP methods. GNPDTA integrates a two-stage strategy for feature extraction in the context of DTAP. Initially, a self-supervised learning mechanism is employed to acquire low-level features from unlabeled data, thereby bridging the gap between the objectives of self-supervised learning and DTA prediction, as well as the discrepancy in samples used for both purposes. Subsequently, a supervised approach is leveraged to refine high-level features and predict DTA using limited labeled samples, effectively incorporating the low-level features obtained from the first stage. This two-stage methodology maximizes the strengths of both models, ensuring the optimal utilization of training samples. Notably, it minimizes the divide between self-supervised learning and DTA prediction, thereby enhancing the effectiveness of the features extracted through self-supervised learning. Our findings demonstrate that GNPDTA surpasses existing methods, indicating its potential for more efficient applications in DTAP.
GNPDTA offers valuable insights into the complex interactions between drugs and their targets. The ability to accurately predict DTA has profound implications for drug discovery and development. By identifying potential drug-target pairs with high affinity, researchers can prioritize compounds for further experimentation, thereby accelerating the drug development process. Moreover, the self-supervised learning component of GNPDTA captures information beyond direct DTA annotations, potentially uncovering novel patterns and relationships within the drug-target interaction landscape. The practical implications of GNPDTA are significant. In the pharmaceutical industry, the ability to accurately predict DTA could revolutionize drug screening and optimization, reducing costs and time-to-market. Furthermore, GNPDTA has the potential to facilitate the discovery of novel drug indications by predicting off-target effects and repurposing existing drugs for new therapeutic applications. Additionally, in the context of precision medicine, GNPDTA could aid in the selection of personalized treatment options by predicting an individual’s response to various drugs based on their unique genetic profile.
There are several interesting problems to be investigated in our future work. As one of the further works, optimized and improved the GNPDTA model by exploring more advanced graph neural network structures and more efficient feature fusion methods, which aims to further enhance the accuracy and efficiency of drug-target affinity prediction. As another further work, investigated and developed visualization techniques for the model, which can improve the interpretability of DTAP.
Data availability statement
The original contributions presented in the study are included in the article/supplementary material, further inquiries can be directed to the corresponding author.
Author contributions
QY: Methodology, Writing–original draft. YS: Supervision, Writing–review and editing.
Funding
The author(s) declare that financial support was received for the research, authorship, and/or publication of this article. This work was supported by, National Natural Science Foundation of China (No.61972299), Zhejiang “Lingyan” Research and Development Program (No. 2022C03121), Wenzhou Natural Science Foundation (No. 2021G0170).
Conflict of interest
Author YS was employed by Zhejiang Aerospace Hengjia Data Technology Co. Ltd.
The remaining author declares that the research was conducted in the absence of any commercial or financial relationships that could be construed as a potential conflict of interest.
Publisher’s note
All claims expressed in this article are solely those of the authors and do not necessarily represent those of their affiliated organizations, or those of the publisher, the editors and the reviewers. Any product that may be evaluated in this article, or claim that may be made by its manufacturer, is not guaranteed or endorsed by the publisher.
References
Aleb, N. (2021). Multilevel attention models for drug target binding affinity prediction. Neural Process. Lett. 53 (1-2), 4659–4676. doi:10.1007/s11063-021-10617-4
Chu, Z., Huang, F., Fu, H., Quan, Y., Zhou, X., Liu, S., et al. (2022). Hierarchical graph representation learning for the prediction of drug-target binding affinity. Inf. Sci. 613, 507–523. doi:10.1016/j.ins.2022.09.043
Davis, M. I., Hunt, J. P., Herrgard, S., Ciceri, P., Wodicka, L. M., Pallares, G., et al. (2011). Comprehensive analysis of kinase inhibitor selectivity. Nat. Biotechnol. 29 (11), 1046–1051. doi:10.1038/nbt.1990
Dehghan, A., Abbasi, K., Razzaghi, P., Banadkuki, H., and Gharaghani, S. (2024). CCL-DTI: contributing the contrastive loss in drug–target interaction prediction. BMC Bioinforma. 25, 48–15. doi:10.1186/s12859-024-05671-3
Fang, K., Zhang, Y., Du, S., and He, J. (2023). ColdDTA: utilizing data augmentation and attention-based feature fusion for drug-target binding affinity prediction. Comput. Biol. Med. 164, 107372. doi:10.1016/j.compbiomed.2023.107372
Gaulton, A., Hersey, A., Nowotka, M., Bento, A. P., Chambers, J., Mendez, D., et al. (2017). The ChEMBL database in 2017. Nucleic Acids Res. 45 (D1), D945-D954–D954. doi:10.1093/nar/gkw1074
Gu, Y., Zhang, X., Xu, A., Chen, W., Liu, K., Wu, L., et al. (2023). Protein–ligand binding affinity prediction with edge awareness and supervised attention. iScience 26 (1), 105892. doi:10.1016/j.isci.2022.105892
Hu, Y., Song, X., Feng, Z., and Wu, X. (2023). MFR-DTA: a multi-functional and robust model for predicting drug–target binding affinity and region. Bioinformatics 39 (2), btad056. doi:10.1093/bioinformatics/btad056
Jiang, M., Wang, S., Zhang, S., Zhou, W., Zhang, Y., and Li, Z. (2022). Sequence-based drug-target affinity prediction using weighted graph neural networks. BMC Genomics 23 (1), 449. doi:10.1186/s12864-022-08648-9
Jiang, M. J., Li, Z., Zhang, S., Wang, S., Wang, X., Yuan, Q., et al. Drug–target affinity prediction using graph neural network and contact maps. RSC Adv., 35(10): 20701–20712. 2020. doi:10.1039/D0RA02297G
Karim, A., Razzaghi, P., Poso, A., Amanlou, M., Ghasemi, J. B., and Ali, M.-N. (2020). DeepCDA: deep cross-domain compound–protein affinity prediction through LSTM and convolutional neural networks. Bioinformatics 36 (17), 4633–4642. doi:10.1093/bioinformatics/btaa544
Lennox, M., Robertson, N., and Devereux, B. (2021). Modelling drug-target binding affinity using a BERT based graph neural network. IEEE Engineering in Medicine and Biology Society, 4348–4353. doi:10.1109/EMBC46164.2021.9629695
Li, P. Y., Li, Y. Q., Hsieh, C. Y., Zhang, S., Liu, X., Liu, H., et al. (2021b). TrimNet: learning molecular representation from triplet messages for biomedicine. Briefings Bioinforma. 22 (4), bbaa266. doi:10.1093/bib/bbaa266
Li, S., Zhou, J., Xu, T., Huang, L., Wang, F., Xiong, H., et al. (2021a). Structure-aware interactive graph neural networks for the prediction of protein-ligand binding affinity. arXiv:2107.10670. doi:10.48550/arXiv.2107.10670
Liao, J., Chen, H., Wei, L., and Wei, L. (2022). GSAML-DTA: an interpretable drug-target binding affinity prediction model based on graph neural networks with self-attention mechanism and mutual information. Comput. Biol. Med. 150, 106145. doi:10.1016/j.compbiomed.2022.106145
Lin, X. (2020). DeepGS: deep representation learning of graphs and sequences for drug-target binding affinity prediction. arXiv:2003, 13902v2. doi:10.48550/arXiv.2003.13902
Liyaqat, T., Ahmad, T., and Saxena, C. (2023). TeM-DTBA: time-efficient drug target binding affinity prediction using multiple modalities with Lasso feature selection. J. Computer-Aided Mol. Des. 37, 573–584. doi:10.1007/s10822-023-00533-1
Lu, A. X., Zhang, H., Ghassemi, M., and Moses, A. (2020). Self-supervised contrastive learning of protein representations by mutual information maximization. BioRxiv.
Meng, Y., Wang, Y., Xu, J., Lu, C., Tang, X., Peng, T., et al. (2024). Drug repositioning based on weighted local information augmented graph neural network. Briefings Bioinforma. 25 (1), bbad431. doi:10.1093/bib/bbad431
Metz, J. T., Johnson, E. F., Soni, N. B., Merta, P. J., Kifle, L., and Hajduk, P. J. (2011). Navigating the kinome. Nat. Chem. Biol. 7 (4), 200–202. doi:10.1038/nchembio.530
Monteiro, N. R. C., Oliveira, J. L., and Arrais, J. P. (2024). TAG-DTA: binding-region-guided strategy to predict drug-target affinity using transformers. Expert Syst. Appl. 238 (15), 122334. doi:10.1016/j.eswa.2023.122334
Mukherjee, S., Ghosh, M., and Basuchowdhuri, P. (2022). DeepGLSTM: deep Graph Convolutional Network and LSTM based approach for predicting drug-target binding affinity. Proc. 2022 SIAM Int. Conf. Data Min. (SDM), 729–737. doi:10.1137/1.9781611977172.82
Nguyen, T., Le, H., and Venkatesh, S. (2021). GraphDTA: prediction of drug–target binding affinity using graph convolutional networks. Bioinformatics 37 (8), 1140–1147. doi:10.1093/bioinformatics/btaa921
Nguyen, T. M., Nguyen, T., Le, T. M., and Tran, T. (2022). GEFA: early fusion approach in drug-target affinity prediction. IEEE/ACM Trans. Comput. Biol. Bioinforma. 19 (2), 718–728. doi:10.1109/TCBB.2021.3094217
Öztürk, H., Özgür, A., and Ozkirimli, E. (2018). DeepDTA: deep drug–target binding affinity prediction. Bioinformatics 34 (17), i821–i829. doi:10.1093/bioinformatics/bty593
Öztürk, H., and Ozkirimli, E. (2019). WideDTA: prediction of drug-target binding affinity. arXiv Prepr. arXiv:1902.04166. doi:10.48550/arXiv.1902.04166
Pan, S., Xia, L., Xu, L., and Lil, Z. (2023). SubMDTA: drug target affinity prediction based on substructure extraction and multi-scale features. BMC Bioinforma. 24 (1), 334. doi:10.1186/s12859-023-05460-4
Peng, L., Liu, X., Yang, L., Tu, Y., Yu, Q., Li, Z., et al. (2024). BINDTI: a bi-directional intention network for drug-target interaction identification based on attention mechanisms. IEEE J. Biomed. Health Inf., 1–12. doi:10.1109/JBHI.2024.3434439
Qiu, X., Wang, H., Tan, X., and Fang, Z. (2024). G-K BertDTA: a graph representation learning and semantic embedding-based framework for drug-target affinity prediction. Comput. Biol. Med. 173, 108376. doi:10.1016/j.compbiomed.2024.108376
Rafiei, F., Zeraati, H., Abbasi, K., Razzaghi, P., Ghasemi, J. B., Parsaeian, M., et al. (2024). CFSSynergy: combining feature-based and similarity-based methods for drug synergy prediction. J. Chem. Inf. Model. 67 (7), 2577–2585. doi:10.1021/acs.jcim.3c01486
Landrum, G. (2016). RDKit: Open-source cheminformatics. Bib sonomy. Available at: https://www.rdkit.org.
Sun, F.-Y., Hoffmann, J., Verma, V., and Tang, J. (2020). InfoGraph: unsupervised and semisupervised graph-level representation learning via mutual information maximization. arXiv:1908.01000. doi:10.48550/arXiv.1908.01000
Swiss-Port dataset. Available at: http://www.gpmaw.com/html/swiss-prot.html.
Tang, J., Szwajda, A., Shakyawar, S., Xu, T., Hintsanen, P., Wennerberg, K., et al. (2014). Making sense of large-scale kinase inhibitor bioactivity datasets: a comparative and integrative analysis. J. Of Chem. Inf. And Model. 54 (3), 735–743. doi:10.1021/ci400709d
Tang, J., Tanoli, Z. R., Ravikumar, B., Alam, Z., Rebane, A., Vähä-Koskela, M., et al. (2018). Drug target commons: a community effort to build a consensus knowledge base for drug-target interactions. Cell Chem. Biol. 25 (2), 224–229.e2. doi:10.1016/j.chembiol.2017.11.009
Tang, X., Zhou, C., Lu, C., Meng, Y., Xu, J., Hu, X., et al. (2023). Enhancing drug repositioning through local interactive learning with bilinear attention networks. IEEE J. Biomed. Health Inf., 1–12. doi:10.1109/JBHI.2023.3335275
Tsubaki, M., Tomii, K., and Sese, J. (2019). Compound–protein interaction prediction with end-to-end learning of neural networks for graphs and sequences. Bioinformatics 35 (2), 309–318. doi:10.1093/bioinformatics/bty535
US EPA Summary les from invitrodb v2. Available at: https://www.epa.gov/chemical-research/toxicity-forecaster-toxcasttm-data (Accessed March 22, 2018).
Wang, J., Wen, N. F., Wang, C., Zhao, L., and Cheng, L. (2022). ELECTRA-DTA: a new compound-protein binding affinity prediction model based on the contextualized sequence encoding. J. Cheminformatics 14, 14. doi:10.1186/s13321-022-00591-x
Wu, H., Liu, J., Jiang, T., Zou, Q., Qi, S., Cui, Z., et al. (2024). AttentionMGT-DTA: a multi-modal drug-target affinity prediction using graph transformer and attention mechanism. Neural Netw. 169, 623–636. doi:10.1016/j.neunet.2023.11.018
Yang, Z. D., Zhong, W. H., Zhao, L., and Yu-Chian Chen, C. (2022). MGraphDTA: deep multiscale graph neural network for explainable drug–target binding affinity prediction. Chem. Sci. 13 (3), 816–833. doi:10.1039/D1SC05180F
Ye, Q., Zhang, X., and Lin, X. (2021). “Drug-target interaction prediction via multiple output graph convolutional networks,” in Intelligent Computing Theories and Application. ICIC 2021. Lecture Notes in Computer Science. Editors D. S. Huang, K. H. Jo, K. H. Jo, V. Gribova, and P. Premaratne (Cham: Springer). doi:10.1007/978-3-030-84532-2_9
Ye, Q., Zhang, X., and Lin, X. (2023). Drug-target interaction prediction via graph auto-encoder and multi-subspace deep neural networks. IEEE/ACM Trans. Comput. Biol. Bioinforma. 20 (5), 2647–2658. doi:10.1109/TCBB.2022.3206907
You, Y., and Shen, Y. (2022). Cross-modality and self-supervised protein embedding for compound-protein affinity and contact prediction. Bioinformatics 16 (Suppl_2), ii68–ii74. doi:10.1093/bioinformatics/btac470
Zeng, X., Zhong, K.-Y., Jiang, B., and Yi, Li (2023). Fusing sequence and structural knowledge by heterogeneous models to accurately and interpretively predict drug–target affinity. Molecules 28 (24), 8005. doi:10.3390/molecules28248005
Zeng, Y. N., Chen, X. R., Luo, Y., Li, X., and Peng, D. (2021). Deep drug-target binding affinity prediction with multiple attention blocks. Briefings Bioinforma. 22 (5), bbab117. doi:10.1093/bib/bbab117
Zhang, Li, Wang, C.-C., Zhang, Y., and Chen, X. (2023a). GPCNDTA: prediction of drug-target binding affinity through cross-attention networks augmented with graph features and pharmacophores. Comput. Biol. Med. 166, 107512. doi:10.1016/j.compbiomed.2023.107512
Zhang, L., Zeng, W., Li, K., Chen, J., and Li, K. (2024). GDilatedDTA: graph dilation convolution strategy for drug target binding affinity prediction. Biomed. Signal Process. Control 92, 106110. doi:10.1016/j.bspc.2024.106110
Zhang, S. G., Jiang, M. J., Wang, S., Wang, X., Wei, Z., and Li, Z. (2021). SAG-DTA: prediction of drug–target affinity using self-attention graph network. Int. J. Mol. Sci. 22 (16), 8993. doi:10.3390/ijms22168993
Zhang, X., Li, Y., Wang, J., Xu, G., and Gu, Y. (2023b). A multi-perspective model for protein-ligand-binding affinity prediction. Comput. Life Sci. 15, 696–709. doi:10.1007/s12539-023-00582-y
Zhao, Q., Xiao, F., Yang, M., Li, Y., and Wang, J. (2019). “AttentionDTA: prediction of drug–target binding affinity using attention model,” in Proceedings of the 2019 IEEE International Conference on Bioinformatics and Biomedicine (BIBM), San Diego, CA, 18-21 November 2019. doi:10.1109/BIBM47256.2019.8983125
Zhou, J., Li, S., Huang, L., Xiong, H., Wang, F., Xu, T., et al. (2020). Distance-aware molecule graph attention network for drug-target binding affinity prediction. arXiv:2012, 09624v1. doi:10.48550/arXiv.2012.09624
Keywords: drug-target affinity, pre-training model, graph isomorphism network, deep neural network, feature extraction
Citation: Ye Q and Sun Y (2024) Graph neural pre-training based drug-target affinity prediction. Front. Genet. 15:1452339. doi: 10.3389/fgene.2024.1452339
Received: 20 June 2024; Accepted: 27 August 2024;
Published: 16 September 2024.
Edited by:
Quan Zou, University of Electronic Science and Technology of China, ChinaReviewed by:
Xiangzheng Fu, Hunan University, ChinaChu Pan, University Health Network (UHN), Canada
XianFang Tang, Wuhan Textile University, China
Karim Abbasi, Sharif University of Technology, Iran
Copyright © 2024 Ye and Sun. This is an open-access article distributed under the terms of the Creative Commons Attribution License (CC BY). The use, distribution or reproduction in other forums is permitted, provided the original author(s) and the copyright owner(s) are credited and that the original publication in this journal is cited, in accordance with accepted academic practice. No use, distribution or reproduction is permitted which does not comply with these terms.
*Correspondence: Yaxin Sun, c3VueWF4aW4yMDA1QGZveG1haWwuY29t