 Xiangyu Liao
 Wufei Zhu
 Chaoyun Liu
- 1Department of Oncology, Yichang Central People’s Hospital, The First College of Clinical Medical Science, China Three Gorges University, Yichang, China
- 2Department of Endocrinology, Yichang Central People’s Hospital, The First College of Clinical Medical Science, China Three Gorges University, Yichang, China
- 3College of Information Engineering, Xi’an Mingde Institute of Technology, Xi’an, China
Introduction: In the realm of next-generation sequencing datasets, various characteristics can be extracted through k-mer based analysis. Among these characteristics, genome size (GS) is one that can be estimated with relative ease, yet achieving satisfactory accuracy, especially in the context of heterozygosity, remains a challenge.
Methods: In this study, we introduce a high-precision genome size estimator, GSET (Genome Size Estimation Tool), which is based on k-mer histogram correction.
Results: We have evaluated GSET on both simulated and real datasets. The experimental results demonstrate that this tool can estimate genome size with greater precision, even surpassing the accuracy of state-of-the-art tools. Notably, GSET also performs satisfactorily on heterozygous datasets, where other tools struggle to produce useable results.
Discussion: The processing model of GSET diverges from the popular data fitting models used by similar tools. Instead, it is derived from empirical data and incorporates a correction term to mitigate the impact of sequencing errors on genome size estimation. GSET is freely available for use and can be accessed at the following URL: https://github.com/Xingyu-Liao/GSET.
1 Introduction
Estimating the size of a genome (GS) is a crucial step in understanding the intricacies of genome evolution and is often required in various aspects of genome sequencing and assembly (Sun et al., 2018). Experimental methods, such as feulgen densitometry and flow cytometry, offer one approach to this task. However, these methods can be complex due to their reliance on specialized instruments. In contrast, computational methods offer a different approach. These methods are based on the concept of k-mers, which are unique subsequences of a given length ‘k’ within the DNA sequence. By creating a histogram of these unique k-mers and applying mathematical models, these methods can provide a useful estimate of genome size. The initial model for this approach was designed for an ideal situation. It did not take into account factors such as repeat fragments and heterozygosity, and it assumed that the sequencing process was unbiased (Li and Waterman, 2003). However, real-world data often present more complicated situations. To address these complexities, several statistical distributions have been employed to fit the unique k-mer frequencies histogram. These include the Poisson distribution, the negative binomial distribution, and the skew normal distribution (Liu et al., 2012; Vurture et al., 2017). These distributions help to account for the variability and skewness that can occur in real sequencing data, thereby improving the accuracy of the genome size estimation. In conclusion, while experimental methods for genome size estimation have their place, the advent of k-mer based computational methods has provided a powerful tool for researchers. By continually refining these methods and models, we can hope to gain ever more accurate insights into the complex world of genomics.
Several methods have been proposed that utilize the fitting of the k-mer frequency histogram. For instance, findGSE (Guenzi-Tiberi et al., 2024) employs a skewed normal distribution to fit the k-mer frequency histogram. In contrast, GenomeScope (Oey et al., 2019; Thai et al., 2019) uses a mixture model of the negative binomial model for the same purpose. Both of these methods can effectively mitigate the estimation bias caused by sequencing errors and imbalances to a certain extent through fitting. However, their final estimation accuracy is contingent upon the degree of fit between the distribution characteristics of the actual sequencing data and its hypothetical distribution model. To elaborate, the findGSE method leverages the skewed normal distribution, which is a flexible model capable of capturing asymmetry in the k-mer frequency histogram. This allows it to handle a wide range of genome size estimation scenarios, including those with significant sequencing errors or imbalances. On the other hand, GenomeScope employs a mixture model of the negative binomial distribution. This model is particularly effective when dealing with overdispersed count data, which is common in genome size estimation tasks. The mixture model allows GenomeScope to capture the inherent variability in k-mer frequencies, leading to more accurate genome size estimates. However, it is important to note that while these methods can control the estimation bias to a certain extent, they are not foolproof. The accuracy of the final genome size estimate heavily depends on how well the chosen distribution fits the actual sequencing data. If the real data deviates significantly from the assumed distribution, the genome size estimate may be off. Therefore, it is crucial to choose the appropriate method based on the characteristics of the sequencing data at hand.
The unique k-mer distribution histogram, as depicted in Figure 1, provides a visual representation of the general cases of genome sequencing. The left peak of the curve primarily comprises k-mers that are a result of sequencing errors and biases, which occur at a low frequency. Conversely, the right tail of the curve is made up of repetitive fragments from the genome, which occur at a higher frequency. Recent models have employed various distributions to fit either the entire curve or a portion of it (Sun et al., 2018). The goal of these models is to closely align the fitted curve with the homozygous peak, thereby minimizing the impact of the error peak. This approach enhances the accuracy of genome size estimation. However, in the case of heterozygosity, a heterozygous peak appears between the valley and the homozygous peak. This additional peak complicates the fitting process, and the aforementioned distribution-based models may not perform well without modifications. In such scenarios, prior information can be invaluable in identifying the correct homozygous peak. In summary, while the unique k-mer distribution histogram and the associated mathematical models provide a powerful tool for genome size estimation, they also present challenges. These challenges, particularly in the case of heterozygosity, highlight the need for continual refinement of these models and the incorporation of prior information when available. By doing so, we can improve the accuracy and reliability of genome size estimation, thereby advancing our understanding of genome evolution.
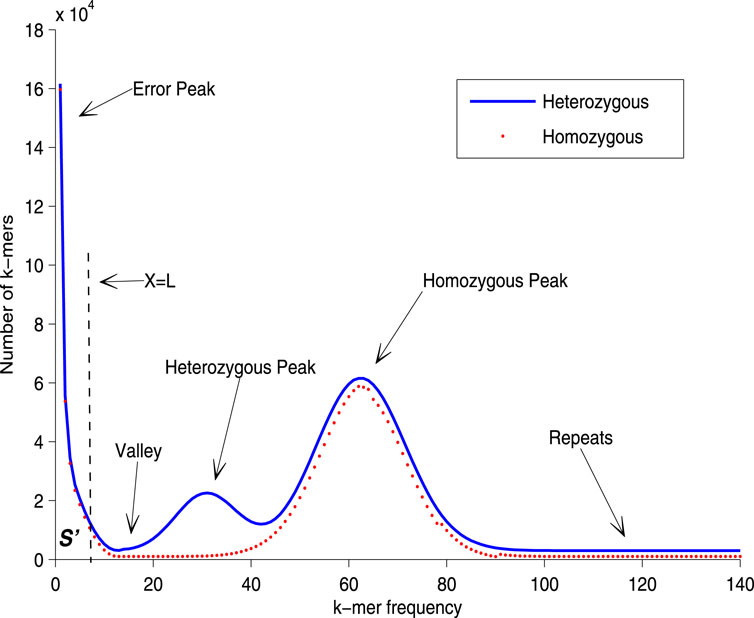
Figure 1. Unique k-mer histogram. In order to rectify the homozygous peak, the disturbance of the error peak must first be removed. The error rate of sequencing is utilized to estimate the number of error k-mers,
In this study, we introduce a high-precision genome size estimator, GSET (Genome Size Estimation Tool), which leverages k-mer histogram correction. Unlike the popular data fitting models employed by similar tools, the processing model of GSET is derived from empirical data. It incorporates a correction term specifically designed to mitigate the impact of sequencing errors on genome size estimation. We have rigorously evaluated GSET using both simulated and real datasets. The experimental results demonstrate that GSET can estimate genome size with remarkable precision, even surpassing the accuracy of state-of-the-art tools currently available. Notably, GSET also performs exceptionally well on heterozygous datasets, a scenario where many other tools struggle to produce reliable results. This makes GSET a versatile and robust tool for genome size estimation across a variety of contexts.
2 Materials and methods
Assuming that the reference genome is a random sequence with no heterozygosity and no repeats, and the coverage of each position is uniformly distributed. Let
Let
In the process of genome size estimation, when sequencing errors and bias occur, the corresponding histogram of the unique k-mer frequency may have an exponentially decreasing curve, just as the shown in the left part of Figure 1. These erroneous k-mers will often cause the main peak of the frequency distribution histogram to be shifted to the right compared to when there is no erroneous k-mer. In order to eliminate the negative impact of these erroneous k-mers on the accuracy of the main peak identification, we need to adopt certain strategies to correct the estimation (e.g., reducing the number of low-frequency k-mer participating in frequency statistics, that is, reducing the value of
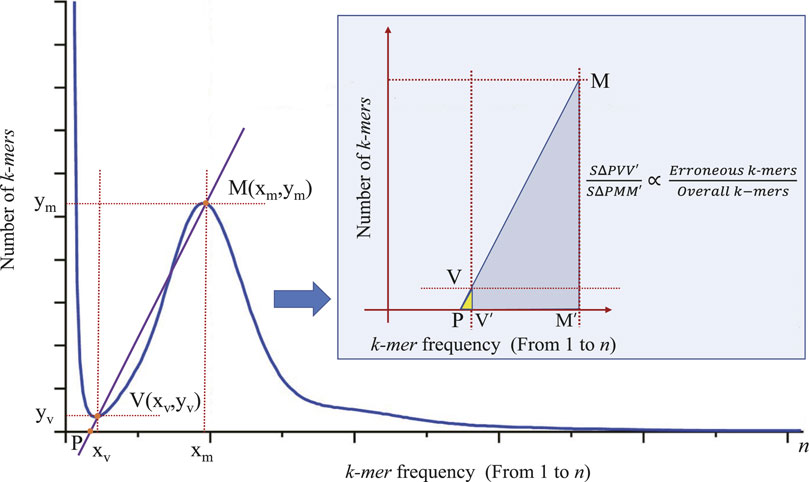
Figure 2. The principle of correcting the main peak of k-mer frequency distribution histogram. Points
The rate and types of sequencing errors vary depending on the NGS platforms and library preparation methods. For instance, Illumina sequencing technologies exhibit error rates ranging from 0.5% to 2.5% (Kelley et al., 2010). These errors tend to occur more frequently in regions with extremely high GC or AT content, such as constant heterochromatin regions that include centromeres, telomeres, or highly repetitive sequences. While sequencing errors can impact the determination of
3 Results
We evaluated the performance of GSET on both four simulated datasets and nine real datasets. The simulated datasets were generated using ART (Huang et al., 2012), a widely used simulator. The real datasets (

Table 1. The genome size estimated by different tools on simulated homozygous datasets.
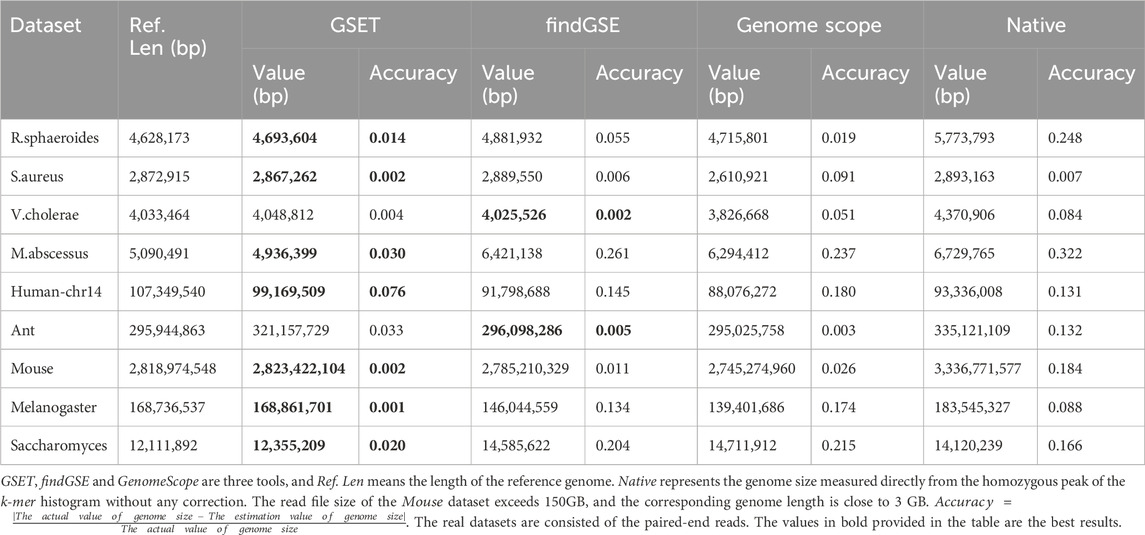
Table 2. The genome size estimated by different tools on real homozygous datasets.
Compared to three other methods, GSET demonstrated superior accuracy. We further evaluated GSET’s performance on heterozygous datasets. Our experiments involved both simulated datasets generated by PIRS (Hu et al., 2012) and a real dataset
The performance comparison of
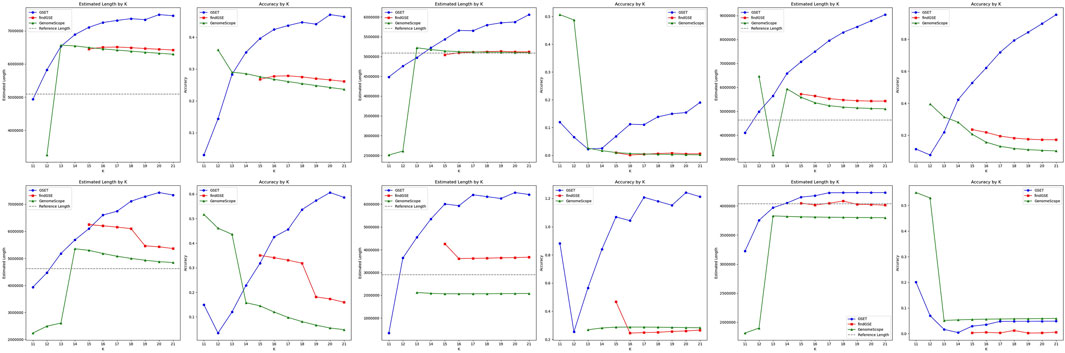
Figure 3. Performance comparison of genome size estimation using three tools: GSET, findGSE, and GenomeScope on real homozygous datasets.
The performance comparison of
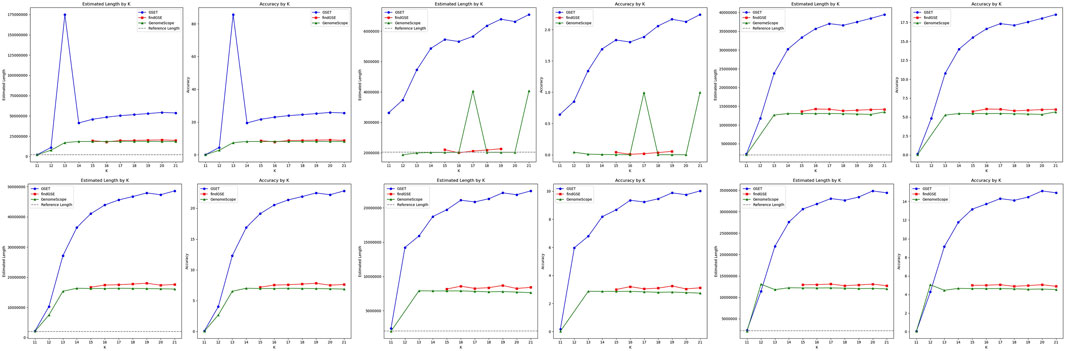
Figure 4. Performance comparison of genome size estimation using three tools: GSET, findGSE, and GenomeScope on the simulated heterozygous datasets.
4 Discussion
In this study, we address specific principles, delve into implementation details, and engage with user concerns. We meticulously respond to these issues in a systematic manner across the subsequent sections.
4.1 Novelty of the proposed method
The methods for estimating genome size typically fall into two categories: experimental methods and estimation methods. Experimental techniques, such as flow cytometry and Southern blotting, are costly and require specialized equipment. Estimation methods, on the other hand, can be broadly classified based on their approach. The first category involves analyzing the k-mer frequency distribution histogram, while the second relies on sequence alignment and assembly. Both estimation methods utilize the original sequencing reads, but the latter demands more computational resources. Among the tools commonly used for k-mer-based estimation, three stand out: findGSE, GenomeScope, and our proposed method, GSET. While findGSE fits the k-mer frequency histogram using a skewed normal distribution, GenomeScope employs a mixture model based on the negative binomial distribution. These approaches effectively mitigate estimation bias caused by sequencing errors and imbalances, but their accuracy hinges on how well their distribution models match the real sequencing data. In contrast, our method directly analyzes the original k-mer frequency distribution, offering three key advantages. First, it ensures the integrity of the information used. Second, it achieves a zero-deviation fit with the actual distribution. Finally, correction coefficients reduce the impact of erroneous k-mers, enhancing estimation accuracy. Experimental results demonstrate that our approach outperforms the former two methods.
4.2 Selection of the k-mer size in estimation
Selecting the appropriate value of
Additionally, if the species is unknown, we recommend observing the k-mer frequency histogram to assess whether the current value of
4.3 Application scenarios of GSET
In the research of bioinformatics, genome size estimation has been applied in many aspects (Bosco et al., 2007; Gao et al., 2014). For example, in the applications of species classification and evolutionary relationship analysis, by estimating the genome size of the sequenced samples, we can quickly cluster these samples and infer the evolutionary relationship among them. In this study, we consider using
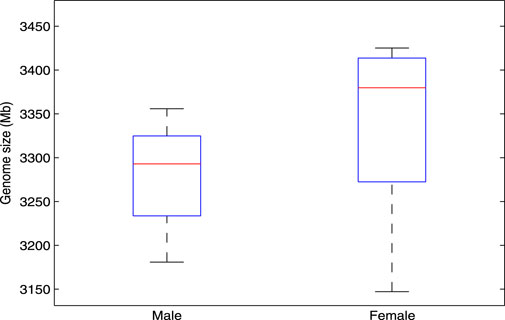
Figure 5. A stable difference in genome length exists between male and female genomes, as estimated by the
5 Conclusion
In this paper, we present GSET to realize an higher accuracy genome size estimation, the mathematical model of GSET is concise, and is easily to be computed than the fitting based methods. Through the correction factor, we get a satisfactory estimation results on both simulated datasets and real datasets, even on the situation of heterozygous, it can also give out more useable results than other distribution based methods. GSET could be used for analysis which need a relatively higher accuracy estimation of genome size in the next-generation sequencing data.
Data availability statement
The original contributions presented in the study are included in the article/Supplementary Material, further inquiries can be directed to the corresponding author.
Author contributions
XL: Conceptualization, Data curation, Formal Analysis, Funding acquisition, Investigation, Methodology, Project administration, Resources, Software, Supervision, Validation, Visualization, Writing–original draft, Writing–review and editing. WZ: Data curation, Methodology, Validation, Writing–original draft, Writing–review & editing. CL: Conceptualization, Data curation, Formal Analysis, Funding acquisition, Investigation, Methodology, Project administration, Resources, Software, Supervision, Validation, Visualization, Writing–original draft, Writing–review and editing.
Funding
The author(s) declare that financial support was received for the research, authorship, and/or publication of this article. This work has been supported by the National Natural Science Foundation of China under Grant No. 62002388, as well as the Health Technology and Development Research Plan of Yichang under Grants Nos A12301-07 and A13301-10.
Conflict of interest
The authors declare that the research was conducted in the absence of any commercial or financial relationships that could be construed as a potential conflict of interest.
Publisher’s note
All claims expressed in this article are solely those of the authors and do not necessarily represent those of their affiliated organizations, or those of the publisher, the editors and the reviewers. Any product that may be evaluated in this article, or claim that may be made by its manufacturer, is not guaranteed or endorsed by the publisher.
Supplementary material
The Supplementary Material for this article can be found online at: https://www.frontiersin.org/articles/10.3389/fgene.2024.1451730/full#supplementary-material
References
Bosco, G., Campbell, P., Leiva-Neto, J. T., and Markow, T. A. (2007). Analysis of drosophila species genome size and satellite dna content reveals significant differences among strains as well as between species. Genetics 177 (3), 1277–1290. doi:10.1534/genetics.107.075069
Gao, X.-Y., Zhi, X.-Y., Li, H.-W., Klenk, H. P., and Li, W. J. (2014). Comparative genomics of the bacterial genus streptococcus illuminates evolutionary implications of species groups. PLoS ONE 9 (6), 101229. doi:10.1371/journal.pone.0101229
Guenzi-Tiberi, P., Istace, B., Alsos, I. G., Coissac, E., Lavergne, S., Aury, J. M., et al. (2024). Locogse, a sequence-based genome size estimator for plants. Front. Plant Sci. 15, 1328966. doi:10.3389/fpls.2024.1328966
Hu, X., Yuan, J., Shi, Y., Lu, J., Liu, B., Li, Z., et al. (2012). pirs: profile-based illumina pair-end reads simulator. Bioinformatics 28 (11), 1533–1535. doi:10.1093/bioinformatics/bts187
Huang, W., Li, L., Myers, J. R., and Marth, G. T. (2012). Art: a next-generation sequencing read simulator. Bioinformatics 28 (4), 593–594. doi:10.1093/bioinformatics/btr708
Kajitani, R., Toshimoto, K., Noguchi, H., Toyoda, A., Ogura, Y., Okuno, M., et al. (2014). Efficient de novo assembly of highly heterozygous genomes from whole-genome shotgun short reads. Genome Res. 24 (8), 1384–1395. doi:10.1101/gr.170720.113
Kelley, D. R., Schatz, M. C., and Salzberg, S. L. (2010). Quake: quality-aware detection and correction of sequencing errors. Genome Biol. 11, 116. doi:10.1186/gb-2010-11-11-r116
Li, X., and Waterman, M. S. (2003). Estimating the repeat structure and length of dna sequences using l-tuples. Genome Res. 13 (8), 1916–1922. doi:10.1101/gr.1251803
Liu, B., Shi, Y., Yuan, J., Hu, X., Zhang, H., Li, N., et al. (2012). Estimation of genomic characteristics by analyzing k-mer frequency in de novo genome projects. arXiv, 1308. doi:10.48550/arXiv.1308.2012
Oey, H., Zakrzewski, M., Gravermann, K., Young, N. D., Korhonen, P. K., Gobert, G. N., et al. (2019). Whole-genome sequence of the bovine blood fluke schistosoma bovis supports interspecific hybridization with s. haematobium. PLOS Pathog. 15, 1007513. doi:10.1371/journal.ppat.1007513
Price, A. L., Jones, N. C., and Pevzner, P. A. (2005). De novo identification of repeat families in large genomes. Genome Res. 21, 351–358. doi:10.1093/bioinformatics/bti1018
Sun, H., Ding, J., Piednoël, M., and Schneeberger, K. (2018). findgse: estimating genome size variation within human and arabidopsis using k-mer frequencies. Bioinformatics 4 (34), 550–557. doi:10.1093/bioinformatics/btx637
Thai, B. T., Lee, Y. P., Gan, H. M., Austin, C. M., Croft, L. J., Trieu, T. A., et al. (2019). Whole genome assembly of the snout otter clam, lutraria rhynchaena, using nanopore and illumina data, benchmarked against bivalve genome assemblies. Front. Genet. 10, 1158. doi:10.3389/fgene.2019.01158
Keywords: next-generation sequencing, k-mer frequency distribution, k-mer histogram correction, genome size estimation, sequencing error, sequencing bias
Citation: Liao X, Zhu W and Liu C (2024) A high-precision genome size estimator based on the k-mer histogram correction. Front. Genet. 15:1451730. doi: 10.3389/fgene.2024.1451730
Received: 19 June 2024; Accepted: 09 August 2024;
Published: 22 August 2024.
Edited by:
Shoba Ranganathan, Macquarie University, AustraliaReviewed by:
Xingyi Li, Northwestern Polytechnical University, ChinaFuhao Zhang, Northwest A&F University, China
Xiangmao Meng, Xiangtan University, China
Copyright © 2024 Liao, Zhu and Liu. This is an open-access article distributed under the terms of the Creative Commons Attribution License (CC BY). The use, distribution or reproduction in other forums is permitted, provided the original author(s) and the copyright owner(s) are credited and that the original publication in this journal is cited, in accordance with accepted academic practice. No use, distribution or reproduction is permitted which does not comply with these terms.
*Correspondence: Chaoyun Liu, c3VwZXJjaGFveXVuQDEyNi5jb20=