 Pengchao Gao
 Jiancai Xiao†
 Yan Zhang
 Tiegui Nan
95% of researchers rate our articles as excellent or good
Learn more about the work of our research integrity team to safeguard the quality of each article we publish.
Find out more
ORIGINAL RESEARCH article
Front. Genet. , 26 July 2024
Sec. Genomics of Plants and the Phytoecosystem
Volume 15 - 2024 | https://doi.org/10.3389/fgene.2024.1442277
This article is part of the Research Topic Multi-omics and molecular biology studies on abiotic stress in crops View all 6 articles
Introduction: Research on Glycyrrhiza uralensis, a nonhalophyte that thrives in saline–alkaline soil and a traditional Chinese medicinal component, is focused on improving its ability to tolerate salt stress to increase its productivity and preserve its “Dao-di” characteristics. Furthermore, the inoculation of bioagents such as Bacillus subtilis to increase plant responses to abiotic stressors is currently a mainstream strategy. Mitogen-activated protein kinase (MAPK), a highly conserved protein kinase, plays a significant role in plant responses to various abiotic stress pathways.
Methods: This investigation involved the identification of 21 members of the GuMAPK family from the genome of G. uralensis, with an analysis of their protein conserved domains, gene structures, evolutionary relationships, and phosphorylation sites using bioinformatics tools.
Results: Systematic evolutionary analysis of the 21 GuMAPKs classified them into four distinct subgroups, revealing significant differences in gene structure and exon numbers. Collinearity analysis highlighted the crucial role of segmental duplication in expanding the GuMAPK gene family, which is particularly evident in G. uralensis and shows a close phylogenetic relationship with Arabidopsis thaliana, tomato, and cucumber. Additionally, the identification of phosphorylation sites suggests a strong correlation between GuMAPK and various physiological processes, including hormonal responses, stress resistance, and growth and development. Protein interaction analysis further supported the role of GuMAPK proteins in regulating essential downstream genes. Through examination of transcriptome expression patterns, GuMAPK16-2 emerged as a prospective pivotal regulatory factor in the context of salt stress and B. subtilis inoculation, a finding supported by its subcellular localization within the nucleus.
Discussion: These discoveries offer compelling evidence for the involvement of GuMAPK in the salt stress response and for the exploration of the mechanisms underlying B. subtilis’ enhancement of salt tolerance in G. uralensis.
Glycyrrhiza uralensis Fisch. is a perennial herbaceous plant of the Fabaceae family, and it is the most extensively used medicinal herb in China, earning the title of “King of Herbs” (Zhang and Ye, 2009; Yan et al., 2023). G. uralensis grows mainly in arid or semiarid desert areas, sandy riverbanks, and saline-alkaline soils at altitudes ranging from 400 to 2,700 m and exhibits high ecological adaptability, salt tolerance, and drought resistance. Its moderate salt tolerance contributes significantly to its authenticity as a medicinal herb, maintaining important quality characteristics (Egamberdieva et al., 2021; Shen et al., 2022). Optimal salt concentrations can activate the antioxidative system, calcium ion channels, and hormone (abscisic acid, ethylene) signaling pathways of G. uralensis, promoting sodium excretion and ion distribution to increase plant resilience (Li et al., 2024). However, G. uralensis is not tolerant to saline–alkaline conditions and cannot thrive in highly saline soils. Exposure to elevated salt levels can result in leaf chlorosis, root mortality due to disrupted water balance, ion toxicity, oxidative stress, and nutritional imbalances in the roots. As saline–alkaline land continues to expand and the demand for G. uralensis continues to grow, the practical challenge of insufficient resources has made enhancing its tolerance to saline–alkaline environments a pressing issue in the cultivation of G. uralensis.
Plants frequently encounter diverse abiotic stresses and pathogen infections throughout their growth and development. As a result, over the course of long-term evolutionary processes, plants have developed intricate regulatory networks that contribute to both growth and development and to responses to adversities. MAPK is a serine‒threonine protein kinase that is an important part of the MAPK cascade signaling pathway (Jagodzik et al., 2018). Through sequential phosphorylation, MAPK, MAPKK, and MAPKKK together form a highly conserved cascade signal transduction pathway (Zhang and Klessig, 2001; Nakagami et al., 2005; Danquah et al., 2014). The activity of MAPK is believed to be regulated by dual phosphorylation sites in the activation loop amino acid sequence, where phosphorylation signals are transmitted from MAPKKK to MAPK. When MAPKKK is activated by sensors or receptors and phosphorylated, it activates downstream of MAPKK, which in turn activates MAPK through dual phosphorylation of conserved tyrosine and threonine residues in the activation loop (T-LOOP) located between kinase subdomains VII and VIII. Phosphorylation of these sites increases MAPK activity by more than a thousand fold (Ichimura et al., 2002). Previous research has shown the importance and mechanisms of MAPK in coping with salt stress. There is a close relationship between ROS signal transduction and MAPK activation in plants, where H2O2 acts as a key signaling molecule that can induce the MAPK cascade to activate MEKK1-MKK4/5-MPK3/6 to cope with salt stress (Canagarajah et al., 1997; Jalmi and Sinha, 2015; Sachdev et al., 2021). Given the potential application of MAPK in enhancing crop salt tolerance and stress resistance through genetic improvements, more attention is shifting from traditional cultivation techniques to bioinformatics and functional verification research in abiotic stress biology.
Since Stafstrom et al. (1993) first cloned the first higher plant MAPK protein kinase encoding gene D5 in pea, an increasing number of scholars have conducted research on the entire MAPK gene family in plants such as Arabidopsis thaliana (MAPK Group, 2002), wheat (Ergen et al., 2009), and lettuce (Wang et al., 2022). In terms of evolutionary relationships, MAPK proteins in plants are divided into four subgroups: A, B, C, and D. Among them, A, B, and C belong to the TEY type, whereas the TDY type contains only the D subgroup. MAPK proteins containing TDY motifs are found only in plants. The common docking domain (CD) conserved domain exists in some MAPK proteins with the conserved motif (LH) DXXDE (P) X, which is usually highly conserved in groups A and B. The CD domain of group C has been modified, whereas group D does not contain this domain (Shang et al., 2023).
The MAPK cascade pathway is involved in almost all life processes of plants and plays a key role in plant growth and development, especially under biological and abiotic stresses (Shao et al., 2020). Among them, the functions of the A. thaliana MAPK family members AtMPK3, AtMPK4, and AtMPK6 have been widely studied. AtMPK4 negatively regulates plant disease resistance and osmotic stress tolerance. Together with AtMPK6, AtMPK3 participates in regulating auxin polar transport and promoting ethylene synthesis. In addition to A. thaliana, 16, 18, 12, and 11 MAPK genes have been identified in rice (Hamel et al., 2006), kiwifruit (Wang et al., 2018), grape (Zhan et al., 2017), and cotton (Zhang et al., 2016), respectively, where they have been found to contain a certain number of salt tolerance genes and participate in the regulation of MAPK cascade pathways upstream and downstream.
The mainstream strategy of using microbial agents to enhance the plant response to abiotic stress has become a major trend in resistance biology (Liu et al., 2010; Saberi et al., 2021). Bacillus subtilis (Bs), a gram-positive bacterium capable of surviving in extremely hot environments, has drawn widespread attention because of its strong adaptability and potential role in resisting abiotic stress, as discovered in microbiological engineering (Xiao et al., 2024). This spore-forming bacterium can withstand harsh environments and promote plant growth by forming biofilms in the rhizosphere or establishing symbiotic relationships with roots. This capability enhances the production of stress proteins, antioxidants, and growth hormones, facilitating plant growth. It aids in maintaining cellular osmotic regulation and the water balance under salt stress conditions. Recently, researchers have discovered correlations between the transcriptomes of cotton and B. subtilis, thereby enhancing biotic stress tolerance. The mechanism by which Bs enhances plant salt tolerance by excreting Na+ ions has been revealed and demonstrated in important crop species, such as rice and clover. Our previous experiments validated the effectiveness of enhancing licorice salt tolerance via the inoculation of Bs, and multiple omics analyses revealed the key metabolic pathways and signaling pathways involved (Chardin et al., 2017). The MAPK pathway, which is crucial for regulating abiotic stress responses by modulating cell division, was notably enriched in the KEGG pathway database. Previous studies have elucidated only the basic signaling pathways and key differentially expressed genes of MAPK (Xiao et al., 2024). Through bioinformatics analysis, we aimed to gain deeper insights into the function and diversity of the GuMAPK family in response to salt stress. In this study, we identified MAPK gene family members in the G. uralensis genome based on bioinformatics, analyzed their chromosomal positions, evolutionary relationships, conserved motifs and domains, cis-acting elements, and phosphorylation sites, and studied the expression levels of GuMAPK genes under salt stress and after B. subtilis inoculation through transcriptome and protein interaction analysis. These findings provide further evidence for the in-depth exploration of the mechanism by which B. subtilis enhances G. uralensis salt tolerance.
The Glycyrrhiza uralensis seeds used were identified and preserved in our laboratory. Full and intact G. uralensis seeds were first soaked in 75% ethanol for 30 s and then in a 3% sodium hypochlorite solution for 15 min on an aseptic operating table. They were subsequently rinsed with sterile water at least three times until neutral and then placed in a 4°C refrigerator for 3 days of stratification before being transferred to a constant 28°C incubator for a 7-day dark treatment. Once most seeds displayed a whitish appearance, they were planted in pots and cultivated for 50 days in a well-lit room.
The salt stress treatment commenced when the G. uralensis plants had grown 8–10 true leaves. We established two salt stress concentrations: 100 mmol/L (NCL) and 300 mmol/L (NCH) NaCl + CaCl2, while the control group (NC0) received no NaCl + CaCl2. In addition, B. subtilis was inoculated as the B. subtilis group, which was divided into Bs0, BsL, and BsH. The seedlings were inoculated with B. subtilis spores by spraying them once every 15 days on the soil surface (with an effective viable count ≥50 billion CFU/g). All of the solutions were prepared with 1/2 Hoagland nutrient solution. In total, four waterings were conducted, with a 6-day interval between each. Root tissues from seedlings at the same growth stage that exhibited robust growth were promptly collected, flash-frozen in liquid nitrogen, and stored at −80°C in a freezer for transcriptome sequencing. The tobacco cultivation method used for the subcellular localization experiments was previously described by Zhang et al., (2023).
The analysis of the MAPK gene family in G. uralensis was conducted by first downloading the full genome data from the JGI database (https://phytozome.jgi.doe.gov/pz/portal.html). The serial/threshold protein kinase domain (PF00069) Hidden Markov Model file was obtained from the PFAM database (http://pfam.xfam.org/). The Hmmsearch tool was then employed to align the G. uralensis genome protein data with the MAPK Hidden Markov Model, selecting protein sequences with an E value ≤ e−10 as candidate MAPK family members. The candidate protein sequences were further validated for conserved domains, using the PFAM website to remove those lacking MAPK domains and repetitive sequences, ultimately retaining 21 MAPK family genes. The physical and chemical characteristics of the MAPK proteins, such as the number of amino acids, molecular weight, isoelectric point (pI), and hydrophobicity, were predicted using the online tool ExPASy (http://web.expasy.org/protparam/). The subcellular localization of GuMAPKs was predicted using the Busca website (http://busca.bio-comp.unibo.it/). Furthermore, protein secondary structure analysis was performed using the SOPMA website (https://npsa-prabi.ibcp.fr/) (Savojardo et al., 2018).
MEGA 11.0 software was used to construct a phylogenetic tree of the MAPK proteins from G. uralensis and A. thaliana using the ClustalW algorithm. The tree-building method should employ the maximum likelihood approach, with all other parameters set to default values. The phylogenetic tree was exported and further enhanced in appearance and color scheme using the Evolview online tool (https://evolgenius.info//evolview-v2/). Additionally, Jalview software was used to refine multiple sequences and create a sequence logo for each MAPK domain using the WebLogo 3 online tool.
MEME (https://meme-suite.org/meme/) was used for online analysis to identify conserved motifs in the GuMAPK proteins (Timothy et al., 2015). Simultaneously, the conserved domains of GuMAPK proteins were predicted, limiting the number of motifs to “10” while keeping the other parameters at the default values. Structural information for the GuMAPK genes was extracted from the downloaded G. uralensis genome database. GSDS (http://gsds.gao-lab.org/) was used to generate gene structure diagrams, which depict the distributions of exons, introns, and untranslated regions (UTRs) (Hu et al., 2015). The three-dimensional structure of GuMAPK proteins was predicted via SWISS-MODEL (https://swissmodel.expasy.org/) via homology modeling. Templates with sequence identities greater than 30% were selected, and protein models were evaluated via SAVESv6.0 (https://saves.mbi.ucla.edu/). Templates validated by three or more evaluations were chosen as the final templates. The protein structures were visualized with the 3D protein structure visualization software VMD (http://www.ks.uiuc.edu/Research/vmd) (Humphrey et al., 1996).
The chromosomal location data of MAPK genes from the G. uralensis genome files were collected and organized. TBtools was used for analysis and visualization of gene location distributions (Chen et al., 2020). Basic Circos analysis was conducted to investigate gene duplication events among GuMAPK members using the default parameters. The genome data of A. thaliana, tomato (Solanum lycopersicum), and cucumber (Cucumis sativus) were downloaded from the Ensembl website. Interspecies collinearity analysis was performed via the plug-in tools Advanced Circos and One Step MCScanX in TBtools.
To identify potential cis-acting elements, the promoter region sequences of GuMAPK genes, which span 2,000 base pairs upstream of the transcription start site, were extracted from the genome data. Cis-acting elements in the upstream region were predicted via the Plant CARE website (http://bioinformatics.psb.ugent.be/webtools/plantcare/html/), and these elements were annotated. Focus should be placed on plotting the positional distributions of the elements related to hormones, the stress response, and growth and development. Phosphorylation analysis of the G. uralensis MAPK gene family was conducted via NetPhos (https://services.healthtech.dtu.dk/service.php?NetPhos-3.1), which revealed the distribution of protein kinase phosphorylation sites within GuMAPKs.
For each treatment, 0.5 g of root tissue was obtained from seedlings exposed to salt concentrations of 0, 100 or 300 mmol/L. These samples were subsequently frozen in liquid nitrogen. RNA extraction from the root tissue samples of G. uralensis seedlings (inclusive of three biological replicates) was conducted using TRIzol® Reagent (Invitrogen, United States). The extracted RNA was purified with AMPure XP beads (FuSheng, Shanghai, China) and subsequently analyzed utilizing the Marjorie BioPharma Technology Co. HiSeq 4000 Illumina sequencing platform in China. Each group’s sequencing results consisted of three independent biological replicates. The average values were used to plot the expression levels of each gene across different groups using the Bioinformatics platform.
The RNA acquired was subjected to reverse transcription, resulting in the generation of complementary DNA (cDNA). Subsequently, differentially expressed gene-specific primers were employed for quantitative polymerase chain reaction (qPCR) utilizing the double-stranded chimeric fluorescent dye method, specifically employing SYBR Green I. An internal reference gene, β-actin, was utilized, and the average of three biological replicates was calculated. Gene expression was determined using the 2−ΔΔCt method.
Glyur001680s00029814 was isolated from G. uralensis using GuMAPK16-2-F/R primers. The coding sequence (CDS) of GuMAPK16-2, lacking a stop codon, was inserted into the TA cloning vector before being subcloned and inserted into the pBWA(V)HS:GFP vector. Following construction, the vectors were introduced into Agrobacterium tumefaciens strain GV3101. The resulting fusion protein, pBWA(V)HS: GFP: GuMAPK16-2, along with the control pBWA(V)HS: GFP, was transiently expressed in tobacco leaves. Following infection, the tobacco plants were cultivated in a light-protected environment at 24°C for 2 days. Fluorescence visualization was subsequently conducted using laser confocal microscopy (Zeiss, Germany).
Through comprehensive bioinformatic analyses, including homology comparisons and domain screening, 21 reliable members of the MAPK gene family were identified in the G. uralensis genome. On the basis of an in-depth analysis of evolutionary relationships between GuMAPK and AtMAPK, a unified nomenclature system was established, leading to the systematic renaming of the identified genes accordingly (Figure 1A). Notably, GuMAPK6 and GuMAPK6* were found to be identical genes. The distribution of members of the G. uralensis MAPK gene family on scaffolds, along with their physicochemical properties, were analyzed (Supplementary Table S1). The results revealed that the molecular weights of the GuMAPKs ranged from 42,620.78 to 72,510.22 Da, with isoelectric points (pIs) varying between 5.20 and 9.22. The length of the amino acid sequences ranged from 369 to 638 aa. Stability prediction of their proteins revealed instability coefficients ranging from 34.32 to 45.55, with 11 GuMAPKs identified as unstable proteins. The hydrophobicity prediction indicated that the grand average hydropathy (GRAVY) score range was −0.619 to −0.113. According to the subcellular localization prediction, except for one GuMAPK (GuMAPK12-2) located in the chloroplast, six GuMAPKs (GuMAPK1, GuMAPK3, GuMAPK3-2, GuMAPK7, GuMAPK12, GuMAPK13) were in the cytoplasm, whereas the remaining 14 GuMAPKs were in the nucleus.
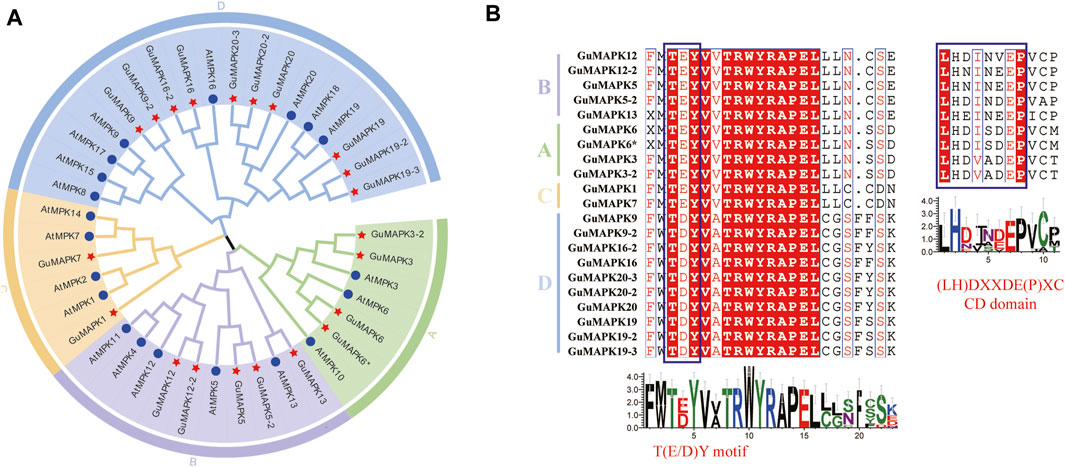
Figure 1. Phylogenetic relationships and multiple sequence alignment analysis of GuMAPKs. (A) Full-length MAPK sequences from Arabidopsis thaliana and Glycyrrhiza uralensis were used to construct a rootless phylogenetic tree. Different colors represent different branches, A-D indicate the different groups of MAPKs. (B) Multiple sequences alignment of the conservative domain from GuMAPK proteins. Dark red highlighted residues are identical, while red words high-lighted residues are similar in all proteins. Blue boxes indicate the TEY/TDY motifs and the CD domain.
To validate the homologous relationship between the GuMAPKs and AtMAPKs gene families, a phylogenetic tree was constructed using the protein sequences of 21 GuMAPKs and 20 AtMAPKs (Figure 1A). GuMAPK proteins were categorized into four subgroups on the basis of the classification method and clustering characteristics of A. thaliana: A (4 members), B (5 members), C (2 members), and D (10 members). Subgroup D presented the highest membership, whereas subgroup C presented the lowest membership. Subgroups A and B clustered together on the same branch. Multiple sequence alignment analysis revealed that all GuMAPKs contained a conserved tripeptide motif, TXY, with subgroups A, B, and C featuring TEY and subgroup D featuring TDY. Furthermore, members of subgroups A and B also shared a conserved CD domain (Figure 1B).
In the prediction of motifs for licorice GuMAPK proteins, 10 motif sequences were identified. Among them, motif 6 represents the highly conserved TRWYRAPEL domain found in MAPKs, which is present in all GuMAPKs. Motif 9 corresponds to the conserved CD domain present in all members of the A and B subgroups except for GuMAPK3-2. All members of the GuMAPK family contain motifs 1, 6, 2, 8, and 5, which are consistently located, suggesting their pivotal role in the evolutionary history of the GuMAPK gene family. Some motifs are specific to certain subgroups and highly conserved among members within the same subgroup. Additionally, motifs 7 and 10 are exclusively present in the D subgroup, with the exception of GuMAPK3-2, which contains motif 7 (Figures 2A, B).
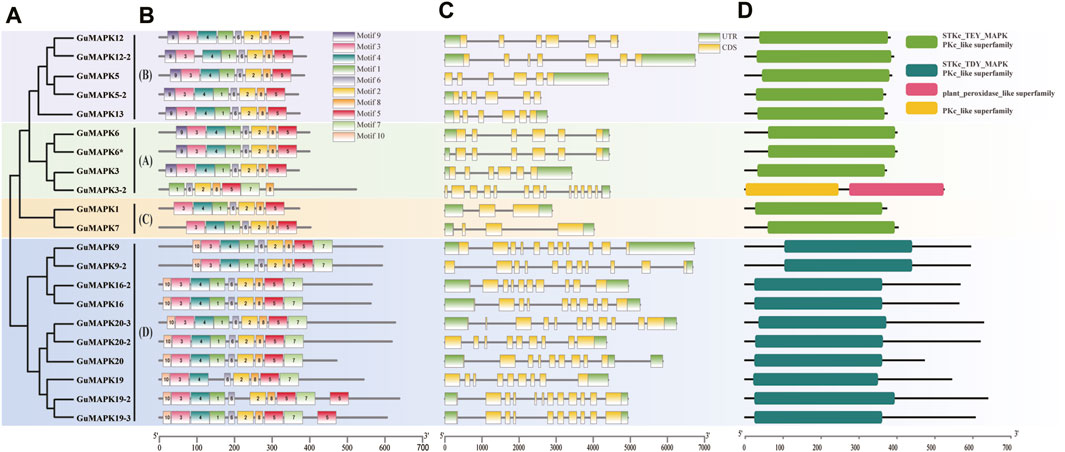
Figure 2. Analysis of GuMAPK genes conserved motifs and gene structure. (A) GuMAPK protein phylogenetic tree, different colors were used to distinguish groups. (B) The distribution of onserved motifs in GuMAPK proteins. Each motif is represented by a colored box. (C) Gene structure analysis of GuMAPKs. (D) Conservative domain analysis of GuMAPKs.
Gene structure analysis revealed that members of the GuMAPK gene family contain 2 to 14 exons and 2 to 13 introns (Figure 2C). Except for GuMAPK12-2 (B) and 3-2 (A), members of the A and B subgroups typically have six exons and five introns. In contrast, members of the C subgroup exhibit simpler gene structures; GuMAPK1 has two exons and two introns, whereas GuMAPK7 has three exons and three introns, showing significant differences compared with the other subgroups. This implies that members belonging to the same subgroup exhibit comparable genetic architectures. GuMAPK3-2 has the greatest number of exons and introns, with 14 exons and 13 introns. Members of the D subgroup have more complex gene structures, ranging from 9 to 12 exons and 8 to 11 introns. Moreover, most genes within the same subgroup, such as GuMAPK5 and 13 in the B subgroup, and GuMAPK20 and 19 in the D subgroup, exhibit similar exon‒intron structures, indicating a conserved exon‒intron distribution pattern among these GuMAPKs. Overall, the gene structure characteristics of GuMAPK family members demonstrate both intergroup diversity and intragroup conservation.
The analysis of conserved domains revealed that all GuMAPK proteins possess the PKc_like superfamily domain. Specifically, members of the A, B, and C subgroups typically contain the STKc_TEY_MAPK domain, whereas members of the D subgroup usually harbor the STKc_TDY_MAPK domain. Additionally, GuMAPK3-2 also features a plant_peroxidase_like superfamily domain, distinguishing it from other members (Figure 2D).
Analysis of the chromosomal location of the GuMAPK gene family members revealed that the 21 GuMAPKs are unevenly distributed across 17 different chromosome scaffolds. Among them, GuMAPK6 and GuMAPK6* are located on the same chromosome scaffold (Supplementary Figure S1). Further analysis of collinearity helps elucidate the potential evolutionary mechanisms of the G. uralensis gene family (Figure 3). Therefore, an analysis of gene duplication events involving GuMAPK genes on chromosome scaffolds was conducted. The results indicate that out of 97 pairs of homologous genes distributed across these 17 chromosome scaffolds, six scaffolds—Scaffold00074, Scaffold01036, Scaffold00100, Scaffold00268, Scaffold00029, and Scaffold00028—contained homologous gene pairs. Among all homologous gene pairs, three pairs belong to GuMAPK, and all of them represent fragment duplications. Thus, fragment duplication events appear to be the main driving force behind GuMAPK evolution.
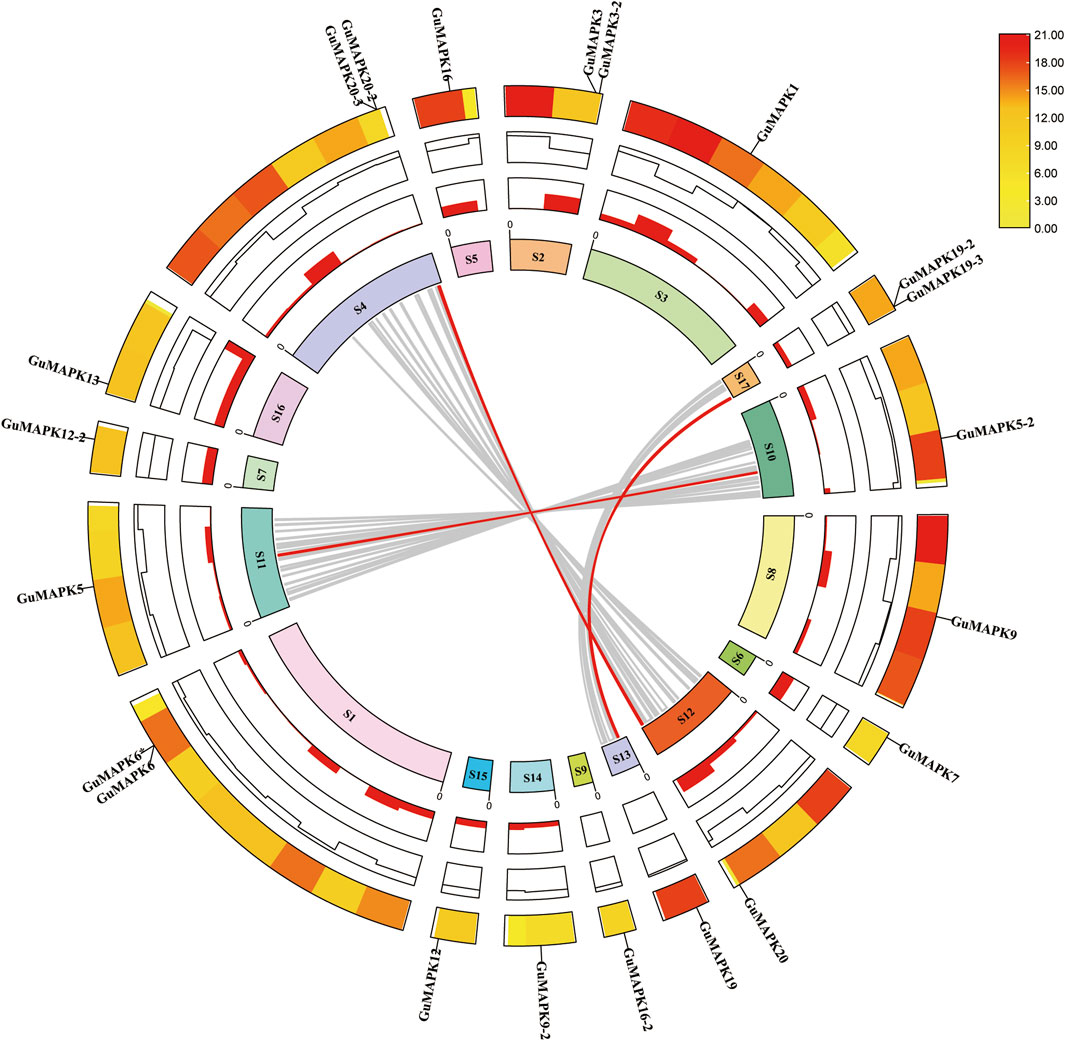
Figure 3. Collinearity analysis of the GuMAPK gene family. The gray lines in the background represent homologous pairs of all Glycyrrhiza uralensis genes in these 17 chromosome scaffolds, and the red line represents the homolinear pair of GuMAPKs. The information represented by each circle in the figure is chromosome scaffolds name, GC radio, gene density heat map and GuMAPKs chromosome location annotation from inside to outside. Yellow to red on the heat map indicates low to high gene density.
Additionally, at the genomic level, collinearity analysis was performed between G. uralensis and A. thaliana, tomato, and cucumber (Figure 4). The results revealed collinearity between G. uralensis and A. thaliana for 319 pairs, G. uralensis and tomato for 312 pairs, and G. uralensis and cucumber for 356 pairs, with 11, 11, and 14 pairs, respectively, belonging to the GuMAPK gene family. Notably, the GuMAPK1, 5, 5-2, and 9 genes exhibited collinearity with genes in A. thaliana, tomato, and cucumber, suggesting their significant role that requires them to be conserved in the evolutionary process.
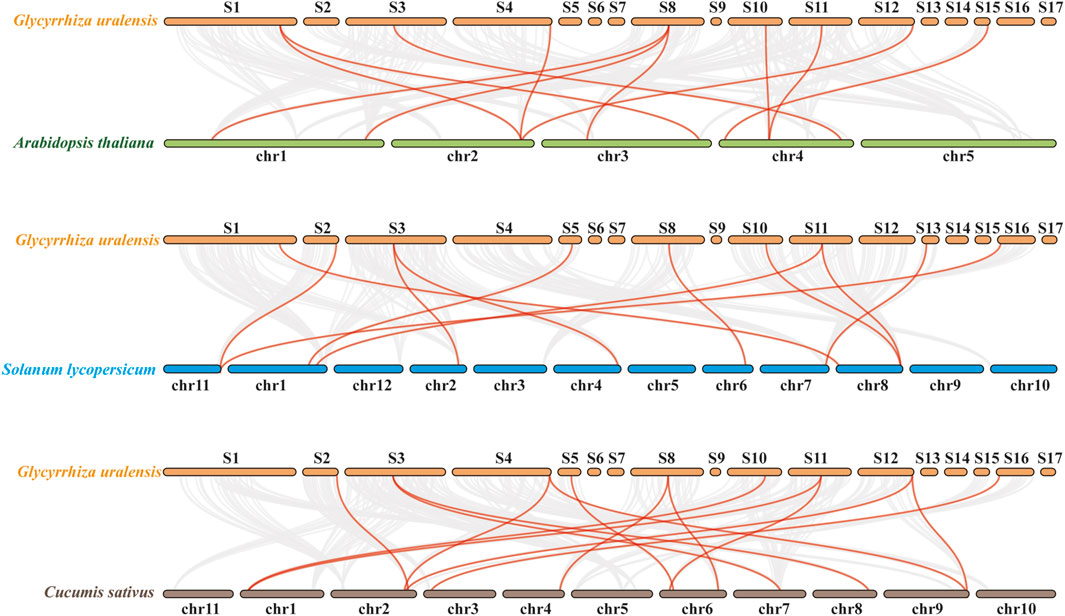
Figure 4. Collinearity analysis of Glycyrrhiza uralensis with Arabidopsis thaliana, Solanum lycopersicum and Cucumis sativus. The gray line in the back-ground represents all collinear pairs of Glycyrrhiza uralensis with Arabidopsis thaliana, Solanum lycopersicum and Cucumis sativus at the genomic level. The red line represents the collinear pairs belonging to MAPK family members from those four species.
Through analysis of the 2,000 bp upstream sequences of GuMAPK promoters, a total of 51 cis-acting elements were identified (Figure 5A). In addition to the core promoter elements TATA box and enhancer element CAAT box, the remaining 49 elements were classified into three categories: plant growth and development (11), plant hormone response (10), and biotic and abiotic stress (28). In addition to GuMAPK9, which contains only biotic and abiotic stress elements, and GuMAPK19 and 20, which lack plant hormone response elements, members of each category are distributed among all GuMAPKs. Among them, the elements related to biotic and abiotic stress are the most abundant (1,412), while those related to plant growth and development are the least common (99). Heatmap analysis of the cis-acting elements in the three categories revealed that among the 2013 elements (Figure 5B), the most frequently occurring elements were G-boxes (99 occurrences) and ABREs (54 occurrences). The B-group members GuMAPK12 and 12-2 and the D-group members GuMAPK19 and 20 showed consistency in the classification and quantity of cis-acting elements, suggesting that they might have similar functions. Although the coding sequences (CDSs) of GuMAPK6 and 6* are identical, differences in cis-regulatory elements may result in distinct expression patterns, suggesting different functional scenarios for these two genes.
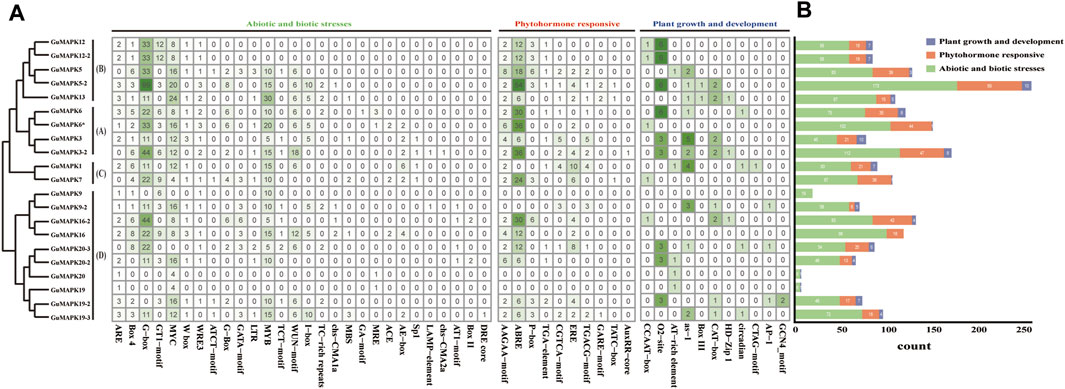
Figure 5. Distribution of the cis-acting elements in the promoters of GuMAPKs. (A) Quantitative heatmap of cis-acting elements in GuMAPKs. (B) Statistics on the number of cis-acting elements classified in GuMAPKs.
Protein kinases are typically activated through phosphorylation, highlighting the importance of investigating phosphorylation sites to understand their functional mechanisms. In this study, phosphorylation prediction was conducted on the GuMAPK gene family. The results revealed a total of 1,370 phosphorylation sites among GuMAPKs, which were widely distributed across all GuMAPK sequences (Figure 6A). Among these, the most abundant were nonspecific phosphorylation sites (Phos-unsp), totaling 509; followed by specific sites for phosphorylation by protein kinase C (Phos-PKC), with 203 sites; and sites for casein kinase II (phso-CKII), totaling 125. Quantitative heatmap analysis of all of the phosphorylation sites revealed that GuMAPK9 had the greatest number of total phosphorylation sites (100) and specific phosphorylation sites (61), which may be related to its amino acid sequence length (Figure 6B). However, the quantity of phosphorylation sites does not always correspond with the length of the amino acid sequence. Despite GuMAPK13 having a shorter amino acid sequence than GuMAPK3, GuMAPK13 presented a richer distribution of phosphorylation sites. GuMAPK6 and 6* share identical distributions of phosphorylation sites, likely due to their identical sequences. Additionally, only one site for phosphorylation by calcium/calmodulin-dependent protein kinase II (phso-CaMKII) was predicted in GuMAPK19, possibly indicating a distinct functionality.
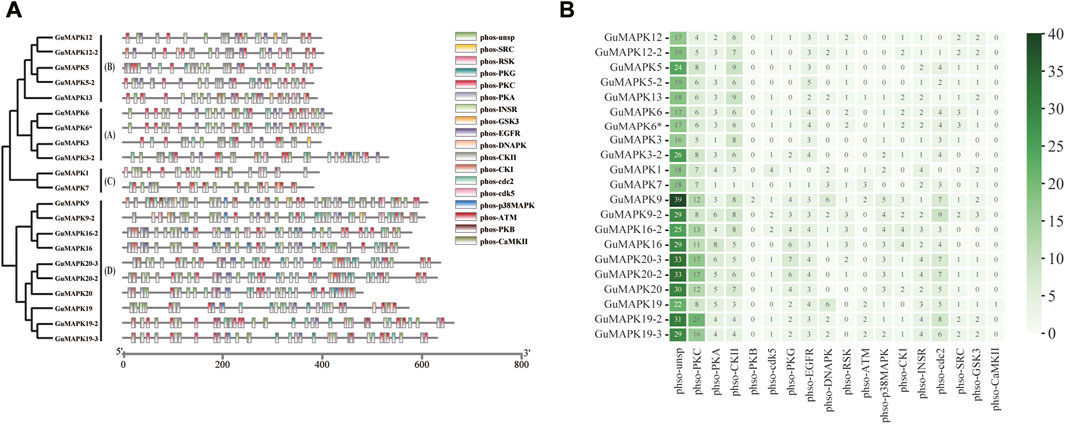
Figure 6. Prediction of phosphorylation sites of GuMAPKs. (A) Distribution of phosphorylation sites of protein kinases in GuMAPKs. (B) Quantitative heatmap of protein kinases at phosphorylation sites. Green from light to deep indicates the number of phosphorylation sites from less to more.
The diverse functionalities of proteins are closely correlated with their complex structures. To further explore this relationship, the secondary and tertiary structures of the 21 GuMAPK proteins were predicted. The secondary structure prediction revealed that the peptide chains of all GuMAPK family members predominantly consisted of α-helices, β-turns, extended strands, and irregular coils. Among these, β-turns were the least abundant, constituting less than 9% of the total structure in all 21 GuMAPKs. In the A, B, and C groups, α-helices and irregular coils accounted for more than 40% and 30% of the structure, respectively, with α-helices being the primary conformation, accounting for more than irregular coils. Conversely, in the D group, irregular coils were the predominant conformation, comprising more than 40% of the structure (Supplementary Table S2). Using homology modeling, the three-dimensional structures of the 21 GuMAPK proteins were predicted (Figure 7). Except for the consistent structures of GuMAPK6 and 6*, the three-dimensional structures of the other 20 genes were accurately evaluated using online software. The results revealed that all family members, except GuMAPK3-2, contained β-folds in addition to α-helices and irregular coils. Notably, the D group members presented a greater proportion of irregular coils, which was consistent with the secondary structure predictions.
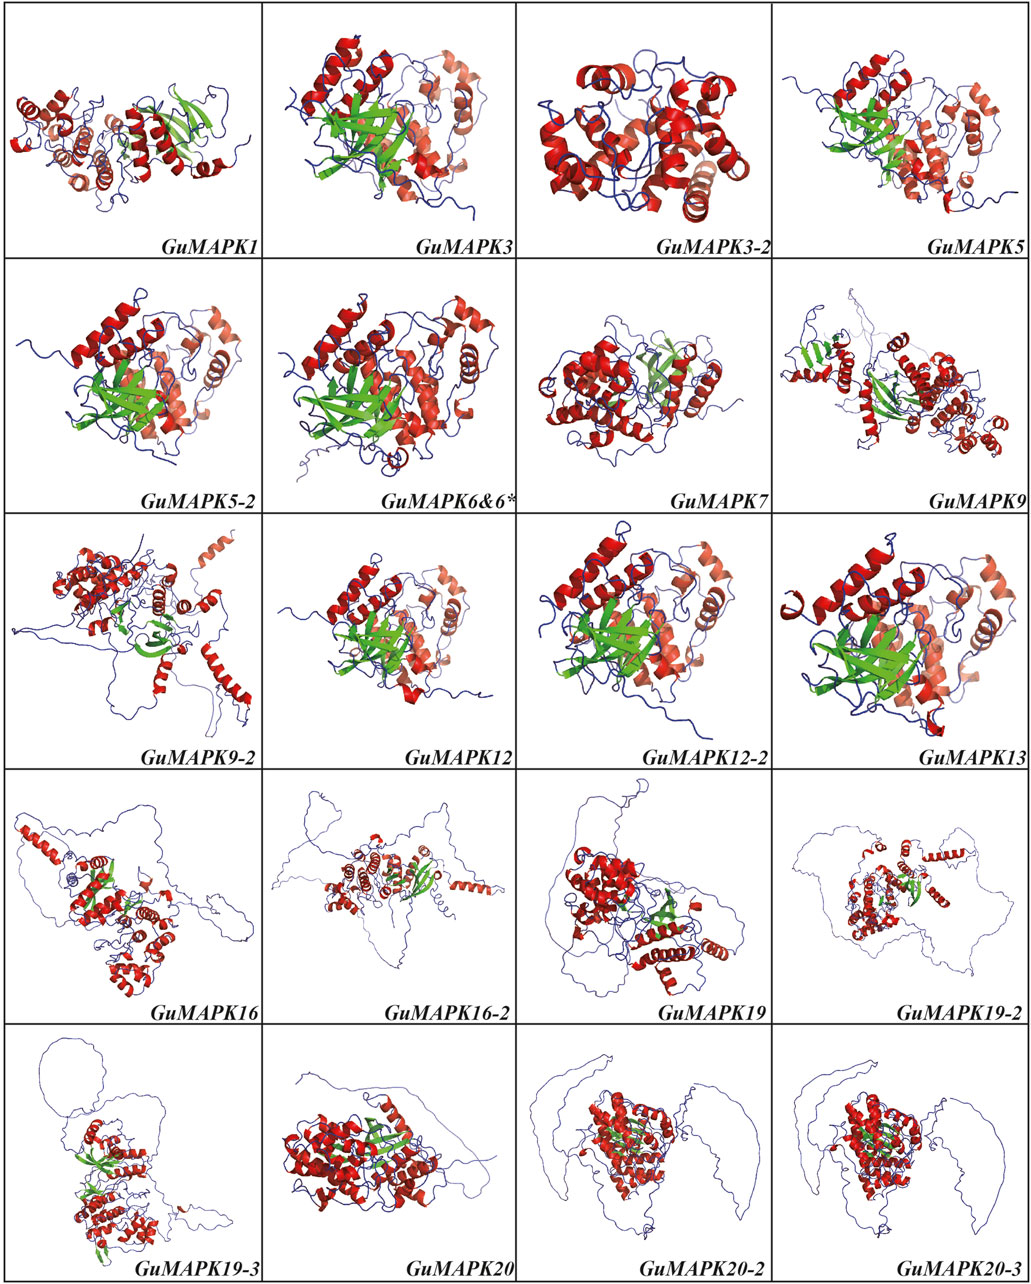
Figure 7. 3D structure prediction for GuMAPKs. The alpha helix is shown in red, the beta fold is shown in green, and the irregular curl is shown in blue.
Transcriptomic data were extracted and subjected to cluster analysis to comprehensively investigate the expression profiles of the 21 members of the MAPK gene family in G. uralensis under salt stress induced by inoculation with B. subtilis. The results revealed that under low (100 mmol/L) and high (300 mmol/L) concentrations of NaCl + CaCl2 solution, 18 genes were induced under salt stress (including GuMAPK6 and 6*, 19-2 and 19-3, 20-2 and 20-3, which represent the same genes). Particularly noteworthy is the significant downregulation of GuMAPK16-2 under 300 mmol/L salt stress (Nc0 vs. NcH, P = 0.038), whereas its expression was significantly upregulated compared with that under B. subtilis inoculation (NcH vs. BsH, P = 0.030) (Figure 8). Furthermore, under low salt concentrations, the expression levels of the genes GuMAPK3, GuMAPK6, and GuMAPK6* increased by 3.05-fold, 1.33-fold, and 1.33-fold, respectively, following inoculation with B. subtilis. These genes not only cluster together in their expression patterns but also belong to subgroup A, implying that subgroup A genes may effectively alleviate salt stress when inoculated with B. subtilis under mild salt stress conditions. To verify the reliability of the transcriptome data, GuMAPK1, 5, 6, and 16-2 were selected for qRT‒PCR validation (Supplementary Table S3), and the results were consistent with the trends observed in the transcriptome analysis (Figure 9).
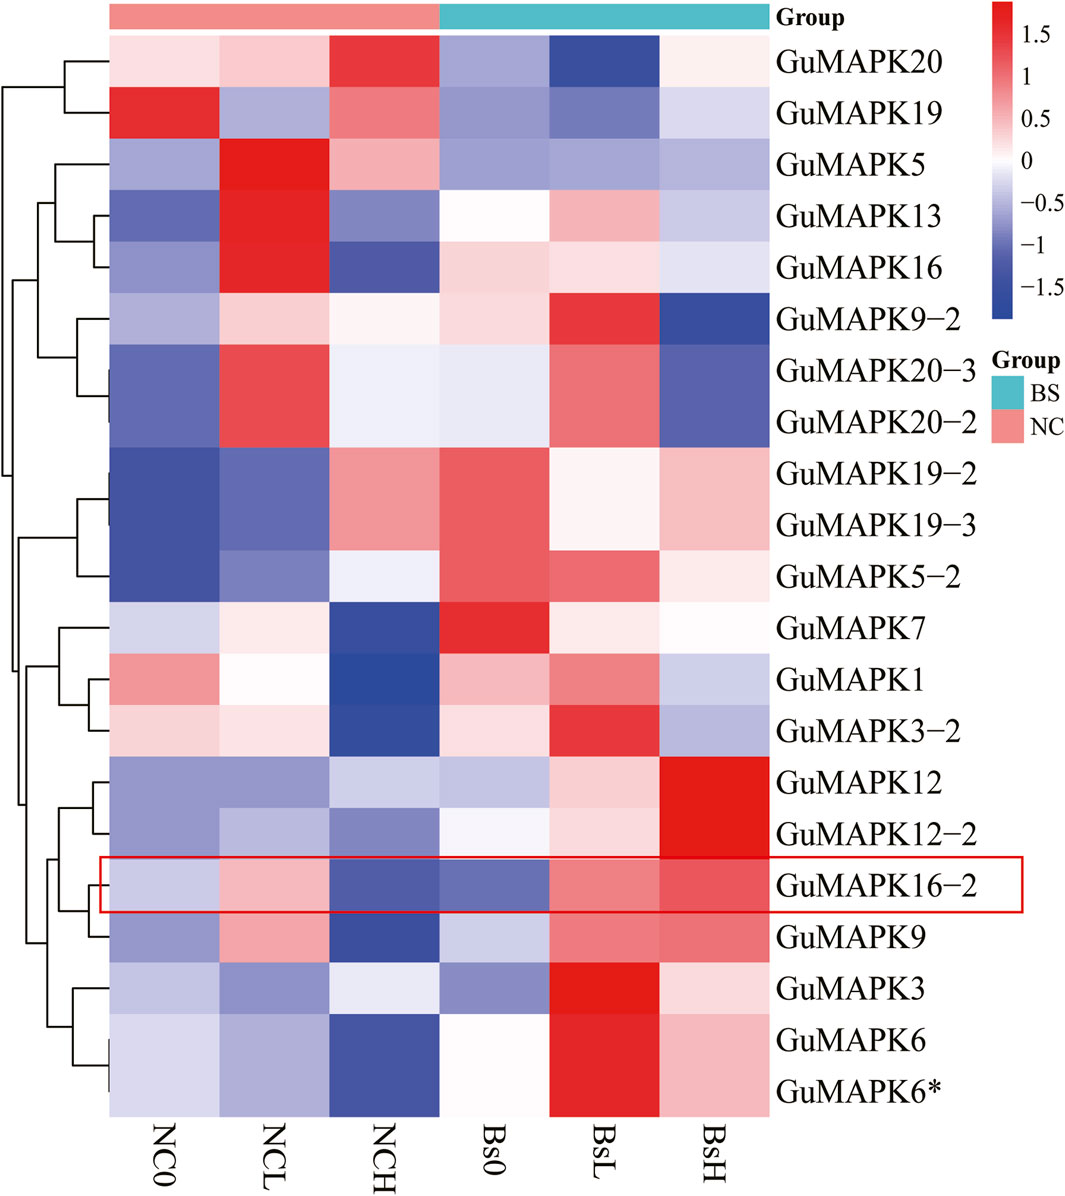
Figure 8. Transcriptional abundance of GuMAPK genes in response to salt stress by inoculating Bacillus subtilis. Colored bars indicate relative abundance in Z-Score, red indicates high level expression, and dark blue indicates low expression. NC group means that salt solution with different concentration is used to simulate salt stress environment, and Bs group means that Bacillus subtilis is inoculated on the basis of salt stress in NC group.
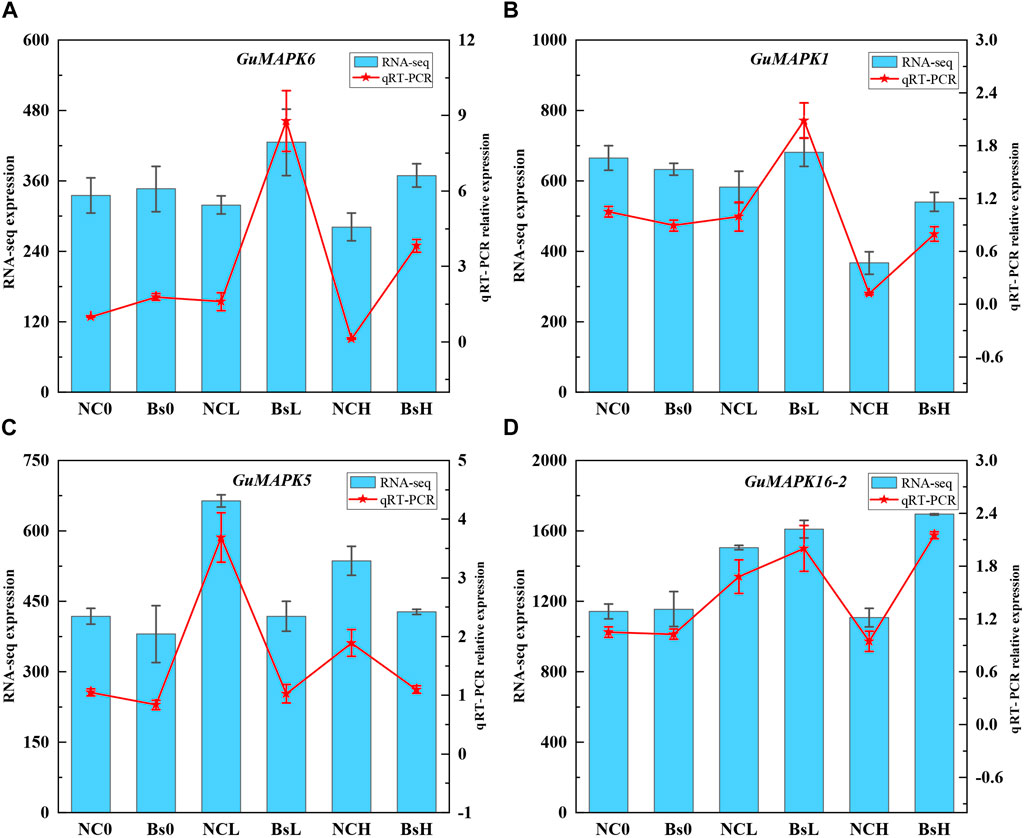
Figure 9. Plot of qRT-PCR analysis of some differentially expressed genes. (A) GuMAPK6. (B) GuMAPK1. (C) GuMAPK5. (D) GuMAPK16-2. The blue bars represents the count value of the genes at the transcriptome level,which corresponds to the left Y-axis, and the red fold represents the relative expression of the genes, which corresponds to the right Y-axis. Each group has three independent biological replicates.
To examine GuMAPK protein function, an interaction network diagram was devised utilizing preliminary research findings and homologous protein families found in A. thaliana (Supplementary Figure S2). By leveraging the well-studied functions of AtMAPK, some potential functions of GuMAPK genes were preliminarily inferred. The results revealed that AtMPK6, which is homologous to GuMAPK6 and 6*, interacts with MKK1 to mediate ABA (abscisic acid)-dependent CAT1 expression in response to drought and salt stress. Additionally, AtMPK3 (homologous to GuMAPK3 and 3-2) and AtMPK6 (homologous to GuMAPK6 and 6*) interact with PR1. AtMPK12 (homologous to GuMAPK12 and 12-2) interacts with respiratory burst oxidase homolog D (RBOHD). AtWRKY33 is involved in plant defense responses against fungal pathogens, and F23F1.6 acts as a protein phosphatase, exerting a negative influence on defense responses. Stress and defense signaling involve the participation of deactivated MPK4 and MPK6 MAP kinases. Proteins such as GuMAPK3/3-2/6/6*/16/16-2/5/5-2 in G. uralensis, which are homologous to A. thaliana MAPKs, are speculated to have similar functions.
Subcellular localization of the GuMAPK gene family has not been reported to date. On the basis of the gene expression profiles under salt stress and B. subtilis treatment, we selected a gene significantly expressed under high-concentration stress (GuMAPK16-2) to validate the subcellular localization of the MAPK genes in G. uralensis. The pC1300-GFP-GuMAPK16-2 fusion expression vector was constructed and transformed into Agrobacterium tumefaciens competent cells, followed by transient transfection into Nicotiana benthamiana leaves. Observation was conducted using confocal fluorescence microscopy, where the target gene linked with the GFP exhibited green fluorescence, whereas chlorophyll emitted red fluorescence under excitation light at approximately 640 nm. The green fluorescence signal of the GuMAPK16-2-GFP fusion protein was predominantly distributed in the cell nucleus, indicating that the GuMAPK16-2 gene is likely located in the nucleus. This finding further validates our earlier prediction regarding the subcellular localization of this gene (Figure 10).
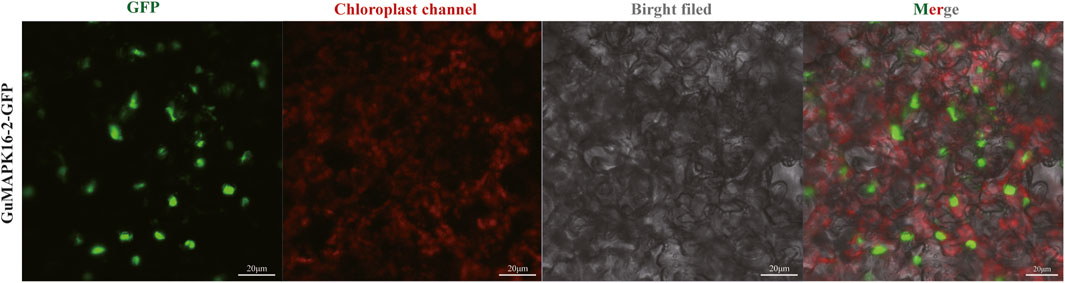
Figure 10. Subcellular localization of GuMAPK16-2. The green fluorescence is GFP labeled GuMAPK16-2.
The MAPK cascade is a widely conserved functional module widely present in eukaryotes and has been extensively studied in model organisms such as A. thaliana, Oryza sativa L., and other plants (Zhang et al., 2018). During plant growth and development, the MAPK cascade transmits extracellular stimuli to the nucleus, predominantly regulating cellular processes, including proliferation, differentiation, and apoptosis, by modulating gene expression (Kosová et al., 2011). As members of the protein kinase superfamily, MAPKs catalyze the phosphorylation of target proteins, thereby modifying their activity, binding affinity, stability, or cellular localization. Numerous investigations have demonstrated the pivotal involvement of MAPK transcription factors in addressing both biotic and abiotic stresses (Liu et al., 2013; Baillo et al., 2019).
The characteristics and functions of the MAPK gene family have been identified and studied in various plants, such as A. thaliana, O. sativa L., Zea mays L. (Wu et al., 2014), and S. lycopersicum (Yao et al., 2022). Through multiple sequence alignments of GuMAPK proteins and phylogenetic analysis with Arabidopsis, the 21 GuMAPKs were classified into four subgroups: A, B, C, and D. Subgroups A, B, and C contain the TEY activation loop, whereas subgroup D contains the TDY activation loop (López-Bucio et al., 2014). The prevalence of the TEY motif in MAPK gene family members is consistent with that in A. thaliana, suggesting a potentially critical role for TEY-type MAPK genes in the evolution of dicotyledonous plants. Across all studied species, MAPK3 and MAPK6 within subgroup A show homology, either both present or both absent, underscoring their essential functions in plant growth, development, and responses to biotic and abiotic stresses, as validated across diverse plant species (Sinha et al., 2011; Raina et al., 2012; Mohanta et al., 2015). Additionally, MAPK10 in subgroup A was identified only in cruciferous plants, with the exception of A. thaliana, suggesting its conservation within this family but loss in other plant families during evolution (Wang et al., 2022). Similarly, MAPK11 in subgroup B shows a similar pattern except it is also lost in A. thaliana. In G. uralensis, subgroup C contains only homologs of MAPK1 and MAPK7, which is consistent with the findings in lettuce (Cannon et al., 2004) and tomato, indicating closer evolutionary relationships among them. Subgroup D members are the most unique among the MAPK gene family members and were identified in all studied plants (Meng and Zhang, 2013). Collinearity analysis offers insights into the potential evolutionary mechanisms of the G. uralensis gene family, highlighting the critical role of gene duplication—including tandem and segmental duplication—in genome expansion, rearrangement, functional diversification, and the formation of extensive gene families. Within GuMAPKs, the identification of three pairs of homologous genes involved in segmental duplication suggests that this process serves as a primary mechanism driving evolutionary changes (Wang et al., 2021). Moreover, the presence of 11, 11, and 14 pairs of homologous genes shared between licorice and A. thaliana, tomato, and cucumber, respectively, also indicates closer evolutionary relationships between them.
Gene structure plays a crucial role in determining gene expression and function, with distinct characteristic motifs observed among different plants indicating their evolutionary relationships and functional divergence. (Mohanta et al., 2015). In the analysis of conserved motifs, GuMAPKs from different subgroups exhibited both intragroup similarity and intergroup differences in motif sequences. Except for GuMAPK3-2, all GuMAPKs present highly conserved motif sequences, among which motif 6 represents the T-loop, a unique activation loop in the MAPK family. Activation of downstream MAPKs occurs through phosphorylation of the TDY or TEY motifs within their activation loop. This phosphorylation event leads to the subsequent phosphorylation of various downstream substrates, thereby regulating gene expression. The distribution of introns and exons in GuMAPK gene structures mirrors this characteristic pattern, demonstrating consistency within different groups while also revealing notable differences both within and between these groups (Wei et al., 2021; Alabd et al., 2023). For example, except for GuMAPK3-2, members of subgroup D exhibit the most complex gene structures, markedly more than those in other groups. Comparable structural motifs have been detected in various plant species, exhibiting substantial conservation within specific groups and increased divergence between these groups. For example, in lettuce MAPK gene families, there is a significant disparity in the number of introns and exons between subgroup D and subgroups A, B, and C, which are typically characterized by subgroup D harboring a greater abundance of both introns and exons (Wei et al., 2021).
The promoter regions of GuMAPKs contain numerous cis-acting elements, such as MYB elements, ABRE (ABA-responsive element), MYC elements, the CGTCA motif, and the TGACG motif (MeJA-responsive element), indicating the widespread involvement of GuMAPKs in the light response and biotic and abiotic stress processes of G. uralensis. In addition to the G-box, the most frequently occurring element is the ABA-responsive element. The ABRE element (PyACGTGGC) is an important cis-acting element involved in ABA-regulated gene expression, and it has been shown to respond to stresses such as low temperature, drought, and high salinity in both rice and A. thaliana (Han et al., 2013). Notably, GuMAPK6 and 6* have completely different promoter sequences, as well as differences in cis-acting elements, which could lead to functional differences between the two genes. But under certain conditions, the functions of the two genes are also highly likely to overlap. To counteract the adverse effects of environmental stresses, plants have evolved adaptive mechanisms or specific growth habits to avoid stress, and phosphorylation can participate in fine-tuning to cope with abiotic stress. Therefore, analysis of phosphorylation sites is crucial for understanding the mechanism of action of GuMAPK protein kinases. In addition to specific phosphorylation sites, phosphorylation by protein kinase C (Phos-PKC) and casein kinase II (phso-CKII) occurs most frequently. Professor Lieven De Veylder (Huang et al., 2021) reported that the plant casein kinase CKII regulates root growth under aluminum toxicity and phosphorus deficiency conditions mediated by SOG1 in the DNA damage response, revealing the significant role of protein phosphorylation in plant growth and development as well as in response to abiotic stress signals. The three-dimensional structure of proteins determines how they interact with other molecules and dictates their roles within cells. The diverse three-dimensional structures of proteins enable them to perform a wide range of functions in cells, and the protein’s three-dimensional structure can be inferred from its amino acid sequence. Three-dimensional structure prediction of GuMAPKs revealed that α-helices and irregular coils are the main spatial structures of GuMAPKs and that stable spatial conformations are the basis for protein function. Furthermore, the GuMAPK gene family consists of similar structural domains, with highly similar predicted three-dimensional structures within the same subgroup. These predictions align with the characteristic features of the gene family proteins and exhibit comparable conserved domains.
Numerous studies have underscored the extensive engagement of the plant MAPK cascade signaling pathway in diverse responses to both abiotic and biotic stresses (Liu et al., 2013). Among the notable MAPKs in A. thaliana are AtMPK3 and AtMPK6. Protein‒protein interaction network analysis revealed that AtMPK3 (homologous to GuMAPK3 and 3-2) and AtMPK6 (homologous to GuMAPK6 and 6*) interact with PR1. PR1 is a plant pathogenesis-related protein that belongs to a widely distributed protein superfamily. It was initially identified as a protein strongly induced under both biotic and abiotic stress conditions. The overexpression of PR1 in immune defense mechanisms enhances resistance against pathogens (Pitzschke et al., 2009). AtMPK12 (homologous to GuMAPK12 and 12-2) interacts with RBOHD. RBOHD is a calcium-dependent NADPH oxidase that generates superoxide, which participates in ROS production during pathogen incompatibility interactions and in ROS-dependent signaling during UV-B and abscisic acid treatment (Yamada et al., 2016). In addition, genes such as VSP2, MKS1, ANP1, MKK1, and MKK4 interact with MAPKs, all of which are key genes identified in previous studies in which B. subtilis was inoculated to counteract salt stress in G. uralensis, indicating that homologous GuMAPKs also have similar functions. Notably, GuMAPK16 and 16-2, which are homologous to AtMPK16, interact with MKK1 (MAPK kinase 1) and MKK4 (MAPK kinase 4). Andrea Pitzschke et al. reported that the MAPK kinase MKK1 is part of the cascade responsible for regulating the accumulation of ROS and salicylic acid (SA) (Egamberdieva et al., 2017). According to several reports, most of the transcription factors highly responsive to various ROS-induced conditions are regulated by MEKK1, mainly through the MEKK1-MKK1/2-MPK4 pathway. Yamada K et al. reported that the MAPKKK5-MKK4/5-MPK3/6 pathway plays an important role in chitin signal transduction in A. thaliana (Savojardo et al., 2018).
On the basis of the transcriptome data of 21 GuMAPKs expressed in response to salt stress in G. uralensis after inoculation with B. subtilis obtained from previous studies by our research group, at a salt concentration of 200 mmol/L, the expression of GuMAPK5 (P = 0.048), GuMAPK7 (P = 0.047), GuMAPK9 (P = 0.0004), GuMAPK16 (P = 0.048), and GuMAPK20-2/20-3 (P = 0.029) was significantly upregulated, indicating their response to salt stress in G. uralensis, possibly playing a more crucial role in this process. However, after inoculation with B. subtilis, the expression of GuMAPK5 (P = 0.021), GuMAPK7 (P = 0.033), and GuMAPK16 (P = 0.007) was significantly upregulated, suggesting that B. subtilis enhanced the tolerance of these genes to saline‒alkali conditions, thereby alleviating the impact of salt stress on the quality of G. uralensis. Notably, at a high salt concentration of 300 mmol/L, GuMAPK16-2 (P = 0.038) was the only gene whose expression significantly differed, and after inoculation with B. subtilis, the expression of GuMAPK16-2 (P = 0.030) was also significantly downregulated. These findings provide insights into the molecular mechanism by which B. subtilis inoculation affects the response of the MAPK signaling pathway to high salt stress in G. uralensis.
This study conducted a systematic analysis of the MAPK gene family in G. uralensis, identifying 21 GuMAPK genes in the genome. Various aspects of these genes, including their physicochemical properties, gene structures, conserved motifs, chromosomal locations, cis-acting elements, and phosphorylation sites, were thoroughly examined using bioinformatics methods. This study also investigated the response of GuMAPK genes to salt stress and B. subtilis inoculation, highlighting GuMAPK16-2 as a key gene within the G. uralensis MAPK gene family that responds to high-salt stress under B. subtilis inoculation. Subcellular localization validation was conducted, followed by the establishment of a protein‒protein interaction network that identified multiple MAPK genes involved in regulating gene expression processes under salt stress conditions. These findings provide a theoretical basis for understanding the mechanisms underlying salt stress resistance in G. uralensis and present an opportunity for further exploration of the evolutionary trajectory and functional roles of the GuMAPK gene family in response to various stressors, both biotic and abiotic.
The datasets presented in this study can be found in online repositories. The names of the repository/repositories and accession number(s) can be found in the article/Supplementary Material.
PG: Data curation, Formal Analysis, Visualization, Writing–original draft. JX: Data curation, Validation, Writing–original draft. WG: Data curation, Formal Analysis, Writing–original draft. RF: Data curation, Formal Analysis, Writing–original draft. YZ: Funding acquisition, Methodology, Writing–review and editing. TN: Funding acquisition, Methodology, Writing–review and editing.
The authors declare that financial support was received for the research, authorship, and/or publication of this article. This work was supported by the National Natural Science Foundation of China (81891014); Scientific and Technological Innovation Project of China Academy of Chinese Medical Sciences (CI2021A04005); China National Machinery Industry Corporation Research Specialties (ZDZX2022-2)
We acknowledge the support of the National Natural Science Foundation of China (81891014) and other funds. Thanks to our group members for their excellent suggestions in research and article writing. In addition, special thanks to the reviewers for their valuable time and suggestions on this manuscript.
The authors declare that the research was conducted in the absence of any commercial or financial relationships that could be construed as a potential conflict of interest.
All claims expressed in this article are solely those of the authors and do not necessarily represent those of their affiliated organizations, or those of the publisher, the editors and the reviewers. Any product that may be evaluated in this article, or claim that may be made by its manufacturer, is not guaranteed or endorsed by the publisher.
The Supplementary Material for this article can be found online at: https://www.frontiersin.org/articles/10.3389/fgene.2024.1442277/full#supplementary-material
G. uralensis, Glycyrrhiza uralensis Fisch; B. subtilis; Bs, Bacillus subtilis; ROS, Reactive oxygen species; pI, Isoelectric point; GRAVY, Grand average of hydropathicity; SA, Salicylic acid; ABRE element, ABA-Responsive Element; CDS, Coding sequence; ABA, Abscisic acid; MAPKK, MAPK kinase; MAPKKK, MAPKK kinase; CD domain, Common Docking Domain; RBOHD, Respiratory Burst Oxidase Homolog D.
Alabd, A., Cheng, H., Ahmad, M., Wu, X., Peng, L., Wang, L., et al. (2023). ABRE-BINDING FACTOR3-WRKY DNA-BINDING PROTEIN44 module promotes salinity-induced malate accumulation in pear. Plant Physiol. 192 (3), 1982–1996. doi:10.1093/plphys/kiad168
Baillo, E. H., Kimotho, R. N., Zhang, Z., and Xu, P. (2019). Transcription factors associated with abiotic and biotic stress tolerance and their potential for crops improvement. Genes (Basel) 10 (10), 771. doi:10.3390/genes10100771
Canagarajah, B. J., Khokhlatchev, A., Cobb, M. H., and Goldsmith, E. J. (1997). Activation mechanism of the MAP kinase ERK2 by dual phosphorylation. Cell 90 (5), 859–869. doi:10.1016/s0092-8674(00)80351-7
Cannon, S. B., Mitra, A., Baumgarten, A., Young, N. D., and May, G. (2004). The roles of segmental and tandem gene duplication in the evolution of large gene families in Arabidopsis thaliana. BMC Plant Biol. 4, 10. doi:10.1186/1471-2229-4-10
Chardin, C., Schenk, S. T., Hirt, H., Colcombet, J., and Krapp, A. (2017). Review: mitogen-activated protein kinases in nutritional signaling in Arabidopsis. Plant Sci. 260, 101–108. doi:10.1016/j.plantsci.2017.04.006
Chen, C. J., Chen, H., Zhang, Y., Thomas, H. R., Frank, M. H., He, Y., et al. (2020). TBtools: an integrative toolkit developed for interactive analyses of big biological data. Mol. Plant. 13, 1194–1202. doi:10.1016/j.molp.2020.06.009
Danquah, A., de Zelicourt, A., Colcombet, J., and Hirt, H. (2014). The role of ABA and MAPK signaling pathways in plant abiotic stress responses. Biotechnol. Adv. 32 (1), 40–52. doi:10.1016/j.biotechadv.2013.09.006
Egamberdieva, D., Ma, H., Alaylar, B., Zoghi, Z., Kistaubayeva, A., Wirth, S., et al. (2021). Biochar amendments improve licorice (Glycyrrhiza uralensis Fisch.) Growth and nutrient uptake under salt stress. Plants 10 (10), 2135. doi:10.3390/plants10102135
Egamberdieva, D., Wirth, S., Li, L., Abd-Allah, E. F., and Lindstrom, K. (2017). Microbial cooperation in the rhizosphere improves liquorice growth under salt stress. Bioengineered 8, 433–438. doi:10.1080/21655979.2016.12509831655979.2016.1250
Ergen, N. Z., Thimmapuram, J., Bohnert, H. J., and Budak, H. (2009). Transcriptome pathways unique to dehydration tolerant relatives of modern wheat. Funct. Integr. Genomics 9 (3), 377–396. doi:10.1007/s10142-009-0123-1
Hamel, L. P., Nicole, M. C., Sritubtim, S., Morency, M. J., Ellis, M., Ehlting, J., et al. (2006). Ancient signals: comparative genomics of plant MAPK and MAPKK gene families. Trends Plant Sci. 11 (4), 192–198. doi:10.1016/j.tplants.2006.02.007
Han, Z., Xiong, D., Schneiter, R., and Tian, C. (2013). The function of plant PR1 and other members of the CAP protein superfamily in plant-pathogen interactions. Mol. Plant Pathol. 24 (6), 651–668. doi:10.1111/mpp.13320
Hu, B., Jin, J. P., Guo, A. Y., Zhang, H., Luo, J. C., and Gao, G. (2015). GSDS 2.0: an upgraded gene feature visualization server. Bioinformatics 31, 1296–1297. doi:10.1093/bioinformatics/btu817
Huang, S., Tang, Z., Zhao, R., Hong, Y., Zhu, S., Fan, R., et al. (2021). Genome-wide identification of cassava MeRboh genes and functional analysis in Arabidopsis. Plant Physiol. Biochem. 167, 296–308. doi:10.1016/j.plaphy.2021.07.039
Humphrey, W., Dalke, A., and Schulten, K. (1996). VMD - visual molecular dynamics. J. Molec. Graph. 14, 33–38. doi:10.1016/0263-7855(96)00018-5
Ichimura, K., Shinozaki, K., and Tena, G. (2002). Mitogen-activated protein kinase cascades in plants: a new nomenclature. Trends Plant Sci. 7 (7), 301–308. doi:10.1016/s1360-1385(02)02302-6
Jagodzik, P., Tajdel-Zielinska, M., Ciesla, A., Marczak, M., and Ludwikow, A. (2018). Mitogen-activated protein kinase cascades in plant hormone signaling. Front. Plant Sci. 9, 1387. doi:10.3389/fpls.2018.01387
Jalmi, S., and Sinha, A. K. (2015). ROS mediated MAPK signaling in abiotic and biotic stress-striking similarities and differences. Front. Plant Sci. 6, 769. doi:10.3389/fpls.2015.00769
Kosová, K., Vítámvás, P., Prášil, I. T., and Renaut, J. (2011). Plant proteome changes under abiotic stress-contribution of proteomics studies to understanding plant stress response. Proteomics 74 (8), 1301–1322. doi:10.1016/j.jprot.2011.02.006
Li, X., Xu, Y., Zhang, J., Xu, K., Zheng, X., Luo, J., et al. (2024). Integrative physiology and transcriptome reveal salt-tolerance differences between two licorice species: ion transport, Casparian strip formation and flavonoids biosynthesis. BMC Plant Biol. 24 (1), 272. doi:10.1186/s12870-024-04911-1
Liu, W., Chen, D., Yin, H., Song, M., and Guo, S. (2010). Bacillus subtilis for salt stress relief in vegetable cultivation. Inter Sym Veg. Saf. Hum. hea. 856, 237–242. doi:10.17660/ActaHortic.2010.856.33
Liu, Y., Zhang, D., Wang, L., and Li, D. (2013). Genome-wide analysis of mitogen-activated protein kinase gene family in maize. Plant Mol. Biol. Rep. 31, 1446–1460. doi:10.1007/s11105-013-0623-y
López-Bucio, J. S., Dubrovsky, J. G., Raya-González, J., Ugartechea-Chirino, Y., López-Bucio, J., de Luna-Valdez, L. A., et al. (2014). Arabidopsis thaliana mitogen-activated protein kinase 6 is involved in seed formation and modulation of primary and lateral root development. J. Exp. Bot. 65, 169–183. doi:10.1093/jxb/ert368
MAPK Group (2002). Mitogen-activated protein kinase cascades in plants: a new nomenclature. Trends Plant Sci. 7 (7), 301–308. doi:10.1016/s1360-1385(02)02302-6
Meng, X., and Zhang, S. (2013). MAPK cascades in plant disease resistance signaling. Phytopathol. 51, 245–266. doi:10.1146/annurev-phyto-082712-102314
Mohanta, T. K., Arora, P. K., Mohanta, N., Parida, P., and Bae, H. (2015). Identification of new members of the MAPK gene family in plants shows diverse conserved domains and novel activation loop variants. BMC Genom 16, 58–20. doi:10.1186/s12864-015-1244-7
Nakagami, H., Pitzschke, A., and Hirt, H. (2005). Emerging MAP kinase pathways in plant stress signalling. Trends Plant Sci. 10 (7), 339–346. doi:10.1016/j.tplants.2005.05.009
Pitzschke, A., Djamei, A., Bitton, F., and Hirt, H. (2009). A major role of the MEKK1-MKK1/2-MPK4 pathway in ROS signalling. Mol. Plant 2 (1), 120–137. doi:10.1093/mp/ssn079
Raina, S. K., Wankhede, D. P., Jaggi, M., Singh, P., Jalmi, S. K., Raghuram, B., et al. (2012). CrMPK3, a mitogen activated protein kinase from Catharanthus roseus and its possible role in stress induced biosynthesis of monoterpenoid indole alkaloids. BMC Plant Biol. 12, 134. doi:10.1186/1471-2229-12-134
Saberi, R., Ebrahimi-Zarandi, M., Tamanadar, E., Moradi Pour, M., and Thakur, V. K. (2021). Salinity stress: toward sustainable plant strategies and using plant growth-promoting rhizobacteria encapsulation for reducing it. Sustainability 13, 12758. doi:10.3390/su132212758
Sachdev, S., Ansari, S. A., Ansari, M. I., Fujita, M., and Hasanuzzaman, M. (2021). Abiotic stress and reactive oxygen species: generation, signaling, and defense mechanisms. Antioxidants 10 (2), 277. doi:10.3390/antiox10020277
Savojardo, C., Martelli, P. L., Fariselli, P., Profiti, G., and Casadio, R. (2018). BUSCA: an integrative web server to predict subcellular localization of proteins. Nucleic Acids Res. 46, W459–W466. doi:10.1093/nar/gky320
Shang, Y., Luo, X., Zhang, H., Chen, M., Yin, W., Cao, Z., et al. (2023). Genome-wide identification and analysis of the MAPK and MAPKK gene families in potato (Solanum tuberosum L.). Agronomy 13, 93. doi:10.3390/agronomy13010093
Shao, Y. M., Yu, X. X., Xu, X. W., Li, Y., Yuan, W., Xu, Y., et al. (2020). The YDA-MKK4/MKK5-MPK3/MPK6 cascade functions downstream of the RGF1-RGI ligand-receptor pair in regulating mitotic activity in root apical meristem. Mol. Plant 13 (11), 1608–1623. doi:10.1016/j.molp.2020.09.004
Shen, Z., Pu, X., Wang, S., Dong, X., Cheng, X., and Cheng, M. (2022). Silicon improves ion homeostasis and growth of liquorice under salt stress by reducing plant na+uptake. Sci. Rep. 12 (1), 5089. doi:10.1038/s41598-022-09061-8
Sinha, A. K., Jaggi, M., Raghuram, B., and Tuteja, N. (2011). Mitogen-activated protein kinase signaling in plants under abiotic stress. Plant Signal. Behav. 6, 196–203. doi:10.4161/psb.6.2.14701
Stafstrom, J. P., Altschuler, M., and Anderson, D. H. (1993). Molecular cloning and expression of a MAP kinase homologue from pea. Plant Mol. Biol. 22 (1), 83–90. doi:10.1007/BF00038997
Timothy, L., Bailey, J. J., Charles, E. G., and William, S. N. (2015). The MEME suite. Nucleic Acids Res. 43 (W1), W39–W49. doi:10.1093/nar/gkv416
Wang, G., Wang, T., Jia, Z. H., Xuan, J. P., Pan, D. L., Guo, Z. R., et al. (2018). Genome-wide bioinformatics analysis of MAPK gene family in kiwifruit (actinidia chinensis). Int. J. Mol. Sci. 19 (9), 2510. doi:10.3390/ijms19092510
Wang, T., Liu, M., Wu, Y., Tian, Y., Han, Y., Liu, C., et al. (2022). Genome-wide identification and expression analysis of MAPK gene family in lettuce (Lactuca sativa L.) and functional analysis of LsMAPK4 in high- temperature-induced bolting. Int. J. Mol. Sci. 23 (19), 11129. doi:10.3390/ijms231911129
Wang, Z., Wan, Y., Meng, X., Zhang, X., Yao, M., Miu, W., et al. (2021). Genome-wide identification and analysis of mkk and mapk gene families in Brassica species and response to stress in Brassica napus. Int. J. Mol. Sci. 22, 544. doi:10.3390/ijms22020544
Wei, P., Demulder, M., David, P., Eekhout, T., Yoshiyama, K. O., Nguyen, L., et al. (2021). Arabidopsis casein kinase 2 triggers stem cell exhaustion under Al toxicity and phosphate deficiency through activating the DNA damage response pathway. Plant Cell 33 (4), 1361–1380. doi:10.1093/plcell/koab005
Wu, J., Wang, J., Pan, C., Guan, X., Wang, Y., Liu, S., et al. (2014). Genome-wide identification of MAPKK and MAPKKK gene families in tomato and transcriptional profiling analysis during development and stress response. PLoS One 9 (7), e103032. doi:10.1371/journal.pone.0103032
Xiao, J. C., Cao, M. Y., Lai, K. Y., Sun, K., Zhang, L., Gao, P. C., et al. (2024). Unveiling key metabolic pathways in Bacillus subtilis-mediated salt tolerance enhancement in Glycyrrhiza uralensis Fisch. through multi-omics analysis. Environ. Exp. Bot. 219, 105631. doi:10.1016/j.envexpbot.2023.105631
Yamada, K., Yamaguchi, K., Shirakawa, T., Nakagami, H., Mine, A., Ishikawa, K., et al. (2016). The Arabidopsis CERK1-associated kinase PBL27 connects chitin perception to MAPK activation. EMBO J. 35 (22), 2468–2483. doi:10.15252/embj.201694248
Yan, B., Hou, J., Li, W., Luo, L., Ye, M., Zhao, Z., et al. (2023). A review on the plant resources of important medicinal licorice. J. Ethnopharmacol. 301, 115823. doi:10.1016/j.jep.2022.115823
Yao, Y., Zhao, H., Sun, L., Wu, W., Li, C., and Wu, Q. (2022). Genome-wide identification of MAPK gene family members in Fagopyrum tataricum and their expression during development and stress responses. BMC Genom 23, 96. doi:10.1186/s12864-022-08293-2
Zhan, H., Yue, H., Zhao, X., Wang, M., Song, W., and Nie, X. (2017). Genome-wide identification and analysis of MAPK and MAPKK gene families in bread wheat (Triticum aestivum L.). Genes 8, 284. doi:10.3390/genes8100284
Zhang, L. P., Wu, D., Zhang, W., Shu, H., Sun, P., Huang, C., et al. (2023). Genome-wide identification of WRKY gene family and functional characterization of CcWRKY25 in Capsicum chinense. Int. J. Mol. Sci. 24, 11389. doi:10.3390/ijms241411389
Zhang, M., Su, J., Zhang, Y., Xu, J., and Zhang, S. (2018). Conveying endogenous and exogenous signals: MAPK cascades in plant growth and defense. Curr. Opin. Plant Biol. 45, 1–10. doi:10.1016/j.pbi.2018.04.012
Zhang, Q., and Ye, M. (2009). Chemical analysis of the Chinese herbal medicine Gan-Cao (licorice). J. Chromatogr. A 1216 (11), 1954–1969. doi:10.1016/j.chroma.2008.07.072
Zhang, S. Q., and Klessig, D. F. (2001). MAPK cascades in plant defense signaling. Trends Plant Sci. 6 (11), 520–527. doi:10.1016/s1360-1385(01)02103-3
Keywords: Glycyrrhiza uralensis Fisch., salt stress, MAPK, Bacillus subtilis, subcellular localization
Citation: Gao P, Xiao J, Guo W, Fan R, Zhang Y and Nan T (2024) Genome-wide identification of Glycyrrhiza uralensis Fisch. MAPK gene family and expression analysis under salt stress relieved by Bacillus subtilis. Front. Genet. 15:1442277. doi: 10.3389/fgene.2024.1442277
Received: 01 June 2024; Accepted: 15 July 2024;
Published: 26 July 2024.
Edited by:
Mintao Sun, Chinese Academy of Agricultural Sciences (CAAS), ChinaReviewed by:
Hongbin Li, Shihezi University, ChinaCopyright © 2024 Gao, Xiao, Guo, Fan, Zhang and Nan. This is an open-access article distributed under the terms of the Creative Commons Attribution License (CC BY). The use, distribution or reproduction in other forums is permitted, provided the original author(s) and the copyright owner(s) are credited and that the original publication in this journal is cited, in accordance with accepted academic practice. No use, distribution or reproduction is permitted which does not comply with these terms.
*Correspondence: Tiegui Nan, bmFudGllZ3VpQDE2My5jb20=; Yan Zhang, emhhbmd5YW44NjY5QDEyNi5jb20=
†These authors have contributed equally to this work
Disclaimer: All claims expressed in this article are solely those of the authors and do not necessarily represent those of their affiliated organizations, or those of the publisher, the editors and the reviewers. Any product that may be evaluated in this article or claim that may be made by its manufacturer is not guaranteed or endorsed by the publisher.
Research integrity at Frontiers
Learn more about the work of our research integrity team to safeguard the quality of each article we publish.