 Carrie S. Wilson1*
 Jessica L. Petersen2
 Luiz F. Brito3
 Brad A. Freking4
 Sara M. Nilson2
 J. Bret Taylor1Thomas W. Murphy4
 Ronald M. Lewis2
- 1USDA, ARS, Range Sheep Production Efficiency Research Unit, U.S. Sheep Experiment Station, Dubois, ID, United States
- 2Department of Animal Science, University of Nebraska-Lincoln, Lincoln, NE, United States
- 3Department of Animal Sciences, Purdue University, West Lafayette, IN, United States
- 4USDA, ARS, Livestock Bio-Systems Research Unit, Roman L. Hruska U.S. Meat Animal Research Center, Clay Center, NE, United States
Knowledge of past and present genetic diversity within a breed is critical for the design and optimization of breeding programs as well as the development of strategies for the conservation of genetic resources. The Polypay sheep breed was developed at the U.S. Sheep Experiment Station (USSES) in 1968 with the goal of improving productivity in Western U.S. range flocks. It has since flourished in the more intensively managed production systems throughout the U.S. The genetic diversity of the breed has yet to be documented. Therefore, the primary objective of this study was to perform a comprehensive evaluation of the genetic diversity and population structure of U.S. Polypay sheep using both pedigree- and genomic-based methods. Pedigree data from 193 Polypay flocks participating in the National Sheep Improvement Program (NSIP) were combined with pedigree records from USSES (n = 162,997), tracing back to the breed’s origin. A subset of these pedigreed sheep from 32 flocks born from 2011 to 2023 were genotyped with the GGP Ovine 50K BeadChip containing 51,867 single nucleotide polymorphisms (SNPs). Four subgroups were used for the pedigree-based analyses: 1) the current generation of animals born in 2020–2022 (n = 20,701), 2) the current generation with a minimum of four generations of known ancestors (n = 12,685), 3) only genotyped animals (n = 1,856), and 4) the sires of the current generation (n = 509). Pedigree-based inbreeding for the full population was 2.2%, with a rate of inbreeding of 0.22% per generation. Pedigree-based inbreeding, Wright’s inbreeding, and genomic inbreeding based on runs of homozygosity were 2.9%, 1.3%, and 5.1%, respectively, for the genotyped population. The effective population size ranged from 41 to 249 for the pedigree-based methods and 118 for the genomic-based estimate. Expected and observed heterozygosity levels were 0.409 and 0.403, respectively. Population substructure was evident based on the fixation index (FST), principal component analysis, and model-based population structure. These analyses provided evidence of differentiation from the foundation flock (USSES). Overall, the Polypay breed exhibited substantial genetic diversity and the presence of a population substructure that provides a basis for the implementation of genomic selection in the breed.
Introduction
The Polypay breed was developed in 1968 at the U.S. Sheep Experiment Station (USSES, Dubois, ID, United States). It was developed with equal contributions from Dorset, Rambouillet, Targhee, and Finnsheep. It has since been maintained as a stabilized composite breed that is predicted to retain 75% of maximum individual and maternal heterosis. The five primary selection objectives of the breed development were high lifetime prolificacy, first lambing at 1 year of age, more than one lambing event per year, rapid lamb growth, and high carcass quality (Hulet et al., 1984). An image of a USSES Polypay ewe and her triplets is provided in Figure 1. The foundation breeds were selected to maintain the ruggedness of the Western U.S. range ewe while significantly improving reproductive characteristics. The Targhee and Rambouillet breeds were selected for their hardiness, large body size, flocking instinct, and fleece characteristics. The Polled Dorset was selected for carcass quality, milking ability, and long breeding season. The Finnsheep was selected for early puberty, early postpartum fertility, and a high lambing rate (Hulet et al., 1984).
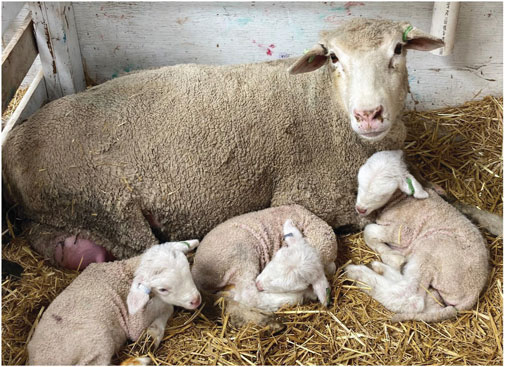
Figure 1. U.S. Sheep Experiment Station Polypay ewe and her triplets.
Matings were initiated in 1968 by crossing four unrelated Dorset rams, selected for large frame size and proven lamb productivity, with USSES Targhee ewes and one Finnsheep ram with USSES Rambouillet ewes. The Finnsheep ram was from the original 1968 imports of five rams from Ireland (Oltenacu and Boylan, 1981; Hulet et al., 1984). Four additional Finnsheep rams were added from 1969 to 1972. Beginning in 1969, Dorset-Targhee × Finnsheep-Rambouillet crosses were initiated. By 1970, the 4-breed cross was inter se mated. Development of the foundation lines and two-breed crosses continued for several years (Hulet et al., 1984). Throughout each mating cycle, replacements were retained according to the five primary selection objectives of breed development. Sales of surplus Polypay rams were reported from 1971 to 1974, with the first official Polypay sales in 1975 and the formation of the American Polypay Sheep Association in 1980 (American Polypay Sheep Association, 2024).
The Polypay is polled, with ewe body weight averaging 72 kg (Snowder, 2001). The reported average number of lambs born to mature ewes is 2.4 lambs with a 120-day total litter weight of 63.8 kg. Fiber diameter ranges from 24 to 33 μm, staple length ranges from 7.6 to 12.7 cm, and grease fleece weight ranges from 2.7 to 4.5 kg with a 57% clean fleece yield. An increase in profits over other U.S. breeds of 15%–36% has been reported, primarily driven by improved returns from lamb sales (Snowder, 2001). Further breed refinements have occurred in the more than 20 years of selection that have occurred since this report. Although the breed was initially developed for Western U.S. range production, the Polypay has proven to be versatile in other production and management systems. Throughout the Central and Eastern U.S., the Polypay has been utilized in intensive accelerated lambing systems to produce more than one lamb crop per year (Vanimisetti and Notter, 2012; Hulet and Stellflug, 2019). Although the utilization of Polypay sheep has remained primarily within the U.S., Canada, and Mexico (Stachowicz et al., 2018), it has also been reported as far south as Brazil (McManus et al., 2014). The number of annual lamb records for Polypays included in the National Sheep Improvement Program (NSIP) has averaged 6,900 from 2020 to 2022. In Canada, 267 Polypay sheep were reported in 2022 (Agriculture and Agri-Food Canada, 2024), with smaller numbers in Mexico and Brazil.
Many U.S. sheep breeders participate in genetic evaluation through the NSIP (http://nsip.org), which provides estimated breeding values (EBVs) and selection indexes for a wide range of production traits (Notter, 1998). Novel attributes are currently being evaluated to enable U.S. sheep breeders to improve their flocks for robustness and climatic resilience traits that are of economic relevance and include lamb survival, gastrointestinal parasitism, and ewe longevity (Burton et al., 2023; Lewis, 2023). The Polypay breed represents the “semi-prolific” category of this effort to evaluate novel traits and includes the recruitment of Polypay breeders highly engaged in the use of EBVs and moving toward the implementation of routine genomic evaluations. Hanna et al. (2023) reported that the Polypay had the shortest productive life of the four breeds evaluated (Columbia, Rambouillet, and Targhee), indicating the need for genetic improvement of survival and longevity traits in the breed.
Selection decreases genetic variation in a population. As the seedstock industry moves toward the implementation of genomic selection, the potential for substantial increased genetic gain is accompanied by a loss of genetic diversity (van der Werf et al., 2014; Kristensen et al., 2015). Prior to the implementation of genomic selection, establishing a baseline of the current genetic diversity of the Polypay breed is necessary. Therefore, the primary objectives of this study were to assess the current genetic diversity and the population structure of the Polypay breed in the founder and other U.S. flocks using both pedigree- and genomic-based methods.
Materials and methods
Data description
The animal study was approved by the USSES Institutional Animal Care and Use Committee (IACUC). Pedigree records from Polypay flocks participating in the NSIP were merged with historical pedigree records from the USSES beginning in 1970. Pedigree records were traced back until all ancestors were unknown using the Animal Breeders Toolkit (Golden et al., 1992). The depth of pedigree ranged from 1 to 25 generations. The final pedigree consisted of 162,997 individuals born in 193 flocks and included 3,530 sires and 29,489 dams.
Pedigree analyses
Subgroups
Pedigree analyses were performed using ENDOG software (Gutiérrez and Goyache, 2005). In addition to the complete pedigree, four subgroups were established (Figure 2). Subgroup 1 (SG 1) was defined as the current generation (born 2000–2022). Subgroup 2 (SG 2) was defined as the animals from SG 1 with a minimum of a complete four-generation pedigree. Subgroup 3 (SG 3) included only animals born between 2011 and 2023 that were genotyped with the GGP Ovine 50K BeadChip with a minimum of known parents in the pedigree and which passed the quality control for inclusion in the genomic analyses. Subgroup 4 (SG 4) was defined as the sires of the animals in SG 1. SG3 included 80 sheep that were also in SG 4.
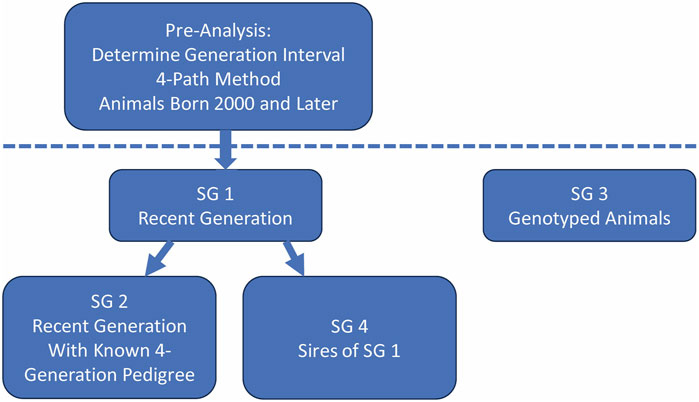
Figure 2. Formation of subgroups used in U.S. Polypay pedigree analyses.
Generations
Using the 4-path method for computing generation interval, the mean generation interval was computed as the average of the pathway between sire-son, sire-daughter, dam-son, and dam-daughter (James, 1977; Hill, 1979). Pedigree quality was assessed through the mean maximum number of generations, mean number of complete generations, and the equivalent complete generations for the full population and each subgroup. The mean number of maximum generations was computed as the number of generations between an animal and its furthest ancestor. Mean complete generations was the number of generations between an animal and its furthest generation where all ancestors were known (Gutiérrez and Goyache, 2005). The equivalent complete generations were computed as the sum of (1/2)n, where n is the number of generations separating the individual from each known ancestor (Maignel et al., 1996).
Inbreeding and relatedness
Relatedness among the animals was measured through the pedigree-based coefficient of inbreeding (F), average relatedness (AR), and the rate of inbreeding per generation. Inbreeding coefficients were computed using ENDOG (Gutiérrez and Goyache, 2005) and the methods described by Meuwissen and Luo (1992). The average relatedness was the probability that a randomly chosen allele from the whole population in the pedigree belonged to a given animal (Gutiérrez and Goyache, 2005). Average relatedness can be used to predict the long-term inbreeding of the population, taking into account both inbreeding and coancestry coefficients (Gutiérrez and Goyache, 2005). Average relatedness is twice the mean coancestry between an animal and all animals in the pedigree, including itself (Cervantes et al., 2008). The change in inbreeding over time, ∆F, was computed as follows:
where Fi was the average inbreeding coefficient of the ith generation. A linear model was fit in R software (R Core Team, 2021) to test if the regression of ∆F on generation (n = 3.1 years) was significantly different from 0.
Founders and ancestors
Exploration of founding alleles within this population included the calculation of the effective number of founders (fe), the effective number of ancestors (fa), the genetic conservation index (GCI), and the marginal contributions of ancestors. The effective number of founders was defined as the number of equally contributing founders that would produce the same genetic diversity as observed in the population. This measure was computed using the average relatedness coefficients of the founders as:
where qk was the probability of gene origin of founder k, and f was the total number of founders (Lacy, 1989; Gutiérrez and Goyache, 2005). The effective number of ancestors includes the minimum number of ancestors that explain the genetic diversity of the population. The ancestors may but were not required to have been from the founder population and were chosen based on their expected genetic contribution. This value was computed as:
where pj was the marginal contribution of ancestor j, and a was the total number of ancestors (Boichard et al., 1997). The ratio of fe to fa determines the presence of genetic bottlenecks, where larger values are associated with more narrow bottlenecks (Boichard et al., 1997). The GCI was developed by Alderson (1992) and quantifies the proportion of genes from each founder in the pedigree of each animal. The GCI was developed to maximize genetic diversity by each founder contributing equally to each animal. Animals with higher GCI, therefore, were expected to have more genetic diversity. A limitation of the use of GCI is the value becomes more informative as the depth of pedigree increases; thus, comparisons across different pedigree depths cannot be made. Accumulated marginal contributions by number of ancestors were plotted. The top 10 marginal contributors were examined further. The number of ancestors contributing to 50% of the genetic diversity of the population was determined.
Effective population size
Values representing Ne were calculated in ENDOG in seven unique ways. Because Ne is based on an idealized population, which does not exist in livestock breeding programs, computing Ne using multiple methods that provide a range of estimates is useful. The Ne was computed using the individual increase in inbreeding. Additional Ne estimates were computed based on the increase in individual inbreeding over maximum generations, complete generations, and equivalent complete generations traced (Gutiérrez et al., 2008; Gutiérrez et al., 2009). Another estimate of Ne was obtained from the regression of the inbreeding coefficients on year of birth (Gutiérrez et al., 2003). Because generations were not discrete, Ne also was estimated from the log regression of (1–F) on generation number (Pérez-Enciso, 1995). Lastly, Ne was estimated from the increase in coancestry for all pairs of individuals (Cervantes et al., 2011). Due to computational limitations, a random subset of 10,000 animals from the full population was selected using R software for computing Ne from an increase in coancestry.
Population structure
Population structure was determined using flocks to compute Nei’s minimum distance (Nei, 1978) and Wright’s fixation index (FST) (Wright, 1951; Caballero and Toro, 2000; 2002). The Nei’s minimum distance (D) was computed as follows:
where fii and fjj were the average coancestry within populations i and j, and fij was the average coancestry between the two populations. Wright’s FST was computed as follows:
where
Quantitative analyses
EBVs for SG 4 were obtained from the NSIP using data collected from 1985 to 2022. The EBVs for weaning weight, maternal weaning weight, number of lambs born, and number of lambs weaned, as well as the U.S. Maternal Index encompassing these four traits, were evaluated. The U.S. Maternal Index places positive emphasis on weaning weight, maternal weaning weight, and number of lambs weaned while placing slightly negative emphasis on the number of lambs born, thereby identifying ewes with the genetic capacity to rear all lambs to which they give birth.
Genomic analyses
Quality control
Animals from NSIP-enrolled flocks were genotyped with the GGP Ovine 50K BeadChip (Neogen, Lincoln, NE, United States), which included 51,867 markers. After filtering for animals with unknown parentage (n = 13) and animal call rate < 0.90 (n = 22), 1,856 animals remained for subsequent analyses. These animals came from 32 flocks (1–462 animals per flock). There were 342 males and 1,515 females with birth years ranging from 2011 to 2023. There were 14 flocks with 20 or more genotyped animals; 10 of those flocks had 40 or more. Quality control measures were applied using PLINK software (Purcell et al., 2007); only SNP markers that were mapped to the sheep genome (Oar_v3.1) were retained, and a marker call rate of > 0.90 was applied, leaving 48,360 autosomal SNPs. To account for linkage disequilibrium (LD) among markers, PLINK was used to randomly select a marker every 30 kb based on the estimated rate of decay of LD in the Polypay breed (Zhang et al., 2013). There were 30,995 markers remaining in the “full SNP” dataset. For some analyses, the markers were further filtered for minor allele frequency (MAF) < 0.01, leaving 29,559 markers in the “reduced SNP” dataset. For the Ne computation, an additional 50% thinning of the dataset was applied randomly, leaving 14,833 markers in the “thinned SNP” dataset.
Genetic diversity metrics
Minor allele frequency categories were defined in increments of 0.05 using PLINK with the full SNP dataset (Brito et al., 2015). Expected heterozygosity (HE) and observed heterozygosity (HO) were computed using the reduced SNP dataset in PLINK. From these results, the Wright’s inbreeding coefficient, F, was computed as follows:
The genomic-based Ne estimate was computed for the thinned SNP dataset in the NeEstimator software package (Do et al., 2014) using the LD method (Waples and Do, 2008; Do et al., 2014).
The runs of homozygosity (ROH) were determined using the DetectRUNS R package (Biscarini et al., 2019) with the full SNP dataset. The ROH were detected with a sliding window of 50 SNPs with a minimum length of 1,000 kb (equivalent to ∼30 SNPs), a maximum distance allowed between SNPs within an ROH of 250kb, a minimum of 30 SNPs, allowing for one missing SNP, and allowing a maximum of one possible heterozygous SNP (allowing a genotype error rate of 3%) within the defined window with a window threshold of 0.05. The ROH class categories were determined as 1 to 6, > 6 to 12, > 12 to 24, > 24 to 48, and > 48 Mb pairs. The number of ROH per animal was calculated. The inbreeding based on ROH (FROH) was computed as the total length of the genome covered by ROH divided by the total length of the genome covered by SNPs (after quality control). The FROH was also computed by ROH class category to evaluate past versus new inbreeding. Pearson correlation coefficients were computed between the three measures of inbreeding for the genotyped animals (pedigree-based F, Wright’s inbreeding, and FROH).
Linkage disequilibrium was computed using the r2 method described by Hill and Robertson (1968) and implemented in PLINK software using the reduced SNP file. As described by Brito et al. (2015), SNP pairs were assigned to bins based on pairwise marker distance, and the average of each bin was plotted to illustrate the LD decay with increasing physical distance. The distance and LD (r2) between adjacent SNP markers were computed.
Population structure
Population differentiation was assessed using three methods: the fixation index (FST), principal component analysis (PCA), and model-based population structure. The FST was computed between 14 flocks with more than 10 genotyped animals using the StAMPP R package (Pembleton et al., 2013) on the reduced SNP dataset. Bootstrapping (n = 100) produced 95% confidence intervals around pairwise FST values.
The PCA included 14 flocks with more than 10 genotyped animals. To reduce bias for number of animals included per flock, subsets of 20 animals were selected from the 10 flocks with more than 20 genotyped animals; all genotyped animals were included for the four flocks with 10–20 genotyped animals. Subsets of samples were selected with replacement by flock for five replicates using R software, resulting in 262 animals for each PCA. A distance matrix for each replicate was computed using PLINK with the reduced SNP dataset, and the eigenvectors were extracted. Combinations of principal components (PC) 1, 2, and 3 were visualized by flock using R.
The model-based population structure was determined with the reduced SNP dataset for all genotyped animals using ADMIXTURE software (Alexander et al., 2009). ADMIXTURE used the genotype matrix to identify ancestral populations and then assigned animals proportionally to those populations based on allele frequencies. ADMIXTURE was run for 2 to 20 subpopulations (K). Alexander et al. (2009) recommended determining the number of K using the lowest cross-validation error compared to other K values. After 20 K, which is beyond the number of ancestral populations expected for a single breed, the cross-validation error was still decreasing. Therefore, the relative decrease in cross-validation error was used to inform the number of K. The CLUMPP program was used to align and merge the replicates of the coancestry coefficient matrix, Q, produced by ADMIXTURE (Jakobsson and Rosenberg, 2007). Then, STRUCTURE PLOT was used to generate bar plots to visualize each animal by flock (Ramasamy et al., 2014).
Results
Pedigree analyses
The generation interval was 3.13 ± 0.02 years based on the weighted mean of each path: sire-son (2.97 ± 0.10 years), sire-daughter (3.12 ± 0.12 years), dam-son (3.45 ± 0.05 years), and dam-daughter (3.12 ± 0.04 years). Based on these results, the SG 1 and SG 2 populations included animals born in the most recent generation, from 2020 to 2022. Summary statistics for the full population and subgroups are presented in Table 1.
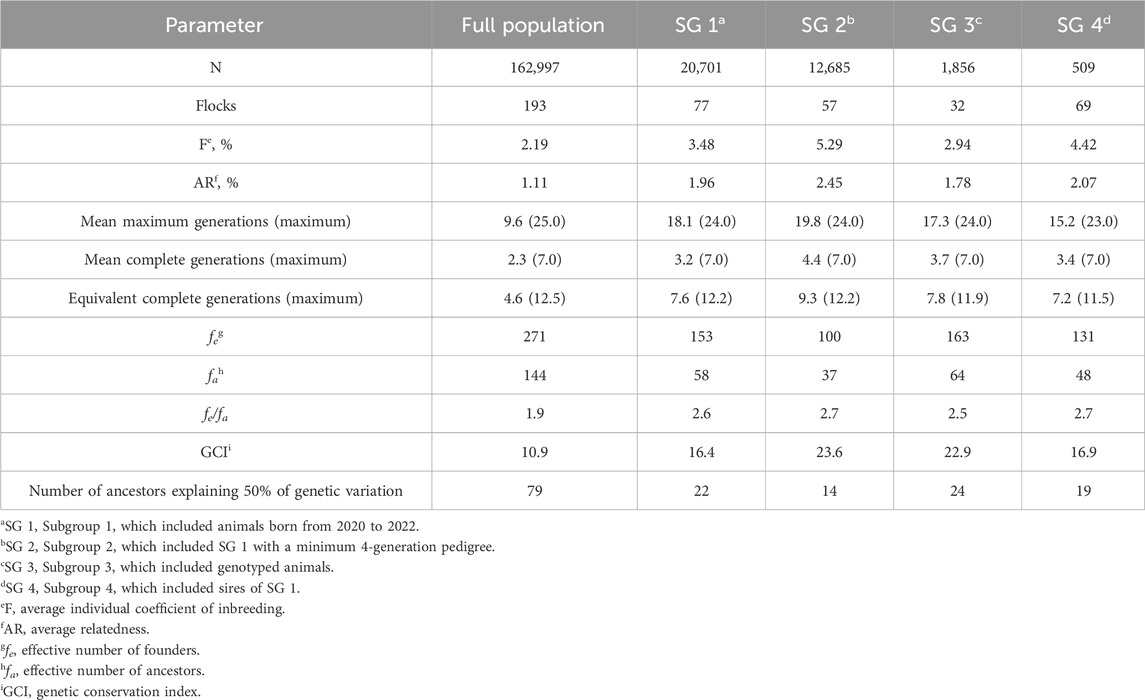
Table 1. Summary statistics for the full population and subgroups 1, 2, 3, and 4 for U.S. Polypay sheep.
Overall F and AR were low for the Polypay breed. Among these analyses, their values were highest for SG 2, which included the most complete pedigrees. Trends in F and AR since 1980 were plotted (Figure 3). For the generation interval of 3.1 years, the ∆F was 0.215% per generation and did not differ across generations (p = 0.95). The fe, fa, and fe/fa for the full population were 271, 144, and 1.9, respectively (Table 1).
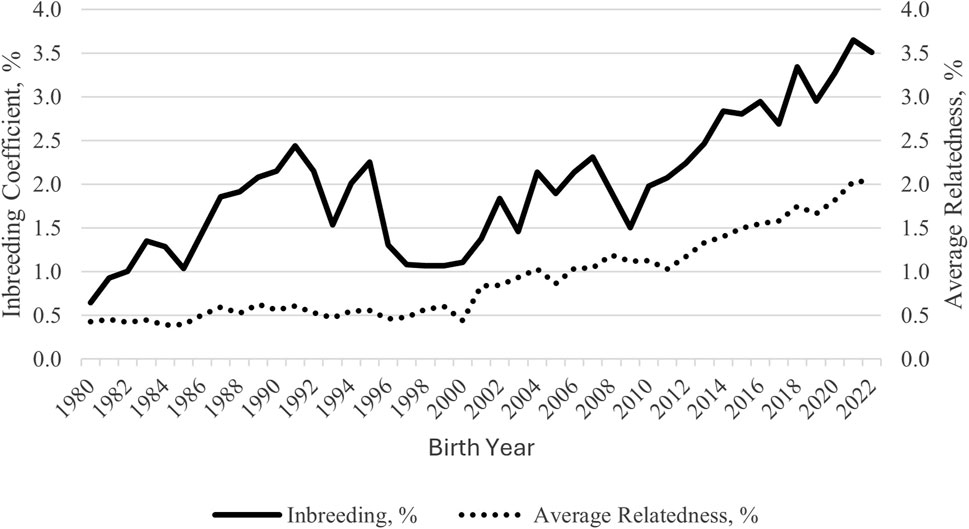
Figure 3. Inbreeding and average relatedness trends from 1980 to 2022 for U.S. Polypay sheep.
Accumulated marginal contributions of ancestors demonstrate that 50% of the genetic variation in the population was attributed to 79 ancestors (Figure 4). The top 10 marginal contributors were all rams originating from eight flocks that contributed 20.3% of the genetic variation in the population (Table 2). Three of the eight flocks participated in genotyping of their animals. Only one ram was from the founding flock, and the most recent influential ram was born in 2006.
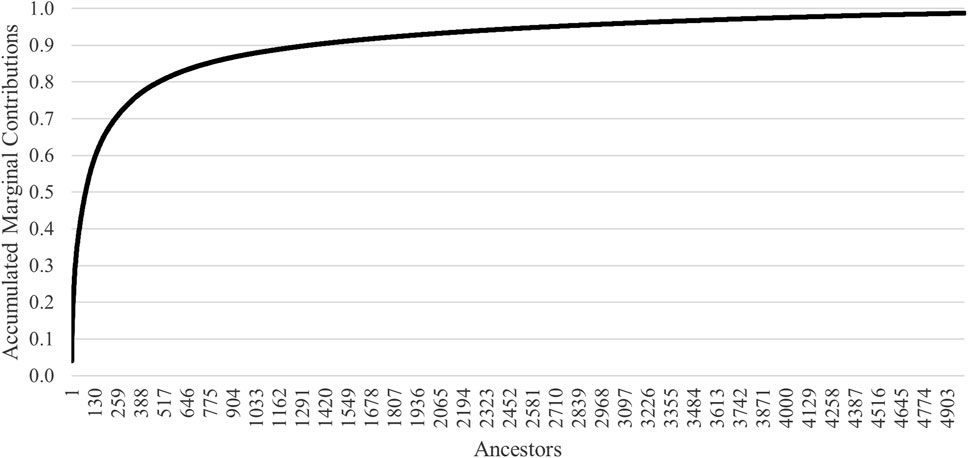
Figure 4. Accumulated marginal contributions by the number of ancestors for U.S. Polypay sheep.
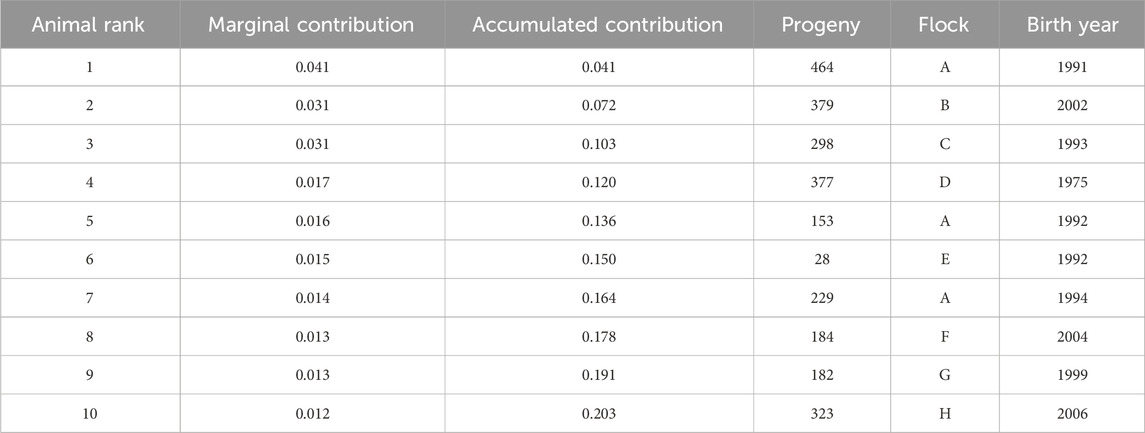
Table 2. Top 10 marginal contributors to the U.S. Polypay gene pool.
The pedigree-based estimates of Ne ranged from 41 (based on the increase in F by complete generation) to 249 (based on the increase in F by maximum generation) (Table 3). Population differentiation between the flocks was low for both Nei’s distance (0.027) and Wright’s FST (0.027).
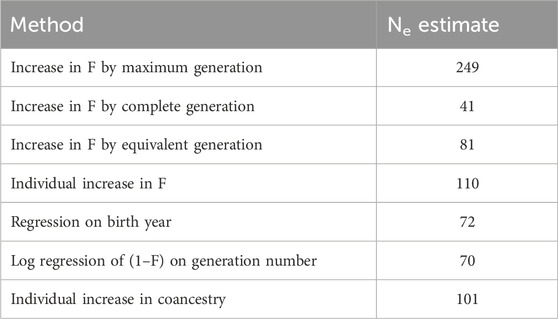
Table 3. Pedigree-based estimates of Ne in the U.S. Polypay population.
Quantitative analyses
The range of the NSIP U.S. Maternal Index scores and EBVs for its component traits were examined for the sires in SG 4 (Table 4). After removing animals with accuracies below the minimum reporting thresholds for the NSIP, the average accuracy was 76, 62, 59, and 55 for weaning weight, maternal weaning weight, number of lambs born, and number of lambs weaned EBVs, respectively. Particularly in younger sires, the prediction accuracies were near the lower bound of the reporting threshold.
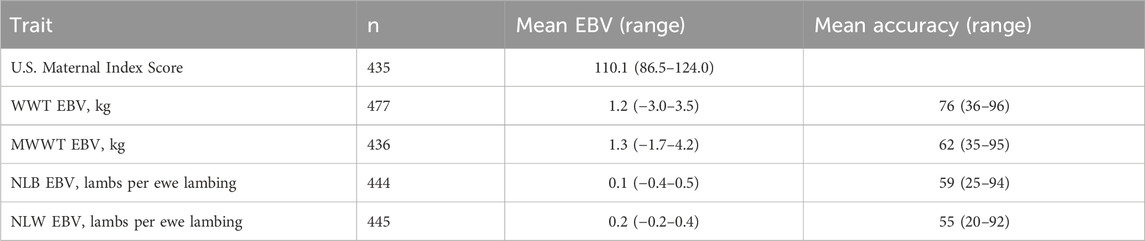
Table 4. 2022 NSIP values for the U.S. Maternal Index score, weaning weight (WWT) EBV, maternal weaning weight (MWWT) EBV, number of lambs born (NLB) EBV, and number of lambs weaned (NLW) EBV for U.S. Polypay subgroup 4.
Genomic analyses
The distribution of MAF was classified in Figure 5 with few fixed and rare SNPs. Most SNPs were highly polymorphic, defined as MAF > 0.30 (60.1%). The HE, HO, and Wright’s inbreeding were 0.409, 0.403, and 1.3%, respectively. The genomic Ne estimate for the current population was 118. The computed mean FROH was 5.1% (range 0.0%–50.2%). The number of ROH averaged 14.5 per animal with a range of 0–62. The majority of ROH were short; the percentages of ROH by size class are shown in Figure 6.
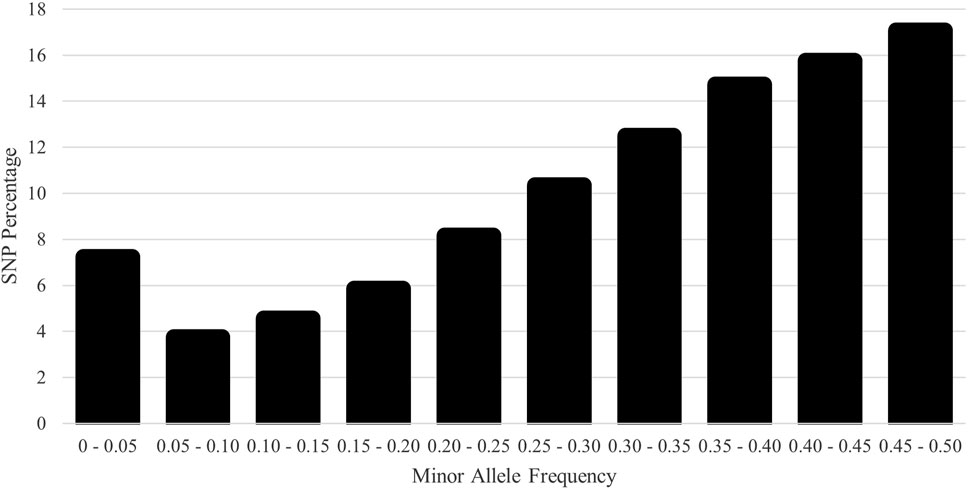
Figure 5. Distribution of single-nucleotide polymorphism (SNP) frequency by the minor allele frequency (MAF) category for the U.S. Polypay sheep.
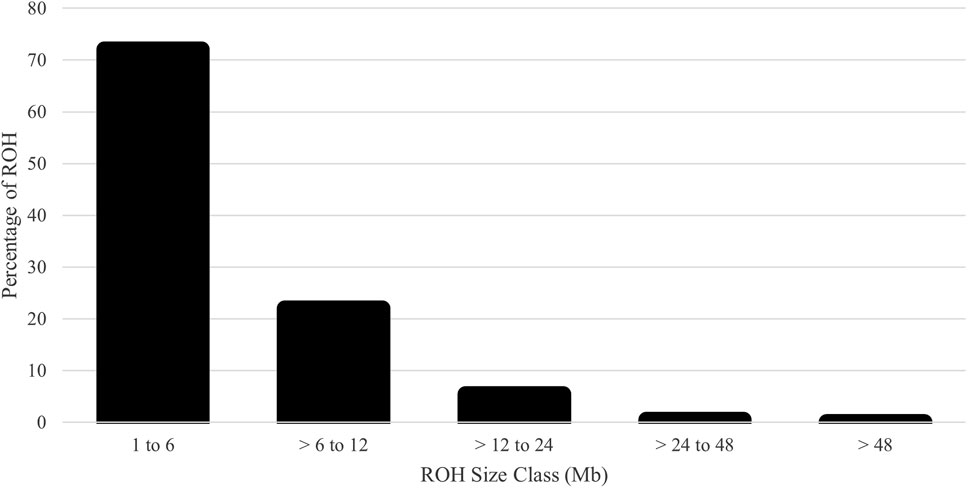
Figure 6. Percentage of runs of homozygosity (ROH) assigned to each size class for U.S. Polypay sheep.
The average inbreeding for the genotyped animals was 2.9%, 1.3%, and 5.1% for pedigree-based F, Wright’s F, and FROH, respectively. Inbreeding within each ROH class was 2.9%, 1.5%, 0.5%, 0.1%, and 0.0% for 1 to 6, > 6 to 12, > 12 to 24, > 24 to 48, and > 48 Mb, respectively. The Pearson correlation coefficients between the pedigree-based F and genomic-based F were 0.57 for Wright’s F and 0.52 for FROH. However, the Pearson correlation between the two genomic-based Fs demonstrated congruence (0.87). The overall LD among SNP pairs was low and declined with increasing distance (Figure 7). The average distance between adjacent SNPs was 0.09 Mb, with an average LD of 0.07.
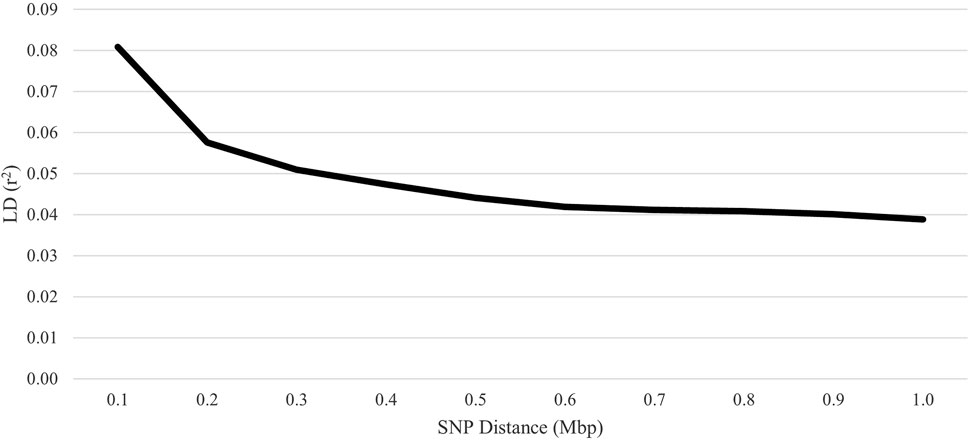
Figure 7. Linkage disequilibrium (LD) decay over increasing single-nucleotide polymorphism (SNP) distance for U.S. Polypay sheep.
The FST among the 14 flocks ranged from 0.01 to 0.10 with a mean of 0.05 (Figure 8; Supplementary Figure S1). Flock 16 had the lowest average differentiation from other flocks (0.03), while Flock 29 had the most (0.08). The foundation flock, USSES (Flock 17), had a mean FST of 0.06 and ranged from 0.03 to 0.10 when compared to the other flocks. The three flocks with the highest mean FST values, Flocks 3, 17, and 29, are differentiated in the PC1 vs. PC2 (Figure 9A; Supplementary Figures S2A, S3A, S4A, S5A) and PC1 vs. PC3 (Figure 9B; Supplementary Figures S2B, S3B, S4B, S5B) plots. The first of five replicates is shown in Figure 9, and replicates 2 to 5 are provided as Supplementary Material. The patterns of the PC visualizations were consistent across all replicates. The variation explained by each PC across replicates was low and ranged from 4.4% to 4.7% for PC1, 2.9%–3.2% for PC2, and 2.2%–2.5% for PC3. The flock with the lowest mean FST values, Flock 16, was widely dispersed across the PC plots and had extreme outliers in all plots. A model-based population structure was visualized in Figure 10 for all genotyped animals. As with the FST and PCA, Flocks 3 and 17 show differentiation in the subpopulation assignments. The remaining flocks have an admixed population structure.
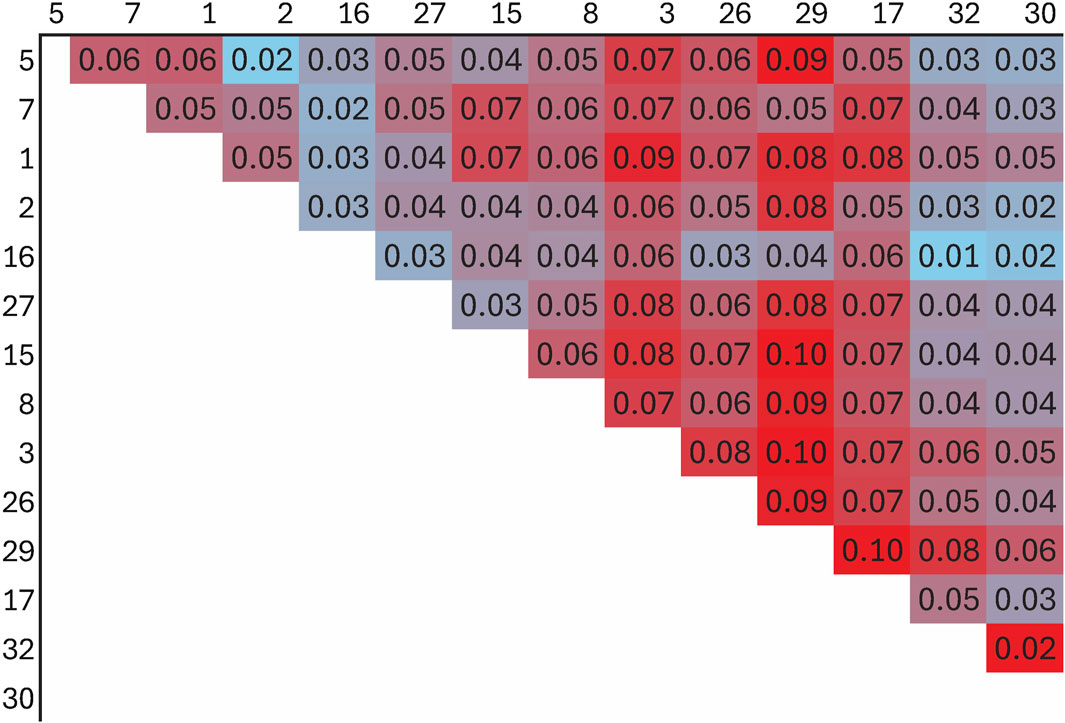
Figure 8. Heat map of fixation index (FST) for flocks with more than 10 genotyped Polypay sheep.
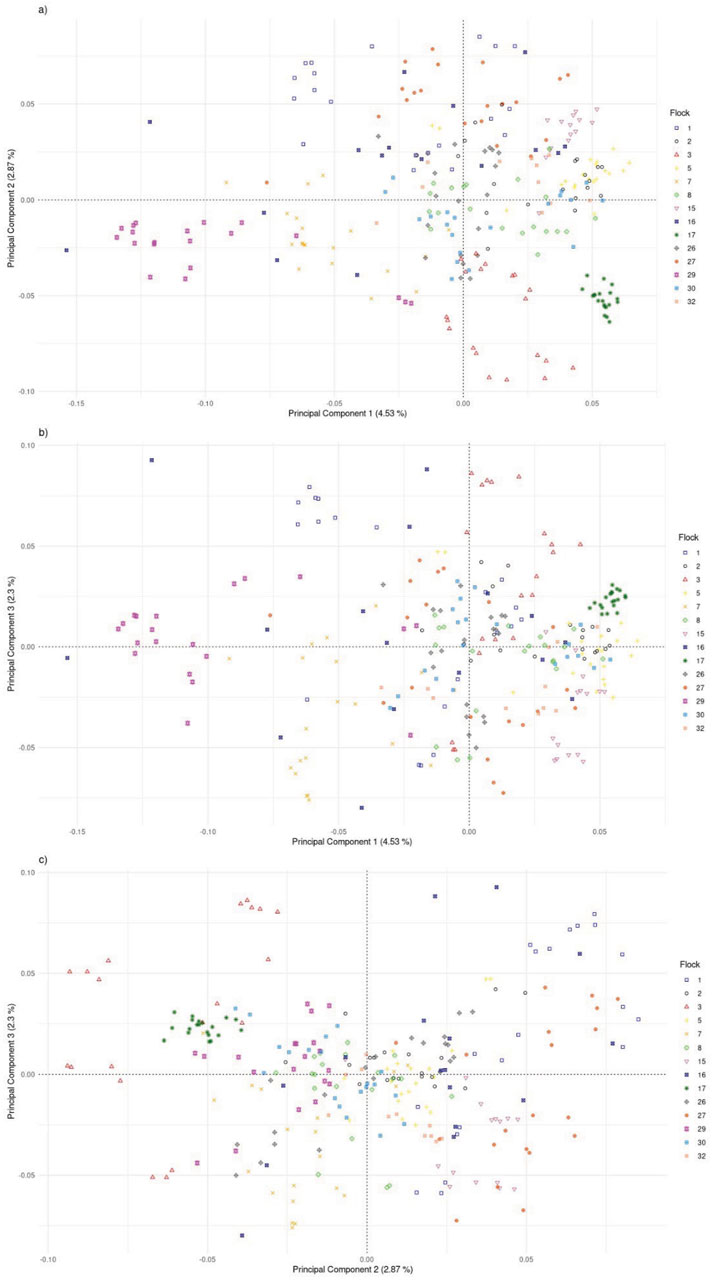
Figure 9. Plot of principal components 1 and 2 (A), 1 and 3 (B), and 2 and 3 (C) for U.S. Polypay sheep genotyped from 14 flocks (replicate 1).
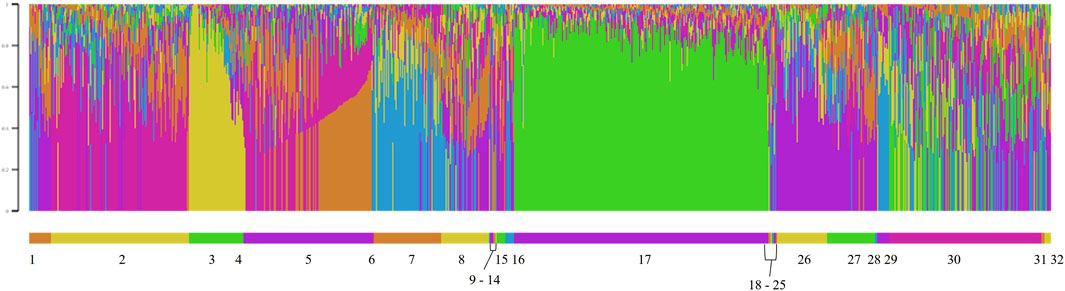
Figure 10. Model-based population structure for K = 6 for genotyped Polypay sheep, sorted by flock, where Flock 17 is the U.S. Sheep Experiment Station.
Discussion
The Polypay breed plays an important role in the U.S. sheep industry as a prolific Western U.S. range ewe and throughout the Central and Eastern U.S. in more intensively managed production systems. Continued genetic improvement in this breed will benefit from implementing genomic selection. As such, a thorough understanding of the genetic diversity and population structure was needed to develop sustainable breeding strategies.
Genetic diversity
The generation interval of 3.1 years was consistent with that of the Canadian Polypay, which is 3.4 years (Stachowicz et al., 2018). Recently reported generation intervals for other U.S. sheep breeds include 2.9 years, 3.1 years, and 2.9 years for Suffolk (Wilson et al., 2022), Targhee (Wilson et al., 2024), and Katahdin (Nilson et al., 2023), respectively. Other reported generation intervals include 3.6 years for the Brazilian Morada Nova (McManus et al., 2019), 3.3 years for the Canadian Suffolk (Stachowicz et al., 2018), and 3.2 years for the German White-headed Mutton sheep (Addo et al., 2021). Pedigree-based inbreeding estimates obtained in the current study in U.S. Polypay (3.5% for SG 1 and 5.3% for SG 2) were similar to that in the Canadian population (3.5%). The rate of inbreeding was higher for the Canadian population than for the U.S. population. The fe and fa were higher for the U.S. population, as was the number of ancestors explaining 50% of the gene pool. In comparison with other breeds, U.S. Suffolk and Czech Republic Romanov inbreeding was higher, while German White-headed Mutton sheep and Canadian Suffolk had lower inbreeding (Stachowicz et al., 2018; Vostry et al., 2018; Addo et al., 2021; Wilson et al., 2022).
The genomic inbreeding measures account for Mendelian sampling rather than probabilities with pedigree-based inbreeding and are, therefore, more accurate. However, not all animals can be genotyped, so both measures should be used in combination. Within ROH classes, the most inbreeding was found within the two smallest classes (2.9% for 1–6 Mb and 1.5% for > 6–12 Mb), indicating past rather than recent inbreeding. Even without exact agreement between the three measures at an individual level, inbreeding was low, with no cause for immediate concern. In accordance with the low levels of inbreeding, the AR values were low for the full population and the subgroups. The AR values predict the long-term inbreeding in the population and provide further evidence of the genetic diversity present in the current Polypay breed. The AR was lower than F for the Polypay, which was also observed for Katahdin (Nilson et al., 2023) and Morada Nova (McManus et al., 2019), but not for the Targhee (Wilson et al., 2024). As observed by Cervantes et al. (2008), because the mean F was higher than half of the mean AR, matings occurred between related animals. Fluctuations in F and AR, such as those seen from 1996 to 2000 and in 2009, are expected as new breeders join the NSIP, whose flocks may be less genetically connected to other flocks, or as breeders selectively report data on animals. Based on ∆F, inbreeding has been accumulating but not at an increasing rate. Low F and AR for SG 3 suggest the animals sampled for genotyping were less related than the current generation (SG 1 and SG 2), signifying effective sampling to estimate diversity.
Measures of founding alleles provide an understanding of the flow of genes from the founder population to the current gene pool and quantify any genetic bottlenecks that happened over time. For the full population, the fe/fa was 1.9, indicating the presence of bottleneck events. The ratio was higher for the subgroups (2.5–2.7), which represent the recent generation(s) of animals. However, only 79 ancestors explain 50% of the current gene pool. For other U.S. sheep breeds, 82 and 46 ancestors explained 50% of the gene pool for Katahdin (Nilson et al., 2023) and Suffolk (Wilson et al., 2022), respectively. The top 10 marginal contributors to the current gene pool were all rams born in 2006 or earlier. They had a range of offspring from 28 to 377, which is consistent for U.S. sheep breeds that typically do not utilize advanced reproductive technologies, such as artificial insemination, on a large scale.
Based on the low F and AR from the rams contributing to the current generation (SG 4) and the lack of recent highly influential sires, there was no evidence of dominant sires or sire lines in the current breeding population. Although the EBVs and Maternal Index for current sires showed a wide range of values, most rams were grouped close to the mean. Increasing the accuracy of breeding value predictions for existing traits through genomic selection, particularly for lowly heritable traits, those observed later in life, or those only expressed in one sex, and increasing the number of economically important traits evaluated in the Polypay breed are essential for breeders to differentiate among rams to meet their specific breeding objectives.
There is no single measure that defines an acceptable level of genetic diversity, but rather, a collective body of evidence describes the genetic variability of the population. As an attempt to provide guidance, the Food and Agriculture Organization of the United Nations (FAO) has recommended a goal of less than a 1% rate of inbreeding per generation and a Ne of more than 50 (FAO, 1998). Meuwissen (2009) provided a more conservative recommendation of a Ne of 100. Leroy et al. (2013) computed Ne for 140 breeds from four species using multiple methods. They concluded the species and population structure should be considered when determining which method to use and the minimum acceptable Ne. There is general agreement that pedigree-based methods for Ne estimation are to be considered in context as a range of estimates rather than a precise value. The rate of inbreeding was 0.215 per generation, which is well below the level of concern. Similarly, six of the seven pedigree-based Ne estimates were above 50, and three were above 100. The genomic-based Ne estimate of 118 exceeded the threshold level.
The majority of the SNPs were highly polymorphic, and both HE and HO levels were consistent with other studies using the GGP Ovine 50K, including the Czech Sumava (HE: 0.43; HO: 0.42), Czech Wallachian (HE: 0.40; HO: 0.41) (Machová et al., 2023), and Slovenian Valachian (HE: 0.39–0.43; HO: 0.39–0.43) (Mészárosová et al., 2022), and were higher than the U.S. Katahdin (HO: 0.37) (Becker et al., 2022). Because the Polypay is a composite breed with a relatively short history compared to other sheep breeds, high levels of heterozygosity were expected. In addition to being consistent with other sheep breeds, the majority of ROH were short, indicative of past inbreeding and founder effects rather than more recent inbreeding. The majority of ROH (72.1%) were in the smallest ROH class (1–6 Mb) compared to 95.9% in the smallest class (1–5 Mb) for U.S. Suffolk (Wilson, 2023), 88.2% in the smallest class (1–6 Mb) for 14 South African sheep breeds (Dzomba et al., 2021), the majority in the two smallest classes (<10 Mb) for six Irish commercial breeds (Purfield et al., 2017), and 71%–86% in the two smallest classes (<4 Mb) for 17 global sheep populations from eight breeds (Selli et al., 2021).
Successful implementation of genomic selection depends on both pedigree linkages among animals with both phenotypic and genomic data and breeding candidates and LD between the markers and the quantitative trait loci (QTL) of traits of interest (Meuwissen et al., 2001; Daetwyler et al., 2012; Wientjes et al., 2013). Based on the markers studied, the average LD between markers in the Polypay was low at all distances, and the LD declined with increased distance between markers. This is consistent with the findings of Zhang et al. (2013), who reported the lowest LD for Polypay of the five breeds evaluated. The LD decay closely mirrored New Zealand Romney, Coopworth, and Perendale (Prieur et al., 2017) and Qezel and Australian Suffolk, but LD was higher for Soay, Border Leicester, and Barbados Blackbelly (Kijas et al., 2014). Genome-wide association studies using a 50K BeadChip will suffer from low power due to poor genome coverage coupled with small blocks of LD in sheep. Even so, substantial improvements in the accuracy of estimated breeding values are anticipated using a moderately dense array due to a more reliable genomic relationship matrix.
Population structure
Genomic assessment of the 14 flocks with the most animals genotyped allowed a finer scale comparison of flocks. Some flocks (2, 16, 30) showed high levels of admixture through low FST values (<0.05), dispersion throughout the PC, and assignment to multiple ancestral populations based on the model-based population structure. Although Flock 16 had the lowest level of FST differentiation and high dispersion across the PC plots, there were several outliers in the PC plots, suggesting selection for an extreme phenotype or, more likely, the introduction of another breed. Flocks 3, 17, and 29 had distinct population structures with higher FST, separation in the PC, and distinctly different subpopulation assignments in the model-based population structure.
Differentiation among flocks provides a safeguard to maintain genetic diversity within the Polypay breed. However, ensuring sufficient genetic connectedness exists among flocks is important for genetic evaluation (Lewis et al., 2005; Kuehn et al., 2007; Kuehn et al., 2008; Kuehn et al., 2009). Adequate sampling of animals and flocks for the formation of optimal reference populations for genomic selection also needs to be prioritized.
The USSES flock (Flock 17), in which the Polypay breed was developed, had the most uniform clustering in the PC and the highest proportional assignment to a single subpopulation in the model-based population structure. The only flock with FST less than 0.05 is another national research flock, the U.S. Meat Animal Research Center (USMARC; Flock 30), which received a portion of its ewes and rams from USSES. The national flocks are intentionally sharing genetics to develop genetic reference flocks (GRF) that will serve sheep producers by incorporating industry sires into the research flocks. Continued exchange of genetics among national flocks will create opportunities to study genetics by environment by management interactions. Other than USMARC, substantial differentiation has occurred as the remaining flocks have moved toward a more intensive production and management environment. Meanwhile, the USSES has favored a moderately prolific range ewe with an emphasis on twins in a once-per-year lambing system.
In composite breed development, it is presumed that the initial percentages of the breeds combined will persist over time. This can be evaluated by comparing the genomes of founder breeds of the composite breed to identify the ancestral origins of regions throughout each chromosome using software such as ChromoPainter (Lawson et al., 2012; Paim T.d. P. et al., 2020; Paim T. D. P. et al., 2020). Using these methods, Paim T. D. P. et al. (2020) evaluated the breed composition of Brangus cattle, which was expected to be 62.5% Angus and 37.5% Brahman. They found some chromosome regions with directional selection for the Angus breed and fewer for the Brahman breed. The current Brangus population was determined to be 70.4% Angus. Further analysis of Polypay sheep using these methods is warranted to evaluate how selection and use in different production systems have influenced the retained breed percentages over time. Selection for prolificacy in an accelerated lambing system may favor a higher percentage of chromosomal regions from the high prolificacy of Finnsheep and the aseasonality of Dorset. A comparison of animals from the admixed flocks and the foundation flock would be of particular interest.
Conclusion
There is substantial genetic diversity in the Polypay breed and population structure. These findings show that the breed has become more diverse from its foundation flock, likely due to its popularity and incorporation into the sheep industry. As the industry moves toward the implementation of genomic selection, low levels of inbreeding, high levels of heterozygosity, and large Ne are beneficial for the Polypay breed. Population structure and differentiation among flocks provide an additional safety net for maintaining the genetic diversity in the breed. These baseline levels of genetic diversity and population structure should be re-evaluated in 10–15 years after genomic selection is implemented. Because breeders want to increase the proportion of favorable alleles in a population and subsequently decrease unfavorable alleles, we expect to observe changes in the genetic makeup of the population over time. Selection is expected to decrease genetic diversity in the breed, but the gains in genetic improvement have the opportunity to bring about positive changes in this economically important breed.
Data availability statement
The data analyzed in this study are subject to the following licenses/restrictions: The raw data cannot be made available as they are the property of the sheep producers participating in the NSIP, and this information is commercially sensitive. Requests to access these datasets should be directed to Y2FycmllLndpbHNvbkB1c2RhLmdvdg==.
Ethics statement
The animal study was approved by the USSES Institutional Animal Care and Use Committee (IACUC). The study was conducted in accordance with the local legislation and institutional requirements.
Author contributions
CW: conceptualization, formal analysis, methodology, visualization, writing–original draft, and writing–review and editing. JP: conceptualization, methodology, and writing–review and editing. LB: conceptualization, funding acquisition, methodology, and writing–review and editing. BF: conceptualization and writing–review and editing. SN: conceptualization, data curation, and writing–review and editing. JT: conceptualization, funding acquisition, and writing–review and editing. TM: conceptualization and writing–review and editing. RL: conceptualization, funding acquisition, methodology, and writing–review and editing.
Funding
The authors declare that financial support was received for the research, authorship, and/or publication of this article. This work was supported by the Agriculture and Food Research Initiative Competitive Grant (grant no. 2022-67015-36073/project accession no. 1027785) from the USDA National Institute of Food and Agriculture.
Acknowledgments
The authors would like to thank the U.S. Polypay breeders who contributed DNA samples to the project and to the NSIP for providing the pedigree and EBV data. They would like to thank Natalie Cherry for the meticulous recordkeeping of the USSES sheep pedigree data. The USDA is an equal opportunity provider and employer.
Conflict of interest
The authors declare that the research was conducted in the absence of any commercial or financial relationships that could be construed as a potential conflict of interest.
Publisher’s note
All claims expressed in this article are solely those of the authors and do not necessarily represent those of their affiliated organizations, or those of the publisher, the editors, and the reviewers. Any product that may be evaluated in this article, or claim that may be made by its manufacturer, is not guaranteed or endorsed by the publisher.
Author disclaimer
The mention of trade names or commercial products in this article is solely for the purpose of providing specific information and does not imply recommendation or endorsement by the USDA.
Supplementary material
The Supplementary Material for this article can be found online at: https://www.frontiersin.org/articles/10.3389/fgene.2024.1436990/full#supplementary-material
SUPPLEMENTARY FIGURE S1 | Heat map of fixation index (FST) (upper diagonal) and 95% confidence intervals (lower diagonal) for flocks with more than 10 genotyped Polypay sheep.
SUPPLEMENTARY FIGURE S2 | Plot of principal components 1 and 2 (A), 1 and 3 (B), and 2 and 3 (C) for Polypay sheep genotyped from 14 flocks (replicate 2).
SUPPLEMENTARY FIGURE S3 | Plot of principal components 1 and 2 (A), 1 and 3 (B), and 2 and 3 (C) for Polypay sheep genotyped from 14 flocks (replicate 3).
SUPPLEMENTARY FIGURE S4 | Plot of principal components 1 and 2 (A), 1 and 3 (B), and 2 and 3 (C) for Polypay sheep genotyped from 14 flocks (replicate 4).
SUPPLEMENTARY FIGURE S5 | Plot of principal components 1 and 2 (A), 1 and 3 (B), and 2 and 3 (C) for Polypay sheep genotyped from 14 flocks (replicate 5).
References
Addo, S., Klingel, S., Thaller, G., and Hinrichs, D. (2021). Genetic diversity and the application of runs of homozygosity-based methods for inbreeding estimation in German White-headed Mutton sheep. PLoS One 16 (5), e0250608. doi:10.1371/journal.pone.0250608
Agriculture and Agri-Food Canada (2024). Sheep registrations in Canada. Available at: https://agriculture.canada.ca/en/sector/animal-industry/canadian-dairy-information-centre/publications/statistics-canadas-animal-genetics/sheep-registrations-canada2024.
Alderson, G. L. H. (1992). “A system to maximize the maintenance of genetic variability in small populations,” in Genetic conservation of domestic livestock No. 2. Editors G. L. H. Alderson, and I. Bodo (United Kindom: CAB International), 18–29.
Alexander, D. H., Novembre, J., and Lange, K. (2009). Fast model-based estimation of ancestry in unrelated individuals. Genome Res. 19 (9), 1655–1664. doi:10.1101/gr.094052.109
American Polypay Sheep Association (2024). American Polypay association. Available at: https://www.polypay.org/2024.
Becker, G., Burke, J., Lewis, R., Miller, J., Morgan, J., Rosen, B., et al. (2022). “Inbreeding and effective population size of United States Katahdin sheep,” in Proceedings of 12th World Congress on Genetics Applied to Livestock Production (WCGALP) Technical and species orientated innovations in animal breeding, and contribution of genetics to solving societal challenges, 2913–2916.
Biscarini, F., Cozzi, P., Gaspa, G., and Marras, G. (2019). detectRUNS: an R package to detect runs of homozygosity heterozygosity in diploid genomes (Accessed February 1, 2023).
Boichard, D., Maignel, L., and Verrier, É. (1997). The value of using probabilities of gene origin to measure genetic variability in a population. Genet. Sel. Evol. 29 (1), 5. doi:10.1186/1297-9686-29-1-5
Brito, L. F., Jafarikia, M., Grossi, D. A., Kijas, J. W., Porto-Neto, L. R., Ventura, R. V., et al. (2015). Characterization of linkage disequilibrium, consistency of gametic phase and admixture in Australian and Canadian goats. BMC Genet. 16 (1), 67. doi:10.1186/s12863-015-0220-1
Burton, A., Weaver, A., Mills, R., Herrelson, F., and Harrelson, P. (2023). The role of year and animal origin on key determinants of Ewe longevity, 2023 celebration of student scholarship - poster presentations. Available at: https://scholarworks.moreheadstate.edu/celebration_posters_2023/16.16
Caballero, A., and Toro, M. A. (2000). Interrelations between effective population size and other pedigree tools for the management of conserved populations. Genet. Res. 75 (3), 331–343. doi:10.1017/s0016672399004449
Caballero, A., and Toro, M. A. (2002). Analysis of genetic diversity for the management of conserved subdivided populations. Conserv. Genet. 3, 289–299. doi:10.1023/a:1019956205473
Cervantes, I., Goyache, F., Molina, A., Valera, M., and Gutiérrez, J. P. (2011). Estimation of effective population size from the rate of coancestry in pedigreed populations. J. Animal Breed. Genet. 128 (1), 56–63. doi:10.1111/J.1439-0388.2010.00881.X
Cervantes, I., Molina, A., Goyache, F., Gutiérrez, J. P., and Valera, M. (2008). Population history and genetic variability in the Spanish Arab Horse assessed via pedigree analysis. Livest. Sci. 113 (1), 24–33. doi:10.1016/j.livsci.2007.02.011
Daetwyler, H., Kemper, K., Van Der Werf, J., and Hayes, B. J. (2012). Components of the accuracy of genomic prediction in a multi-breed sheep population. J. animal Sci. 90 (10), 3375–3384. doi:10.2527/jas.2011-4557
Do, C., Waples, R. S., Peel, D., Macbeth, G. M., Tillett, B. J., and Ovenden, J. R. (2014). NeEstimator v2: re-implementation of software for the estimation of contemporary effective population size (Ne) from genetic data. Mol. Ecol. Resour. 14 (1), 209–214. doi:10.1111/1755-0998.12157
Dzomba, E. F., Chimonyo, M., Pierneef, R., and Muchadeyi, F. C. (2021). Runs of homozygosity analysis of South African sheep breeds from various production systems investigated using OvineSNP50k data. BMC Genomics 22 (1), 7. doi:10.1186/s12864-020-07314-2
FAO (1998). FAO Secondary Guidelines for development of national farm animal genetic resources management plans.
Golden, B. L., Snelling, W. M., and Mallinckrodt, C. H. (1992). Animal breeders tool-kit: user's guide. Fort Collins, CO: Colorado State University, Exp. Sta. Tech. Bull. LTB92-2.
Gutiérrez, J. P., Altarriba, J., Díaz, C., Quintanilla, R., Cañón, J., and Piedrafita, J. (2003). Pedigree analysis of eight Spanish beef cattle breeds. Genet. Sel. Evol. 35 (1), 43–63. doi:10.1186/1297-9686-35-1-43
Gutiérrez, J. P., Cervantes, I., and Goyache, F. (2009). Improving the estimation of realized effective population sizes in farm animals. J. Animal Breed. Genet. 126 (4), 327–332. doi:10.1111/J.1439-0388.2009.00810.X
Gutiérrez, J. P., Cervantes, I., Molina, A., Valera, M., and Goyache, F. (2008). Individual increase in inbreeding allows estimating effective sizes from pedigrees. Genet. Sel. Evol. 40 (4), 359–378. doi:10.1186/1297-9686-40-4-359
Gutiérrez, J. P., and Goyache, F. (2005). A note on ENDOG: a computer program for analysing pedigree information. J. Animal Breed. Genet. 122 (3), 172–176. doi:10.1111/J.1439-0388.2005.00512.X
Hanna, L. H., Taylor, J., Holland, P., Vonnahme, K., Reynolds, L., and Riley, D. (2023). Effect of Ewe birth litter size and estimation of genetic parameters on Ewe reproductive life traits. animal 17 (8), 100900. doi:10.1016/j.animal.2023.100900
Hill, W. G. (1979). A note on effective population size with overlapping generations. Genetics 92 (1), 317–322. doi:10.1093/genetics/92.1.317
Hill, W. G., and Robertson, A. (1968). Linkage disequilibrium in finite populations. Theor. Appl. Genet. 38 (6), 226–231. doi:10.1007/BF01245622
Hulet, C. V., Ercanbrack, S. K., and Knight, A. D. (1984). Development of the Polypay breed of sheep. J. Animal Sci. 58 (1), 15–24. doi:10.2527/jas1984.58115x
Hulet, C. V., and Stellflug, J. N. (2019) Accelerated lambing: its role in the sheep industry, Sheep and Goat Handbook, 3. CRC Press, 171–178.
Jakobsson, M., and Rosenberg, N. A. (2007). CLUMPP: a cluster matching and permutation program for dealing with label switching and multimodality in analysis of population structure. Bioinformatics 23 (14), 1801–1806. doi:10.1093/bioinformatics/btm233
James, J. W. (1977). A note on selection differential and generation length when generations overlap. Anim. Prod. 24 (1), 109–112. doi:10.1017/S0003356100039271
Kijas, J. W., Porto-Neto, L., Dominik, S., Reverter, A., Bunch, R., McCulloch, R., et al. (2014). Linkage disequilibrium over short physical distances measured in sheep using a high-density SNP chip. Anim. Genet. 45 (5), 754–757. doi:10.1111/age.12197
Kristensen, T. N., Hoffmann, A. A., Pertoldi, C., and Stronen, A. V. (2015). What can livestock breeders learn from conservation genetics and vice versa? Front. Genet. 6, 38. doi:10.3389/fgene.2015.00038
Kuehn, L. A., Lewis, R. M., and Notter, D. R. (2007). Managing the risk of comparing estimated breeding values across flocks or herds through connectedness: a review and application. Genet. Sel. Evol. 39 (3), 225–247. doi:10.1186/1297-9686-39-3-225
Kuehn, L. A., Lewis, R. M., and Notter, D. R. (2009). Connectedness in Targhee and Suffolk flocks participating in the United States national sheep improvement program. J. animal Sci. 87 (2), 507–515. doi:10.2527/jas.2008-1092
Kuehn, L. A., Notter, D. R., Nieuwhof, G. J., and Lewis, R. M. (2008). Changes in connectedness over time in alternative sheep sire referencing schemes. J. Animal Sci. 86 (3), 536–544. doi:10.2527/jas.2007-0256
Lacy, R. C. (1989). Analysis of founder representation in pedigrees: founder equivalents and founder genome equivalents. Zoo. Biol. 8 (2), 111–123. doi:10.1002/zoo.1430080203
Lawson, D. J., Hellenthal, G., Myers, S., and Falush, D. (2012). Inference of population structure using dense haplotype data. PLoS Genet. 8 (1), e1002453. doi:10.1371/journal.pgen.1002453
Leroy, G., Mary-Huard, T., Verrier, E., Danvy, S., Charvolin, E., and Danchin-Burge, C. (2013). Methods to estimate effective population size using pedigree data: examples in dog, sheep, cattle and horse. Genet. Sel. Evol. 45 (1), 1. doi:10.1186/1297-9686-45-1
Lewis, R. M., Crump, R. E., Kuehn, L. A., Simm, G., and Thompson, R. (2005). Assessing connectedness in across-flock genetic evaluations. Annu. Meet. Am. Soc. Animal Sci. 83 (Suppl 1), 101–102.
Machová, K., Marina, H., Arranz, J. J., Pelayo, R., Rychtářová, J., Milerski, M., et al. (2023). Genetic diversity of two native sheep breeds by genome-wide analysis of single nucleotide polymorphisms. animal 17 (1), 100690. doi:10.1016/j.animal.2022.100690
Maignel, L., Boichard, D., and Verrier, E. (1996). Genetic variability of French dairy breeds estimated from pedigree information. INTERBULL Bull. (14), 49.
McManus, C., Facó, O., Shiotsuki, L., Rolo, J. L. J. P., and Peripolli, V. (2019). Pedigree analysis of Brazilian Morada Nova hair sheep. Small Ruminant Res. 170, 37–42. doi:10.1016/j.smallrumres.2018.11.012
McManus, C., Hermuche, P., Paiva, S. R., Ferrugem Moraes, J. C., de Melo, C. B., and Mendes, C. (2014). Geographical distribution of sheep breeds in Brazil and their relationship with climatic and environmental factors as risk classification for conservation. Braz. J. Sci. Technol. 1 (1), 3. doi:10.1186/2196-288X-1-3
Mészárosová, M., Moravčíková, N., Mészáros, G., Pavlík, I., Margetín, M., and Kasarda, R. (2022). “Measures of diversity based on autosomal and sex chromosomes of Valachian sheep,” in Proceedings of 12th World Congress on Genetics Applied to Livestock Production (WCGALP) Technical and species orientated innovations in animal breeding, and contribution of genetics to solving societal challenges, 3058–3061.
Meuwissen, T. (2009). Genetic management of small populations: a review. Acta Agric. Scand. A Anim. Sci. 59 (2), 71–79. doi:10.1080/09064700903118148
Meuwissen, T. H. E., Hayes, B. J., and Goddard, M. E. (2001). Prediction of total genetic value using genome-wide dense marker maps.
Meuwissen, T. H. E., and Luo, Z. (1992). Computing inbreeding coefficients in large populations. Genet. Sel. Evol. 24 (4), 305–313. doi:10.1186/1297-9686-24-4-305
Nei, M. (1978). Estimation of average heterozygosity and genetic distance from a small number of individuals. Genetics 89 (3), 583–590. doi:10.1093/genetics/89.3.583
Nilson, S. M., Burke, J. M., Murdoch, B. M., Morgan, J. L. M., and Lewis, R. M. (2023). Pedigree diversity and implications for genetic selection of Katahdin sheep. J. Animal Breed. Genet. 141, 304–316. doi:10.1111/jbg.12842
Notter, D. R. (1998). The U.S. National Sheep Improvement Program: across-flock genetic evaluations and new trait development. J. Animal Sci. 76 (9), 2324–2330. doi:10.2527/1998.7692324x
Oltenacu, E. A. B., and Boylan, W. J. (1981). Productivity of purebred and crossbred Finnsheep. I. Reproductive traits of ewes and lamb survival. J. Animal Sci. 52 (5), 989–997. doi:10.2527/jas1981.525989x
Paim, T. d. P., Hay, E. H. A., Wilson, C., Thomas, M. G., Kuehn, L. A., Paiva, S. R., et al. (2020a). Genomic breed composition of selection signatures in Brangus beef cattle. Front. Genet. 11, 710. doi:10.3389/fgene.2020.00710
Paim, T. D. P., Hay, E. H. A., Wilson, C., Thomas, M. G., Kuehn, L. A., Paiva, S. R., et al. (2020b). Dynamics of genomic architecture during composite breed development in cattle. Anim. Genet. 51 (2), 224–234. doi:10.1111/age.12907
Pembleton, L. W., Cogan, N. O. I., and Forster, J. W. (2013). StAMPP: an R package for calculation of genetic differentiation and structure of mixed-ploidy level populations. Mol. Ecol. Resour. 13 (5), 946–952. doi:10.1111/1755-0998.12129
Pérez-Enciso, M. (1995). Use of the uncertain relationship matrix to compute effective population size. J. Animal Breed. Genet. 112 (1-6), 327–332. doi:10.1111/J.1439-0388.1995.TB00574.X
Prieur, V., Clarke, S. M., Brito, L. F., McEwan, J. C., Lee, M. A., Brauning, R., et al. (2017). Estimation of linkage disequilibrium and effective population size in New Zealand sheep using three different methods to create genetic maps. BMC Genet. 18 (1), 68–19. doi:10.1186/S12863-017-0534-2
Purcell, S., Neale, B., Todd-Brown, K., Thomas, L., Ferreira, M. A. R., Bender, D., et al. (2007). PLINK: a tool set for whole-genome association and population-based linkage analyses. Am. J. Hum. Genet. 81 (3), 559–575. doi:10.1086/519795
Purfield, D. C., McParland, S., Wall, E., and Berry, D. P. (2017). The distribution of runs of homozygosity and selection signatures in six commercial meat sheep breeds. PLOS ONE 12 (5), e0176780. doi:10.1371/journal.pone.0176780
Ramasamy, R., Ramasamy, S., Bindroo, B., and Naik, V. (2014). STRUCTURE PLOT: a program for drawing elegant STRUCTURE bar plots in user friendly interface. SpringerPlus 3 (1), 431. doi:10.1186/2193-1801-3-431
R Core Team (2021). R: the R project for statistical computing. Editor R. C. Team (Vienna, Austria: R Foundation for Statistical Computing), 2019.
Selli, A., Ventura, R. V., Fonseca, P. A. S., Buzanskas, M. E., Andrietta, L. T., Balieiro, J. C. C., et al. (2021). Detection and visualization of heterozygosity-rich regions and runs of homozygosity in worldwide sheep populations. Animals 11 (9), 2696. doi:10.3390/ani11092696
Snowder, G. D. (2001). Characteristics of the American Polypay: a review. Anim. Genet. Resour. Inf. 29, 19–30. doi:10.1017/S1014233900001371
Stachowicz, K., Brito, L. F., Oliveira, H. R., Miller, S. P., and Schenkel, F. S. (2018). Assessing genetic diversity of various Canadian sheep breeds through pedigree analyses. Can. J. Animal Sci. 98 (4), 741–749. doi:10.1139/cjas-2017-0187
van der Werf, J. H. J., Banks, R. G., Clark, S. A., Lee, S. J., Daetwyler, H. D., Hayes, B. J., et al. (2014) “Genomic selection in sheep breeding programs,” in Proceedings of the 10th world congress on genetics applied to livestock production vancouver. Canada, 351.
Vanimisetti, H. B., and Notter, D. R. (2012). Opportunities for genetic evaluation of reproductive performance in accelerated lambing systems. Livest. Sci. 148 (1), 134–145. doi:10.1016/j.livsci.2012.05.022
Vostry, L., Milerski, M., Schmidova, J., and Vostra-Vydrova, H. (2018). Genetic diversity and effect of inbreeding on litter size of the Romanov sheep. Small Ruminant Res. 168, 25–31. doi:10.1016/j.smallrumres.2018.09.004
Waples, R. S., and Do, C. (2008). ldne: a program for estimating effective population size from data on linkage disequilibrium. Mol. Ecol. Resour. 8 (4), 753–756. doi:10.1111/j.1755-0998.2007.02061.x
Wientjes, Y. C., Veerkamp, R. F., and Calus, M. P. (2013). The effect of linkage disequilibrium and family relationships on the reliability of genomic prediction. Genetics 193 (2), 621–631. doi:10.1534/genetics.112.146290
Wilson, C. S. (2023). Developing a strategy for identifying genetically important animals. Fort Collins, CO: Colorado State University. Dissertation.
Wilson, C. S., Petersen, J. L., Blackburn, H. D., and Lewis, R. M. (2022). Assessing population structure and genetic diversity in US Suffolk sheep to define a framework for genomic selection. J. Hered. 113 (4), 431–443. doi:10.1093/jhered/esac026
Wilson, C. S., Taylor, J. B., Lewis, R. M., and Notter, D. R. (2024). Genetic impact of external Targhee sires at the US Sheep Experiment Station: a case study of introgression. Transl. Animal Sci. 8, txae044. txae044. doi:10.1093/tas/txae044
Wright, S. (1951). The genetical structure of populations. Ann. Eugen. 15 (1), 323–354. doi:10.1111/j.1469-1809.1949.tb02451.x
Keywords: Ovis aries, effective population size, inbreeding, linkage disequilibrium, diversity
Citation: Wilson CS, Petersen JL, Brito LF, Freking BA, Nilson SM, Taylor JB, Murphy TW and Lewis RM (2024) Assessment of genetic diversity and population structure of U.S. Polypay sheep from breed origins to future genomic selection. Front. Genet. 15:1436990. doi: 10.3389/fgene.2024.1436990
Received: 23 May 2024; Accepted: 16 July 2024;
Published: 05 August 2024.
Edited by:
Juan José Arranz, University of León, SpainReviewed by:
James W. Kijas, Commonwealth Scientific and Industrial Research Organisation (CSIRO), AustraliaJuan Pablo Gutiérrez, Complutense University of Madrid, Spain
Laercio R. Porto-Neto, Commonwealth Scientific and Industrial Research Organisation (CSIRO), Australia
Copyright © 2024 Wilson, Petersen, Brito, Freking, Nilson, Taylor, Murphy and Lewis. This is an open-access article distributed under the terms of the Creative Commons Attribution License (CC BY). The use, distribution or reproduction in other forums is permitted, provided the original author(s) and the copyright owner(s) are credited and that the original publication in this journal is cited, in accordance with accepted academic practice. No use, distribution or reproduction is permitted which does not comply with these terms.
*Correspondence: Carrie S. Wilson, Y2FycmllLndpbHNvbkB1c2RhLmdvdg==