 Rong He1
 Fei Li
94% of researchers rate our articles as excellent or good
Learn more about the work of our research integrity team to safeguard the quality of each article we publish.
Find out more
ORIGINAL RESEARCH article
Front. Genet., 21 June 2024
Sec. Evolutionary and Population Genetics
Volume 15 - 2024 | https://doi.org/10.3389/fgene.2024.1414074
The family Tephritidae in the order Diptera, known as true fruit flies, are agriculturally important insect pests. However, the phylogenetic relationships of true fruit flies, remain controversial. Moreover, rapid identification of important invasive true fruit flies is essential for plant quarantine but is still challenging. To this end, we sequenced the genome of 16 true fruit fly species at coverage of 47–228×. Together with the previously reported genomes of nine species, we reconstructed phylogenetic trees of the Tephritidae using benchmarking universal single-copy ortholog (BUSCO), ultraconserved element (UCE) and anchored hybrid enrichment (AHE) gene sets, respectively. The resulting trees of 50% taxon-occupancy dataset for each marker type were generally congruent at 88% nodes for both concatenation and coalescent analyses. At the subfamily level, both Dacinae and Trypetinae are monophyletic. At the species level, Bactrocera dorsalis is more closely related to Bactrocera latifrons than Bactrocera tryoni. This is inconsistent with previous conclusions based on mitochondrial genes but consistent with recent studies based on nuclear data. By analyzing these genome data, we screened ten pairs of species-specific primers for molecular identification of ten invasive fruit flies, which PCR validated. In summary, our work provides draft genome data of 16 true fruit fly species, addressing the long-standing taxonomic controversies and providing species-specific primers for molecular identification of invasive fruit flies.
The family Tephritidae in the order Diptera, commonly known as true fruit flies, includes over 4,300 species distributed in about 500 genera worldwide (White, 2006). Some species within this family are major agricultural pests globally, threatening various fruits, and causing significant economic losses (Smith et al., 2002). These economically damaging species mainly belong to five genera, Anastrepha, Bactrocera, Ceratitis, Dacus, and Rhagoletis (Smith et al., 2002).
Though extensive efforts have been devoted to clarifying the phylogeny of fruit flies, the relationships between some groups remain controversial. For example, based on morphological characteristics, the tribe Dacini (Dacus + Bactrocera) and Ceratitis genus belonged to the subfamily Dacinae, and the genera Anastrepha and Rhagoletis were in the subfamily Trypetinae (Korneyev, 1999). However, molecular evidence does not support the monophyly of Trypetinae (Han and McPheron, 1997; Han and Ro, 2009). Moreover, recent studies have suggested that both the Dacinae and the Trypetinae are non-monophyletic (Krosch et al., 2012; San Jose et al., 2018; Zhang et al., 2019; Song et al., 2019; David et al., 2021; Yong et al., 2021). In the subgenus Bactrocera, mitochondrial data shows that Bactrocera dorsalis is more closely related to Bactrocera tryoni than to Bactrocera latifrons (da Costa et al., 2019; Yong et al., 2016; Zhang et al., 2010; Zhang et al., 2018), while nuclear data supports a closer relationship between B. dorsalis and B. latifrons (Dupuis et al., 2018; San Jose et al., 2018; Valerio et al., 2022). These inconsistences were primarily due to incomplete lineage sorting or introgression (Zhang et al., 2021; Congrains et al., 2023; San Jose et al., 2023). Moreover, most previous molecular studies are mainly based on a few nuclear genes or mitochondrial genome data.
Phylogenetic analyses with a limited number of loci may lead to disputed conclusions (Munro et al., 2011; Young and Gillung, 2020), expanded sets of molecular markers have been used to infer the evolutionary relationships of species across distant taxa (Young and Gillung, 2020). For example, phylogenetic analysis of genome-scale data has tested controversial phylogenetic relationships for a wide range of organisms, such as bacteria (Gomila et al., 2015), fish (Hughes et al., 2018), spiders (Lozano-Fernandez et al., 2019) and asterids (Zhang et al., 2020). Transcriptomes are important genome-scale data widely used for phylogenetic analyses, including Lepidoptera (Bazinet et al., 2017), spiders (Garrison et al., 2016), insects (Misof et al., 2014), Ostracoda (Oakley et al., 2013) and chalcid (Zhang et al., 2020). However, as transcriptomes contain only expressed genes and transcriptome sequencing typically require a large quantity of high-quality RNA (Lemmon and Lemmon, 2013; McCormack et al., 2013), its utility is restricted. In contrast, whole-genome assemblies (Zhang et al., 2019) can obtain near-complete gene sets from a wide range of tissue types. Moreover, it is feasible to sequence the whole genome from low-quality samples such as preserved museum specimens or those intercepted by customs (Huynh et al., 2023). Genome-scale data have been used to infer phylogenies across distant taxa including lice (Boyd et al., 2017), butterflies (Allio et al., 2020), wasps (Cooper et al., 2020), springtails (Sun et al., 2020), and scale insects (Liu et al., 2022). These studies suggest whole genome assemblies are information-rich for phylogenomic analyses.
To explore the genome data for phylogenomic analysis, several types of molecular markers have been developed, including the benchmarking universal single-copy ortholog (BUSCO) gene set (Waterhouse et al., 2018), anchored hybrid enrichment (AHE) (Lemmon et al., 2012), and ultraconserved element (UCE) (Faircloth et al., 2012b; Faircloth, 2016). BUSCO are single copy orthologs identified based on database OrthoDB (Zdobnov et al., 2017) and have been widely used to assess the completeness of genome assemblies and transcriptomes. BUSCO has been used for reconstructing the phylogenies of some organisms, such as yeasts (Shen et al., 2016), insects (Ioannidis et al., 2017), springtails (Sun et al., 2020), and turtles (Gable et al., 2022). In contrast, AHE and UCE target highly conserved regions with variable flanking sequences. AHE gene sets mainly target coding regions, whereas UCE gene sets target coding and noncoding genomic regions (Zhang and Lai, 2020c). AHE has been used to uncover phylogenomic relationships of flower flies (Young et al., 2016), lacewings (Winterton et al., 2018; Cai et al., 2023), beetles (Li et al., 2023) and moths (Homziak et al., 2019). UCE has been used for phylogenetic analysis to recover the relationships of many groups, such as fish (Faircloth et al., 2013), arachnids (Starrett et al., 2017), birds (Stiller et al., 2024), wasps (Cooper et al., 2020), and scale insects (Liu et al., 2022). All these marker sets rely on homology searching in predefined databases or probe sets to identify target loci from genomes (Dietrich et al., 2017; Faircloth, 2017; Breinholt et al., 2018), and have proved useful for inferring phylogenetic relationships at both shallow and deep levels (Zhang and Lai, 2020c; Carter et al., 2023).
Rapid invasive species identification is important for customs departments to develop effective quarantine measures. Presently, the most widely used method for identifying fruit flies relies on the morphological features of adult insects (Huang et al., 2017). However, if intercepted pests are in the stage of larvae or pupae, they need to be reared to adults for accurate identification. This is time-consuming or even impossible to obtain adults because of emergence failure. However, due to the high sequence similarity between true fruit flies, reliable molecular identification primers are still unavailable (Liang et al., 2011; Frey et al., 2013; Manger et al., 2018; Kunprom and Pramual, 2019).
In this study, we used a phylogenomic approach to uncover the phylogeny of Tephritidae to address unclear phylogenetic relationships of true fruit flies. First, genome data of 16 true fruit flies were obtained via Illumina sequencing. Second, we extracted the BUSCO, AHE and UCE from the genome data and built different matrices data to infer the tephritid phylogeny. Moreover, with these genome data, we designed species-specific primers for molecular identification of true fruit flies. Our results provide new insights into the phylogenetic relationship of true fruit flies at the genome level and technical support for quarantine identification of invasive true fruit flies at custom ports.
We collected samples of 16 true fruit fly species for sequencing, across seven genera: Anastrepha, Bactrocera, Ceratitis, Dacus, Zeugodacus, Carpomya and Rhagoletis (Table 1). DNA extraction was performed on a single specimen per species, using the Blood and Cell Culture DNA Midi Kit (Qiagen, United States). The quality of genomic DNA was controlled by the following criterion: the concentration of DNA is greater than 30 ng/μL; the OD260/280 range from 1.8 to 2.0; the DNA has no RNA contamination. A 350-bp insert Illumina TruSeq fragment and a 400-bp insert library were constructed from qualified genomic DNA using a TruSeq Nano DNA HT Sample Preparation Kit, and then sequenced on the Illumina Hiseq X-ten and NovaSeq 6000 platforms (see Table 1 for details), respectively. All sequencing data for the 16 fruit flies are available in the National Genomics Data Center GSA database (https://ngdc.cncb.ac.cn/gsa/). The GSA number is CRA016637.
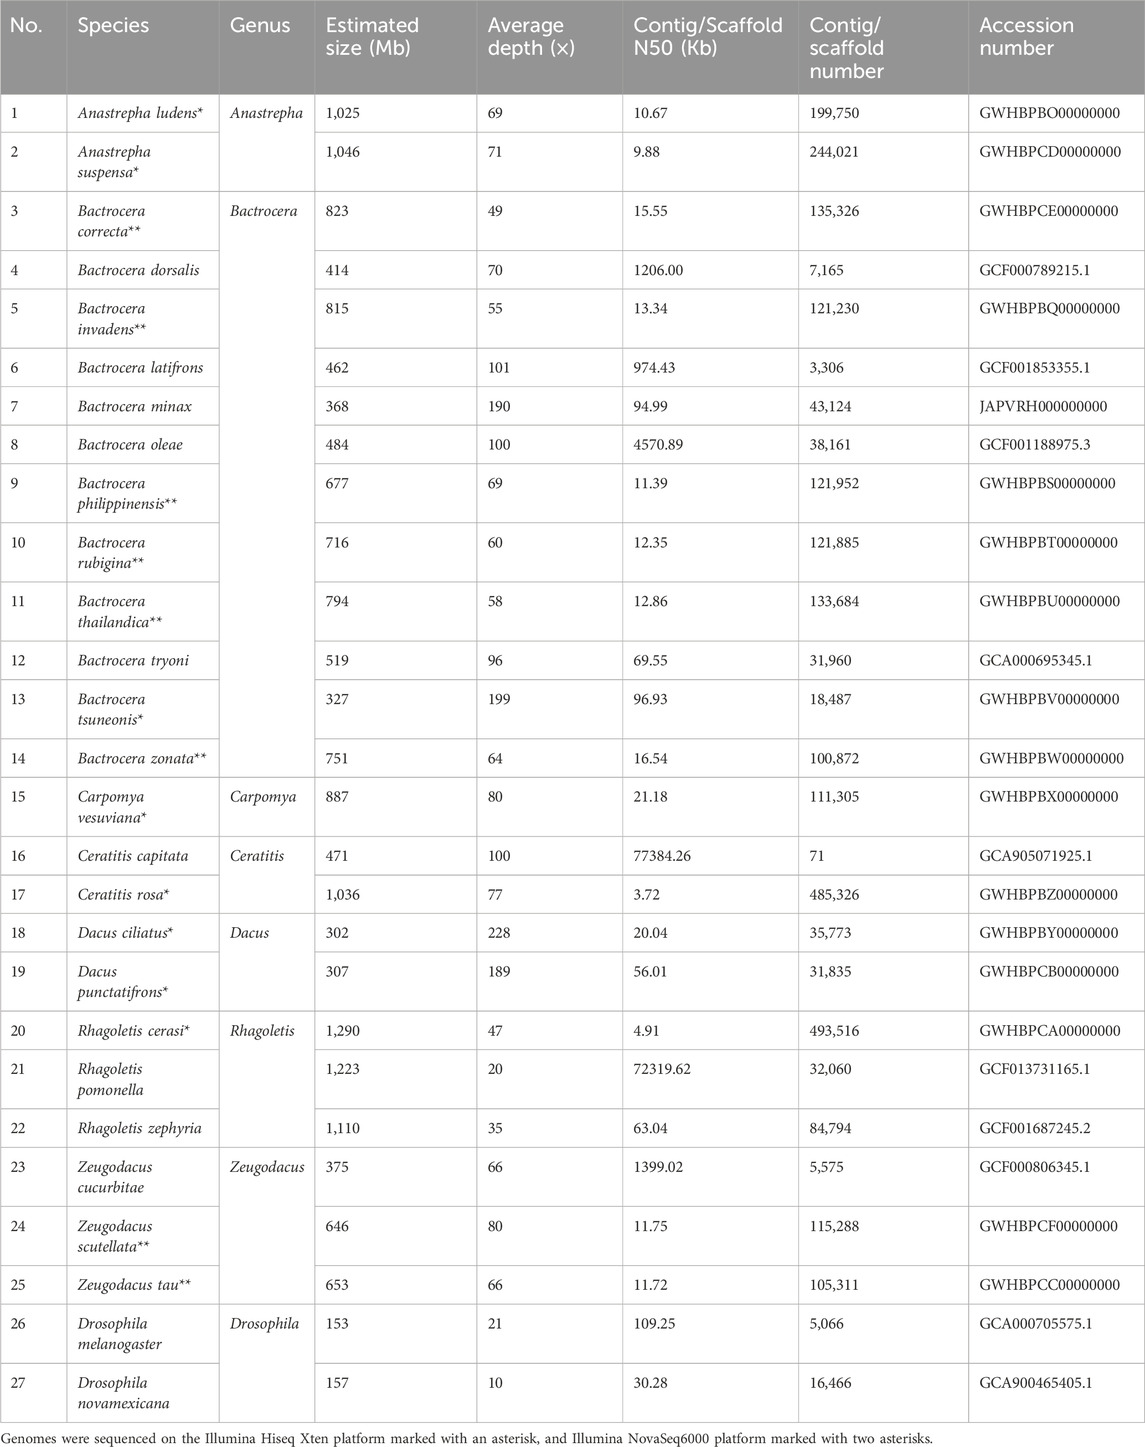
Table 1. Taxon sampling and genomic information of 25 Tephritidae fruit flies and two Drosophila species as outgroups.
Reads with low-quality bases, adapter sequences, or reads containing poly-Ns were removed using Fastp v0.20.0 (Chen et al., 2018). The reads shorter than 50 bp or with more than 5 Ns were removed, and the reads with the bases whose quality value Q ≤ 15 accounted for more than 50% of total bases were removed. MaSuRCA v3.2.2 (Zimin et al., 2013) with the parameters (GRAPH_KMER_SIZE = auto, USE_LINKING_MATES = 1, LIMIT_JUMP_COVERAGE = 300, CA_PARAMETERS = cgwErrorRate = 0.15, KMER_COUNT_THRESHOLD = 1, and SOAP_ASSEMBLY = 0) was used to assemble the cleaned reads of each species to contig level. All genome assemblies for the 16 fruit flies are available in the National Genomics Data Center GWH database (https://ngdc.cncb.ac.cn/gwh/). All assemblies were assessed for completeness using BUSCOv3.0.2 (Waterhouse et al., 2018) against the Insecta orthodbv9 dataset. Repetitive regions for each genome assembly were masked using Repeat Modeler v2.0.7 (Flynn et al., 2020), and Ab initio gene prediction performed in BRAKER v2.1.5 (Bruna et al., 2021) against Arthropoda homology protein dataset (https://bioinf.uni-greifswald.de/bioinf/partitioned_odb11/) following the pipeline by Mei et al. (2022), a combination of automatically training GeneMark-ES/ET/EP v4.59_lic (Lomsadze et al., 2014) and AUGUSTUS v3.3.4 (Stanke et al., 2004).
For the BUSCO marker, we retrieved the single copy orthologs from the results of each genome assembly by using BUSCO v3.0.2 (Waterhouse et al., 2018) software to scan for the Insecta BUSCO set (1,658 loci).
For UCE and AHE loci, we employed the PHYLUCE v1.6.3 package manual (Faircloth, 2016) to extract UCE and AHE from each genome assembly, using the Diptera-wide UCE2.7kv1 probe set containing 31,328 baits targeting 2,711 loci (Faircloth, 2017) and the Diptera AHE probe set containing 217,702 sites targeting 559 loci (Young et al., 2016), respectively. In the PHYLUCE, the script “phyluce_probe_run_multiple_lastzs_sqlite” was used to align the probe sequence to the assembly genomes. The script “phyluce_probe_slice_sequence_from_genomes” was used to extract the Fasta sequence from the assembly genomes. Then the script “phyluce_assembly_match_contigs_to_probes” was used to match contigs from probes and remove duplicate contigs. Finally, the UCE and AHE loci were extracted using the scripts “phyluce_assembly_get_match_counts” and “phyluce_assembly_get_fastas_from_match_counts.” The flanking region of 400 bp on both sides for each UCE and AHE locus was retained.
For each type of marker, the sequences of each individual locus were aligned with MAFFT v7.475 (Katoh and Standley, 2013), followed by trimming with TRIMAL v1.4.1 (Capella-Gutierrez et al., 2009), and concatenated with FASconCAT-G v1.04 (Kueck and Longo, 2014). Data matrixes of each marker type (BUSCO, AHE) were generated for each locus ensuring at least 50%, 75%, 90%, and 100% species occupancy. Due to an absence of a 100% species-occupancy locus, UCE data matrices were generated for 50%, 75% and 90% taxon-occupancy. Summary statistics were performed using AMAS, including average locus length and parsimony informative sites (Borowiec, 2016).
To infer the phylogenetic relationships of the fruit flies, in addition to the 16 species sequenced in this study, nine previously sequenced fruit fly species from NCBI, including Zeugodacus cucurbitae, B. dorsalis, B. latifrons, Bactrocera minax, Bactrocera oleae, B. tryoni, Rhagoletis zephyria, Rhagoletis pomonella, Ceratitis capitata, and two outgroup species (Drosophila melanogaster and Drosophila novamexicana) were analyzed. The accession numbers for each species are listed in Table 1. In total, our taxon sampling was 27 taxa including 25 ingroup species and two outgroup species for phylogenetic analyses.
Phylogenomic analyses were conducted using concatenation method, generating supermatrix and coalescent-based species trees for UCE, BUSCO, and AHE matrices. We executed maximum likelihood (ML) of concatenation analysis using partitioning schemes with PartitionFinder v2.1.1 (Lanfear et al., 2017) for the best trees to conduct 20 ML tree searches (10 random and 10 parsimony-based starting trees) and 1,000 bootstrap replicates using RAxML-NG v1.0.1 (Kozlov et al., 2019). For species tree estimation based on the coalescent method, gene trees were first estimated using RAxML-NG v1.0.1 on individual gene alignments with the GTR + G4 substitution model for nucleotides and amino acids with the LG + G4 substitution model by running 500 bootstrap replicates. Species trees were then estimated from gene trees using ASTRAL-III v5.6.1 (Zhang et al., 2018a), using local posterior probabilities to assess node support.
We calculated the pairwise Robinson-Foulds (RF) distances (Robinson and Foulds, 1981) between the topologies of gene trees from BUSCO, UCE, and AHE datasets at 50% species occupancy and their species tree topology using the function multiRF in the phytools R package (Revell, 2012). The discordance between all the gene trees and species tree was visualized using a multidimensional scaling method (Duchêne et al., 2018; Roycroft et al., 2020). The pairwise RF distances were plotted in two dimensions using the function cmdscale in R and visualized using the ggplot2 package (Villanueva and Chen, 2019).
Divergence time was computed across each dataset (UCE, BUSCO, and AHE) at 50% species occupancy. We estimated the divergence time utilizing a relaxed molecular clock method using MCMCTree in Paml v4.9 (Yang, 2007). Calibration was performed using three divergence time points obtained from the timetree database (http://timet.ree.org/) and literature. The first calibration point corresponds to the divergence of Dacus + Zeugodacus (86.3–59.3 Mya) (Krosch et al., 2012). The second calibration point represents the most recent common ancestor of subgenus Tetradacus (30.9–12.4 Mya) (Krosch et al., 2012). The final calibration point is the divergence of Drosophila (38–62 Mya) (http://timet.ree.org/). To ensure convergence, chains from two independent runs were checked in Tracer 1.7 (Rambaut et al., 2018) to assess the effective sample size (ESS) values above 200, indicating appropriate sampling from the posterior distribution of each parameter. The resulting time trees were viewed and edited using Figtree v.1.4.4 (http://tree.bio.ed.ac.uk/software/figtree/).
To assess the ability of different marker types to infer relationships at specific time points (Townsend, 2007), the phylogenetic informativeness (PI) of BUSCO, UCE, and AHE nucleotide datasets at 50% species occupancy as measured using TAPIR (Faircloth et al., 2012a), optimized for parallelized calculation across extensive genomic datasets. Before calculating PI, a time-tree was used as an input in this program. We constructed time-calibrated phylogenetic trees for each dataset using our consensus phylogeny topology. The total PI for each dataset and the PI per locus per dataset were calculated, respectively.
Considering the availability of the specimens collected, only 13 fruit fly species were used to screen for species-specific primers for molecular identification (Table 2). They were identified by morphological characteristics (Plant Health Australia, 2011; Huang et al., 2017), before the test. Coding sequence (CDS) obtained by Ab initio gene prediction of these 13 fruit fly species were blasted against the genome assemblies of all the 25 fruit fly species (Table 1) to predict species-specific sequences by using the following steps: 1) The CDS of each fruit fly was fragmented into 200 bp short sequences with a step length of 50 bp. 2) Then short fragments were searched against genome assemblies for high sequence similarity matches using Bowtie2 v2.5.1 (Langmead and Salzberg, 2012). 3) Fragments with no blast hit in other fruit flies were species-specific. 4) The species-specific fragments were used for designing specific primers and were then verified through PCR.
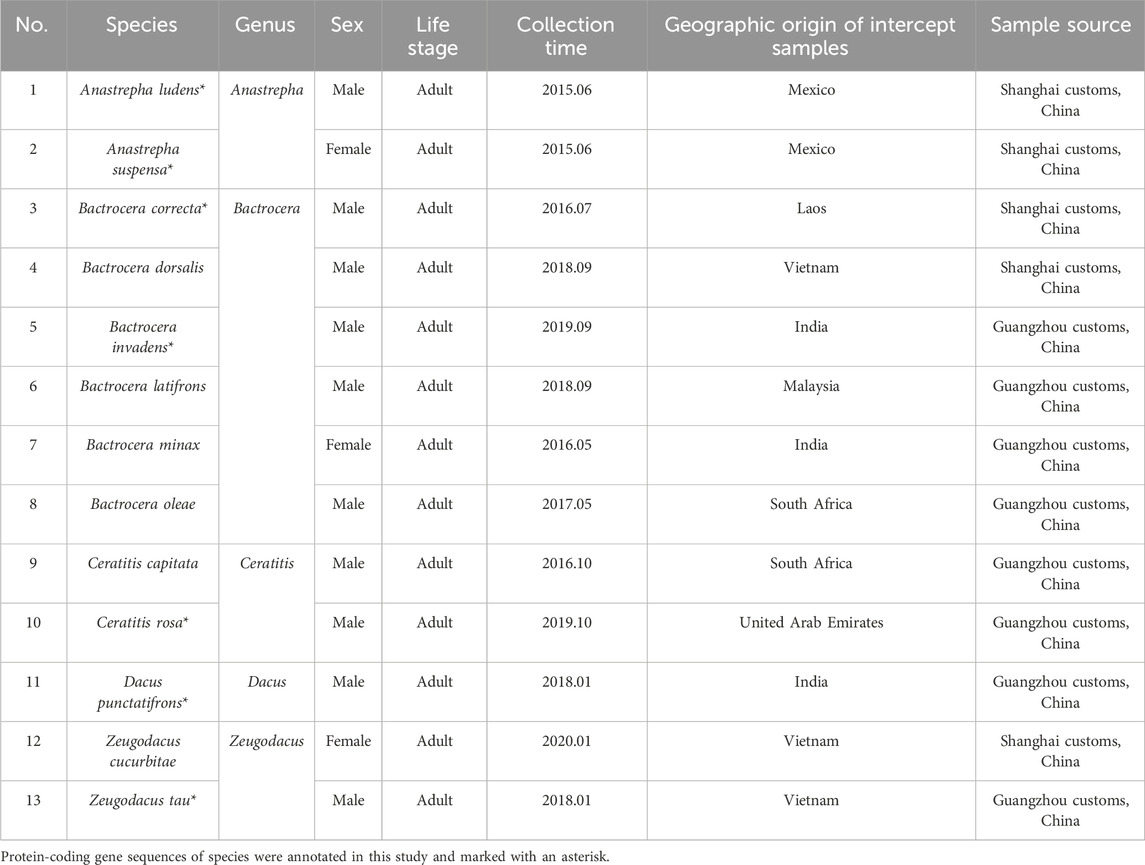
Table 2. Information on fruit flies for molecular identification.
Genomic DNA from each species was extracted using the Blood & Cell Culture DNA Midi Kit (Qiagen). The total PCR reaction volume was 20 μL, including 10 μL of PremixTaq (Takara), 1 μL each of primer (10 μM), 1 μL of DNA template, and 7 μL of ddH2O. The PCR reaction consisted of an initial denaturation step at 95°C for 3 min, followed by 35 cycles of denaturation at 94°C for 30 s, annealing at the prime specific temperature (Supplementary Table S4) for 20 s, extension at 72°C for 45 s, and a final extension step at 72°C for 5 min. PCR products were examined via 1.2% agarose gel electrophoresis.
Each true fruit fly species yielded approximately 30–50 Gb of raw reads, with a sequencing coverage ranging from 47× to 228×. The assembled genome sizes ranged from 302 Mb (Drosophila ciliates) to 1,290 Mb (Rhagoletis cerasi), with contig N50 lengths spanning from 3.72 (Ceratitis rosa) to 96.93 kb (Bactrocera tsuneonis), and the number of contigs ranging from 493,516 to 18,487 (Table 1).
BUSCO analysis showed that the gene spaces ranged from 85.2% to 99.4% (1,413–1,652 loci). Only 0.6%–14.8% (10–245 loci) were missing (Figure 1), suggesting that these genome assemblies were qualified for subsequent analysis. We used the Braker pipeline (Bruna et al., 2021) to annotate these genomes, yielding a total of 23,046–160,776 protein-coding genes for varied species (Supplementary Table S2).
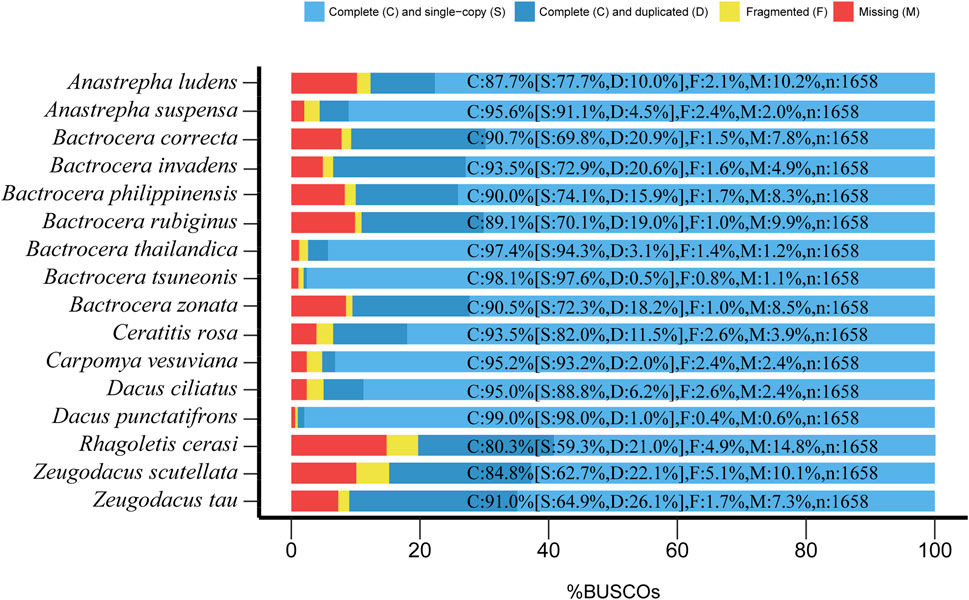
Figure 1. Assessment of genomic completeness of 16 fruit fly species in the Tephritidae family by benchmarking universal single-copy ortholog (BUSCO) analysis using the insect orthoDBv9 dataset containing 1,658 BUSCO genes. C, complete; S, complete single copy; D, complete duplicated; F, fragmented; M, missing. The results showed that 80.3%–99% (1,332–1,650) of BUSCO genes were complete, only 1%–4.9% (2–85) of BUSCO genes were fragmented, and 0.6%–14.8% (6–245) of BUSCO genes were missing, therefore validating these genome assemblies for further analysis.
We captured phylogenomic data for three loci sets, BUSCO, UCE and AHE, for phylogenetic analysis from the 27 insect genome assemblies. For UCE, in silico captured 573–1,842 loci, which ranged from 21% to 68% of the Diptera-wide UCE2.7kv1 probe set (Faircloth, 2017). For AHE, a total of 129–541 loci were extracted, ranging from 23% to 97% of the AHE probe set of Diptera (Young et al., 2016). Relatively more BUSCO loci were extracted (983–1,631), ranging from 59% to 98% of the Insecta orthodbv9 dataset (Supplementary Table S1).
The three molecular markers showed different data matrix patterns. Only a few loci were obtained with 100% presentation. 33 BUSCO loci and one AHE locus were present in all 27 species tested, while s no UCE identified locus was present in all species (Table 3). With the decreasing taxon occupancy, the number of loci in the data matrix for each molecular marker type increased. For BUSCO, an average of 31.52% parsimony informative sites (PIS) of amino acid alignments, and 43.58% PIS of nucleotide alignments were found (50%–100% taxon-occupancy matrix, 1,636–33 loci across 781,442–18,120 amino acid and 2,361,622–55,212 nucleotide sites). For AHE, an average of 36.43% PIS was found in various AHE alignments (50%–100% taxon-occupancy matrix, 135–1 locus across 140,576–1,119 nucleotide sites). For UCE, an average of 44.56% PIS was present in various UCE alignments (50%–90% taxon-occupancy matrix, with 1,327–51 loci across 1,160,133–44,860 nucleotide sites). The percentage of PIS increased as taxon-occupancy was reduced for all three markers (Table 3).
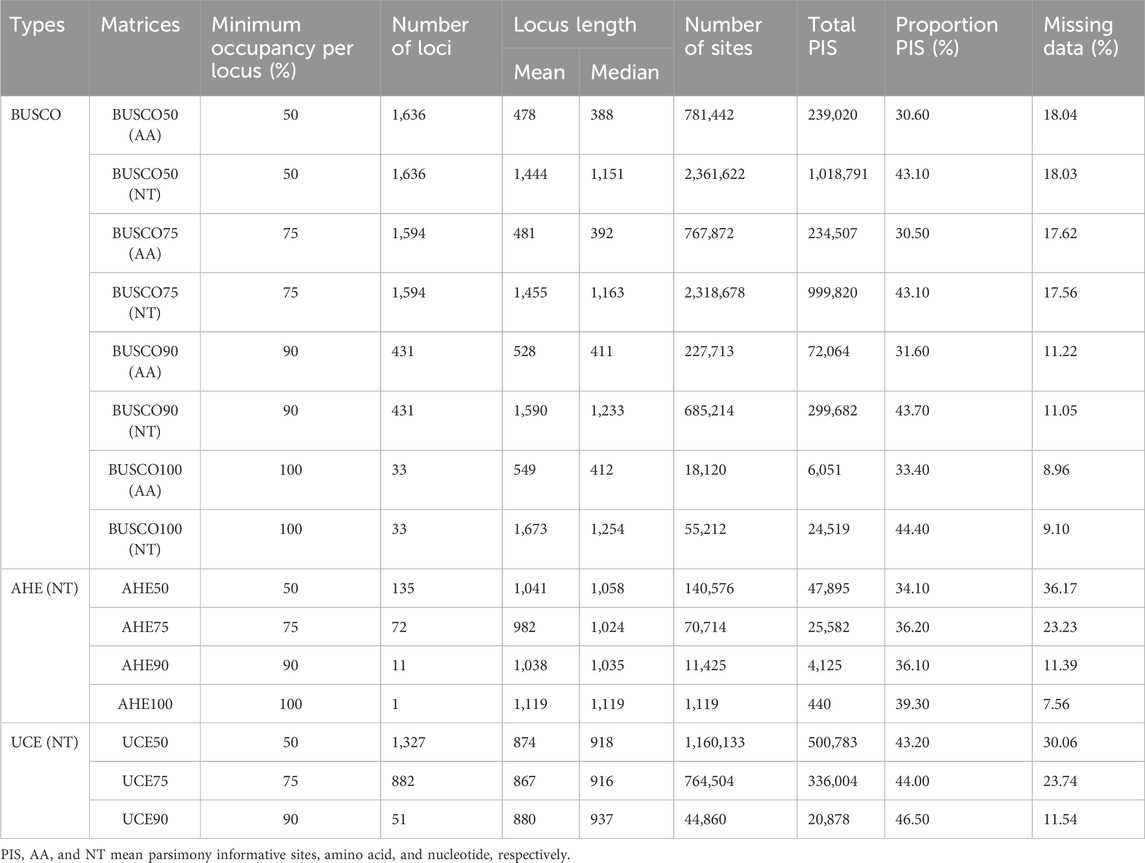
Table 3. Summary statistics of various datasets.
To construct phylogenetic trees for the Tephritidae, we conducted phylogenetic analyses using the different matrices of the three markers (BUSCO, AHE, and UCE). It has been reported that increasing taxon occupancy leads to a reduced loci number (Allio et al., 2020). Increasing the number of loci rather than taxon-occupancy tends to increase phylogenetic tree topological convergence and node support values for each type of marker (Supplementary Figures S1–S8). At 50% taxon-occupancy, the phylogenetic tree topological and node support values for the three types of molecular markers tended to be convergent, based on both concatenation and coalescent methods (Supplementary Figures S1–S8).
The phylogenetic trees inferred using these molecular markers at 50% taxon-occupancy data were generally congruent at most nodes based on both two methods. The family Tephritidae was shown as being comprised of two main clades, Dacinae and Trypetinae with high bootstrap values at the backbone nodes (Figure 2; Supplementary Figures S9–S11). The subfamily Dacinae includes four genera—Bactrocera, Zeugodacus, Dacus, and Ceratitis, and the subfamily Trypetinae contains three genera—Anastrepha, Rhagoletis, and Carpomya.
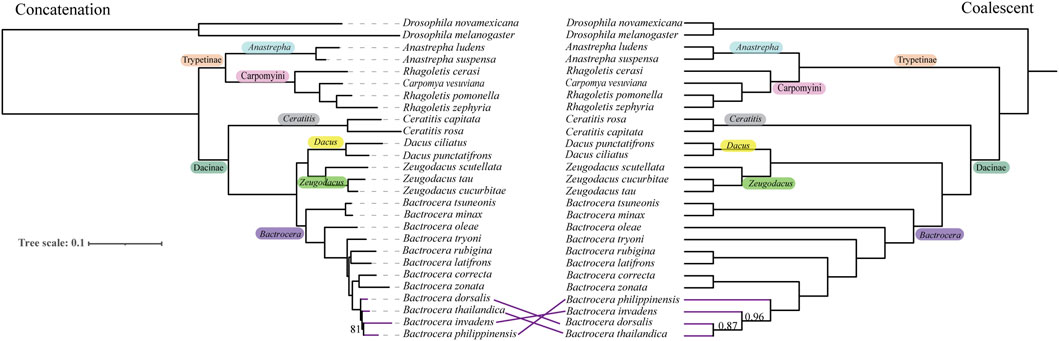
Figure 2. Species trees for fruit flies in the Tephritidae family estimated based on the BUSCO nucleotide matrix of 50% taxon-occupancy amino acid dataset. Concatenation-based RAxML species phylogenetic tree (left) and coalescent-based ASTRAL species phylogenetic tree (right) were inferred by analysis of 1,636 BUSCO loci. Branch support values denote bootstrap support and local posterior probability, respectively. Only support values smaller than 100% or 1 are shown.
In the Dacinae clade, the genus Zeugodacus is sister to the genus Dacus, forming a monophyletic group. Within the Bactrocera subclade, the subgenus Bactrocera forms a monophyletic cluster, separating from the subgenera Daculus and Tetradacus. In the Trypetinae subfamily clade, the genus Carpomya lays close to the paraphyletic cluster Rhagoletis, forming a separate subclade from Anastrepha. However, all three molecular markers were inconsistent for the B. dorsalis species complex with ML and ASTRAL analyses (Figure 2; Supplementary Figures S9–S11). The UCE dataset, however, showed a congruent topology based on two different methods (Supplementary Figure S11). Bactrocera philippinensis was distant from the other two Bactrocera complex species, and Bactrocera thailandica was the most closely related to B. dorsalis (Supplementary Figure S11). The same result was obtained from the BUSCO dataset based on ASTRAL analysis (Figure 2; Supplementary Figure S9) and the AHE dataset based on ML analysis (Supplementary Figure S10).
To compare the phylogenetic performance of the genomic markers, we used the 50% taxon-occupancy dataset for each marker type. We measured the phylogenetic informativeness (PI) of the three marker types to assess their ability to resolve evolutionary relationships at given time points. The BUSCO dataset showed surpassingly higher total PI than the UCE dataset, both of which were higher than the AHE dataset across all time scales (Figure 3A). For the PI per locus, the three types of markers displayed nearly identical PI over the past 15 Ma. However, the PI value of the BUSCO dataset then rose rapidly and showed higher than both the UCE and AHE datasets from 15 to 150 Ma. During this period, the AHE dataset showed slightly higher PI values than the UCE dataset (Figure 3B). In summary, the PI of our results indicated that the BUSCO dataset contained more robust phylogenetic signals than both UCE and AHE.
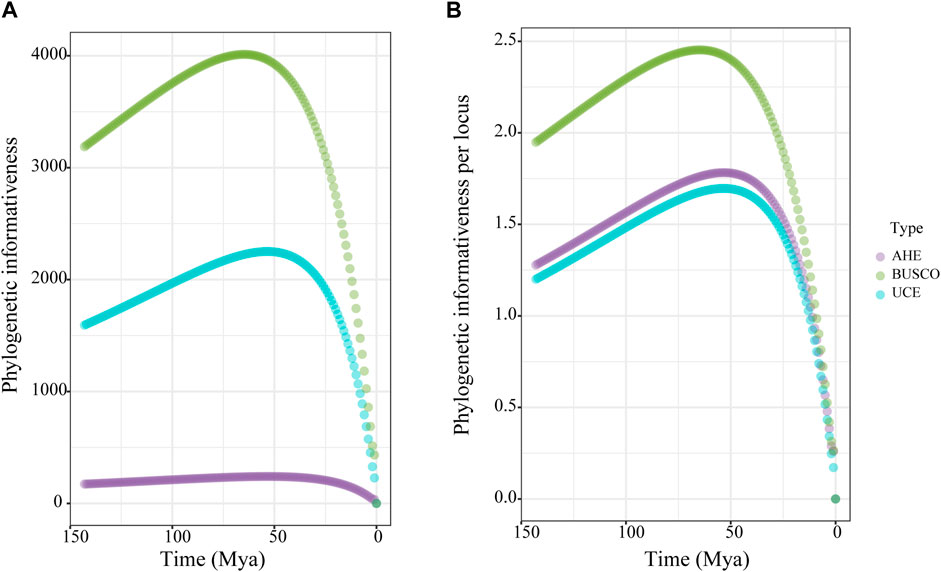
Figure 3. Phylogenetic informativeness (PI) over time for the 50% taxon-occupancy datasets of each molecular marker type. (A) total PI, (B) PI per locus. Dot means the average PI across all loci of each dataset type for each time point.
We also calculated Robinson-Foulds (RF) distances between gene trees topologies from each dataset and species tree topology. Across all marker types, an abundant degree of discordance was observed between the gene tree and species tree (Figures 4A–C). The distribution was scattered and none of the gene trees completely matched the topology of the species trees for each type of marker (Figures 4A–C). The gene trees from the BUSCO dataset, with higher average bootstraps (Figure 4D), most of which were more concentrated, showed less RF distance to the species tree compared to the gene trees from UCE and AHE (Figures 4A–C). In contrast, the gene trees from the AHE dataset were the most scattered among themselves and the species tree, showing the largest degree of difference between gene trees and the species tree (Figure 4C). Therefore, the BUSCO dataset containing more PI exhibited less gene tree heterogeneity and gene tree-species tree heterogeneity and possesses a superior potential to resolve the relationship of the studied true fruit flies.
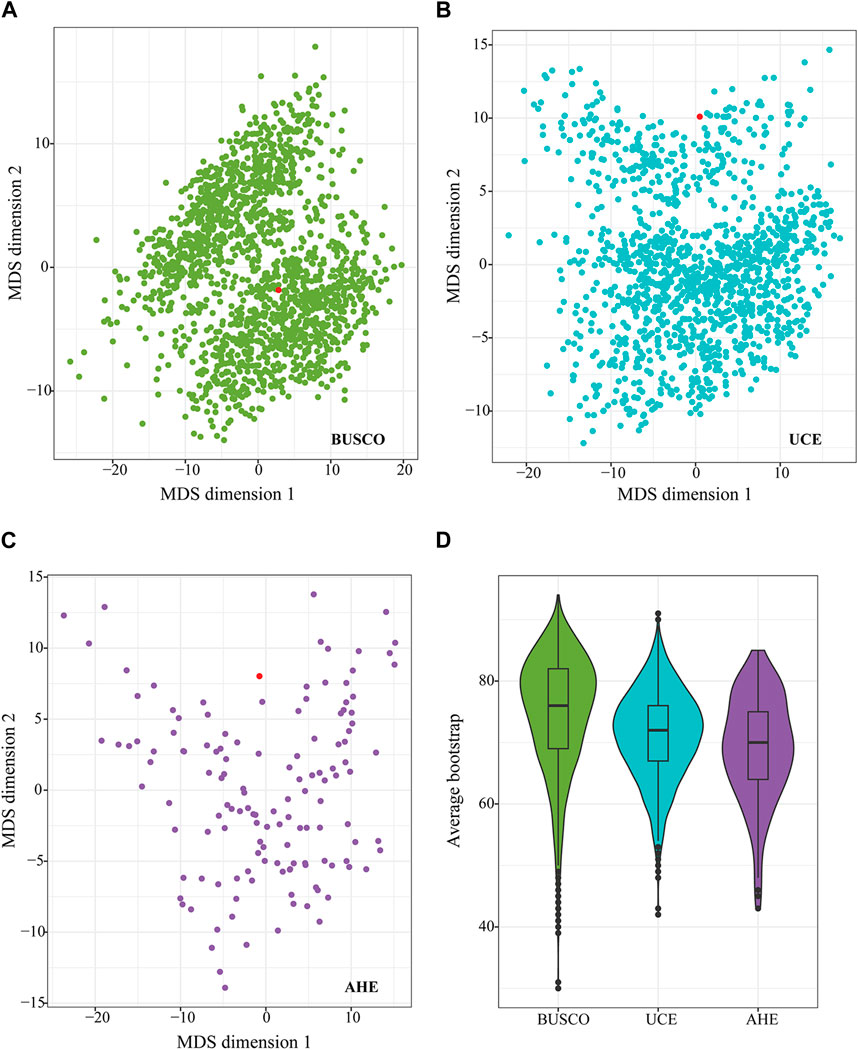
Figure 4. Multidimensional scaling of the pairwise Robinson-Foulds (RF) distance of all gene trees and species trees from BUSCO50 (NT) (A), UCE50 (B), and AHE50 (C) datasets. Each dot represents the topology of each gene tree. Distance of pairwise dots represents the RF distance between gene trees. The red dot represents a species tree inferred from the BUSCO50 (NT) dataset using the coalescent method. Average bootstrap values of individual gene trees from each dataset [BUSCO50 (NT), UCE50, and AHE50] are shown in (D).
To estimate the divergence time of the Tephritidae family, we used the datasets from UCE50, BUSCO50 (NT), and AHE50. Mean posterior time estimates of all these molecular markers yielded similar results (Figure 5A). However, on the shallower nodes, such as the generic nodes, it seemed that times estimated based on BUSCO tended to be slightly older and feature wider confidence intervals than those based on AHE and UCE, with the youngest age estimates occurring for UCE. In contrast, on the deeper nodes, the estimates from the three markers differed only marginally. This result indicated that time estimates of highly conserved loci were slightly older in the clades that underwent recent rapid radiations.
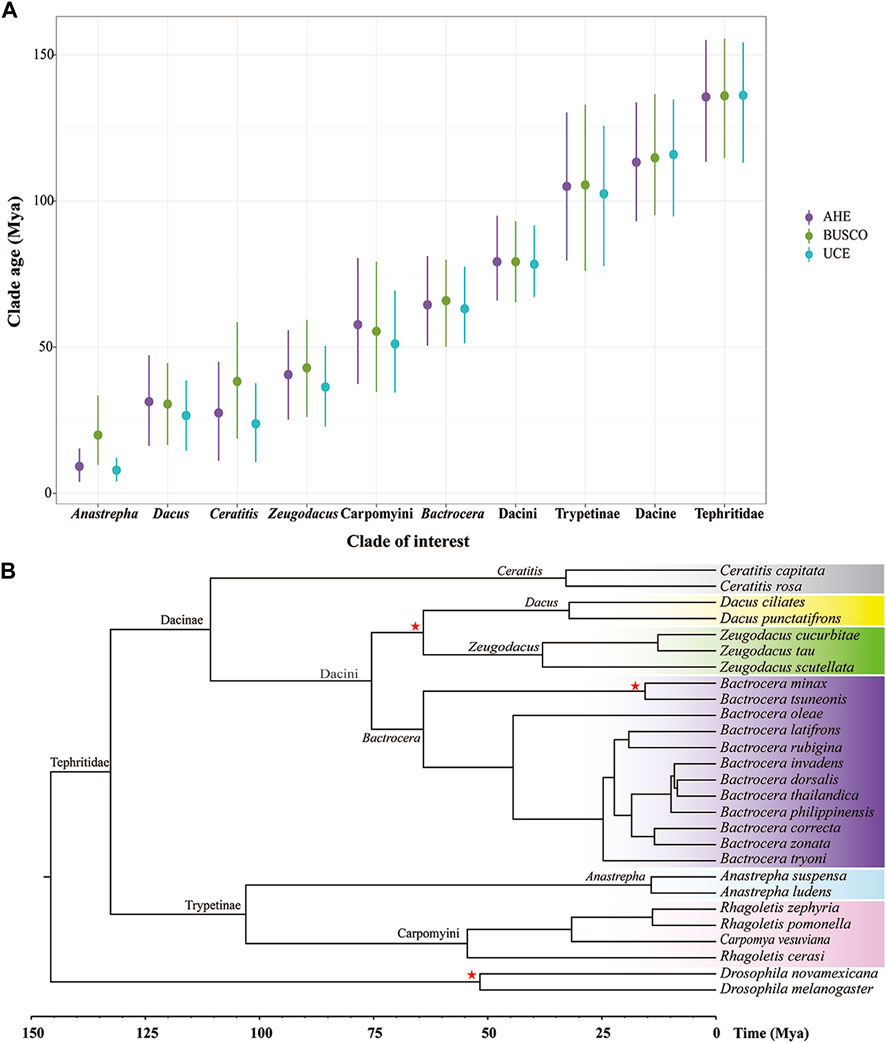
Figure 5. Divergence time of fruit flies in the Tephritidae family estimated by molecular clock analysis. (A) Divergence tree estimation of BUSCO50 (NT) dataset performed using MCMCtree. (B) Clade age at the genus level and higher level estimated using AHE50, BUSCO50 (NT), and UCE50. Points indicate mean posterior time estimates and lines mean 95% confidence intervals. Red stars: prior calibration. Colors highlight the genus or tribe in the Tephritidae family.
The MCMC Tree result showed that the crown group of fruit flies (Tephritidae) originated approximately 132.61 Mya on the deepest node, (95% CI: 108.63–153.92 Mya). The subfamilies Dacinae and Trypetinae began to diversify at 110.73 Mya (95% CI: 88.54–132.00 Mya) and 102.98 Ma (95% CI:74.85–131.63 Mya), respectively. The origin of the Dacini tribe and the clade containing Bactrocera, Zeugodacus, and Dacus occurred at 75.44 Mya (95% CI: 63.73–90.16 Mya), 64.09 Mya (95% CI: 50.17–80.59 Mya), 38.00 Mya (95% CI: 21.61–54.24 Mya), and 32.17 Mya (95% CI: 15.78–48.30 Mya), respectively. The Ceratitis originated at 32.85 Mya (95% CI: 13.18–54.14 Mya). The most recent common ancestor of the tribe Carpomyini (Carpomya + Rhagoletis) dated back to 54.47 Mya (95% CI: 32.14–77.91 Mya). The origin of Anastrepha occurred at 14.20 Mya (95% CI: 5.36–25.27 Mya) (Figure 5B).
The number of species-specific sequences predicted was 4–1,927 among the 13 fruit fly species (Supplementary Table S3). Based on these specific sequences, ten pairs of specific primers, corresponding to ten species, were verified through PCR amplification. The annealing temperature for these primers ranged from 53°C to 60°C, and the product sizes spanned from 101 bp to 184 bp (Supplementary Table S4). A single specific band was found in a total of seven species including B. dorsalis, B. latifrons, B. oleae, C. capitata, Z. cucurbitae, Zeugodacus tau and Anastrepha ludens, while no amplified fragments were found in other species (Figure 6). Though a single target band was found in Dacus punctatifrons, Bactrocera correcta and Anastrepha suspensa, false negative fragments were also amplified in non-target species, inconsistent with the expected band size (Supplementary Figure S12). Therefore, combined with the amplified fragment size and sequence information, these three species can still be reliably identified. In summary, a total of ten pairs of species-specific primers were screened, which could effectively distinguish ten species from 13 fruit fly species.
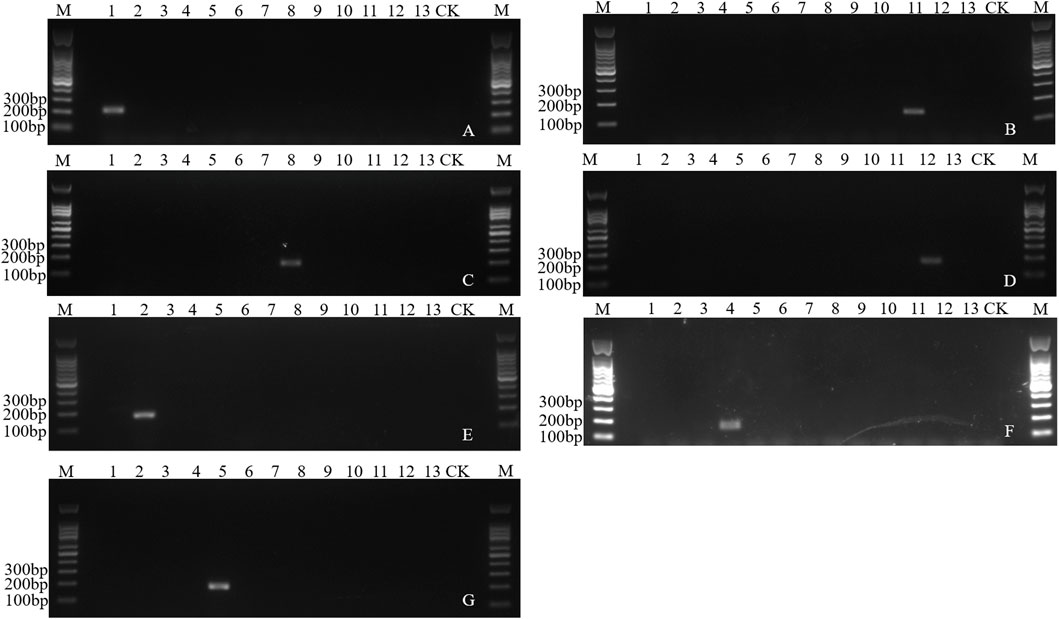
Figure 6. Electropherogram of the PCR amplification of species-specific sequence of fruit flies. (A) Specific amplification of Bdor2 in Bactrocera dorsalis. (B) Specific amplification of Blat4 in Bactrocera latifrons. (C) Specific amplification of Bole7 in Bactrocera oleae. (D) Specific amplification of Alud7 in Anastrepha ludens. (E) Specific amplification of Ztau2 in Zeugodacus tau. (F) Specific amplification of Zcuc11 in Zeugodacus cucurbitae. (G) Specific amplification of Ccap2-3 in Ceratitis capitata. M: 100 bp DNA marker. Lane 1–13: DNA templates of Bactrocera dorsalis, Zeugodacus tau, Bactrocera invadens, Zeugodacus cucurbitae, Ceratitis capitata, Bactrocera minax, Bactrocera correcta, Bactrocera oleae, Dacus punctatifrons, Anastrepha suspensa, Bactrocera latifrons, Anastrepha ludens, Ceratitis rosa. CK, blank control.
The rapidly decreasing sequencing costs have facilitated the fast accumulation of genome data of a wide range of organisms. In contrast to the transcriptome, it is feasible to obtain abundant gene resources from sub-optimal samples such as specimens with 100-year-old history stored in museums (Huynh et al., 2023). The specimens of fruit flies used in this study were intercepted by customs, and the DNA of these samples was usually severely degraded. Although the genome assemblies obtained for these true fruit flies were at the contig level, the BUSCO assessment results showed that the genome completeness of most of them was above 90% (Figure 1), suggesting that these genome assemblies, although fragmented, have a high gene space and are suitable for subsequent phylogenomic analysis.
To construct a phylogenetic tree with high confidence, we employed different types of molecular markers, namely, BUSCO, UCE and AHE, with varying gene completeness datasets. Extraction proportions for AHE and UCE genes from the genome assemblies of 25 fruit flies ranged from approximately 20%–30% and 30%–50%, respectively, while the extraction proportion for BUSCO genes was above 70% (Supplementary Table S1). However, it should be noted that many genes were absent at 100% species-occupancy for all three types of markers. For instance, UCE was lacking, and only one AHE gene was observed at 100% species occupancy (Table 3). These results suggested a species bias in UCE and AHE, which may be due to the loss of some conserved loci during the genomic evolution of true fruit flies, causing the target loci in the universal Diptera probe set not to be conserved in this rapidly diversifying group (Cohen et al., 2021). Another possible reason is that the evolutionary distances between the studied species and those used for creating probes are too far to find more conserved AHE and UCE loci (Branstetter et al., 2017). For example, the Diptera AHE probe set used in this study was initially designed for flower flies in Syrphidae (Young et al., 2016). One species used for this probe kit was D. melanogaster, so it was unexpected that its extraction proportion here was 97% (Supplementary Table S1). However, other species proportions were substantially lower (Supplementary Table S1). Thus, it is necessary to develop a lineage-specific probe set.
Although many studies have addressed the phylogenetic relationship of the Tephritidae family over the past few decades, some controversies remain. Deep level phylogenetic analysis using a limited number of mitochondrial genes, reconfirmed the monophyly of the Dacinae but did not support the non-monophyletic relationship of the Trypetinae, and showed that the tribe Carpomyni (Rhagoletis + Carpomya) clustered together with Dacinae rather than Anastrepha (Han and McPheron, 1997; Han and Ro, 2009). However, recent studies based on several genes or mitogenome showed that both the Dacinae and Trypetinae are not monophyletic. For instance, the genus Ceratitis was closer to the genus Anastrepha than to the Dacini tribe (San Jose et al., 2018; David et al., 2021; Yong et al., 2021). In contrast, other studies showed that the Anastrepha was closer to the Dacini tribe, forming a distinct cluster from the Ceratitis (Krosch et al., 2012; Zhang et al., 2019b; Song et al., 2019). However, our results based on genomic data, showed that Ceratitis clustered together with the Dacini tribe and Anastrepha clustered together with the Carpomyni tribe, supporting the monophyly of the Dacinae and Trypetinae which aligns with morphological evidence (Korneyev, 1999) (Figure 2; Supplementary Figures S9–S11).
Our results showed that the genus Zeugodacus was sister to the genus Dacus rather than Bactrocera. Morphological evidence regarded Zeugodacus as a subgenus of Bactrocera (Wang, 1996). However, Krosch et al. (2012) proposed Zeugodacus be elevated to the genus level. This was confirmed by subsequent studies using more genes or the mitochondrial genome (Virgilio et al., 2015; San Jose et al., 2018; Zhang et al., 2019b; Yong et al., 2021). Here, we confirmed previous proposals to raise Zeugodacus to genus level using whole genome data.
At the shallower levels within the subgenus Bactrocera, B. dorsalis has generally been regarded as more closely related to B. tryoni than to B. latifrons which was basal to the subgenus Bactrocera based on mitochondrial data (da Costa et al., 2019; Yong et al., 2016; Zhang et al., 2010; Zhang Y. et al., 2018). In contrast, our results showed that B. dorsalis was more closely related to B. latifrons than to B. tryoni, consistent with recent studies based mainly on nuclear data (Dupuis et al., 2018; San Jose et al., 2018; Valerio et al., 2022). Aside from the results obtained by Valerio et al. (2022), those two studies did not conclude the relationships between these three species due to incongruent results from different analysis methods (Dupuis et al., 2018; San Jose et al., 2018). Our results, based on various types of genomic scale datasets with both ML and ASTRAL analyses, supported the closer relationship between B. dorsalis and B. latifrons. For the B. dorsalis species complex, Bactrocera phillipinensis and Bactrocera invadens were previously considered junior synonyms of B. dorsalis (Schutze et al., 2015; Schutze et al., 2017). But Drew and Romig proposed the withdrawal of this result (Drew and Romig, 2016). Further evidence based on the male aedeagus showed that B. phillipinensis and B. invadens differed from B. dorsalis (Drew et al., 2022), confirming this withdrawal. Our results show that B. dorsalis is more closely related to B. thailandica than B. phillipinensis and B. invadens (Figure 2; Supplementary Figures S9–S11).
Molecular identification is not limited to the insect stage and specimen integrity, which is a simple and accurate method. DNA barcoding based on the mitochondrial cytochrome oxidase I gene (COI) (Hebert et al., 2003) has been widely used in species identification (Hajibabaei et al., 2006; Nopparat et al., 2010). However, many problems have emerged, such as the close genetic distance between species, sequence similarity, and the interference of mitochondrial pseudogenes, resulting in an inability of COI to accurately distinguish between the species of fruit flies (Liang et al., 2011; Blacket et al., 2012; Manger et al., 2018). Compared to DNA barcoding, which uses a single gene for identifying species, large numbers of potential candidate diagnostic loci were quickly obtained from whole genome assemblies in this study (Supplementary Table S3). These alternative diagnostic loci may circumvent the above-mentioned issues and provide a greater range of tools for species identification. Furthermore, the species-specific identification method used here has the advantages of speed and cost-effectiveness, unlike the tree-based COI diagnostics methods. In recent years, species-specific simple repeat sequences from the genome were successfully used for the molecular identification of four fruit fly species including C. capitata, Z. cucurbitae, B. dorsalis and B. tryoni (Ding et al., 2018). However, simple repeat sequences are usually located in non-coding regions, and there are large differences in repeat sequences between individuals of the same species (Miah et al., 2013), making it challenging to ensure their stability in amplification. The CDS used to screen species-specific sequences in this study, encode protein products and are relatively stable in PCR amplification. The PCR products are also relatively easy and stable to amplify due to their size, ranging from 100 to 200 bp (Supplementary Table S4), conducive to the repetition in molecular identification. False negative amplification has also been observed in other non-target species. Moreover, although the species-specific markers such as Bcor7, Ztau2, and Dpun6, had no hits in the NT database using BlastN, they showed some extent of similarity with bacterial proteins using BlastX. Whether these markers are reliable for effective molecular identification needs further verification. Therefore, more samples are required to verify the selected specific primers in the future. We successfully screened ten pairs of specific primers corresponding to ten species based on a broad survey of whole genome assemblies. Our results provided technical support for the quarantine inspection of invasive fruit flies while enriching the gene resources for identifying fruit flies and presenting new ideas for molecular diagnostic marker screening.
The datasets presented in this study can be found in online repositories. The names of the repository/repositories and accession number(s) can be found in the article/Supplementary Material.
The manuscript presents research on animals that do not require ethical approval for their study.
RH: Writing–original draft, Data curation, Methodology. SW: Writing–review and editing, Resources. QL: Writing–review and editing, Methodology. ZW: Writing–review and editing, Validation. YM: Writing–review and editing, Visualization. FL: Writing–review and editing.
The author(s) declare that financial support was received for the research, authorship, and/or publication of this article. This work was financially supported by the National Key Research and Development Program (2023YFC2605200 and 2022YFD1401600), National Natural Science Foundation of China (31901952 and 32102271), National Science and Technology Fundamental Resources Investigation Program of China (2019FY100400), and Zhejiang Provincial Natural Science Foundation (LY22C140005 and LY23C140002).
The authors declare that the research was conducted in the absence of any commercial or financial relationships that could be construed as a potential conflict of interest.
All claims expressed in this article are solely those of the authors and do not necessarily represent those of their affiliated organizations, or those of the publisher, the editors and the reviewers. Any product that may be evaluated in this article, or claim that may be made by its manufacturer, is not guaranteed or endorsed by the publisher.
The Supplementary Material for this article can be found online at: https://www.frontiersin.org/articles/10.3389/fgene.2024.1414074/full#supplementary-material
Allio, R., Scornavacca, C., Nabholz, B., Clamens, A. L., Sperling, F. A. H., and Condamine, F. L. (2020). Whole genome shotgun phylogenomics resolves the pattern and timing of swallowtail butterfly evolution. Syst. Biol. 69, 38–60. doi:10.1093/sysbio/syz030
Bazinet, A. L., Mitter, K. T., Davis, D. R., Van-Nieukerken, E. J., Cummings, M. P., and Mitter, C. (2017). Phylotranscriptomics resolves ancient divergences in the Lepidoptera. Syst. Entomol. 42, 305–316. doi:10.1111/syen.12217
Blacket, M. J., Semeraro, L., and Malipatil, M. B. (2012). Barcoding Queensland fruit flies (Bactrocera tryoni): impediments and improvements. Mol. Ecol. Resour. 12, 428–436. doi:10.1111/j.1755-0998.2012.03124.x
Borowiec, M. L. (2016). AMAS: a fast tool for alignment manipulation and computing of summary statistics. PeerJ 28 (4), e1660. doi:10.7717/peerj.1660
Boyd, B. M., Allen, J. M., Nguyen, N. P., Sweet, A. D., Warnow, T., Shapiro, M. D., et al. (2017). Phylogenomics using target-restricted assembly resolves intrageneric relationships of parasitic lice (Phthiraptera: columbicola). Syst. Biol. 66, 896–911. doi:10.1093/sysbio/syx027
Branstetter, M. G., Longino, J. T., Ward, P. S., and Faircloth, B. C. (2017). Enriching the ant tree of life: enhanced UCE bait set for genome-scale phylogenetics of ants and other Hymenoptera. Methods Ecol. Evol. 8, 768–776. doi:10.1111/2041-210x.12742
Breinholt, J. W., Earl, C., Lemmon, A. R., Lemmon, E. M., Xiao, L., and Kawahara, A. Y. (2018). Resolving relationships among the megadiverse butterflies and moths with a novel pipeline for anchored phylogenomics. Syst. Biol. 67, 78–93. doi:10.1093/sysbio/syx048
Bruna, T., Hoff, K. J., Lomsadze, A., Stanke, M., and Borodovsky, M. (2021). BRAKER2: automatic eukaryotic genome annotation with GeneMark-EP+ and AUGUSTUS supported by a protein database. Nar. Genom. Bioinform. 3, lqaa108. doi:10.1093/nargab/lqaa108
Cai, C. Y., Tihelka, E., Liu, X. Y., and Engel, M. S. (2023). Improved modelling of compositional heterogeneity reconciles phylogenomic conflicts among lacewings. Palaeoentomology 6 (1), 049–057. doi:10.11646/palaeoentomology.6.1.8
Capella-Gutierrez, S., Silla-Martinez, J. M., and Gabaldon, T. (2009). TrimAl: a tool for automated alignment trimming in large-scale phylogenetic analyses. Bioinformatics 25, 1972–1973. doi:10.1093/bioinformatics/btp348
Carter, J. K., Kimball, R. T., Funk, E. R., Kane, N. C., Schield, D. R., Spellman, G. M., et al. (2023). Estimating phylogenies from genomes: a beginners review of commonly used genomic data in vertebrate phylogenomics. J. Hered. 114, 1–13. doi:10.1093/jhered/esac061
Chen, S. F., Zhou, Y. Q., Chen, Y. R., and Gu, J. (2018). Fastp: an ultra-fast all-in-one FASTQ preprocessor. Bioinformatics 34, 884–890. doi:10.1093/bioinformatics/bty560
Cohen, C. M., Noble, K., Jeffrey, C. T., and Brewer, M. S. (2021). The phylogeny of robber flies (Asilidae) inferred from ultraconserved elements. Syst. Entomol. 46, 812–826. doi:10.1111/syen.12490
Congrains, C., Dupuis, J. R., Rodriguez, E. J., Norrbom, A. L., Steck, G., Sutton, B., et al. (2023). Phylogenomic analysis provides diagnostic tools for the identification of Anastrepha fraterculus (Diptera: Tephritidae) species complex. Evol. Appl. 16 (9), 1598–1618. doi:10.1111/eva.13589
Cooper, L., Bunnefeld, L., Hearn, J., Cook, J. M., Lohse, K., and Stone, G. N. (2020). Low-coverage genomic data resolve the population divergence and gene flow history of an Australian rain forest fig wasp. Mol. Ecol. 29, 3649–3666. doi:10.1111/mec.15523
da Costa, L. T., Powell, C., van Noort, S., Costa, C., Sinno, M., Caleca, V., et al. (2019). The complete mitochondrial genome of Bactrocera biguttula (Bezzi) (Diptera: Tephritidae) and phylogenetic relationships with other Dacini. Int. J. Biol. Macromol. 126, 130–140. doi:10.1016/j.ijbiomac.2018.12.186
David, K. J., Hancock, D. L., Han, H. Y., Gracy, G. R., Sachin, K., and Swathi, R. S. (2021). A new genus in the tribe Acidoxanthini (Diptera: Tephritidae: Trypetinae) from India, with a discussion of its phylogenetic relationships. J. Asia Pac. Entomol. 24, 1194–1201. doi:10.1016/j.aspen.2021.06.010
Dietrich, C. H., Allen, J. M., Lemmon, A. R., Lemmon, E. M., Takiya, D. M., Evangelista, O., et al. (2017). Anchored hybrid enrichment-based phylogenomics of leafhoppers and treehoppers (Hemiptera: cicadomorpha: Membracoidea). Insect Syst. divers. 1, 57–72. doi:10.1093/isd/ixx003
Ding, S. M., Wang, S. P., He, K., Li, F., and Jiang, M. X. (2018). PCR-based identification of fruit-flies using specific SSR sequences. Chin. J. Appl. Entomology 55, 759–765. doi:10.7679/j.issn.2095-1353.2018.092
Drew, R., A, I., and Hancock, D. L. (2022). Biogeography, speciation and taxonomy of the genus Bactrocera Macquart with application to the Bactrocera dorsalis (Hendel) complex of fruit flies (Diptera: Tephritidae: Dacinae). Zootaxa 5190 (3), 333–360. doi:10.11646/zootaxa.5190.3.2
Drew, R. A. I., and Romig, M. C. (2016) Keys to the tropical fruit flies (Tephritidae: Dacinae) of south-east asia, indomalaya to north-west australasia. Wallingford: CABI, 485.
Duchêne, D. A., Bragg, J. G., Duchêne, S., Neaves, L. E., Potter, S., Moritz, C., et al. (2018). Analysis of phylogenomic tree space resolves relationships among marsupial families. Syst. Biol. 67, 400–412. doi:10.1093/sysbio/syx076
Dupuis, J. R., Bremer, F. T., Kauwe, A., San, J. M., Leblanc, L., Rubinoff, D., et al. (2018). HiMAP: robust phylogenomics from highly multiplexed amplicon sequencing. Mol. Ecol. Resour. 18, 1000–1019. doi:10.1111/1755-0998.12783
Faircloth, B. C. (2016). PHYLUCE is a software package for the analysis of conserved genomic loci. Bioinformatics 32, 786–788. doi:10.1093/bioinformatics/btv646
Faircloth, B. C. (2017). Identifying conserved genomic elements and designing universal bait sets to enrich them. Methods Ecol. Evol. 8, 1103–1112. doi:10.1111/2041-210x.12754
Faircloth, B. C., Chang, J., and Alfaro, M. E. (2012a) “TAPIR enables high throughput analysis of phylogenetic informativeness,” in Preprint at arXiv. 1202–1215.
Faircloth, B. C., McCormack, J. E., Crawford, N. G., Harvey, M. G., Brumfield, R. T., and Glenn, T. C. (2012b). Ultraconserved elements anchor thousands of genetic markers spanning multiple evolutionary timescales. Syst. Biol. 61, 717–726. doi:10.1093/sysbio/sys004
Faircloth, B. C., Sorenson, L., Santini, F., and Alfaro, M. E. (2013). A phylogenomic perspective on the radiation of ray-finned fishes based upon targeted sequencing of ultraconserved elements (UCEs). PLoS One 8, e65923. doi:10.1371/journal.pone.0065923
Flynn, J. M., Hubley, R., Goubert, C., Rosen, J., Clark, A. G., Feschotte, C., et al. (2020). RepeatModeler2 for automated genomic discovery of transposable element families. Proc. Natl. Acad. Sci. USA. 117, 9451–9457. doi:10.1073/pnas.1921046117
Frey, J. E., Guillén, L., Frey, B., Samietz, J., Rull, J., and Aluja, M. (2013). Developing diagnostic SNP panels for the identification of true fruit flies (Diptera: Tephritidae) within the limits of COI-based species delimitation. BMC Evol. Biol. 13, 106. doi:10.1186/1471-2148-13-106
Gable, S. M., Byars, M. I., Literman, R., and Tollis, M. (2022). A genomic perspective on the evolutionary diversification of turtles. Syst. Biol. 6, 1331–1347. doi:10.1093/sysbio/syac019
Garrison, N. L., Rodriguez, J., Agnarsson, I., Coddington, J. A., Griswold, C. E., Hamilton, C. A., et al. (2016). Spider phylogenomics: untangling the spider tree of life. PeerJ 4, e1719. doi:10.7717/peerj.1719
Gomila, M., Pena, A., Mulet, M., Lalucat, J., and Garcia-Valdes, E. (2015). Phylogenomics and systematics in Pseudomonas. Front. Microbiol. 6, 214. doi:10.3389/fmicb.2015.00214
Hajibabaei, M., Janzen, D. H., Burns, J. M., Hallwachs, W., and Hebert, P. D. N. (2006). DNA barcodes distinguish species of tropical Lepidoptera. Proc. Natl. Acad. Sci. USA. 103, 968–971. doi:10.1073/pnas.0510466103
Han, H. Y., and McPheron, B. A. (1997). Molecular phylogenetic study of Tephritidae (Insecta: Diptera) using partial sequences of the mitochondrial 16S ribosomal DNA. Mol. Phylogenet. Evol. 7, 17–32. doi:10.1006/mpev.1996.0370
Han, H. Y., and Ro, K. E. (2009). Molecular phylogeny of the family Tephritidae (Insecta: Diptera): new insight from combined analysis of the mitochondrial 12S, 16S, and COII genes. Mol. Cells. 27, 55–66. doi:10.1007/s10059-009-0005-3
Hebert, P. D., Cywinska, A., Ball, S. L., and DeWaard, J. R. (2003). Biological identifications through DNA barcodes. Proc. R. Soc. B-Biological Sci. 270, 313–321. doi:10.1098/rspb.2002.2218
Homziak, N. T., Breinholt, J. W., Branham, M. A., Storer, C. G., and Kawahara, A. Y. (2019). Anchored hybrid enrichment phylogenomics resolves the backbone of erebine moths. Mol. Phylogenet. Evol. 131, 99–105. doi:10.1016/j.ympev.2018.10.038
Huang, Z., Liang, F., Xie, J., Yu, D. J., Zhang, W. Z., Lou, D. F., et al. (2017) Detection and identification of the eight species of Bactrocera Maquart. SN/T 4796-2017. Beijing: China Standards Press.
Hughes, L. C., Orti, G., Huang, Y., Sun, Y., Baldwin, C. C., Thompson, A. W., et al. (2018). Comprehensive phylogeny of ray-finned fishes (Actinopterygii) based on transcriptomic and genomic data. Proc. Natl. Acad. Sci. USA. 115, 6249–6254. doi:10.1073/pnas.1719358115
Huynh, S., Cloutier, A., and Sin, S. Y. W. (2023). Museomics and phylogenomics of lovebirds (Psittaciformes, Psittaculidae, Agapornis) using low-coverage whole-genome sequencing. Mol. Phylogenet. Evol. 185, 107822–107910. doi:10.1016/j.ympev.2023.107822
Ioannidis, P., Simao, F. A., Waterhouse, R. M., Manni, M., Seppey, M., Robertson, H. M., et al. (2017). Genomic features of the Damselfly Calopteryx splendens representing a sister clade to most insect orders. Genome Biol. Evol. 9, 415–430. doi:10.1093/gbe/evx006
Katoh, K., and Standley, D. M. (2013). MAFFT multiple sequence alignment software version 7: improvements in performance and usability. Mol. Biol. Evol. 30, 772–780. doi:10.1093/molbev/mst010
Korneyev, V. A. (1999) “Phylogenetic relationships among higher groups of Tephritidae,” in In fruit flies (Tephritidae): phylogeny and evolution of behavior. Florida: CRC Press, 73–113.
Kozlov, A. M., Darriba, D., Flouri, T., Morel, B., and Stamatakis, A. (2019). RAxML-NG: a fast, scalable and user-friendly tool for maximum likelihood phylogenetic inference. Bioinformatics 35, 4453–4455. doi:10.1093/bioinformatics/btz305
Krosch, M. N., Schutze, M. K., Armstrong, K. F., Graham, G. C., Yeates, D. K., and Clarke, A. R. (2012). A molecular phylogeny for the Tribe Dacini (Diptera: Tephritidae): systematic and biogeographic implications. Mol. Phylogenet. Evol. 64, 513–523. doi:10.1016/j.ympev.2012.05.006
Kueck, P., and Longo, G. C. (2014). FASconCAT-G: extensive functions for multiple sequence alignment preparations concerning phylogenetic studies. Front. Zool. 11, 81. doi:10.1186/s12983-014-0081-x
Kunprom, C., and Pramual, P. (2019). DNA barcoding of fruit flies (Diptera: Tephritidae) in Thailand: ambiguity, misidentification and cryptic diversity. Mitochondrial DNA Part A 8, 861–873. doi:10.1080/24701394.2019.1693550
Lanfear, R., Frandsen, P. B., Wright, A. M., Senfeld, T., and Calcott, B. (2017). PartitionFinder 2: new methods for selecting partitioned models of evolution for molecular and morphological phylogenetic analyses. Mol. Biol. Evol. 34, 772–773. doi:10.1093/molbev/msw260
Lemmon, A. R., Emme, S. A., and Lemmon, E. M. (2012). Anchored hybrid enrichment for massively high-throughput phylogenomics. Syst. Biol. 61, 727–744. doi:10.1093/sysbio/sys049
Lemmon, E. M., and Lemmon, A. R. (2013). High-throughput genomic data in systematics and phylogenetics. Annu. Rev. Ecol. Evol. 44, 99–121. doi:10.1146/annurev-ecolsys-110512-135822
Li, Y. D., Engel, M. S., Tihelka, E., and Cai, C. Y. (2023). Phylogenomics of weevils revisited: data curation and modelling compositional heterogeneity. Biol. Lett. 19 (9), 20230307. doi:10.1098/rsbl.2023.0307
Liang, L., Jiang, W., Yu, H., Jiang, F., Li, Z. H., and Yang, D. (2011). Identification of Chinese Bactrocera species through DNA barcoding (Diptera, Tephritidae). Acta Zootaxonomica Sin. 36, 925–932.
Liu, D., Niu, M., Lu, Y., Wei, J., and Zhang, H. (2022). Taxon-specific ultraconserved element probe design for phylogenetic analyses of scale insects (Hemiptera: sternorrhyncha: Coccoidea). Front. Ecol. Evol. 10, 984396. doi:10.3389/fevo.2022.984396
Lomsadze, A., Burns, P. D., and Borodovsky, M. (2014). Integration of mapped RNA-Seq reads into automatic training of eukaryotic gene finding algorithm. Nucleic Acids Res. 42, e119. doi:10.1093/nar/gku557
Lozano-Fernandez, J., Tanner, A. R., Giacomelli, M., Carton, R., Vinther, J., Edgecombe, G. D., et al. (2019). Increasing species sampling in chelicerate genomic-scale datasets provides support for monophyly of Acari and Arachnida. Nat. Commun. 10, 2295. doi:10.1038/s41467-019-10244-7
Manger, A., Behere, G. T., Firake, D. M., Sharma, B., Deshmukh, N. A., Firake, P. D., et al. (2018). Genetic characterization of Bactrocera fruit flies (Diptera: Tephritidae) from Northeastern India based on DNA barcodes. Mitochondrial DNA Part A 29, 792–799. doi:10.1080/24701394.2017.1357713
McCormack, J. E., Hird, S. M., Zellmer, A. J., Carstens, B. C., and Brumfield, R. T. (2013). Applications of next-generation sequencing to phylogeography and phylogenetics. Mol. Phylogenet. Evol. 66, 526–538. doi:10.1016/j.ympev.2011.12.007
Mei, Y., Jing, D., Tang, S. Y., Chen, X., Chen, H., Duanmu, H. N., et al. (2022). InsectBase 2.0: a comprehensive gene resource for insects. Nucleic Acids Res. 50, D1040–D1045. doi:10.1093/nar/gkab1090
Miah, G., Rafii, M. Y., Ismail, M. R., Puteh, A. B., Rahim, H. A., Islam, K. N., et al. (2013). A review of microsatellite markers and their applications in rice breeding programs to improve blast disease resistance. Int. J. Mol. Sci. 14, 22499–22528. doi:10.3390/ijms141122499
Misof, B., Liu, S. L., Meusemann, K., Peters, R. S., Donath, A., Mayer, C., et al. (2014). Phylogenomics resolves the timing and pattern of insect evolution. Science 346, 763–767. doi:10.1126/science.1257570
Munro, J. B., Heraty, J. M., Burks, R. A., Hawks, D., Mottern, J., Cruaud, A., et al. (2011). A molecular phylogeny of the Chalcidoidea (Hymenoptera). PLoS One 6, e27023. doi:10.1371/journal.pone.0027023
Nopparat, B., Li, Z. H., Wu, J. J., and Liu, J. Q. (2010). Molecular identification of fruit fly larvae from Thailand based on DNA barcoding. Plant Quar. 25, 49–52.
Oakley, T. H., Wolfe, J. M., Lindgren, A. R., and Zaharoff, A. K. (2013). Phylotranscriptomics to bring the understudied into the fold: monophyletic ostracoda, fossil placement, and pancrustacean phylogeny. Mol. Biol. Evol. 30, 215–233. doi:10.1093/molbev/mss216
Plant Health Australia (2011) The Australian handbook for the identification of fruit flies. Version1.0. Plant Health Australia. Canberra: ACT.
Rambaut, A., Drummond, A. J., Xie, D., Baele, G., and Suchard, M. A. (2018). Posterior summarization in Bayesian phylogenetics using Tracer 1.7. Syst. Biol. 67, 901–904. doi:10.1093/sysbio/syy032
Revell, L. J. (2012). Phytools: an R package for phylogenetic comparative biology (and other things). Methods Ecol. Evol. 3, 217–223. doi:10.1111/j.2041-210x.2011.00169.x
Robinson, D. F., and Foulds, L. R. (1981). Comparison of phylogenetic trees. Math. Biosci. 53, 131–147. doi:10.1016/0025-5564(81)90043-2
Roycroft, E. J., Moussalli, A., and Rowe, K. C. (2020). Phylogenomics uncovers confidence and conflict in the rapid radiation of Australo-Papuan rodents. Syst. Biol. 69, 431–444. doi:10.1093/sysbio/syz044
San Jose, M., Doorenweerd, C., Geib, S., Barr, N., Dupuis, J. R., Leblanc, L., et al. (2023). Interspecific gene flow obscures phylogenetic relationships in an important insect pest species complex. Mol. Phylogenet. Evol. 188, 107892. doi:10.1016/j.ympev.2023.107892
San Jose, M., Doorenweerd, C., Leblanc, L., Barr, N., Geib, S., and Rubinoff, D. (2018). Incongruence between molecules and morphology: a seven-gene phylogeny of Dacini fruit flies paves the way for reclassification (Diptera: Tephritidae). Mol. Phylogenet. Evol. 121, 139–149. doi:10.1016/j.ympev.2017.12.001
Schutze, M. K., Aketarawong, N., Amornsak, W., Armstrong, K. F., Augustinos, A. A., Barr, N., et al. (2015). Synonymization of key pest species within the Bactrocera dorsalis species complex (Diptera: Tephritidae): taxonomic changes basedon a review of 20 years of integrative morphological, molecular, cytogenetic, behavioural and chemoecological data. Syst. Entomol. 40, 456–471. doi:10.1111/syen.12113
Schutze, M. K., Bourtzis, K., Cameron, S. L., Clarke, A. R., De Meyer, M., Hee, A. K. W., et al. (2017). Integrative taxonomy versus taxonomic authority without peer review: the case of the oriental fruit fly, Bactrocera dorsalis (Tephritidae): integrative taxonomy versus authority. Syst. Entomol. 42 (4), 609–620. doi:10.1111/syen.12250
Shen, X. X., Zhou, X. F., Kominek, J., Kurtzman, C. P., Hittinger, C. T., and Rokas, A. (2016). Reconstructing the backbone of the Saccharomycotina yeast phylogeny using genome-scale data. G3-Genes Genomes Genet. 6, 3927–3939. doi:10.1534/g3.116.034744
Smith, P. T., McPheron, B. A., and Kambhampati, S. (2002). Phylogenetic analysis of mitochondrial DNA supports the monophyly of Dacini fruit flies (Diptera: Tephritidae). Ann. Entomol. Soc. Am. 95, 658–664. doi:10.1603/0013-8746(2002)095[0658:paomds]2.0.co;2
Song, S. L., Yong, H. S., Suana, I. W., Lim, P. E., and Eamsobhana, P. (2019). Complete mitochondrial genome of Dacus conopsoides (Insecta: Tephritidae) with tRNA gene duplication and molecular phylogeny of Dacini tribe. J. Asia Pac. Entomol. 22, 997–1003. doi:10.1016/j.aspen.2019.07.013
Stanke, M., Steinkamp, R., Waack, S., and Morgenstern, B. (2004). AUGUSTUS: a web server for gene finding in eukaryotes. Nucleic Acids Res. 32, W309–W312. doi:10.1093/nar/gkh379
Starrett, J., Derkarabetian, S., Hedin, M., Bryson, R. W., McCormack, J. E., and Faircloth, B. C. (2017). High phylogenetic utility of an ultraconserved element probe set designed for Arachnida. Mol. Ecol. Resour. 17, 812–823. doi:10.1111/1755-0998.12621
Stiller, J., Feng, S., Chowdhury, A. A., Rivas-González, I., Duchêne, D. A., Fang, Q., et al. (2024). Complexity of avian evolution revealed by family-level genomes. Nature 629, 851–860. doi:10.1038/s41586-024-07323-1
Sun, X., Ding, Y., Orr, M. C., and Zhang, F. (2020). Streamlining universal single-copy orthologue and ultraconserved element design: a case study in Collembola. Mol. Ecol. Resour. 20, 706–717. doi:10.1111/1755-0998.13146
Townsend, J. P. (2007). Profiling phylogenetic informativeness. Syst. Biol. 56, 222–231. doi:10.1080/10635150701311362
Valerio, F., Zadra, N., Rota-Stabelli, O., and Ometto, L. (2022). The impact of fast radiation on the phylogeny of Bactrocera fruit flies as revealed by multiple evolutionary models and mutation rate-calibrated clock. Insects 13, 603. doi:10.3390/insects13070603
Villanueva, R. A. M., and Chen, Z. J. (2019). ggplot2: elegant graphics for data analysis (2nd ed.). Measurement 17 (3), 160–167. doi:10.1080/15366367.2019.1565254
Virgilio, M., Jordaens, K., Verwimp, C., White, I. M., and De Meyer, M. (2015). Higher phylogeny of frugivorous flies (Diptera, Tephritidae, Dacini): localised partition conflicts and a novel generic classification. Mol. Phylogenet. Evol. 85, 171–179. doi:10.1016/j.ympev.2015.01.007
Wang, X. J. (1996). The fruit flies (Diptera: Tephritidae) of the east Asian region. Acta Zootaxonomica Sin. 21, 1–338.
Waterhouse, R. M., Seppey, M., Simao, F. A., Manni, M., Ioannidis, P., Klioutchnikov, G., et al. (2018). BUSCO applications from quality assessments to gene prediction and phylogenomics. Mol. Biol. Evol. 35, 543–548. doi:10.1093/molbev/msx319
White, I. M. (2006). Taxonomy of the dacina (Diptera: Tephritidae) of africa and the Middle East. Afr. Entomol. Mem. 2, 1–156.
Winterton, S. L., Lemmon, A. R., Gillung, J. P., Garzon, I. J., Badano, D., Bakkes, D. K., et al. (2018). Evolution of lacewings and allied orders using anchored phylogenomics (Neuroptera, Megaloptera, Raphidioptera). Syst. Entomol. 43, 330–354. doi:10.1111/syen.12278
Yang, Z. (2007). PAML 4: phylogenetic analysis by maximum likelihood. Mol. Biol. Evol. 24, 1586–1591. doi:10.1093/molbev/msm088
Yong, H. S., Chua, K. O., Song, S. L., Liew, Y. J. M., Eamsobhana, P., and Chan, K. G. (2021). Complete mitochondrial genome of Dacus vijaysegarani and phylogenetic relationships with congeners and other tephritid fruit flies (Insecta: Diptera). Mol. Biol. Rep. 48, 6047–6056. doi:10.1007/s11033-021-06608-2
Yong, H. S., Song, S. L., Lim, P. E., Eamsobhana, P., and Suana, I. W. (2016). Complete mitochondrial genome of three Bactrocera fruit Flies of Subgenus Bactrocera (Diptera: Tephritidae) and their phylogenetic implications. PLoS One 11, e0148201. doi:10.1371/journal.pone.0148201
Young, A. D., and Gillung, J. P. (2020). Phylogenomics - principles, opportunities and pitfalls of big-data phylogenetics. Syst. Entomol. 45, 225–247. doi:10.1111/syen.12406
Young, A. D., Lemmon, A. R., Skevington, J. H., Mengual, X., Stahls, G., Reemer, M., et al. (2016). Anchored enrichment dataset for true flies (order Diptera) reveals insights into the phylogeny of flower flies (family Syrphidae). BMC Evol. Biol. 16, 143. doi:10.1186/s12862-016-0714-0
Zdobnov, E. M., Tegenfeldt, F., Kuznetsov, D., Waterhouse, R. M., Simao, F. A., Ioannidis, P., et al. (2017). OrthoDB v9.1: cataloging evolutionary and functional annotations for animal, fungal, plant, archaeal, bacterial and viral orthologs. Nucleic Acids Res. 45, D744–D749. doi:10.1093/nar/gkw1119
Zhang, B., Liu, Y. H., Wu, W. X., and Wang, Z. L. (2010). Molecular phylogeny of Bactrocera species (Diptera: Tephritidae: Dacini) inferred from mitochondrial sequences of 16S rDNA and COI sequences. Fla. Entomol. 93, 369–377. doi:10.1653/024.093.0308
Zhang, C., Rabiee, M., Sayyari, E., and Mirarab, S. (2018a). ASTRAL-III: polynomial time species tree reconstruction from partially resolved gene trees. BMC Bioinforma. 19, 153. doi:10.1186/s12859-018-2129-y
Zhang, C., Zhang, T., Luebert, F., Xiang, Y., Huang, C. H., Hu, Y., et al. (2020a). Asterid phylogenomics/phylotranscriptomics uncover morphological evolutionary histories and support phylogenetic placement for numerous whole-genome duplications. Mol. Biol. Evol. 37, 3188–3210. doi:10.1093/molbev/msaa160
Zhang, F., Ding, Y., Zhu, C. D., Zhou, X., Orr, M. C., Scheu, S., et al. (2019a). Phylogenomics from low-coverage whole-genome sequencing. Methods Ecol. Evol. 10, 507–517. doi:10.1111/2041-210x.13145
Zhang, J., Lindsey, A. R. I., Peters, R. S., Heraty, J. M., Hopper, K. R., Werren, J. H., et al. (2020b). Conflicting signal in transcriptomic markers leads to a poorly resolved backbone phylogeny of chalcidoid wasps. Syst. Entomol. 45, 783–802. doi:10.1111/syen.12427
Zhang, J. X., and Lai, J. X. (2020c). Phylogenomic approaches in systematic studies. Zool. Syst. 45 (3), 151–162. doi:10.11865/zs.202021
Zhang, Y., De Meyer, M., Virgilio, M., Feng, S., Badji, K., and Li, Z. H. (2021). Phylogenomic resolution of the ceratitis FARQ complex (Diptera: Tephritidae). Mol. Phylogenet. Evol. 161, 107160. doi:10.1016/j.ympev.2021.107160
Zhang, Y., Feng, S. G., Zeng, Y. Y., Ning, H., Liu, L. J., Zhao, Z. H., et al. (2018b). The first complete mitochondrial genome of Bactrocera tsuneonis (Miyake) (Diptera: Tephritidae) by next-generation sequencing and its phylogenetic implications. Int. J. Biol. Macromol. 118, 1229–1237. doi:10.1016/j.ijbiomac.2018.06.099
Zhang, Y., Feng, S. Q., Fekrat, L., Jiang, F., Khathutshelo, M., and Li, Z. H. (2019b). The first two complete mitochondrial genome of Dacus bivittatus and Dacus ciliatus (Diptera: Tephritidae) by next-generation sequencing and implications for the higher phylogeny of Tephritidae. Int. J. Biol. Macromol. 140, 469–476. doi:10.1016/j.ijbiomac.2019.08.076
Keywords: fruit flies, whole genome, phylogenomics, molecular identification, molecular marker
Citation: He R, Wang S, Li Q, Wang Z, Mei Y and Li F (2024) Phylogenomic analysis and molecular identification of true fruit flies. Front. Genet. 15:1414074. doi: 10.3389/fgene.2024.1414074
Received: 08 April 2024; Accepted: 30 May 2024;
Published: 21 June 2024.
Edited by:
Richard John Edwards, University of Western Australia, AustraliaReviewed by:
Chenyang Cai, Chinese Academy of Sciences (CAS), ChinaCopyright © 2024 He, Wang, Li, Wang, Mei and Li. This is an open-access article distributed under the terms of the Creative Commons Attribution License (CC BY). The use, distribution or reproduction in other forums is permitted, provided the original author(s) and the copyright owner(s) are credited and that the original publication in this journal is cited, in accordance with accepted academic practice. No use, distribution or reproduction is permitted which does not comply with these terms.
*Correspondence: Shuping Wang, d2FuZ3NodXBpbmdfMjAxNEAxMjYuY29t
Disclaimer: All claims expressed in this article are solely those of the authors and do not necessarily represent those of their affiliated organizations, or those of the publisher, the editors and the reviewers. Any product that may be evaluated in this article or claim that may be made by its manufacturer is not guaranteed or endorsed by the publisher.
Research integrity at Frontiers
Learn more about the work of our research integrity team to safeguard the quality of each article we publish.