 Somayeh Barani1
 Sayed Reza Miraie Ashtiani1*
 Ardeshir Nejati Javaremi1
 Majid Khansefid2,3
 Hadi Esfandyari4
- 1Department of Animal Science, Faculty of Agriculture, College of Agriculture and Natural Resources, University of Tehran, Karaj, Iran
- 2Agriculture Victoria Research, AgriBio, Centre for AgriBioscience, Bundoora, VIC, Australia
- 3School of Applied Systems Biology, La Trobe University, Bundoora, VIC, Australia
- 4Qualitas, Zug, Switzerland
Crossbreeding is a widely adopted practice in the livestock industry, leveraging the advantages of heterosis and breed complementarity. The prediction of Crossbred Performance (CP) often relies on Purebred Performance (PB) due to limited crossbred data availability. However, the effective selection of purebred parents for enhancing CP depends on non-additive genetic effects and environmental factors. These factors are encapsulated in the genetic correlation between crossbred and purebred populations (
1 Introduction
Crossbreeding in livestock and poultry breeding is used to maximize crossbred performance (CP) through benefiting from heterosis and breed complementarity. Genetic evaluation in the crossbreeding system is usually based on phenotypes and genotypes of purebred parents, which in fact leads to the selection of the best purebred parents in the pure populations. However, the best pure parents will not necessarily produce the optimal crossbred progenies, which means the performance of purebred parents is not the best predictor for CP (Esfandyari et al., 2015). Ideally, crossbred data should be used rather than purebred data which can lead to a more significant improvement in CP; nevertheless, gathering data from commercial populations can be challenging and expensive (Wei and van der Werf, 1994). Therefore, animal breeders inevitably utilize the performance of purebred parents to predict the CP.
The genetic correlation (
Another challenge in predicting CP is the low genetic relatedness between parental breeds, despite their shared common ancestors several generations ago. Addressing these complexities is crucial for refining predictive models and advancing the accuracy of CP evaluations based on purebred data.
In recent years, single-step genomic BLUP (ssGBLUP) has significantly increased the accuracy of breeding value estimation by blending marker and pedigree information of both genotyped and ungenotyped animals (Legarra et al., 2009; Christensen and Lund, 2010). However, the main remaining challenge is how to combine pedigree-based and genomic relationships, given the base population does not have pedigree or genotype information. In the same vein, Christensen constructed the marker-based relationship matrix by assuming that all allele frequencies equal to 0.5 and base animals are related and inbred (Christensen, 2012). Subsequently, Legarra et al. (2015) proposed a comprehensive theoretical framework for incorporating relatedness within and across founders into a base relationship matrix, using the concept of metafounders (MFs). The base animals assumed to be related, so in ssGBLUP with metafounders (ssGBLUP-MF), matrix G is constructed with all allele frequencies equal to 0.5. Consequently, the founders of the breeds are related to a common ancestor, represented by the matrix Γ which describes the relationship of the founders (Legarra et al., 2015).
Motivated by the challenges inherent in predicting CP, this paper strives to pinpoint the optimal strategy for integrating data and selecting the most suitable model to maximize CP at various levels of
2 Materials and methods
2.1 Simulation
The simulation was conducted in two parts. The first part was focused on generating datasets of purebred and crossbred animals for a single trait with a heritability of 0.3 using the QMSim software (Sargolzaei and Schenkel, 2009). In the initial phase of the simulation, a historical population of 5,000 founders was simulated for 1,000 generations with a constant population size of 5,000. This step aimed to establish genetic drift and linkage disequilibrium (LD) between markers and causal variants. Subsequently, the population size was gradually reduced from 5,000 to 2000 individuals over an additional 1,500 generations. After that, the population size was considered steady during the last 500 generations. To create two breeds (breeds A and B), two random samples of 50 males and 500 females were taken from the last generation of the historical population (the first bottleneck), then the population size was expanded over the next 200 generations. Simulating various population sizes and dynamics across generations aids in comprehending the impact of genetic drift, selection, and other evolutionary forces. The initial step involved simulating linkage disequilibrium between markers and causal variants. The subsequent step consisted of simulating a gradual reduction in population size resulting from domestication and other minor bottleneck events (Brito et al., 2011). The final step entailed creating two separate breeds. In this step, to simulate the sheep breeding system, we implemented random mating with 5 descendants per dam considering 1/2 of the twining average and 4 parturitions per generation. In the next step, the second bottleneck was simulated by selecting two random samples (100 males and 1,000 females) from the last generation of the breeds A and B to generate the recent populations of the breeds (called expanding A and B). In this step, breeding values were estimated based on best liner unbiased prediction (BLUP) method. The next generations were simulated by imposing a replacement rate of 20% for dams and 50% for sires. The culling and selection designs were contingent on age and high estimated breeding value, respectively. The breeding scheme in this step was continued for 10 generations. Then crossbred animals (F1) were produced from crossing between males from expanding A and females from expanding B populations. We simulated three crossbred populations (F1) that were generated from generations 8, 9, and 10 (Figure 1).
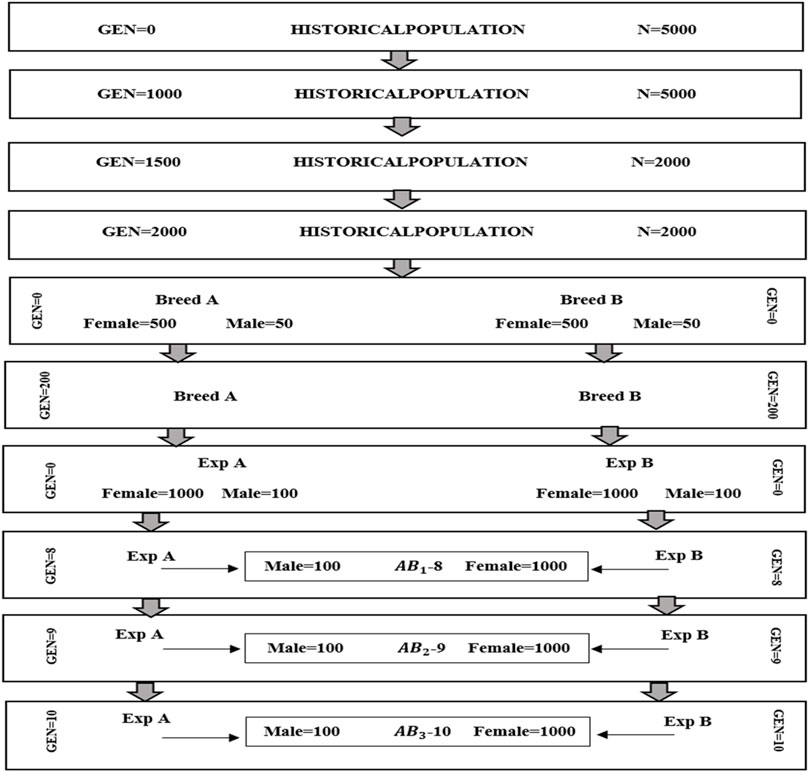
Figure 1. Schematic representation of the simulated population. A (paternal line) and B (maternal line) are purebred populations.
Genome structure was simulated with 26 autosomal chromosomes and a total length of 3,421 centimorgan (cM) similar to the sheep genome size estimated by Prieur et al. (2017). We simulated 50K single nucleotide polymorphisms (SNP) and 500 quantitative trait loci (QTLs) randomly scattered across the whole genome. Minor allele frequencies (MAF) of markers were assumed to be upper than 0.05 and mutation rates of the SNPs and QTL was
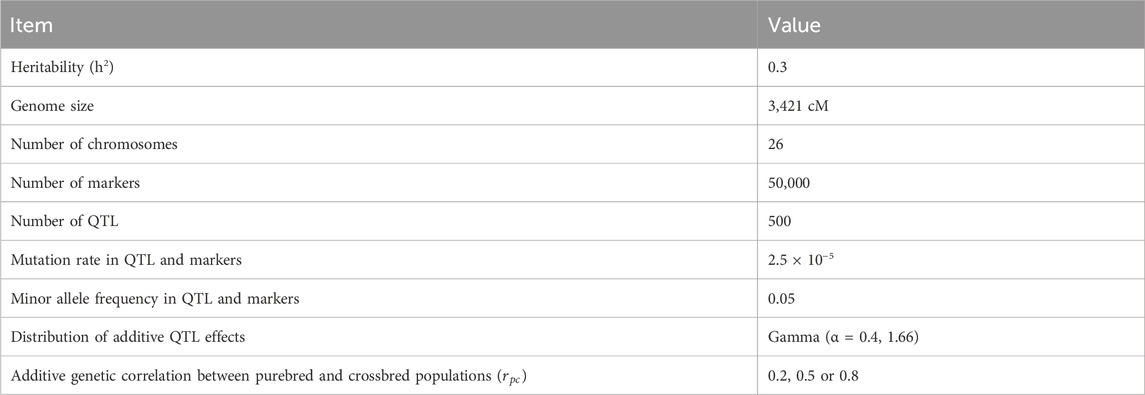
Table 1. The parameters used for simulating trait and genome.
In the second part of the simulation, to investigate the impact of
where
We conducted the population simulation 10 times and subsequently performed a comparative analysis of the predictive abilities of three methods: BLUP-UPG (BLUP with unknown parent group), ssGBLUP, and ssGBLUP-MF methods. The breeding values were estimated based on the same pedigree and data file, considering four scenarios of genotype selection from purebred and crossbred populations: SC1: breeds A, B and crossbreds, SC2: breeds A and B, SC3: breed A and SC4: breed B population.
2.2 Data analysis
Three prediction models were used to calculate breeding values: BLUP-UPG, ssGBLUP, and ssGBLUP-MF. The generation 0 produced after the second bottleneck was assumed to be the base population (i.e., only the pedigree information after generation 0 was used to predict breeding values). For the ssGBLUP and ssGBLUP-MF models, we explored various scenarios for including genotypes from both purebred and crossbred populations. The statistical model was as follows:
where
2.2.1 Best Linear Unbiased Prediction (BLUP)
In this study, we utilized various advanced statistical models for genetic prediction. Each model has its own hypotheses, advantages, and limitations. One of the models we employed is BLUP-UPG, which incorporates unknown-parent groups (UPGs) to handle missing pedigree data. Accurate group assignments and variance estimation are crucial for this model to ensure robust predictions (Henderson, 1975). In our study, we encountered unknown parents only in the first generation, while we knew the parents in all subsequent generations. The use of UPGs in this model helps estimate the genetic merit of animals in the pedigree when their parents are unknown (Graser et al., 1987). Without defining UPGs for each breed, the genetic merit of animals with unknown parents is assumed to be equal to that of the base generation, potentially leading to biased predictions.
2.2.2 Single-Step Genomic Best Linear Unbiased Prediction (ssGBLUP)
Single-step GBLUP model combines phenotypes, pedigree, and genotypes into a single evaluation and replaces the pedigree relationships between genotyped individuals with realized relationships by incorporating pedigree and genomic relationships in
where the subscript
2.2.3 Single-Step Genomic BLUP with Metafounders (ssGBLUP-MF-)
A metafounder is a pseudo-individual considered both sire and dam of all base animals. This approach extends VanRaden`s method (VanRaden, 1992) for estimating relationships across breeds (Legarra et al., 2015). To further enhance prediction accuracy in diverse populations, we incorporated metafounders in the ssGBLUP-MF model. However, this increased the complexity of the model and posed challenges in parameter estimation (Legarra et al., 2015). The significance of the metafounder is particularly important when considering both racial groups together. The use of different scenarios also arises from the limitation of measuring certain traits in crossbred groups, so it is inevitably based on the parental group. In our simulation, the founders in the base population of purebred parents were defined based on the number of pure breeds, so we had two metafounders.
In ssGBLUP,
where
2.3 Prediction ability (accuracy and dispersion) of purebred parents
The predictive ability of sires in breed A for maximizing CP was evaluated in this study using two metrics, accuracy, and dispersion. Accuracy was assessed according to Esfandyari et al. (2016), by calculating the correlation between the (genomic) estimated breeding value or (G) EBV of sires in breed A and the adjusted CP mean of their crossbred progeny for the number of progenies. The correlation is likely to be higher for sires which have more progeny, as their (G) EBVs are calculated based on performance of large number of progenies. The average accuracy of mean CP was calculated as
3 Results
3.1 Genetic connectedness between populations
The PCA scattered plot is shown in Figure 2. The first two principal components (PCs) explain 8.249% and 7.92% of the total variance, respectively. The genetic relatedness between populations before simulation of
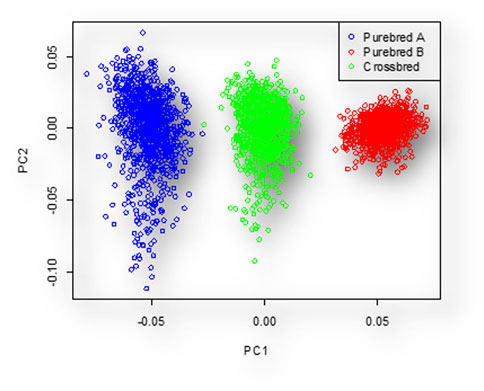
Figure 2. Individuals clustered to three distinct groups based PC1 and PC2. In this figure, the blue, red, and green colors represent the individuals of breed A, breed B, and their crosses, respectively.
3.2 Prediction ability
The prediction accuracy of the three models across scenarios is detailed in Table 2. In general, a positive correlation between prediction accuracy and
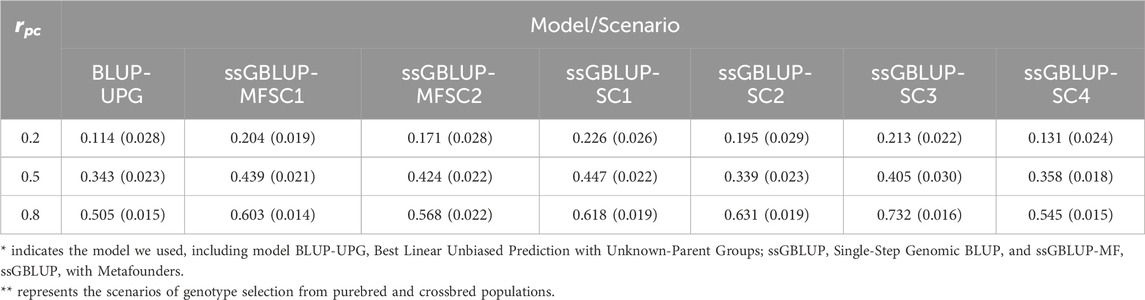
Table 2. Mean and standard deviation (in parentheses) of accuracy across 10 replicates in each scenario with different genetic correlation between crossbred and purebred populations (rpc).
Considering the first scenario encompassing genotypes (using breeds A, B, and crossbreds), ssGBLUP outperformed ssGBLUP-MF at all levels of
In Figure 3, the regression coefficient (
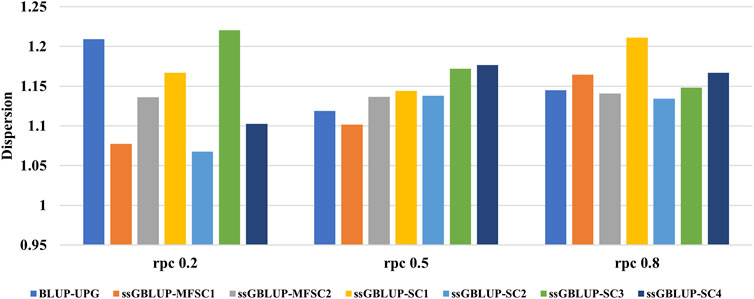
Figure 3. The regression coefficient (
4 Discussions
The genetic merit of a purebred individual can be explained as: (i) its breeding value within the purebred population, and (ii) its breeding value as a purebred parent of a crossbred progeny (Esfandyari et al., 2018). The breeding value of a purebred parent of a crossbred offspring depends on a range of non-additive genetic effects, which can be summarized in
Based on the PCA graph, we observed three distinct populations. The crossbred population was positioned between the two purebred populations. This positioning was a result of simulating interbreeding within each purebred population for 210 generations, leading to complete differentiation of the two parental lines. The results of the
The increase in
The ssGBLUP-SC3 model performed the best at the
Based on the results, ssGBLUP in the first scenario was generally more accurate than ssGBLUP-MF. Although the accuracy of ssGBLUP-MF was expected to be slightly higher than that of ssGBLUP, in our simulated population there were no missing parents, and the base populations of the two purebreds were far apart. In real data, due to considerable number of missing parents in the pedigree, we should not assume the animals with unknown parents are associated with the same base population. Otherwise, the additive variance could not be estimated properly (Mrode, 2014). Therefore, considering pseudo-parents as UPG and metafounders should generally improve the prediction accuracy.
Our results showed a slight deflation of the predicted dispersion of (G)EBV in all scenarios. The predicted dispersion in BLUP-UPG was not significantly different to the other models. This could be due to lack of simulating missing parents and use of UPG in our BLUP-UPG model. Nevertheless, ignoring missing pedigree in BLUP model has been reported to increase the dispersion compared to the genomic models (Bradford et al., 2019). Although, ssGBLUP-MF displayed the lowest dispersion among all the scenarios, incorporation of MF in genomic relationship has only a small impact on the predicted dispersion compared to alternative models. It should be noted that the impact of MF depends on the number of animals with genotypes and phenotypes which are associated with each MF (Kluska et al., 2021). A comparison between MF and UPG revealed that MF predictions had similar or lower levels of inflation and bias (Masuda et al., 2019). Furthermore, ssGBLUP-MF has been reported to be more stable (Kluska et al., 2021). The main difference between UPGs and MFs is that in MFs the relationships within and across populations are take into account to measure the covariance of gametes transmitted from base animals to their descendants (Legarra et al., 2015). However, dispersion in ssGBLUP is noticeable when the pedigree is deep and incomplete, or when inbreeding is ignored in calculation of pedigree relationships (Kluska et al., 2021). Generally, the inflation in breeding values is common when the selected candidates have different amounts of information (Neves et al., 2012). In ssGBLUP, inconsistencies arise from conflicting genomic and pedigree relationship matrices, leading to variations in predictive performance. The inclusion of metafounders (MF) in ssGBLUP-MF aims to address this issue by establishing a unified base population, thereby improving the alignment of genomic and pedigree information. However, due to the simulation process, the performance of the two methods varied across different scenarios, and neither method demonstrated superior performance in all scenarios.
5 Conclusions
This study demonstrated that at low
Data availability statement
The raw data supporting the conclusions of this article will be made available by the authors, without undue reservation.
Ethics statement
Ethical approval was not required for the study involving animals in accordance with the local legislation and institutional requirements because we used data produced through a simulation process.
Author contributions
SB: Formal Analysis, Investigation, Writing–original draft, Data curation, Methodology. SM: Conceptualization, Writing–review and editing, Supervision. AN: Conceptualization, Project administration, Writing–review and editing. MK: Formal Analysis, Methodology, Validation, Writing–original draft. HE: Conceptualization, Formal Analysis, Methodology, Validation, Writing–review and editing.
Funding
The author(s) declare that no financial support was received for the research, authorship, and/or publication of this article.
Acknowledgments
We express our sincere gratitude to Rostam Pahlavan for his invaluable contribution to all aspects of data analysis and writing of this article. Regrettably we were unable to formally mention his name in the publication, but our appreciation for his efforts is wholehearted.
Conflict of interest
Hadi Esfandyari was employed by Qualitas.
The remaining authors declare that the research was conducted in the absence of any commercial or financial relationships that could be construed as a potential conflict of interest.
Publisher’s note
All claims expressed in this article are solely those of the authors and do not necessarily represent those of their affiliated organizations, or those of the publisher, the editors and the reviewers. Any product that may be evaluated in this article, or claim that may be made by its manufacturer, is not guaranteed or endorsed by the publisher.
References
Aguilar, I., Misztal, I., Johnson, D. L., Legarra, A., Tsuruta, S., and Lawlor, T. J. (2010). Hot topic: a unified approach to utilize phenotypic, full pedigree, and genomic information for genetic evaluation of Holstein final score. J. dairy Sci. 93 (2), 743–752. doi:10.3168/jds.2009-2730
Alvarenga, A. B., Veroneze, R., Oliveira, H. R., Marques, D. B., Lopes, P. S., Silva, F. F., et al. (2020). Comparing alternative single-step GBLUP approaches and training population designs for genomic evaluation of crossbred animals. Front. Genet. 263. doi:10.3389/fgene.2020.00263
Bradford, H. L., Masuda, Y., VanRaden, P. M., Legarra, A., and Misztal, I. (2019). Modeling missing pedigree in single-step genomic BLUP. J. Dairy Sci. 102 (3), 2336–2346. doi:10.3168/jds.2018-15434
Brito, F. V., Neto, J. B., Sargolzaei, M., Cobuci, J. A., and Schenkel, F. S. (2011). Accuracy of genomic selection in simulated populations mimicking the extent of linkage disequilibrium in beef cattle. BMC Genet. 12, 80–10. doi:10.1186/1471-2156-12-80
Christensen, O. F. (2012). Compatibility of pedigree-based and marker-based relationship matrices for single-step genetic evaluation. Genet. Sel. Evol. 44, 37–10. doi:10.1186/1297-9686-44-37
Christensen, O. F., Legarra, A., Lund, M. S., and Su, G. (2015). Genetic evaluation for three-way crossbreeding. Genet. Sel. Evol. 47 (1), 98–13. doi:10.1186/s12711-015-0177-6
Christensen, O. F., and Lund, M. S. (2010). Genomic prediction when some animals are not genotyped. Genet. Sel. Evol. 42, 2–8. doi:10.1186/1297-9686-42-2
Esfandyari, H., Berg, P., and Sørensen, A. C. (2018). Balanced selection on purebred and crossbred performance increases gain in crossbreds. Genet. Sel. Evol. 50, 8–14. doi:10.1186/s12711-018-0379-9
Esfandyari, H., Bijma, P., Henryon, M., Christensen, O. F., and Sørensen, A. C. (2016). Genomic prediction of crossbred performance based on purebred Landrace and Yorkshire data using a dominance model. Genet. Sel. Evol. 48 (1), 40–49. doi:10.1186/s12711-016-0220-2
Esfandyari, H., Sørensen, A. C., and Bijma, P. (2015). A crossbred reference population can improve the response to genomic selection for crossbred performance. Genet. Sel. Evol. 47 (1), 76–12. doi:10.1186/s12711-015-0155-z
Falconer, D. S. (1996). Introduction to quantitative genetics. Harlow, Essex, United Kingdom: Longman Group Limited.
Graser, H. U., Smith, S. P., and Tier, B. (1987). A derivative-free approach for estimating variance components in animal models by restricted maximum likelihood. J. animal Sci. 64 (5), 1362–1370. doi:10.2527/jas1987.6451362x
Henderson, C. R. (1975). Best linear unbiased estimation and prediction under a selection model. Biometrics 31, 423–447. doi:10.2307/2529430
Karaman, E., Su, G., Croue, I., and Lund, M. S. (2021). Genomic prediction using a reference population of multiple pure breeds and admixed individuals. Genet. Sel. Evol. 53 (1), 46–15. doi:10.1186/s12711-021-00637-y
Kluska, S., Masuda, Y., Ferraz, J. B. S., Tsuruta, S., Eler, J. P., Baldi, F., et al. (2021). Metafounders may reduce bias in composite cattle genomic predictions. Front. Genet. 12, 678587. doi:10.3389/fgene.2021.678587
Legarra, A., Aguilar, I., and Misztal, I. (2009). A relationship matrix including full pedigree and genomic information. J. dairy Sci. 92 (9), 4656–4663. doi:10.3168/jds.2009-2061
Legarra, A., Christensen, O. F., Vitezica, Z. G., Aguilar, I., and Misztal, I. (2015). Ancestral relationships using metafounders: finite ancestral populations and across population relationships. Genetics 200 (2), 455–468. doi:10.1534/genetics.115.177014
Masuda, Y., Tsuruta, S., Nicolazzi, E., and Misztal, I. (2019). Single step GBLUP including more than 2 million genotypes with missing pedigrees for production traits in US Holstein. Interbull Meet. 22.
Misztal, I., Tsuruta, S., Lourenco, D., Aguilar, I., Legarra, A., and Vitezica, Z. (2014). Manual for BLUPF90 family of programs. Athens: University of Georgia, 199.
Mrode, R. A. (2014). Linear models for the prediction of animal breeding values. Wallingford, United Kingdom: CABI.
Nagylaki, T. (1998). Fixation indices in subdivided populations. Genetics 148 (3), 1325–1332. doi:10.1093/genetics/148.3.1325
Neves, H. H., Carvalheiro, R., and Queiroz, S. A. (2012). A comparison of statistical methods for genomic selection in a mice population. BMC Genet. 13 (1), 100–117. doi:10.1186/1471-2156-13-100
Pérez, P., and de Los Campos, G. (2014). Genome-wide regression and prediction with the BGLR statistical package. Genetics 198 (2), 483–495. doi:10.1534/genetics.114.164442
Prieur, V., Clarke, S. M., Brito, L. F., McEwan, J. C., Lee, M. A., Brauning, R., et al. (2017). Estimation of linkage disequilibrium and effective population size in New Zealand sheep using three different methods to create genetic maps. BMC Genet. 18 (1), 68–19. doi:10.1186/s12863-017-0534-2
Reich, D., Price, A. L., and Patterson, N. (2008). Principal component analysis of genetic data. Nat. Genet. 40 (5), 491–492. doi:10.1038/ng0508-491
Ripley, B., Venables, B., Bates, D., Hornik, K., Gebhardt, A., Firth, D., et al. (2013). Package “Mass”. Cran r 538, 113–120.
Sargolzaei, M., and Schenkel, F. S. (2009). QMSim: a large-scale genome simulator for livestock. Bioinformatics 25 (5), 680–681. doi:10.1093/bioinformatics/btp045
Tsuruta, S., Lourenco, D. A. L., Masuda, Y., Misztal, I., and Lawlor, T. J. (2019). Controlling bias in genomic breeding values for young genotyped bulls. J. dairy Sci. 102 (11), 9956–9970. doi:10.3168/jds.2019-16789
Van Grevenhof, I. E., and Van der Werf, J. H. (2015). Design of reference populations for genomic selection in crossbreeding programs. Genet. Sel. Evol. 47 (1), 14–19. doi:10.1186/s12711-015-0104-x
VanRaden, P. M. (1992). Accounting for inbreeding and crossbreeding in genetic evaluation of large populations. J. Dairy Sci. 75 (11), 3136–3144. doi:10.3168/jds.s0022-0302(92)78077-1
Wei, M., and van der Werf, J. H. (1994). Maximizing genetic response in crossbreds using both purebred and crossbred information. Animal Sci. 59 (3), 401–413. doi:10.1017/s0003356100007923
Wientjes, Y. C., Bijma, P., and Calus, M. P. (2020). Optimizing genomic reference populations to improve crossbred performance. Genet. Sel. Evol. 52 (1), 65–18. doi:10.1186/s12711-020-00573-3
Keywords: crossbred performance, genetic correlation between crossbred and purebred populations, unknown parent group, metafounders. ssGBLUP, SSGblup
Citation: Barani S, Miraie Ashtiani SR, Nejati Javaremi A, Khansefid M and Esfandyari H (2024) Optimizing purebred selection to improve crossbred performance. Front. Genet. 15:1384973. doi: 10.3389/fgene.2024.1384973
Received: 11 February 2024; Accepted: 29 August 2024;
Published: 24 September 2024.
Edited by:
Lingyang Xu, Institute of Animal Sciences, ChinaReviewed by:
Sabyasachi Mukherjee, Indian Council of Agricultural Research (ICAR), IndiaMohammad Hossein Banabazi, Swedish University of Agricultural Sciences, Sweden
Copyright © 2024 Barani, Miraie Ashtiani, Nejati Javaremi, Khansefid and Esfandyari. This is an open-access article distributed under the terms of the Creative Commons Attribution License (CC BY). The use, distribution or reproduction in other forums is permitted, provided the original author(s) and the copyright owner(s) are credited and that the original publication in this journal is cited, in accordance with accepted academic practice. No use, distribution or reproduction is permitted which does not comply with these terms.
*Correspondence: Sayed Reza Miraie Ashtiani, YXNodGlhbmlAdXQuYWMuaXI=