- 1College of Horticulture and Landscape Architecture, Jinling Institute of Technology, Nanjing, China
- 2College of Horticulture, Nanjing Agricultural University, Nanjing, China
- 3College of Medicine, Southeast University, Nanjing, China
Lagerstroemia indica is an important commercial tree known for the ornamental value. In this study, the complete chloroplast genome sequence of Lagerstroemia indica “Pink Velour” (Lagerstroemia “Pink Velour”) was 152,174 bp in length with a GC content of 39.50%. It contained 85 protein coding genes (PCGs), 37 tRNAs, and 8 rRNA genes. 207 simple sequence repeats (SSRs) and 31 codons with relative synonymous codon (RSCU)value > 1 were detected. Phylogenetic analysis divided 10 Lagerstroemia species into evolutionary branches of clade A and clade B. We conducted a comparative analysis of Lagerstroemia “Pink Velours” complete chloroplast genome with the genomes of six closely related Lagerstroemia species from different origins. The structural features of all seven species were similar, except for the deletion of ycf1 nucleobases at the JSA boundary. The large single-copy (LSC) and the small single-copy (SSC) had a higher sequence divergence than the IR region, and 8 genes that were highly divergent (trnK-UUU, petN, psbF, psbJ, ndhE, ndhD, ndhI, ycf1) had been identified and could be used as molecular markers in future studies. High nucleotide diversity was present in genes belonging to the photosynthesis category. Mutation of single nucleic acid was mainly influenced by codon usage. The value percentage of nonsynonymous substitutions (Ka) and synonymous substitutions (Ks) in 6 Lagerstroemia species revealed that more photosynthesis genes have Ka or Ks only in Lagerstroemia fauriei, Lagerstroemia limii, and Lagerstroemia subcostata. These advances will facilitate the breeding of closely related Lagerstroemia species and deepen understanding on climatic adaptation of Lagerstroemia plants.
1 Introduction
The ornamental plant Lagerstroemia indica (crape myrtle), belonging to Lagerstroemia of Lythraceae, is a perennial deciduous tree (Li and Liang, 2021). Lagerstroemia indica, native to the southeastern part of Asia, is a famous flowering tree that is widely cultivated in landscapes (Wang et al., 2011). Apart from its ornamental value, L. indica also possesses air-purifying properties, effectively absorbing smoke and dust particles (Guo et al., 2023). Additionally, certain species of L. indica hold commercial significance due to their wood and medicinal properties (Xu et al., 2017; Zheng et al., 2020). Previous research on L. indica mainly covered propagation and breeding (Wang et al., 2021; Huang et al., 2022; Jiang et al., 2023). The propagation of L. indica typically involves the use of true-seedling derived from seed, cutting, and tissue culture (Wang et al., 2021; Huang et al., 2022; Jiang et al., 2023). However, the differentiation of offspring traits among true-seedlings can often be significant. Cutting and tissue culture are rapid and economical propagation methods that stably maintain the characteristics of the plant (Pérez-Molphe-Balch et al., 2015). Research on cutting and tissue culture primarily focuses on the type and concentration of hormones, growth media, and the degree of lignification of branches (Huang et al., 2022). In the process of breeding, the source of parents and the distance of genetic relationships cannot be distinguished, which necessitates much follow-up work because of variability in bred offspring. Deeper molecular identification can solve the above problems (Feng et al., 2018). Although previous studies have reported the assembly of the chloroplast genome, chloroplast genome characteristics, and phylogenetic analysis of L. indica, the specific evolutionary mechanisms of this species remain largely unexplored (Xu, et al., 2017; Zheng, et al., 2020; Wang, et al., 2023).
A set of genes related to photosynthesis, energy metabolism, protein synthesis, and nitrogen and sulphur assimilation were identified in plant chloroplasts, with characteristics of conservative and maternal inheritance (Pogson et al., 2015). Chloroplast genomes in angiosperms exhibit a conserved circular structure comprising four regions: a large single-copy (LSC) region, two inverted repeats (IRA/IRB), and a small single-copy (SSC) region (Asaf et al., 2017). Chloroplast genomes have played a crucial role in elucidating evolutionary relationships within phylogenetic clades and uncovering substantial variation in sequence and structure among plant species (Daniell et al., 2016). In recent years, the rapid advancements in chloroplast genome sequencing research have opened up new avenues for investigating molecular identification, genetic relationships, and phylogenetic evolution in ornamental plants. Significant progress has been made in obtaining complete chloroplast genome sequences for various woody flowering plants, including Rosa (Gao et al., 2023), Prunus (Abdulrahman et al., 2023), and Paeonia (Wu et al., 2020). In this study, we present the complete chloroplast genome of the cultivar Lagerstroemia “Pink Velour” and perform comparative chloroplast genome analyses using six previously published Lagerstroemia species obtained from the National Center for Biotechnology Information (NCBI) organelle genome database (https://www.ncbi.nlm.nih.gov). Selection may be driving the promotion of amino acid diversity in certain genes, thereby enabling rapid adaptation to environmental changes, such as varying light intensity levels (Gao et al., 2019). Photosynthetic plants commonly exhibit a pattern of slow evolutionary rates for photosynthesis genes, including psbN, psbI, psaC, atpH, petD, psbD, and psbM. In contrast, genes involved in replication (rpl2, rpl20, and rpl23), photosynthesis (rbcL and psbJ), genes with unknown functions such as ycf4, and other genes like ccsA evolved more rapidly, resulting in higher Ka/Ks values (Gu et al., 2019; Zheng et al., 2020; Wang et al., 2023). Our analyses encompass chloroplast genome organization, identification of simple sequence repeats (SSRs), codon usage, phylogenetic relationships, patterns of nucleotide substitutions, and the evolution of photosynthesis genes. This study will facilitate the breeding of closely related Lagerstroemia species by enabling valuable gene identification and especially by deepening our understanding of genetic and evolutionary significance, which provides information on climatic adaptation in important ornamental plants.
2 Materials and methods
2.1 Plant materials
For this study, fresh young leaves were carefully collected from three one-year-old L. indica “Pink Velour” plants derived from cutting seedlings at Jingling Institute of Technology (Nanjing, China). To preserve the genetic material, the collected samples underwent thorough washing and were promptly frozen in liquid nitrogen until DNA extraction. Chloroplast genomes of six distinct Lagerstroemia species were acquired from the NCBI organelle genome database (https://www.ncbi.nlm.nih.gov) to serve as comparative references.
2.2 DNA extraction and sequencing
Chloroplast genomic DNA extraction of L. indica “Pink Velour” was conducted using a kit designed for plant chloroplast genomic DNA isolation, which was obtained from Beijing Kangwei Century Company (CwBio, Beijing, China). Assessment of DNA quality involved agarose gel electrophoresis and a NanoDrop-2000 micro-spectrophotometer (Thermo Fisher, America). Following the qualification of the samples, a sequencing library featuring an insertion fragment size of 350 bp was constructed. Short paired-end libraries were prepared, and Nanjing Jisi Huiyuan Biotechnology Co. (Nanjing, China) executed the sequencing on the Illumina NovaSeq 6,000 platform, with a read length of 150 bp. Filtering of low-quality raw data (raw reads) was accomplished using Fastp v0.20.0 (https://github.com/OpenGene/fastp) software, which involved truncating adaptors and primer sequences in reads, and removing low-quality reads (Qphred≤5).
2.3 Chloroplast genome assembly and annotation
For de novo assembly (Bankevich et al., 2012), SPAdes v3.10.1 software (http://cab.spbu.ru/software/spades/) was employed with default parameters. Prodigal v2.6.3 (https://www.github.com/hyattpd/Prodigal) facilitated the annotation of protein-coding genes (Hyatt et al., 2010), while HMMER v3.1b2 (http://www.hmmer.org/) and Aragorn v1.2.38 (http://www.ansikte.se/ARAGORN/) were utilized for annotating RNAs and tRNAs in the chloroplast genomes of the six species (Xie et al., 2021). Secondly, based on the closely related species already published on NCBI, their gene sequences were extracted. Then, blast v2.6 (https://blast.ncbi.nlm.nih.gov/Blast.cgi) was used to align the assembled sequences, resulting in the second annotation result. Manual inspection of the genes with differences between the two annotation results was then conducted to remove incorrect and redundant annotations, and determine the boundaries of multiple exons, thereby obtaining the final annotation. Subsequently, OGDRAW (https://chlorobox.mpimp-golm.mpg.de/OGDraw.html) software was employed to generate physical maps of the chloroplast genomes (Lohse et al., 2007).
2.4 Codon usage
Relative synonymous codon usage (RSCU) data were acquired using the DAMBE v6.04 software platform (Cauz-Santos et al., 2017). The measure of RSCU, defined as the ratio of the frequency of a particular codon to the expected frequency of that codon, was utilized (Sharp and Li, 1987). A value exceeding 1 indicates that a codon is utilized more frequently than anticipated, while a value below 1 signifies less frequent usage than expected. This approach provides insights into the codon usage patterns within the chloroplast genomes under investigation.
2.5 Simple sequence repeat (SSR) analysis
Chloroplast SSRs in the chloroplast genome sequences of Lagerstroemia “Pink Velour” were identified using the MISA software (Liu et al., 2018). The criteria for minimum numbers of repeats were set as follows: the repeats included mono-, di-, tri-, tetra-, penta-, and hexanucleotides with a minimum of 10, 5, 4, 3, 3, and three repeats, respectively.
2.6 Evolutionary and phylogenetic analyses
Phylogenetic relationships among Lagerstroemia species closely related to L. indica were analyzed based on the complete chloroplast genomes of 26 Lythraceae species, including 23 Lagerstroemia species. Sequences were aligned using MAFFT (Katoh, 2005). For maximum likelihood analysis, the GTRGAMMA model was used for all datasets, and self-expanding analyses were conducted with 1,000 repetitions (Stamatakis et al., 2008). This study aims to elucidate the evolutionary mechanisms underlying the closely related species of L. indica. The seven tested varieties of Lagerstroemia species exhibit close genetic affinities yet display distinct phenotypic traits (www.iplant.cn) (Pooler, 2003; Choi et al., 2010). The seven varieties possess rich genetic diversity, making them ideal candidates for further molecular analysis to investigate the evolutionary mechanisms among Lagerstroemia relatives.
2.7 Chloroplast genome comparison and IR border and divergence analyses
The chloroplast genomes of seven Lagerstroemia species were aligned using mVISTA with the LAGAN alignment program (Brudno et al., 2003). Lagerstroemia “Pink Velour” served as the reference sequence. The chloroplast genomes of the six remaining species were obtained from the NCBI based on homologous alignment (L. indica PP404026, Lagerstroemia caudata NC_060355, Lagerstroemia excelsa NC_042896, Lagerstroemia fauriei MT019854, Lagerstroemia limii NC_042889, Lagerstroemia subcostata NC_034952, Lagerstroemia suprareticulata NC_071782). The boundaries of LSC-IRb, IRb-SSC, and SSC-IRa in the chloroplast genomes were compared and visualized using the online platform CPJSdraw (http://cloud.genepioneer.com:9929/#/tool/alltool/detail/296) (Shi et al., 2023). To identify mutation hotspot regions and genes, the complete chloroplast genome sequences of the seven Lagerstroemia species were aligned using the MAFFT tool (Katoh and Standley, 2013). Nucleotide diversity (Pi) values for highly variable regions were calculated by DnaSP5 (http://www.ub.edu/dnasp/) (Kang et al., 2019). DNAMAN software was utilized for nucleic acid sequence alignment. DnaSP 5.1 (Librado and Rozas, 2009; Guo et al., 2016) was employed to calculate nonsynonymous substitutions (Ka), synonymous substitutions (Ks), and their ratio (Ka/Ks). The Ka/Ks value cannot be calculated if Ks = 0.
3 Results
3.1 Assembly of the chloroplast genome with a length of 162,174 base pairs in Lagerstroemia “Pink Velour”
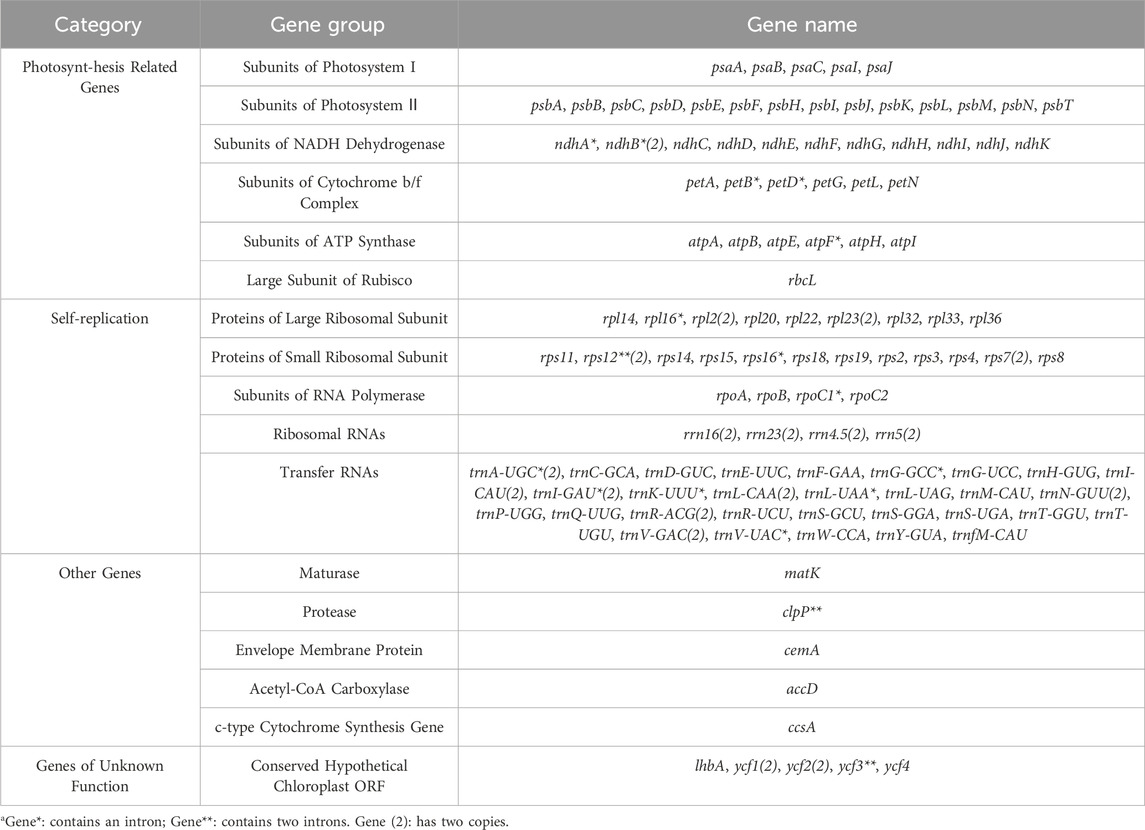
The Lagerstroemia “Pink Velour” chloroplast genome, spanning 152,174 bp, displays a classical cyclic double-stranded four-region structure. This structure encompasses a pair of inverted repeats (IRs, 51,250 bp), a large single-copy region (LSC, 84,006 bp), and a small single-copy region (SSC, 16,918 bp). The GC content across these regions was observed to be 39.50% (Supplementary Table S1). Comprising a total of 130 chloroplast RNAs, the genome includes 85 protein-coding genes, 37 tRNA genes, and 8 rRNA genes. These annotated genes fall into four categories, namely, genes associated with photosynthesis, self-replication, other known functions, and genes with unknown functions (Figure 1; Table 1). Notably, 18 of these genes were present in duplicate within the IR regions, encompassing 5 protein-coding genes (rps7, rps12, ndhB, rpl2, and rpl23), seven tRNA genes (trnN-GUU, trnA-UGC, trnV-GAC, trnL-CAA, trnI-CAU, trnI-GAU, and trnR-ACG), 4 rRNA genes (rrn4.5, rrn5, rrn16, and rrn23), and two conserved hypothetical chloroplast ORF genes (ycf1 and ycf2). In total, 17 genes (petB, petD, ndhA, ndhB, atpF, rpl16, rps12, rps16, rpoC1, trnA-UGC, trnG-GCC, trnI-GAU, trnK-UUU, trnL-UAA, trnV-UAC, clpP, and ycf3) with 1 or two introns were identified (Table 1). Among these intron-containing genes, 13 (petB, petD, atpF, rpl16, trnG-GCC, trnK-UUU, trnL-UAA, trnV, UAC, rps16, rpoC1, rps12, clpP, and ycf3) were located in the LSC region, one (ndhA) in the SSC region, and three (ndhB, trnA-UGC, and trnI-GAU) in both IR regions. Noteworthy is the positioning of the matK gene within the intron of trnK-UUU (Figure 1). The full names of genes in the artical were listed in Supplementary Table S2.
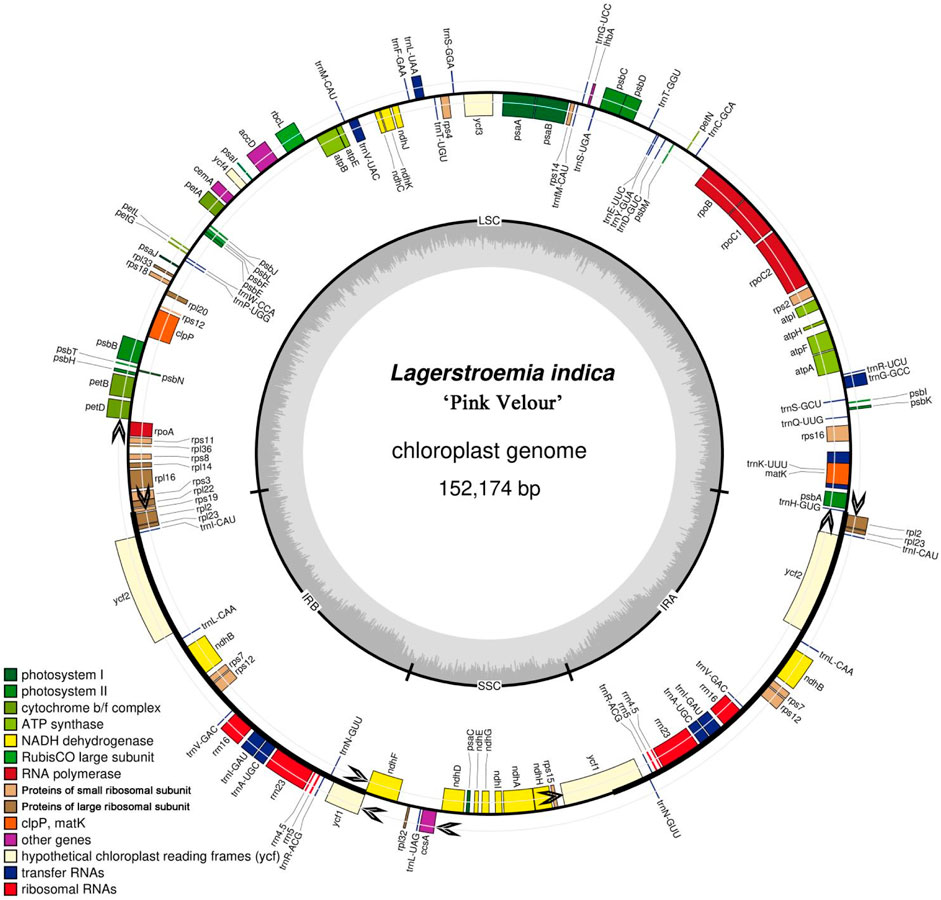
Figure 1. Gene map of the Lagerstroemia “Pink Velour” chloroplast genome. The gene map provides a comprehensive overview of the complete chloroplast genome of Lagerstroemia “Pink Velour”. In chloroplast genome, the black arrows represent the transcriptional direction. Genes outside the black circle are transcribed clockwise, while those inside are transcribed counterclockwise. The inner black circle denotes the boundaries of the LSC, SSC, IRa and IRb regions. The inner circle’s dark grey shading indicates the GC content, while the light grey represents the AT content. On the outer circle, distinct blocks of various colors symbolize different functional groups of genes.
3.2 The most abundant SSR type: T or A base repeats
A total of 207 simple sequence repeats (SSRs) were identified within the Lagerstroemia “Pink Velour” chloroplast genome (Supplementary Table S3; Figure 2). The predominant SSR type was single nucleotide repeats, constituting the majority at 63.28%. Trinucleotide repeats (29.95%), 4-nucleotide repeats (3.38%) and 2-nucleotide repeats (2.41%) were the next most abundant SSR types, while 5-nucleotide repeats were the least abundant (0.96%). Within the mononucleotide repeats, A/T repeats emerged as the most prevalent type, with repeat numbers ranging from 8 to 12 in this investigation. The most abundant SSR type in seven Lagerstroemia species is TTTTTTTT (T8). The second most abundant SSR type is AAAAAAAA (A8).
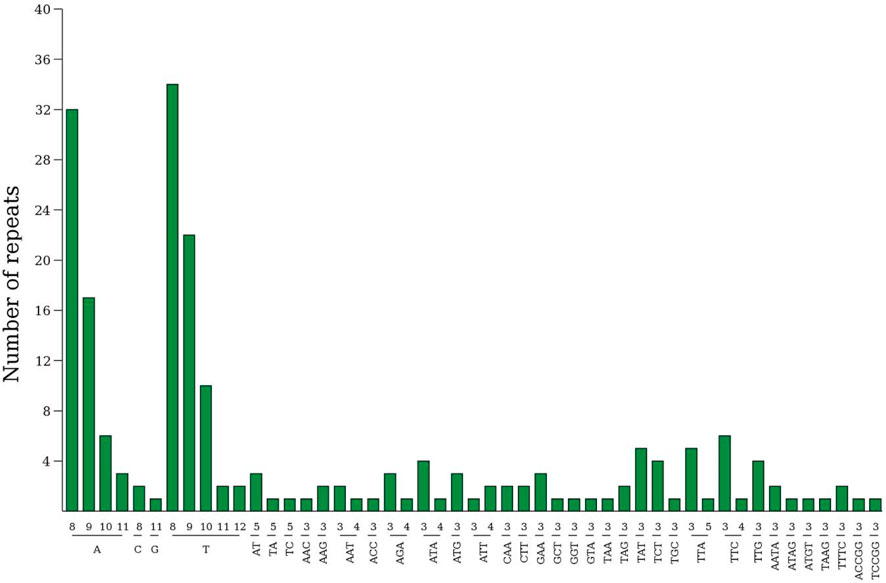
Figure 2. Analysis of simple sequence repeats (SSRs) in Lagerstroemia “Pink Velour”. The horizontal axis illustrates the length of the repeats and the corresponding repeated sequences, while the vertical axis quantifies the number of repeats for each identified category. The numbers on the x-axis represent the number of base repeats.
3.3 Preference for AT base termination in codon pairs
The relative synonymous codon usage (RSCU) of the chloroplast genome of Lagerstroemia “Pink Velour” was conducted using all protein-coding genes, encompassing a total of 27,041 codons (Figure 3; Supplementary Table S4). Leucine (Leu), encoded by CTA, CTC, CTG, CTT, TTA, and TTG, emerged as the most abundant amino acid, constituting 10.60% (2,865 codons) of the total codons. Isoleucine (Ile), encoded by ATA, ATC, and ATT, ranked as the second most abundant amino acid, representing 8.56% (2,316 codons). Conversely, Termination (Ter), encoded by TAA, TGA, and TAG, was the least frequently encoded amino acid, accounting for a mere 0.31% (85 codons) of the total. RSCU, mitigating the impact of amino acid composition on codon usage effectively, revealed that a majority of codons with RSCU values greater than 1 concluded with A or T. A total of 31 codons exhibited RSCU values exceeding 1, with the highest value observed for ATG at 6.97. And Methionine (Met) encoded by the codons ATG (631), ATT (1) and GTG (1), and comprises 2.34% of the total codon population. The attachment Supplementary Table S4 shows the counts and frequencies of usage for all codons.
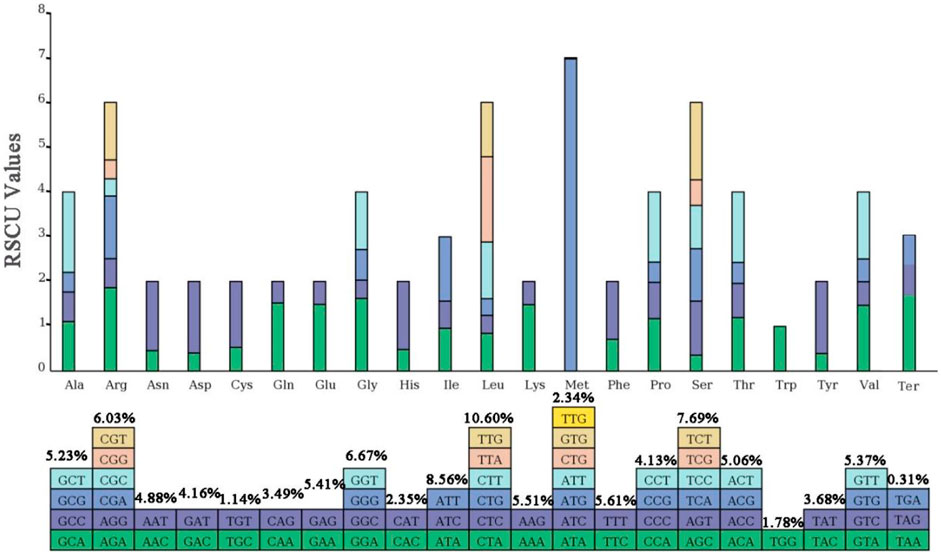
Figure 3. RSCU analysis of Lagerstroemia “Pink Velour”. Each square corresponds to all codons encoding a specific amino acid. The height of the upper column indicates the sum of RSCU values for all codons associated with that amino acid. The number above the codons represent the frequency of use of all codons corresponding to this amino acid.
3.4 Phylogenetic analysis involving 26 Lythraceae related species
Utilizing the chloroplast genome, we conducted a phylogenetic analysis involving 26 related species. The objective was to elucidate the phylogenetic relationships existing among the examined species and their proximate relatives. Additionally, we sought to ascertain their systematic positions within the Lythraceae family (Figure 4A). The results showed that the newly obtained sequence of Lagerstroemia “Pink Velour” clustered with L. indica (NC-030484) and L. indica (KF572028) and differentiated earlier than these two L. indica samples. In addition, the phylogenetic tree constructed based on the chloroplast genome confirmed that L. indica is closely related to Lagerstroemia guilinensis but is more distantly related to L. excelsa, L. caudata, L. suprareticulata, Lagerstroemia glabra, and Lagerstroemia anhuiensis. The native habitats of seven Lagerstroemia species are shown in Figure 4B.
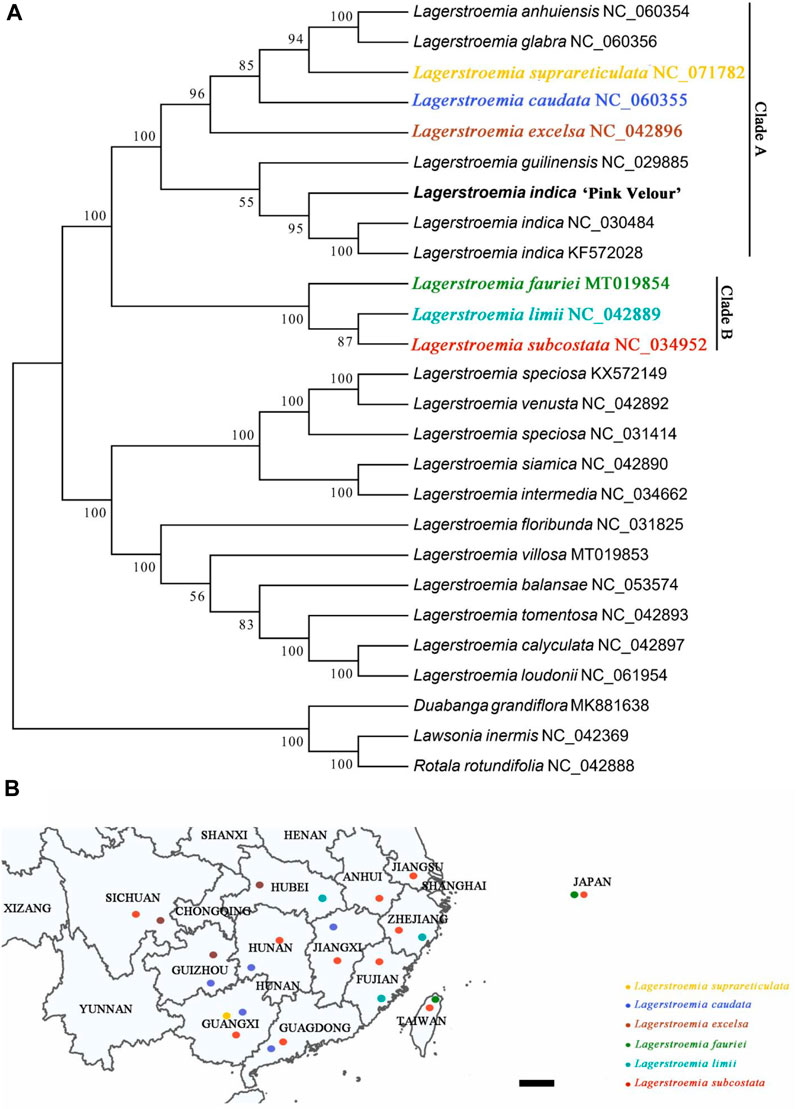
Figure 4. A phylogenetic tree of 26 Lagerstroemia species. (A) The phylogenetic tree was constructed by the ML method and complete chloroplast genome sequences. Bootstrap values from 1,000 replicates are shown near the branches. GenBank accessions are provided after the species name. The Lagerstroemia “Pink Velour” sequence obtained in this study is highlighted in bold Lagerstroemia indica. (B) Geographic distributions of the six Lagerstroemia species. Yellow circle represents species Lagerstroemia suprareticulata. Blue circle represents species Lagerstroemia caudata. Brown circle represents species Lagerstroemia excelsa. Green circle represents species Lagerstroemia fauriei. Turquoise circle represents species Lagerstroemia limii. Red circle represents species Lagerstroemia subcostata. Scale = 20 KM.
3.5 Variation in the boundary of the JSA harboring the ycf1 gene among seven Lagerstroemia species chloroplast genomes
The results of collinearity analysis of the chloroplast genomes of 7 Lagerstroemia species (L. indica PP404026, L. caudata NC_060355, L. excelsa NC_042896, L. fauriei MT019854, L. limii NC_042889, L. subcostata NC_034952, L. suprareticulata NC_071782) showed that the gene order of all chloroplast genomes was consistent, and no rearrangement or inversion occurred (Supplementary Figure S1). The boundary positions of the chloroplast genomes of the 7 Lagerstroemia species were comprehensively compared (Figure 5A). The results showed that these chloroplast genomes were highly conserved, while there were also some differences. The LSC/IRb (JLB), IRb/SSC (JSB) and SSC/IRa (JSA) boundaries were located in the rps19, ycf1 and ycf1 genes, respectively. The IRa/LSC (JLA) boundary was located between the rpl2 and trnH genes. The rps19 gene spans the JLB boundary to the IRb region at 77 bp, the ycf1 gene spans the JSB boundary to the IRb region at 2,251 bp, the ycf1 gene spans the JSA boundary to the IRa region at 2,251 bp, the rpl2 gene is 139–141 bp away from the JLA boundary, and trnH spans the JLA boundary to the IRa region at 0–3 bp. It is worth noting that the length of the cross-domain gene ycf1 varies, which is caused by L. fauriei, L. limii, and L. subcostata lacking six bases between the 4,021 and 4,080 sites in the full length of ycf1 (Figure 5B).
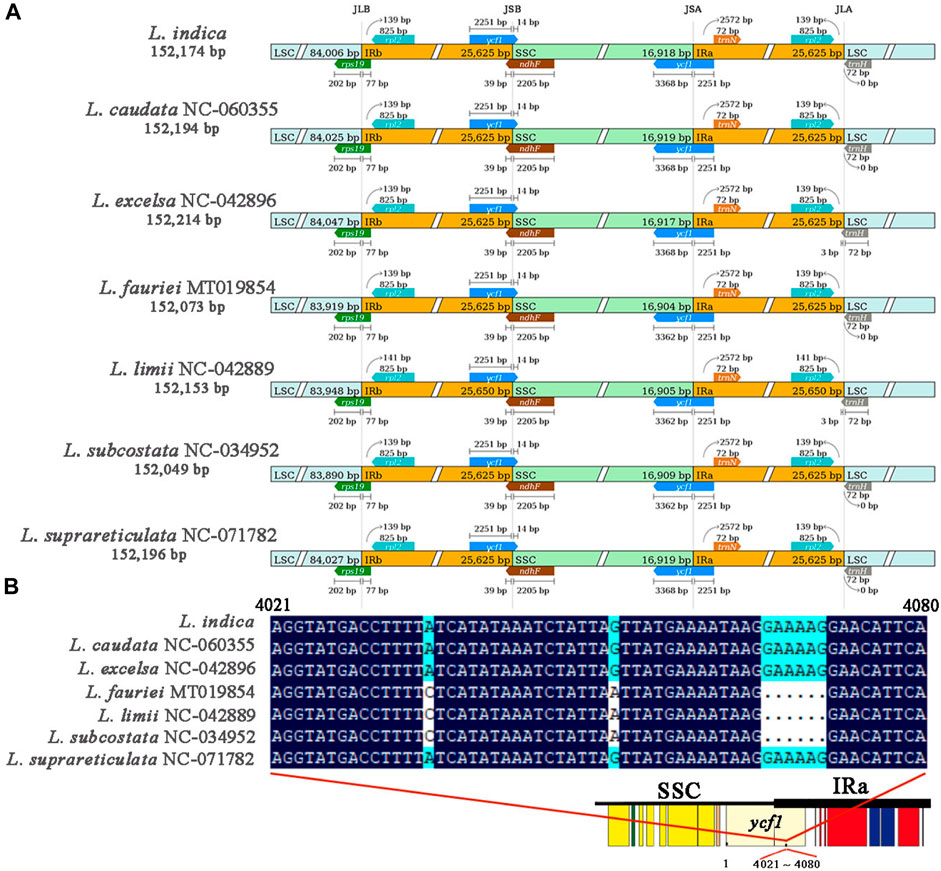
Figure 5. Comparison of the positions of the LSC, SSC, and IR region borders among 7 Lagerstroemia species. (A) Genes are represented by boxes, and the distance between genes and their boundaries is indicated by the number of bases, unless the gene extends to the boundary. The extensions of genes are also indicated above the boxes. (B) Comparison of the gene ycf1 crossing the JSA boundaries in 7 Lagerstroemia species. Schematic diagram showing the location of the ycf1 gene on the chloroplast genome, with a deletion of six bases in the 4,021 to 4,080 base range of the ycf1 gene in species Lagerstroemia fauriei, Lagerstroemia limii and Lagerstroemia subcostata.
3.6 High mutation sites observed in the LSC region of seven Lagerstroemia species chloroplast genomes
In this study, the analysis of nucleotide diversity showed that the average nucleotide diversity of the seven species was only 0.00068. However, the nucleotide diversity showed significant differences among regions of the chloroplast genome, with the nucleotide diversity in the LSC region ranging from 0 to 0.0079, with an average of 0.00072. The nucleotide diversity of the SSC region ranged from 0 to 0.0028, with an average of 0.0011. The nucleotide diversity of the IR regions ranged from 0 to 0.00058, with an average of only 0.000049. The nucleotide diversity of the SSC region in the chloroplast genomes of the three species was the highest, while the nucleotide diversity of the IR regions was lower than that of the other two regions (Figure 6), indicating that the IR regions are more conserved than the other two regions. The above results suggested that there is little variation among the chloroplast genomes of the seven species. However, there are still highly variable sites (Pi > 0.004), such as trnK-UUU, petN, psbJ, and psbF, in the chloroplast genomes of the seven species. These sites are all distributed in the LSC region of the chloroplast genome.
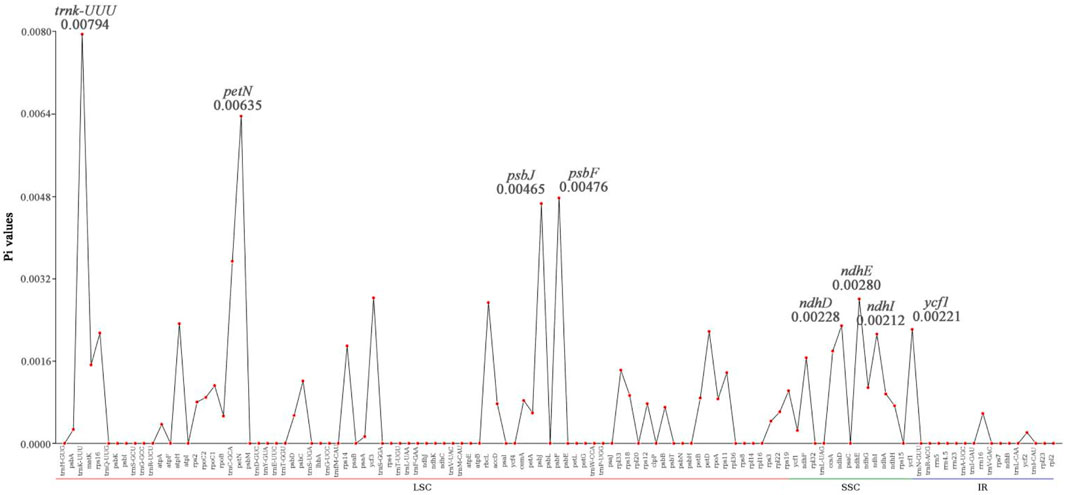
Figure 6. Comparison of nucleotide diversity (Pi) values among 7 Lagerstroemia species. The abscissa represents 113 genes distributed across the LSC, SSC, and IR regions of the chloroplast genome, while the ordinate represents the gene Pi values.
Single-nucleotide variants in chloroplast genome genes were compared within Lagerstroemia (Figure 7). In the petN gene, a thymine (T) was shared among L. fauriei, L. limii, and L. subcostata, while at this same position in the other three Lagerstroemia species sampled, adenine (A) was observed. In the psbJ gene, guanine (G) and A were found in different Lagerstroemia species. In the psbF gene, variation between A and cytosine (C) was also found among these species. These differences result in synonymous or nonsynonymous changes in amino acids. For example, a codon of serine (S) in the L. fauriei, L. limii, and L. subcostata chloroplast genomes was changed to threonine (T). Unlike in the petN and psbF genes, no amino acid translation by variable codons was observed in psbJ. This suggests that these changes may be related to the evolution of chloroplast gene functions in Lagerstroemia species.
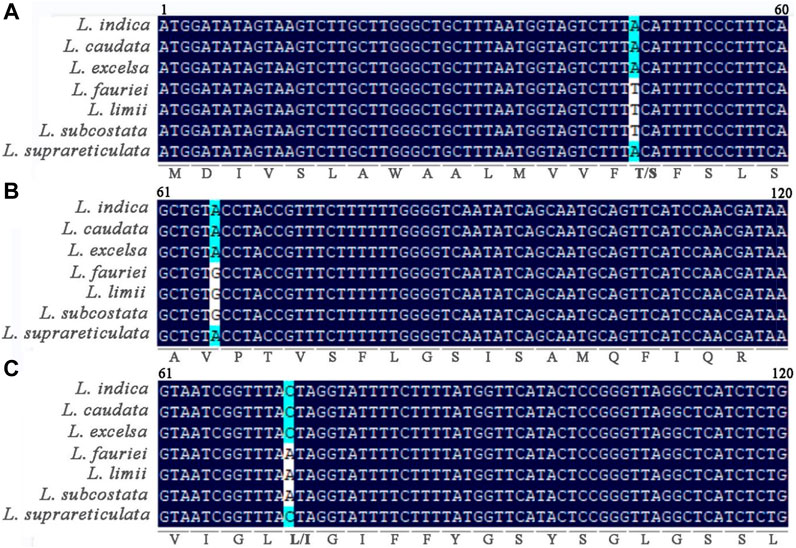
Figure 7. Nucleotide mutations in petN (A), psbJ (B), and psbF (C) in 7 Lagerstroemia species. The numbers represent the position of the gene fragment on the corresponding gene. The letters below the bases represent the translated amino acids. A (Ala, ALanine); R (Arg,Arginine); D (Asp, Aspartic acid); Q (Gln, Glutamine); G (Gly, Glycine); I (Ile, Isoleucine); L (Leu, Leucine); M (Met, Methionine); F (Phe, Phenylalanine); P (Pro, Proline); S (Ser, Serine); T (Thr, Threonine); W (Trp, Tryptophan); Y (Tyr, Tyrosine); V (Val, Valine).
3.7 Higher nonsynonymous substitutions occurrence of photosynthesis genes among Lagerstroemia fauriei, Lagerstroemia limii and Lagerstroemia subcostata
The Ka/Ks ratio, which compares the frequency of nonsynonymous nucleotide substitutions with synonymous substitutions, serves as a crucial metric in assessing selective constraints on gene diversification. Values exceeding 1 suggest that genes are influenced by positive selection, a ratio of 1 indicates neutral selection, while ratios less than 1 imply purifying selection. We calculated the Ka and Ks values for genes in the chloroplast genomes of 6 Lagerstroemia species with that of L. indica “Pink Velour” as the reference. The Ka/Ks ratios in Lagerstroemia species ranged from 0.00000 to 1.59332. Among these genes, only 14 had calculable Ka/Ks values (Supplementary Table S5). Among the genes with base substitution, the Ks values of 12 genes were greater than the Ka values. The Ks values of two genes (petD and rbcL) were lower than the Ka values, yielding Ka/Ks values > 1.
We calculated the Ka or Ks value percentage for 20 photosynthesis genes in six species, and values equal to 0 indicated that these gene sequences were conserved without synonymous nucleotide substitutions (Figure 8). The results revealed that 17 genes underwent nonsynonymous nucleotide substitution, while 13 genes underwent synonymous nucleotide substitution. Nine genes underwent synonymous or nonsynonymous substitution in only 1 species. The genes exhibiting synonymous or nonsynonymous substitutions exclusively in three species include psbF, psbJ, ndhG, ndhI, petA, petB, petN, and rbcL. These genes fall under the categories of “subunits of photosystem II”, “subunits of NADH dehydrogenase”, “subunits of cytochrome b/f complex” and “large subunit of rubisco”. On the other hand, psaA and ndhD, categorized as “subunits of photosystem I″ and “subunits of NADH dehydrogenase”, respectively, underwent synonymous or nonsynonymous substitutions in all six species.
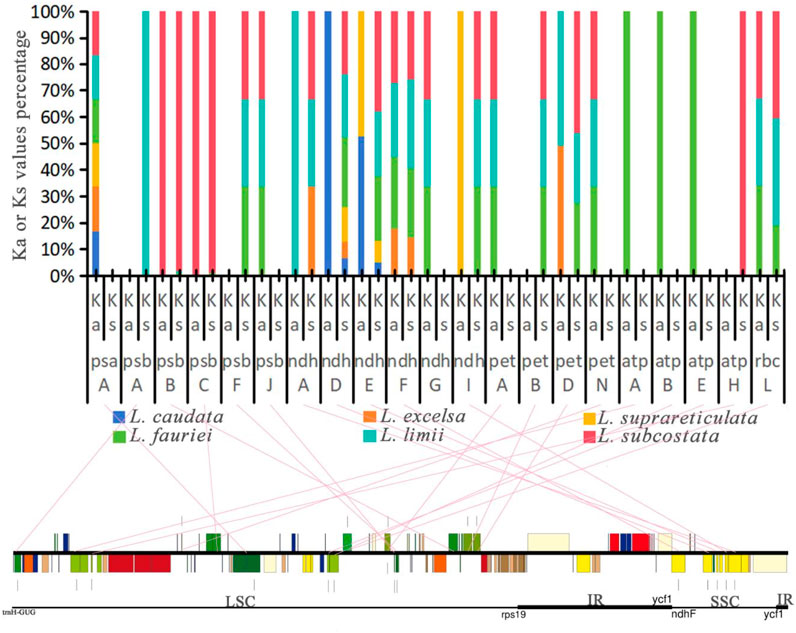
Figure 8. Ka or Ks value percentage for photosynthesis genes in the chloroplast genomes of 6 Lagerstroemia species in comparison with that of Lagerstroemia indica “Pink Velour”. Pink straight lines connect the photosynthesis genes with their locations on the chloroplast genome.
4 Discussion
In the present study, we conducted the sequencing of the chloroplast genome of L. indica, yielding a circular genome of 152,174 base pairs with a quadripartite structure similar to that in other Lagerstroemia species, such as Lagerstroemia intermedia (Gu et al., 2017). Analyses of chloroplast genome structure, SSRs, codon usage, sequence divergence, nucleotide polymorphism, and evolutionary selection were performed on related Lagerstroemia species. The results prove that slight differences exist among these six species. Differences between these closely related species were observed, primarily involving the ycf1 gene at the boundary in JSA. Further investigation of individual nucleotide substitution and Ka (Ks) value proportions revealed evolutionary selection among closely related species of Lagerstroemia.
The chloroplast genome of Lagerstroemia “Pink Velour” was consistent with those of other species, such as L. caudata, L. excelsa, L. fauriei, and L. limii, in terms of gene structure (Xu et al., 2017; Gu et al., 2019; Zheng et al., 2020; Dong et al., 2021). The AT content in the Lagerstroemia “Pink Velour” chloroplast genome was found to be higher than the GC content, similar to the previous studies (Gu et al., 2019; Zheng et al., 2020). Notably, the GC content exhibited variations among the IR and single-copy regions, potentially linked to the presence of rRNA genes within the IR regions (Zheng et al., 2020). In our study, codons with A or T at the 3′position demonstrated higher RSCU values (≥1) (Figure 3). This outcome could be attributed to the elevated AT content commonly observed in plant chloroplast genomes (Menezes et al., 2018). Similar patterns in codon usage have been reported in other plant species (Li et al., 2019; Peng et al., 2022). Furthermore, The most common repeat units in all SSRs were A/T (Figure 2). This observation parallels findings from earlier studies (Ping et al., 2021; Fan et al., 2022). The abundance of A/T repeat units may be linked to their concentration in non-coding regions characterized by lower GC contents. SSRs hold potential utility in plant classification studies and can serve as molecular markers in phylogenetic investigations (Abdullah et al., 2021; Yang et al., 2021).
The boundaries between the LSC IRa, SSC, and IRb regions hold significance in the evolution of certain taxa (Nazareno et al., 2015). The presence of the ycf1 pseudogene was identified in all seven species, yet some nucleic acid sequences were absent in three species (Figure 5). The observed variation was concentrated within the IR regions. Nucleic acid sequence variations in ycf1 were detected in the 7 Lagerstroemia chloroplast genome sequences. The sequence expansion in the Lagerstroemia transcribed region was regarded as a significant evolutionary event in L. indica, L. caudata, L. excelsa, and L. suprareticulata. Ycf1 variation among these seven species may have arisen 20.1 million years ago (Wang et al., 2023).
Nucleotide diversity (Pi) serves as an indicator of variation in nucleic acid sequences, providing a valuable molecular marker for population genetics (Mehmood et al., 2020; Ding et al., 2021). Established methods for constructing DNA barcodes, as demonstrated in other species (Ali et al., 2020), have been applied in this study. The Pi analysis unveiled that the IR region exhibited higher conservation compared to the LSC and SSC regions (Figure 6). Furthermore, protein-coding genes such as trnk-UUU, pet-N, psbJ, psbF, ndhE, ndhD, ndhI, and ycf1 were found to have larger variations in the 7 Lagerstroemia plastomes, and these genes with variation sites were divided into two clades (Figure 4). Most of the genes with higher Pi values in this study belonged to the photosynthesis category, which was different from previous findings in Lagerstroemia species (Gu et al., 2019; Ping et al., 2021). Life history differences and biological, and nonbiological stressors lead to variation in plastome evolution (Bousquet et al., 1992; Ge and Guo, 2020), and the kinship of species was also an influencing factor in this study. In subsequent investigations, pet-N, psbJ, and psbF stand out as potential molecular markers that can be explored for their efficacy in elucidating the phylogenetic relationships among various closely related species (Figure 7). Synonymous or non-synonymous mutations caused by variation in a single nucleotide may result from natural selection.
The first and second codon positions are often more informative than the third position for gene function changes, as they are usually synonymous (Wang et al., 2023). The synonymity of most photosynthesis genes in this study suggests adaptation to novel ecological conditions, such as temperature, light, and moisture (Zheng et al., 2020). Most photosynthesis genes are synonymous or non-synonymous only in the species L. fauriei, L. limii, and L. subcostata (Figure 8). These genes found in six species suggests a potentially crucial role in their adaptation to diverse selective environments. The origin of these species is divided into the islands and the continent (Figure 4B), the biological and nonbiological stressors they received may provid environmental conditions for photosynthesis genes evolution. In addition, previous research results have shown that deletion of petG or petN caused a bleached phenotype and loss of photosynthetic electron transport and photoautotrophy (Schwenkert et al., 2007). When psbJ is absent, both intact PSII core monomers and PSII core dimers containing the PsbO protein are formed. However, the LHCII antenna remains dissociated from the PSII dimers (Suorsa et al., 2004). The nuclear-encoded PBR1 exerts tight control over the translational expression of the chloroplast gene Ycf1, thereby facilitating the coordinated biogenesis of the NDH, PSI, and Cytb6f complexes as a unit (Yang et al., 2016). The orrm6 mutants exhibit reduced levels of photosystem II (PSII) proteins, particularly PsbF, along with diminished PSII activity, pale green pigmentation, smaller leaf and plant sizes, and delayed growth (Hackett et al., 2017). The measurements of photosynthetic physiological indices (including chlorophyll fluorescence indices, chlorophyll content, vegetative growth of plants, etc.) were included in these studies, which were lacking in our research. Future experiments need further exploration and investigation to determine the functional changes of mutated genes.
Chloroplast genome sequence data have been extensively used in plant phylogenetic reconstruction (Liu et al., 2018). In the present study, we performed phylogenetic analysis based on Lagerstroemia chloroplast genomes in relation to those reported for species (Figure 4). The results strongly supported L. indica and L. guilinensis as homologous, consistent with the findings in prior studies (Zheng et al., 2020; Ping et al., 2021). We also found that the species in clades A and B were closely related, and the relationships of L. suprareticulata and L. caudata were reported in detail for the first time. The results could provide a background reference for Lagerstroemia breeding and even accelerate horticultural breeding through molecular marker-assisted selection.
5 Conclusion
In this study, the chloroplast genome of L. indica “Pink Velour” was sequenced and assembled. Following this, a comparative chloroplast genome analysis unveiled that the structural features of the Lagerstroemia “Pink Velour” genome showed differences in JSA boundary. These findings offer novel insights into unraveling the phylogenetic relationships among related Lagerstroemia species. Identification of single-nucleotide variants within Lagerstroemia species revealed that photosynthesis genes play an important role in molecular evolution. Highly variable genes have been identified that can be used for species differentiation and marker-assisted breeding. The variation of photosynthesis genes provides a deeper understanding of the evolutionary mechanism, which provides information on climatic adaptation in important ornamental plants.
Data availability statement
The data presented in the study are deposited in the NCBI (National Center for Biotechnology Information) repository, accession number PP404026; for more information regarding our data policies, refer to our guidelines.
Author contributions
LH: Funding acquisition, Supervision, Writing–original draft, Conceptualization, Resources. SX: Data curation, Writing–original draft. XC: Methodology, Visualization, Writing–original draft. HH: Methodology, Writing–original draft. HD: Visualization, Writing–original draft. XW: Investigation, Writing–original draft. ZD: Investigation, Writing–original draft. MX: Investigation, Writing–original draft. HG: Investigation, Writing–original draft. NY: Funding acquisition, Writing–original draft. CW: Conceptualization, Resources, Supervision, Writing–original draft.
Funding
The author(s) declare that financial support was received for the research, authorship, and/or publication of this article. This work was supported by the Research Foundation for Talented Scholars of Jinling Institute of Technology (jit-b-202322), and Science and Technology Project of 2021 Nanjing Greening and Landscape Bureau (YLKJ202111 JH).
Conflict of interest
The authors declare that the research was conducted in the absence of any commercial or financial relationships that could be construed as a potential conflict of interest.
Publisher’s note
All claims expressed in this article are solely those of the authors and do not necessarily represent those of their affiliated organizations, or those of the publisher, the editors and the reviewers. Any product that may be evaluated in this article, or claim that may be made by its manufacturer, is not guaranteed or endorsed by the publisher.
Supplementary material
The Supplementary Material for this article can be found online at: https://www.frontiersin.org/articles/10.3389/fgene.2024.1378403/full#supplementary-material
References
Abdullah, S., Mehmood, F., Shahzadi, I., Ali, Z., Islam, M., Naeem, M., et al. (2021). Correlations among oligonucleotide repeats, nucleotide substitutions, and insertion-deletion mutations in chloroplast genomes of plant family Malvaceae. J. Syst. Evol. 59, 388–402. doi:10.1111/jse.12585
Abdulrahman, S. S., Daştan, S. D., Shahbaz, S. E., and Selamoglu, Z. (2023). Phylogenetic analysis of Prunus genus using nuclear and chloroplast gene markers as a bioorganic structure profiling. J. Mol. Struct. 1284, 135300. doi:10.1016/j.molstruc.2023.135300
Ali, F. S., Ismail, M., and Aly, W. (2020). DNA barcoding to characterize biodiversity of freshwater fishes of Egypt. Mol. Biol. Rep. 47, 5865–5877. doi:10.1007/s11033-020-05657-3
Asaf, S., Khan, A. L., Khan, M. A., Waqas, M., Kang, S. M., Yun, B. W., et al. (2017). Chloroplast genomes of Arabidopsis halleri ssp. gemmifera and Arabidopsis lyrata ssp. petraea: structures and comparative analysis. Sci. Rep. 7, 7556. doi:10.1038/s41598-017-07891-5
Bankevich, A., Nurk, S., Antipov, D., Gurevich, A. A., Dvorkin, M., Kulikov, A. S., et al. (2012). SPAdes: a new genome assembly algorithm and its applications to single-cell sequencing. J. Comput. Biol. 19, 455–477. doi:10.1089/cmb.2012.0021
Bousquet, J., Strauss, S. H., Doerksen, A. H., and Price, R. A. (1992). Extensive variation in evolutionary rate of rbcL gene sequences among seed plants. Proc. Natl. Acad. Sci. U. S. A. 89, 7844–7848. doi:10.1073/pnas.89.16.7844
Brudno, M., Malde, S., Poliakov, A., Do, C. B., Couronne, O., Dubchak, I., et al. (2003). Glocal alignment: finding rearrangements during alignment. Bioinformatics 19, i54–i62. doi:10.1093/bioinformatics/btg1005
Cauz-Santos, L. A., Munhoz, C. F., Nathalie, R., Stephane, C., Santos, A. A., Penha, H. A., et al. (2017). The chloroplast genome of Passiflora edulis (passifloraceae) assembled from long sequence reads: structural organization and phylogenomic studies in malpighiales. Front. Plant. Sci. 8, 334. doi:10.3389/fpls.2017.00334
Choi, S. K., Kim, K., Jeong, E. K., Terada, K., Suzuki, M., and Uematsu, H. (2010). Fossil woods from the miocene in the yamagata prefecture, Japan. IAWA J. 31, 95–117. doi:10.1163/22941932-90000009
Daniell, H., Lin, C., Yu, M., and Chang, W. (2016). Chloroplast genomes: diversity, evolution, and applications in genetic engineering. Genome. Biol. 17, 134–229. doi:10.1186/s13059-016-1004-2
Ding, S., Dong, X., Yang, J., Guo, C., Cao, B., Guo, Y., et al. (2021). Complete chloroplast genome of Clethra fargesii Franch., an original sympetalous plant from central China: comparative analysis, adaptive evolution, and phylogenetic relationships. Forests 12, 441. doi:10.3390/F12040441
Dong, W., Xu, C., Liu, Y., Shi, J., Li, W., and Suo, Z. (2021). Chloroplast phylogenomics and divergence times of Lagerstroemia (Lythraceae). Bmc. Genomics. 22, 434–34. doi:10.1186/s12864-021-07769-x
Fan, X., Wang, W., Wagutu, G. K., Li, W., Li, X., and Chen, Y. (2022). Fifteen complete chloroplast genomes of Trapa species (Trapaceae): insight into genome structure, comparative analysis and phylogenetic relationships. Bmc. Plant. Biol. 22, 230. doi:10.1186/s12870-022-03608-7
Feng, S., Jiao, K., Zhu, Y., Wang, H., Jiang, M., Wang, H., et al. (2018). Molecular identification of species of Physalis (Solanaceae) using a candidate DNA barcode: the chloroplast psbA-trnH intergenic region. Genome 61, 15–20. doi:10.1139/gen-2017-0115
Gao, C., Li, T., Zhao, X., Wu, C., Zhang, Q., Zhao, X., et al. (2023). Comparative analysis of the chloroplast genomes of Rosa species and RNA editing analysis. Bmc. Plant. Biol. 23, 318. doi:10.1186/s12870-023-04338-0
Gao, L. Z., Liu, Y. L., Zhang, D., Li, W., Gao, J., Liu, Y., et al. (2019). Evolution of Oryza chloroplast genomes promoted adaptation to diverse ecological habitats. Commun. Biol. 2, 278. doi:10.1038/s42003-019-0531-2
Ge, S., and Guo, Y. (2020). Evolution of genes and genomes in the genomics era. Sci. China-Life Sci. 63, 602–605. doi:10.1007/s11427-020-1672-0
Gu, C., Ma, L., Wu, Z., Chen, K., and Wang, Y. (2019). Comparative analyses of chloroplast genomes from 22 Lythraceae species: inferences for phylogenetic relationships and genome evolution within Myrtales. Bmc. Plant. Biol. 19, 281. doi:10.1186/s12870-019-1870-3
Gu, C., Tembrock, L. R., and Wu, Z. (2017). The complete chloroplast genome of Lagerstroemia intermedia (Lythraceae), a threatened species endemic to southwestern Yunnan province, China. Conserv. Genet. Resour. 9, 357–360. doi:10.1007/s12686-016-0677-x
Guo, C., Liu, K., Li, E., Chen, Y., He, J., Li, W., et al. (2023). Maternal donor and genetic variation of Lagerstroemia indica Cultivars. Int. J. Mol. Sci. 24, 3606. doi:10.3390/ijms24043606
Guo, Z., Zhang, H., Shrestha, N., and Zhang, X. (2016). Complete chloroplast genome of a valuable medicinal plant, huperzia serrata (Lycopodiaceae), and Comparison with its congener. Appl. Plant Sci. 4, 1600071. doi:10.3732/apps.1600071
Hackett, J. B., Shi, X., Kobylarz, A. T., Lucas, M. K., Wessendorf, R. L., Hines, K. M., et al. (2017). An organelle RNA recognition motif protein is required for photosystem II subunit psbF transcript editing. Plant Physio 173 (4), 2278–2293. doi:10.1104/pp.16.01623
Huang, F., Tang, L., Wang, X., Cai, N., and Qiao, Z. (2022). Study on in vitro Induction of rooting and changes in endogenous hormone content of Lagerstroemia indica ZIJINGLING. Acta. Sci. pol-hortoru. 21, 39–52. doi:10.24326/asphc.2022.3.4
Hyatt, D., Chen, G., Locascio, P. F., Land, M. L., Larimer, F. W., and Hauser, L. J. (2010). Prodigal: prokaryotic gene recognition and translation initiation site identification. Bmc. Bioinforma. 11, 119–211. doi:10.1186/1471-2105-11-119
Jiang, S., Lv, F., Gao, L., Gu, J., Yang, R., Li, S., et al. (2023). Novel R2R3-MYB transcription factor LiMYB75 enhances leaf callus regeneration efficiency in Lagerstroemia indica. Forests 14, 517. doi:10.3390/f14030517
Kang, L., Xie, D., Xiao, Q., Peng, C., Yu, Y., and He, X. (2019). Sequencing and analyses on chloroplast genomes of Tetrataenium candicans and two allies give new insights on structural variants, DNA barcoding and phylogeny in Apiaceae subfamily Apioideae. Peerj 7, e8063. doi:10.7717/peerj.8063
Katoh, K., Kuma, K. i., Toh, H., and Miyata, T. (2005). MAFFT version 5: improvement in accuracy of multiple sequence alignment. Nucleic Acids Res. 33, 511–518. doi:10.1093/nar/gki198
Katoh, K., and Standley, D. M. (2013). MAFFT multiple sequence alignment software version 7: improvements in performance and usability. Mol. Biol. Evol. 30, 772–780. doi:10.1093/molbev/mst010
Li, G., Pan, Z., Gao, S., He, Y., Xia, Q., Jin, Y., et al. (2019). Analysis of synonymous codon usage of chloroplast genome in Porphyra umbilicalis. Genes Genom 41, 1173–1181. doi:10.1007/s13258-019-00847-1
Li, H., and Liang, Z. (2021). Study on regional characteristics of plant landscape in yaovillage of longsheng county. E3S Web Conf. 293, 03009. doi:10.1051/e3sconf/202129303009
Librado, P., and Rozas, J. (2009). DnaSP v5: a software for comprehensive analysis of DNA polymorphism data. Bioinformatics 25, 1451–1452. doi:10.1093/bioinformatics/btp187
Liu, H., Yu, Y., Deng, Y., Li, J., Huang, Z., and Zhou, S. (2018). The Chloroplast genome of Lilium henrici: genome structure and comparative analysis. Molecules 23, 1276. doi:10.3390/molecules23061276
Lohse, M., Drechsel, O., and Bock, R. (2007). Organellar Genome DRAW (OGDRAW): a tool for the easy generation of high-quality custom graphical maps of plastid and mitochondrial genomes. Curr. Genet. 52, 267–274. doi:10.1007/s00294-007-0161-y
Mehmood, F., Shahzadi, I., Waseem, S., Mirza, B., Ahmed, I., Waheed, M. T., et al. (2020). Chloroplast genome of Hibiscus rosasinensis (Malvaceae): comparative analyses and identification of mutational hotspots. Genomics 112, 581–591. doi:10.1016/j.ygeno.2019.04.010
Menezes, A. P., Resende-Moreira, L. C., Buzatti, R. S., Nazareno, A. G., Carlsen, M., Lobo, F. P., et al. (2018). Chloroplast genomes of Byrsonima species (Malpighiaceae): comparative analysis and screening of high divergence sequences. Sci. Rep. 8, 2210. doi:10.1038/s41598-018-20189-4
Nazareno, A. G., Carlsen, M., and Lohmann, L. G. (2015). Complete chloroplast genome of Tanaecium tetragonolobum: the first Bignoniaceae plastome. Plos One 10, e0129930. doi:10.1371/journal.pone.0129930
Peng, J., Zhang, X., Zhang, D., Wang, Y., Deng, T., Huang, X., et al. (2022). Newly reported chloroplast genome of Sinosenecio albonervius Y. Liu & Q. E. Yang and comparative analyses with other Sinosenecio species. Bmc Genomics 23, 1–13. doi:10.1186/s12864-022-08872-3
Pérez-Molphe-Balch, E., Santos-Díaz, M. D. S., Ramírez-Malagón, R., and Ochoa-Alejo, N. (2015). Tissue culture of ornamental cacti. Sci. Agr. 72, 540–561. doi:10.1590/0103-9016-2015-0012
Ping, J., Feng, P., Li, J., Zhang, R., Su, Y., and Wang, T. (2021). Molecular evolution and SSRs analysis based on the chloroplast genome of Callitropsis funebris. Ecol. Evol. 11, 4786–4802. doi:10.1002/ece3.7381
Pogson, B. J., Ganguly, D., and Albrecht-Borth, V. (2015). Insights into chloroplast biogenesis and development. Bba-Bioenergetics 1847, 1017–1024. doi:10.1016/j.bbabio.2015.02.003
Pooler, M. R. (2003). Molecular genetic diversity among 12 clones of Lagerstroemia fauriei revealed by AFLP and RAPD markers. HortScience 38, 256–259. doi:10.21273/hortsci.38.2.256
Schwenkert, S., Legen, J., Takami, T., Shikanai, T., Herrmann, R. G., and Meurer, J. (2007). Role of the low-molecular-weight subunits PetL, PetG, and PetN in assembly, stability, and dimerization of the cytochrome b 6 f complex in tobacco. Plant physiol. 144, 1924–1935. doi:10.1104/pp.107.100131
Sharp, P. M., and Li, W. (1987). The codon adaptation index-a measure of directional synonymous codon usage bias, and its potential applications. Nucleic Acids Res. 15, 1281–1295. doi:10.1093/nar/15.3.1281
Shi, W., Hu, S., Song, W., Huang, Y., Shi, C., and Wang, S. (2023). Uncovering the first complete chloroplast genomics, comparative analysis, and phylogenetic relationships of the medicinal plants Rhamnus cathartica and Frangula alnus (Rhamnaceae). Physiol. Mol. Biol. Plants 29, 855–869. doi:10.1007/s12298-023-01331-7
Stamatakis, A., Hoover, P., and Rougemont, J. (2008). A rapid bootstrap algorithm for the RAxML Web servers. Syst. Biol. 57, 758–771. doi:10.1080/10635150802429642
Suorsa, M., Regel, R. E., Paakkarinen, V., Battchikova, N., Herrmann, R. G., and Aro, E. M. (2004). Protein assembly of photosystem II and accumulation of subcomplexes in the absence of low molecular mass subunits PsbL and PsbJ. Eur. J. Biochem. 271, 96–107. doi:10.1046/j.1432-1033.2003.03906.x
Wang, J., He, W., Liao, X., Ma, J., Gao, W., Wang, H., et al. (2023). Phylogeny, molecular evolution, and dating of divergences in Lagerstroemia using plastome sequences. Hortic. Plant J. 9, 345–355. doi:10.1016/j.hpj.2022.06.005
Wang, X., Wadl, P. A., Pounders, C., Trigiano, R. N., Cabrera, R. I., Scheffler, B. E., et al. (2011). Evaluation of genetic diversity and pedigree within crapemyrtle cultivars using simple sequence repeat markers. J. Am. Soc. Hortic. Sci. 136, 116–128. doi:10.21273/jashs.136.2.116
Wang, Y., Ni, F., Yin, D., Chen, L., Li, Y., He, L., et al. (2021). Physiological response of Lagerstroemia indica (L.) Pers. seedlings to drought and rewatering. Trop. Plant Biol. 14, 360–370. doi:10.1007/s12042-021-09294-3
Wu, L., Nie, L., Xu, Z., Li, P., Wang, Y., He, C., et al. (2020). Comparative and phylogenetic analysis of the complete chloroplast genomes of three Paeonia section moutan species (Paeoniaceae). Front. Genet. 11, 980. doi:10.3389/fgene.2020.00980
Xie, J., Mao, J., Li, Z., Liang, C., Ou, W., Tang, J., et al. (2021). Complete chloroplast genome of a high-quality forage in north China, Medicago ruthenica (Fabaceae:Trifolieae). Mitochondrial DNA Part B-Resour 6, 29–30. doi:10.1080/23802359.2020.1845578
Xu, C., Dong, W., Li, W., Lu, Y., Xie, X., Jin, X., et al. (2017). Comparative analysis of six Lagerstroemia complete chloroplast genomes. Front. Plant Sci. 8, 15. doi:10.3389/fpls.2017.00015
Yang, H., Wang, L., Chen, H., Jiang, M., Wu, W., Liu, S., et al. (2021). Phylogenetic analysis and development of molecular markers for five medicinal Alpinia species based on complete plastome sequences. Bmc Plant Biol. 21, 431. doi:10.1186/s12870-021-03204-1
Yang, X. F., Wang, Y. T., Chen, S. T., Li, J. K., Shen, H. T., and Guo, F. Q. (2016). PBR1 selectively controls biogenesis of photosynthetic complexes by modulating translation of the large chloroplast gene Ycf1 in Arabidopsis. Cell Discove 2 (1), 16003–16019. doi:10.1038/celldisc.2016.3
Zheng, G., Wei, L., Ma, L., Wu, Z., Gu, C., and Chen, K. (2020). Comparative analyses of chloroplast genomes from 13 Lagerstroemia (Lythraceae) species: identification of highly divergent regions and inference of phylogenetic relationships. Plant Mol. Biol. 102, 659–676. doi:10.1007/s11103-020-00972-6
Keywords: Lagerstroemia indica, chloroplast genome, photosynthesis genes, molecular evolution, climatic adaptation
Citation: He L, Xu S, Cheng X, Huang H, Dai H, Wang X, Ding Z, Xu M, Gu H, Yan N and Wang C (2024) Chloroplast genomes in seven Lagerstroemia species provide new insights into molecular evolution of photosynthesis genes. Front. Genet. 15:1378403. doi: 10.3389/fgene.2024.1378403
Received: 29 January 2024; Accepted: 08 March 2024;
Published: 02 April 2024.
Edited by:
Yang Zhu, Zhejiang University, ChinaReviewed by:
Arvind H. Hirani, Kemin Industries, Inc., United StatesHao Gao, Zhejiang University, China
Jingyi Zhang, yang zhu, China
Copyright © 2024 He, Xu, Cheng, Huang, Dai, Wang, Ding, Xu, Gu, Yan and Wang. This is an open-access article distributed under the terms of the Creative Commons Attribution License (CC BY). The use, distribution or reproduction in other forums is permitted, provided the original author(s) and the copyright owner(s) are credited and that the original publication in this journal is cited, in accordance with accepted academic practice. No use, distribution or reproduction is permitted which does not comply with these terms.
*Correspondence: Chunyan Wang, d2N5QGppdC5lZHUuY24=
†These authors have contributed equally to this work
 Ling He
 Sujuan Xu2†
 Chunyan Wang