 Baocheng Wu
 Jun Wen
 Ruisen Lu
 Wei Zhou
- Jiangsu Key Laboratory for the Research and Utilization of Plant Resources, Institute of Botany, Jiangsu Province and Chinese Academy of Sciences (Nanjing Botanical Garden Mem. Sun Yat-Sen), Nanjing, Jiangsu, China
Single-nucleotide polymorphisms (SNPs) represent the most prevalent form of genomic polymorphism and are extensively used in population genetics research. Using dd-RAD sequencing, a high-throughput sequencing method, we investigated the genome-level diversity, population structure, and phylogenetic relationships among three morphological forms of the widely distributed taxon Cryptotaenia japonica Hassk., which is native to East Asia. Our study aimed to assess the species status of C. japonica according to its genetic structure and genetic diversity patterns among 66 naturally distributed populations, comprising 26 C. japonica f. japonica, 36 C. japonica f. dissecta (Y. Yabe) Hara and 4 C. japonica f. pinnatisecta S. L. Liou accessions. Based on genomic SNP data generated by dd-RAD sequencing, we conducted genetic diversity, principal component, neighbor-joining (NJ) phylogenetic, admixture clustering, and population differentiation analyses. The findings revealed the following: (1) 5,39,946 unlinked, high-quality SNPs, with mean π, HO, HE and FIS values of 0.062, 0.066, 0.043 and −0.014, respectively, were generated; (2) population divergence was unaffected by isolation through distance; (3) six main distinct regions corresponding to geographic locations and exhibiting various levels of genetic diversity were identified; (4) pairwise FST analysis showed significant (P < 0.05) population differentiation in 0%–14% of populations among the six regions after sequential Bonferroni correction; and (5) three migration events (historical gene flow) indicated east‒west directionality. Moreover, contemporary gene flow analysis using Jost’s D, Nei’s GST, and Nm values highlighted the middle latitude area of East Asia as a significant contributor to genetic structuring in C. japonica. Overall, our study elucidates the relatively low genetic differentiation and population structure of C. japonica across East Asia, further enhancing our understanding of plant lineage diversification in the Sino-Japanese Floristic Region.
1 Introduction
Genetic diversity is one of the important pillars of biodiversity, and high genetic diversity increases wild plants’ ability to survive and reduces the risk of extinction for species and allows the prediction of species fitness based on the study of genetic diversity (Phillips et al., 2012; Hu et al., 2022). In addition, genetic differentiation and gene flow are important elements in understanding the evolutionary and adaptive potential of populations, while high gene flow reduces the incidence of inbreeding and population differentiation by increasing the exchange of genetic material between populations (Waqar et al., 2021). Plant genetic diversity is influenced by seed dispersal, reproductive systems, life history, geographic range and evolutionary history.
Previous studies have focused mainly on genetic diversity, population structure, and genetic characterization based on chloroplast DNA sequences, single-copy nuclear genes and microsatellite markers. Over the past few decades, researchers have increasingly used next-generation sequencing, which is becoming more affordable, and markers based on sequencing can be assessed throughout the genome (e.g., using RAD sequencing). SNPs from double-digest restriction site-associated DNA sequencing (ddRAD-seq) are low-mutation-rate markers. An increasing number of studies have used next-generation sequencing (NGS) and genotyping-by-sequencing (GBS) to investigate single nucleotide polymorphisms (SNPs), which have become markers of choice because they are abundant and stable in the genome. GBS is based on genome-wide sequencing of loci adjacent to conservative restriction sites, which makes it possible to obtain thousands of homologous loci for species with no prior genomic data (Shekhovtsov et al., 2022). It has certain applications in populations of Capparis spinosa L. Wang and Zhang (2022), Trigonobalanus doichangensis (A. Camus) Forman (Hu et al., 2022), Hedyotis chrysotricha (Palib.) Merr. Yuan et al. (2022), Prunus L. Li et al. (2020), Epimedium Tourn. ex L. Zhang et al. (2023), Cycas L. He et al. (2023), Camellia granthamiana Sealy (Chen et al., 2023), Saxifraga Tourn. ex L. Yuan et al. (2023), Pterocarya hupehensis Skan (Lu et al., 2024), Fitzroya Lindl. Cano et al. (2022), Hopea reticulata Tardieu (Tang et al., 2024), Soldanella L. Slovák et al. (2022), Bruguiera gymnorhiza (L.) Lam. ex Savigny Ruang-areerate et al. (2023), Pisum sativum L. Rispail et al. (2023) and other plants.
The Sino-Japanese Floristic Region of East Asia harbors the most diverse temperate flora in the world and was the most important glacial refuge for Tertiary representatives (‘relics’) throughout Quaternary ice-age cycles (Qiu et al., 2011). Cryptotaenia DC (Apiaceae) is a polyphyletic genus with three species in the tribe Pimpinelleae and four in the tribe Oenantheae (Spalik and Downie, 2007). Cryptotaenia japonica Hassk. in the tribe Oenantheae is present in regions that are important glacial refuges: C. japonica is endemic to East Asia (China, Japan and the Korean Peninsula) (Spalik and Downie, 2007). In Japan, C. japonica is known as “Mitsuba” and is used as a condiment (seeds) or a garnish (tender leaves) (Okuno et al., 2017), and in China, it is known as “Ya-er-qin” and is used as a tonic to strengthen the human body and as a vegetable (WU et al., 2014). It is treated as a species with three similar forms, C. japonica f. japonica, C. japonica f. dissecta (Y. Yabe) Hara, and C. japonica f. pinnatisecta S. L. Liou, because it is a distinctive, widespread taxon exhibiting almost continuous variation in leaves and inflorescences across its range (Pan and Watson, 2005).
In the present study, we used SNP markers from dd-RAD sequencing, admixture clustering, principal component analysis (PCA), neighbor-joining (NJ) phylogenetic analysis and gene flow methods to comprehensively investigate the mechanisms underlying the genetic diversity and distribution differences of C. japonica across a large spatial scale in East Asia. Thus, we aimed to (1) elucidate the population structure and intraspecific divergence of the lineages of C. japonica Hassk. (2) To adequately reveal the spatial pattern of genetic diversity among identified geographical regions, and (3) to provide a reference for future research on the diversity of widespread plants in Asia.
2 Materials and methods
2.1 Taxon sampling and identification of samples
South, West and East China, the Korean Peninsula and Japan were considered the three major distribution regions of C. japonica Hassk. Fresh leaves, especially young leaves, were collected from 1-6 individuals at each location and desiccated in silica gel. The dry leaves were stored at −20°C until use. Vouchers were deposited in the Herbarium of the Institute of Botany, Jiangsu Province and the Chinese Academy of Sciences (NAS). We identified the samples as subspecies using previously described methods (Shan and Sheh, 1985; Liou, 1990). In this study, a total of 179 wild individuals representing 26 populations of C. japonica f. japonica, 36 populations of C. japonica f. dissecta (Y. Yabe) Hara, 4 populations of C. japonica f. pinnatisecta S. L. Liou and 1 population of C. canadensis were collected (Figure 1). The 176 samples we studied were collected from 66 locations in 3 countries across the entire natural range of this species, including Mainland China, Taiwan Island, Korean Peninsula and Japan Islands. Our samples of C. japonica included all the proposed forms. In addition, 3 individuals of C. canadensis (L.) DC. from 1 wild population were used in the study as an outgroup (Table 1; Figures 2, 3).
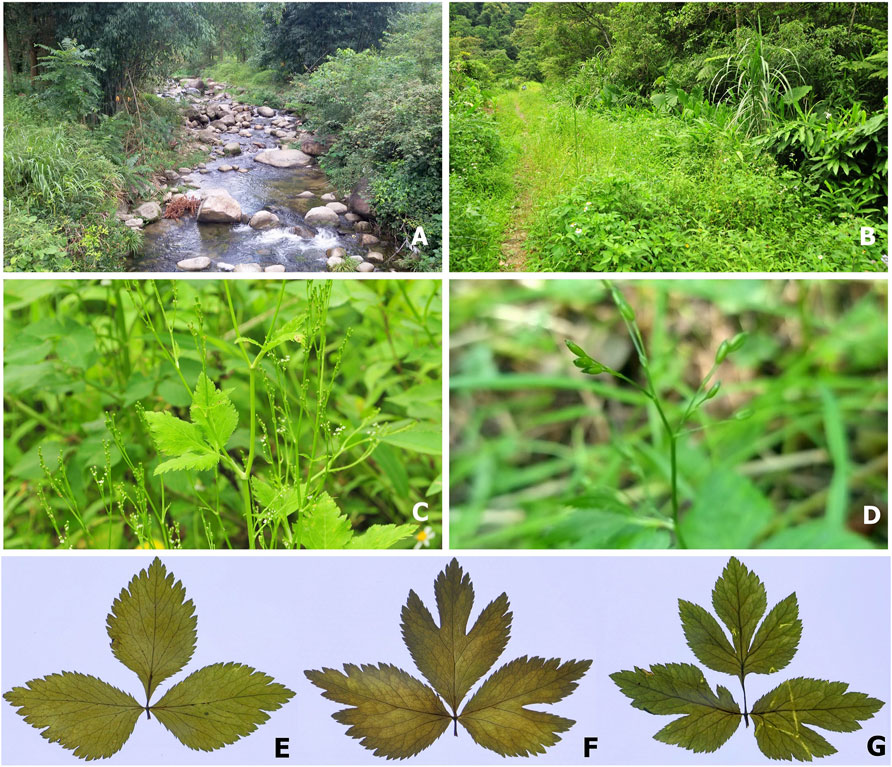
Figure 1. Cryptotaenia japonica Hassk. Different habitats (A: damp places along ditches or streams, (B) damp places in forests, along the trail). Adult plant with flowers and young fruits (C). Fruits (D). The leaves of three forms: C. japonica f. japonica (E), C. japonica f. dissecta (Y. Yabe) Hara (F), and C. japonica f. pinnatisecta S. L. Liou (G).
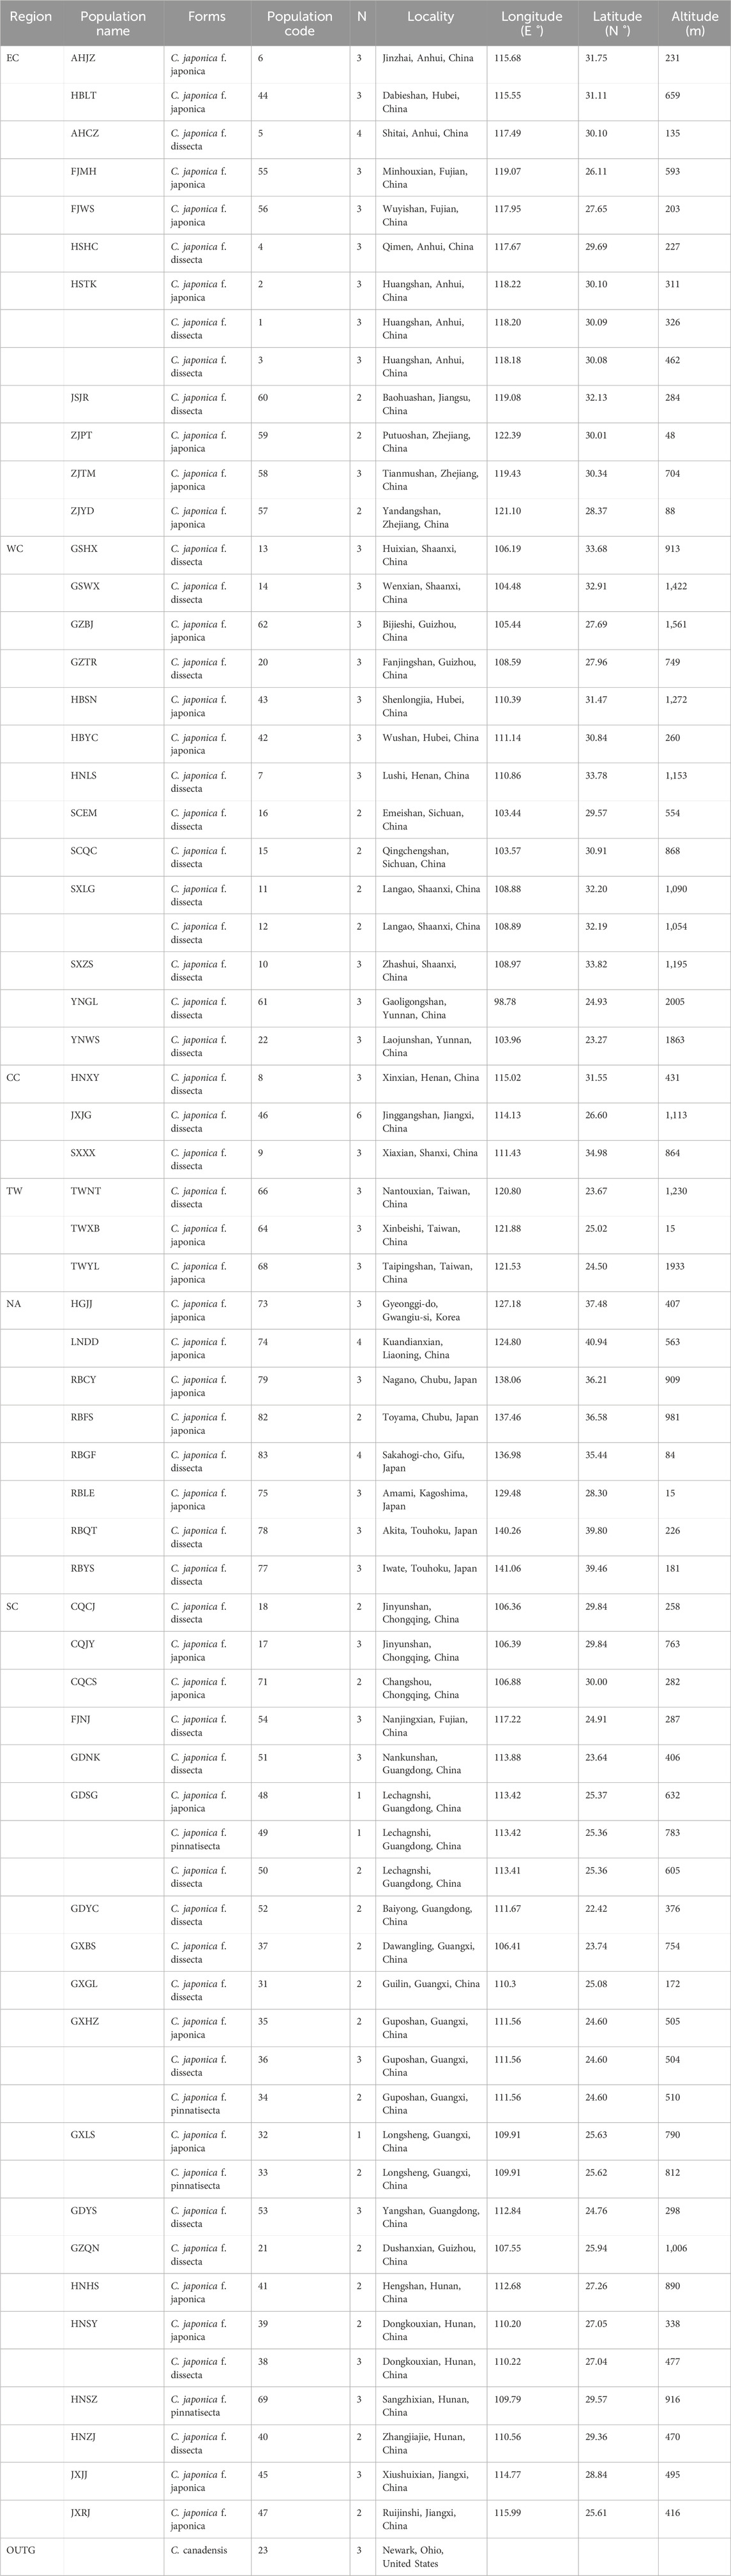
Table 1. Localities of the three different forms of C. japonica and C. canadensis populations sampled.
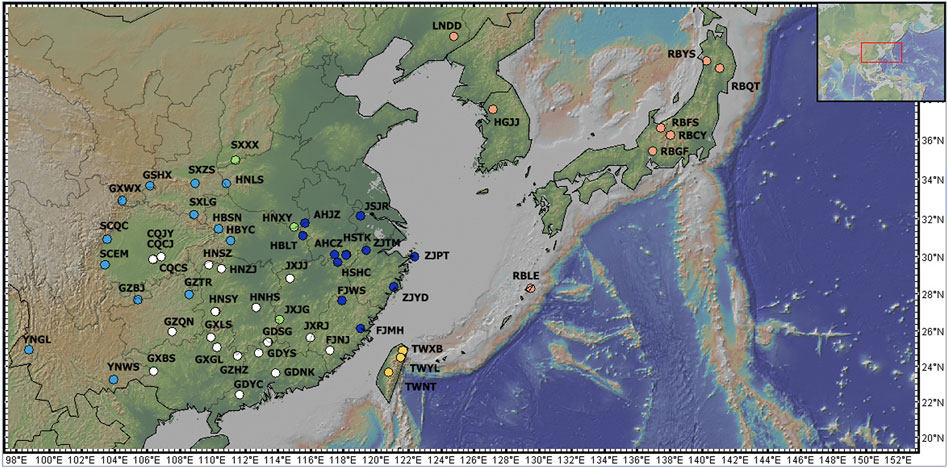
Figure 2. Sampling points for C. japonica populations. The pink dots show the populations in the NA region, the yellow dots indicate the TW region, the dark blue dots indicate the EC region, the green dots indicate the CC region, the sky blue dots indicate the WC region, and the white dots indicate the SC region. The map was produced by GeoMapApp (http://www.geomapapp.org/).
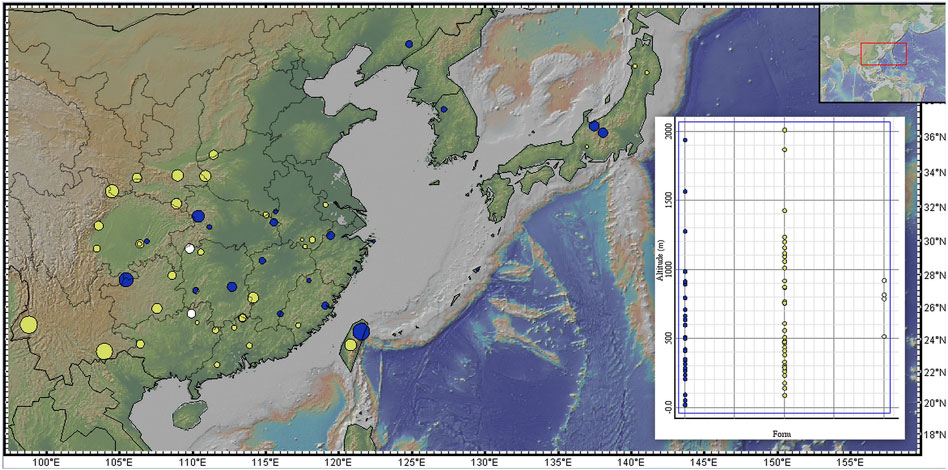
Figure 3. Distribution of forms across elevations. Blue dot = C. japonica f. japonica; yellow dot = C. japonica f. dissecta; white dot = C. japonica f. pinnatisecta. The size of the dot is larger, and the altitude is greater on the map. The map was produced by GeoMapApp (http://www.geomapapp.org/).
2.2 DNA extraction and quality control
Total genomic DNA was isolated from leaves using a TIANGEN DP305 DNA extraction kit. Extracted DNA was purified with Qiagen DNA Purification Kits (Oiagen, Inc., Valencia, CA, United States). The concentration and quality of the purified DNA samples were checked by a OneDrop™ OD-1000 + spectrophotometer (www.onedrop.cn) and 1% agarose gel electrophoresis. Finally, 179 of the 212 collected DNA samples met the minimum quality requirements in this study and were ready for subsequent sequencing and genotyping.
2.3 Double digest restriction site associated DNA sequencing (ddRAD-seq) library preparation and sequencing
Only when the quality of the total genomic DNA was >100 ng/μL could it be used for the ddRAD-seq library. The libraries of each individual were sequenced by Genepioneer Biotechnologies Co., Ltd. (Nanjing, China) via an Illumina NovaSeq 6,000 System sequencer and VAHTS Universal DNA Library Prep Kit for Illumina (ND607, bio.vazyme.com). The enzymes EcoRI (Read1, G^AATTC) and NlaIII (Read2, Hin1II, CATG^) were used for DNA digestion, and the fragments were ligated to a barcode adaptor and a common adaptor with compatible sticky ends. The target fragments were kept within the range of 300–500 bp in size. Then, 150 bp paired-end reads were generated, and approximately 216 GB raw data of 179 individuals was generated.
A quality control pipeline was used to process the raw data by FASTP software (version: 0.20.0), and its own script was used to filter the raw data to obtain clean data. The parameter was set to q 5 -n 5 (Chen et al., 2018). Then, the function TRIMFQ in SEQTK software (version: 1.3-r106) was used to obtain high-quality data (https://github.com/lh3/seqtk.git).
The software pipeline STACKS (Catchen et al., 2011; Catchen et al., 2013; Paris et al., 2017; Rochette and Catchen, 2017; Rochette et al., 2019) was used to process the filtered high-quality data from the ddRAD data. We genotyped and once again identified the loci from short-read sequences by using the STACKS 2.59 pipeline. Briefly, all sequences were processed by USTACKS (--deleverage -m = 3 and -M = 4 - p 10 - t gzfastq -d–R) for RAD tags, CSTACKS (-n 4 -p 40) was used to construct a catalog of consensus loci including all the loci from D. japonica samples and merge all alleles together, SSTACK was used to compare against the catalog with sets of stacks that were created in USTACKS, TSV2BAM was used to transfer tsv files to BAM files, we aligned the reads to the locus and called SNPs by GSTACKS, and POPULATIONS (populations -P stacks--popmap popmap.list -p 2 -t 25 --write-random-snp--vcf--fasta-samples--fasta-loci) was used to filter the catalog of reads to produce a dataset for subsequent analyses. After STACKS processing, we obtained 4,504,050 SNPs. VCFtools software (version: 0.1.16) (Danecek et al., 2011) was used to filter the loci based on 1) --min-alleles 2, --max-alleles 2; 2) --max-missing 0.50; 3) --mac3; and 4) --minDP 3. Finally, a total of 539,946 SNPs were obtained after VCFTOOLS processing.
2.4 Population genetic diversity, geographical patterns, region structure, and admixture
We calculated the nucleotide diversity (π), observed heterozygosity (HO), expected heterozygosity (HE), and inbreeding coefficient (FIS) for each population using the POPULATION program in STACKS (version: 5.39). We calculated pairwise F-statistics (FST) (1,000 permutations) among populations by using ARLEQUIN (version: 3.5.2.2) with sequential Bonferroni correction (Excoffier et al., 2005). FST was used as a measure of genetic distances among pairs of populations using the POPULATION program in STACKS (version: 5.39), and the transformation FST/(1-FST) was applied. Geographical distances included pairwise shortest distances among populations by using the geosphere program (version: 1.5–14) (https://github.com/phiala/ecodist.git) in the R package (version: 3.6.2). Mantel tests were used to measure the correlation between genetic and geographical distances among populations. Mantel tests were performed with the ecodist program (version: 2.0.7) in the R package (version: 3.6.2) (Goslee and Urban, 2007; Goslee, 2009). Graphics were created by the ggplot2 program (version 3.3.3) in the R package (version: 3.6.2) (https://github.com/tidyverse/ggplot2.git).
Three methods were used to infer overall patterns of population genetic structure. Firstly, all the data were used for phylogenetic inference by MEGA (version: 11.0.7) (Tamura et al., 2021) to obtain phylogenetic trees based on the NJ method. Secondly, we used GCTA software (Genome-wide Complex Trait Analysis, version: 1.93.2) (Yang et al., 2011) for PCA based on the function (--make-grm--autosome). The GRM of GCTA was used to estimate genetic relationships among individuals from SNP data. Finally, we used ADMIXTURE (version: 1.3.0) (Alexander et al., 2009), which implements a model-based approach to infer populations and individuals in a maximum-likelihood (ML) framework. ADMIXTURE outperforms several other software programs in terms of analysis efficiency for genome-wide SNP data, which are sometimes large. We estimated ancestry coefficients for every individual in 10 replicate software runs for each of K = 1–20. Then, we estimated two replicate runs of 50-fold cross-validation for K = 1–20 to determine the potential error in each K. The K value with the lowest cross-validation error was the best K. Each individual in this study was assigned to a cluster for the best K model.
2.5 Gene flow analysis
Three methods were used to analyze the gene flow between different regions of C. japonica in East Asia. Firstly, TREEMIX (version: 1.13) (Pickrell and Pritchard, 2012) was used to infer splitting and mixture patterns among populations of C. japonica. Migration events (m) from 0–12 were specified between populations, and 10 iterations per m were tested. In this analysis, the “-bootstrap 1,000”, “-m 0–12” and “-root” parameters were used to construct an ML tree. Secondly, we ran BA3-SNPs-autotune (version: 2.1.2) in BAYESASS3-SNPs (version: 1.1) (Wilson and Rannala, 2003; Mussmann et al., 2019) with the default delta values for allelic frequency, migration rates, and inbreeding coefficients by using the data of six regions, with C. canadensis (L.) DC. as the outgroup, based on -r 10-g 10,000-b 1,000 parameters. Thirdly, diveRsity software (version: 1.9.90) (Keenan et al., 2013) of the R package (version: 3.6.2) was also used to analyze the relative direction of the gene flow between these six regions by calculating Jost’s D, Nei’s GST, and Nm. The 95% confidence intervals were calculated from 1,000 bootstrap replicates to test for asymmetric flow (significantly higher in one direction than in the other).
3 Results
3.1 RAD-seq data and SNP filtering
Approximately 742 million (741, 584, 140) raw reads were produced from 179 sampled individuals of Cryptotaenia. After quality control, filtering, and trimming, 679.72 million high-quality reads were retained. A catalog containing 494, 675, 435 loci was constructed, and 28, 89, 851 loci were genotyped by GSTACKS using the datasets of all Cryptotaenia samples. The mean, minimum, and maximum values for effective per-sample coverage were 34.7×, 15.2×, and 96.1×, respectively. After filtering low-quality loci (minor allele frequency < 0.01; missing rate > 0.5), 5,39,946 unlinked SNPs were eventually identified and used for all subsequent analyses.
3.2 Population variation
Using genome-wide SNP markers, we detected some levels of genetic diversity in C. japonica from East Asia. The values of π ranged from 0.016 to 0.120, and the mean was 0.062; the values of HO ranged from 0.020 to 0.158, and the mean was 0.066; the values of HE ranged from 0.012 to 0.094, and the mean was 0.043; and the values of FIS ranged from −0.095 to 0.051, and the mean was −0.014, including FIS values of 42 populations that were negative (Table 2).
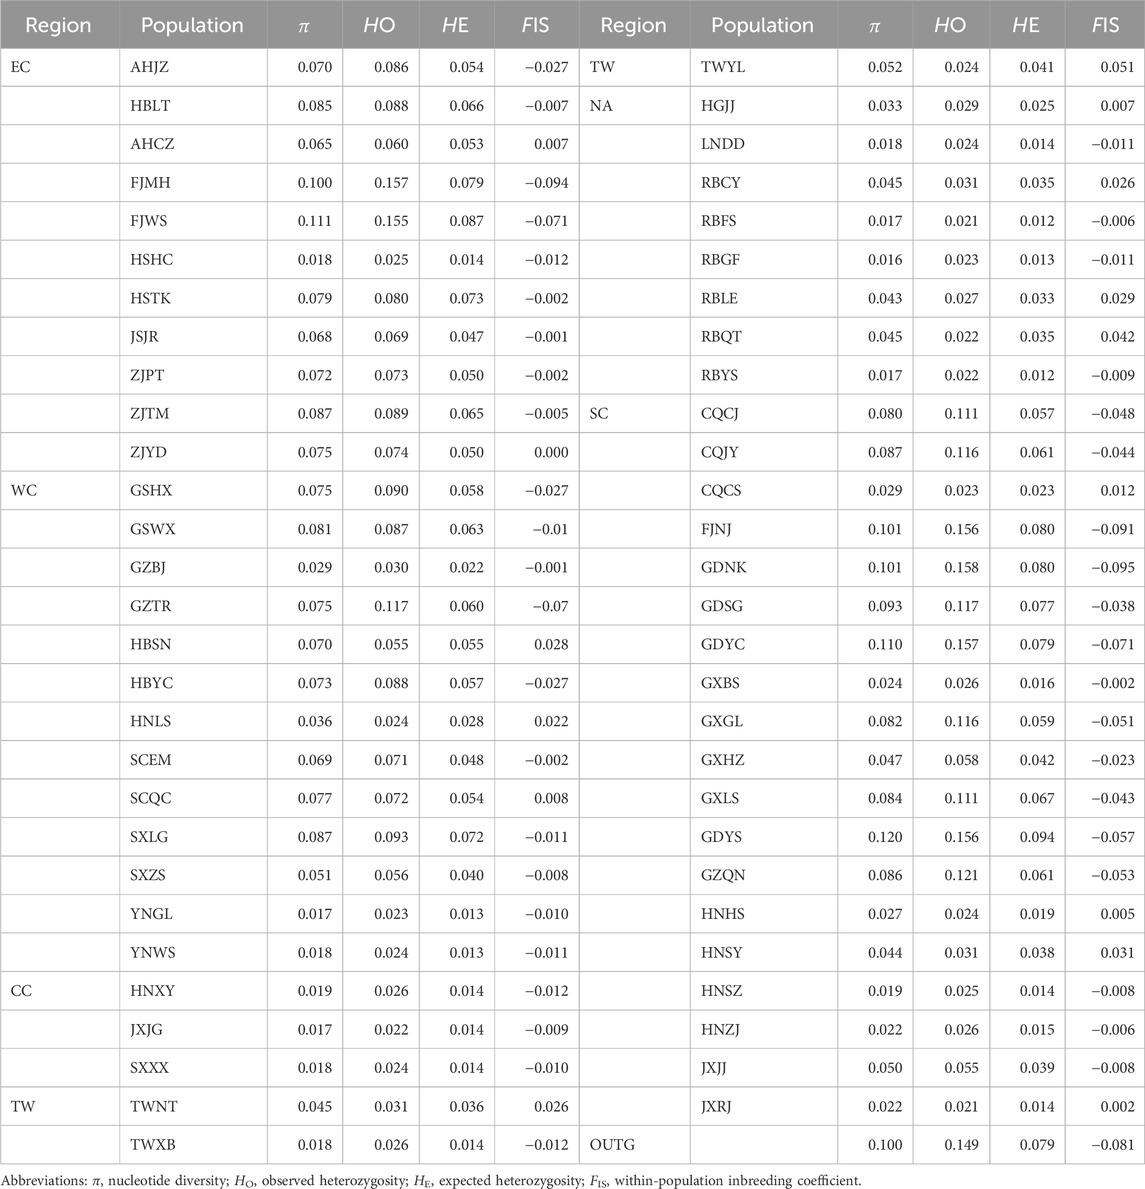
Table 2. Genetic characteristics of the sampled populations.
3.3 AMOVA and mantel test results
For the 57 natural geographical populations of C. japonica, analysis of molecular variance (AMOVA) revealed that most (55.55%) of the observed genetic variation was among the populations (Table 3). However, 44.45% of the total genetic diversity was attributable to within-individual local population variation (p < 0.01), consistent with the significant genetic differentiation among these 57 populations.
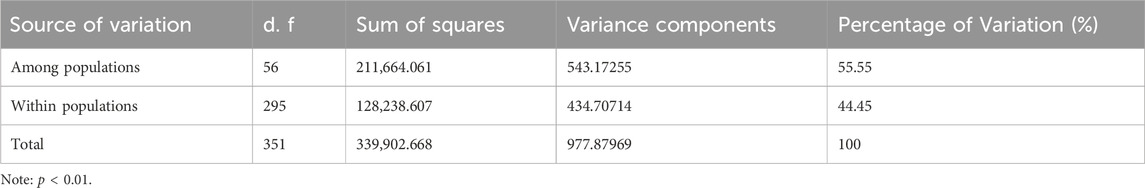
Table 3. AMOVA of genetic variation among 57 populations of C. japonica.
To investigate whether geographic distance contributed to the observed genetic differentiation among the 57 populations, we determined the relationship between geographic distance and genetic distance for all pairs of populations analyzed here using the Mantel test method. The results indicated that there was no significant correlation between genetic distance and geographic distance among the 57 populations (r = −0.004887, P = 0.534) (Figure 4). The results suggested that spatial distance was not an important factor shaping the genetic structure among wild populations of C. japonica. No isolation by distance (IBD) pattern was found in 57 populations (Figure 4).
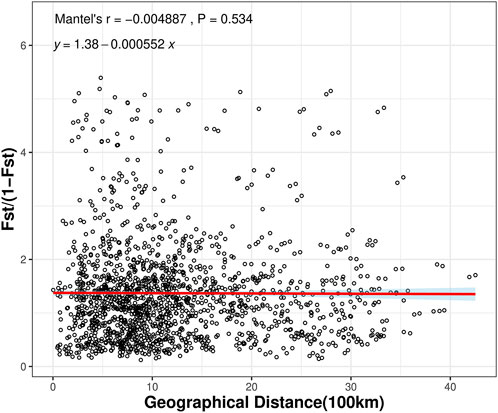
Figure 4. Mantel tests between genetic distance and geographic distance among the C. japonica populations.
3.4 Genetic structure and geographical patterns
To further determine the phylogenetic relationships among these populations, we constructed NJ trees based on SNPs. The NJ trees revealed polyphyly in C. japonica, which could be separated into two clades with moderate posterior support (Figures 5A, B). C. canadensis, representing the outgroup (OUTG) lineage, diverged first from other lineages. Geographically, there was a propensity for serial divergence in C. japonica from southern to northern East Asia. One clade included the SC (South China), NA (Northeast Asia), and TW (Taiwan islands) populations, and the other clade included the EC (East China), WC (West China), and CC (Central China) populations (Figures 2, 5).
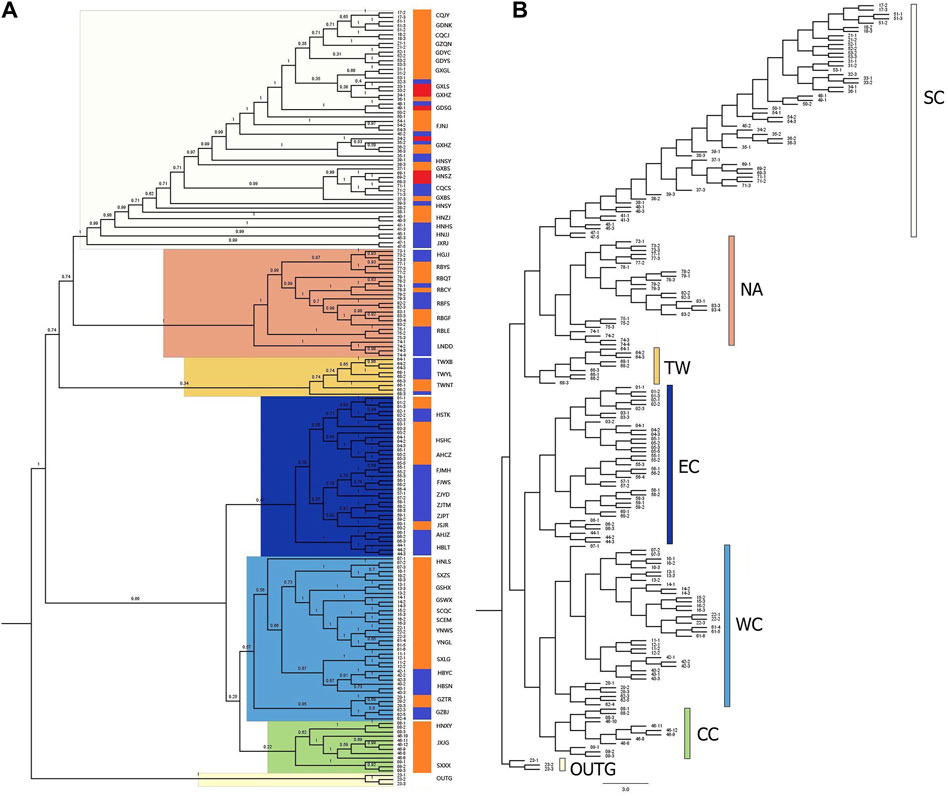
Figure 5. Neighbor-joining (NJ) phylogenetic tree of 176 C. japonica plants with C. canadensis as the OUTG. (A) Consensus NJ-tree with bootstrap values, (B) NJ-tree with branch length. The three color gradient bars in (A) show 3 forms of C. japonica for each individual, where blue indicates C. japonica f. japonica, orange indicates C. japonica f. dissecta, and red indicates C. japonica f. pinnatisecta. The color scheme in (B) also corresponds to the highlights of each branch in (A) and the dot color in Figure 2.
The SC region includes most of southern China (part of Fujian, Guangdong, and Guangxi Provinces) and part of Jiangxi, Hunan and Chongqing Provinces of China, with 19 populations (bootstrap support 100%). The NA region includes part of Northeast China, the Korean Peninsula, and the Japanese Islands, with 8 populations (bootstrap support 100%). The TW region includes the Taiwan Province of China, which has 3 populations (with 34% bootstrap support). The EC region includes parts of Hubei, Anhui, Jiangsu, Zhejiang, and northern Fujian Provinces in China, with 11 populations (47% bootstrap support). The WC region includes part of the Henan, Hubei, Guizhou, Gansu, Shaanxi, Sichuan, and Yunnan Provinces of China, with 13 populations (bootstrap support 57%). Specifically, the CC region includes parts of Jiangxi, Henan and Shanxi Provinces of China, with 3 populations (bootstrap support 22%), where the JXJG population is located in southern Jiangxi Province. The individuals of C. japonica in the SC region had longer branches than the other individuals in the other five regions (Figure 5B).
All the individuals contained in the population are grouped together with their corresponding populations in the CC, WC, and EC regions. However, we also found that individuals 68–3 (TWYL) in the TW region and 53–1 (GDYS), 39–1, 38–3 (HNSY) and 45–2 (JXJJ) in the SC region did not cluster with other individuals in the population. The individuals from the RBCY (79) and RBQT (78) populations are admixed in the NA region branch. In the phylogenetic tree, we still found that the above individuals were still near the respective populations in their regions (Figures 5A, B).
The CC region contains only one form, C. japonica f. dissecta, while WC, EC, TW, and NA contain two forms: C. japonica f. dissecta and C. japonica f. japonica. Similarly, the SC region has three forms: C. japonica f. dissecta, C. japonica f. japonica and C. japonica f. pinnatisecta (Table 1; Figure 6A).
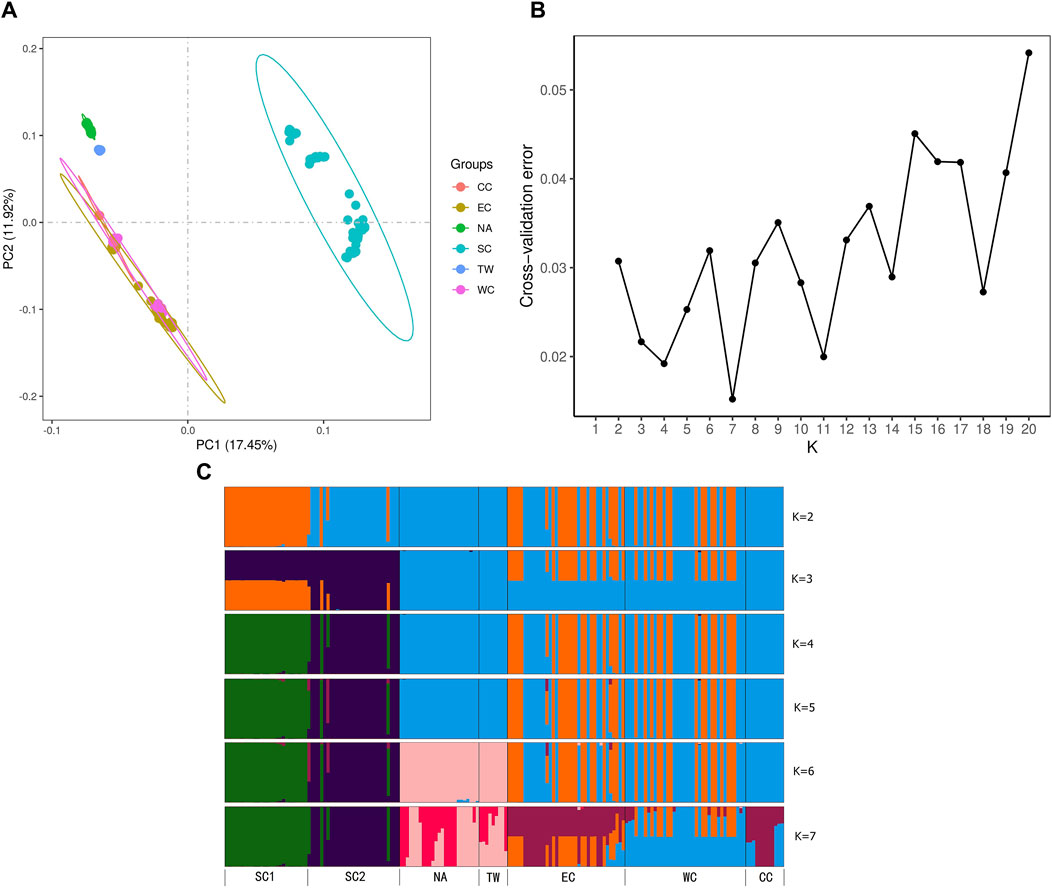
Figure 6. (A) Principal component analysis (PCA) displaying the first two axes (PC1 and PC2). (B) Values of the cross-entropy criterion for numerous clusters ranging from K = 1 to 20. (C) Bar plot of ancestry coefficients for K = 2 to 7. The dtailed information of six regions could be found in Table 1, 2 and Figures 2.
The HSTK population in the EC region has C. japonica f. dissecta (02) and C. japonica f. japonica (01 and 03). The GXLS population in the SC region has japonica f. japonica (32) and C. japonica f. pinnatisecta (33). The GDSG population includes C. japonica f. dissecta (50), C. japonica f. japonica (48) and C. japonica f. pinnatisecta (49). Individuals of different forms originating from the same population are still clustered together in the phylogenetic tree.
The GXHZ population has C. japonica f. dissecta (36), C. japonica f. japonica (35) and C. japonica f. pinnatisecta (34). The HNSY population has C. japonica f. dissecta (38) and C. japonica f. japonica (39). In the GXHZ and HNSY regions, some individuals originating from the same population did not cluster together on the phylogenetic tree, but they still corresponded to individuals from the same population in separate parts and were clustered together, regardless of the form to which they belonged (Table 1; Figure 5A).
3.5 PCA and bar plot of ancestry coefficient results
PCA was performed on six regions, and PC1 vs PC2 identified six groups and explained 17.45% and 11.92% of the variation, respectively (Figure 6A). The EC, CC and WC regions clustered closely together. The TW and NA regions clustered closely together. SC formed one separate group. However, the WC region still had populations embedded in the EC region, while the other populations formed separate groups. The PCA indicated that the genetic relationships among the EC region, CC region and WC region were relatively close. The relationships among these regions were similar to those in the NJ tree results (Figures 5A, B).
To understand the regional genetic structure of the six regions, we used 47,033 unlinked SNPs for STRUCTURE analysis. At K = 2, the NA and CC regions first diverged from the other regions and displayed two independent clusters. This indicates that both of them have relatively independent genetic backgrounds. At K = 3 to 5, the SC region diverged secondarily and had little genetic admixture. Although the optimal K determined for ADMIXTURE analysis was 7, it is noteworthy that the ADMIXTURE outcomes at K = 6 genetic clusters aligned closely with the findings from PCA and NJ analyses (Figures 6B, C). At K = 6, the admixtures of the individuals in the NA and TW regions and the individuals in the EC and WC regions were much closer. However, it is distinct from those of the other regions. In summary, for the relationships between these regions, all three analyses shown above demonstrated similar patterns (Figures 6B, C).
3.6 Genetic diversity and population structure
Based on the six regions, we detected significantly different levels of π between the NA region and the EC region (p = 0.019 < 0.05) and between the NA region and the SC region (p = 0.029 < 0.05) based on Kruskal‒Wallis tests. We detected significantly different levels of HO between the NA region and the EC region (p = 0.012 < 0.05) and between the NA region and the SC region (p = 0.014 < 0.05) based on Kruskal‒Wallis tests. We detected significantly different levels of HE between the NA region and the EC region (p = 0.011 < 0.05) and between the NA region and the SC region (p = 0.027 < 0.05) based on Kruskal‒Wallis tests. There were significantly lower levels of FIS in the SC region (FIS = −0.031) than in the NA region (FIS = 0.008) (p < 0.05), TW region (FIS = 0.022) (p < 0.05), and WC region (FIS = −0.009) (p < 0.05). Furthermore, the FIS values in the TW region (FIS = 0.022) were significantly greater than those in the EC region (FIS = −0.019) (p < 0.05) based on ANOVA.
The pairwise FST values between the 6 regions ranged from 0.133 to 0.722, with all of them being significant (p < 0.05) after sequential Bonferroni correction (Table 4).The pairwise FST values between the populations in the EC region ranged from −0.039 to 0.539, with approximately 4% being significant (p < 0.05) after sequential Bonferroni correction (Supplementary Table S1). All of the significant pairwise comparisons (2 out of 2) involved population HSTK. The average FST value across populations in the EC region was 0.181. The pairwise FST values between the populations in the WC region ranged from −0.003 to 0.909, with none being significant (P < 0.05) after sequential Bonferroni correction (Supplementary Table S2). The average FST value across populations in the WC region was 0.397. Pairwise FST values between the populations in the CC region ranged from 0.828 to 0.854, with none being significant (P < 0.05) after sequential Bonferroni correction (Supplementary Table S3). The average FST value across populations in the CC region was 0.842. The pairwise FST values between the populations in the TW region ranged from 0.258 to 0.580, with none being significant (P < 0.05) after sequential Bonferroni correction (Supplementary Table S4). The average FST value across populations in the NA region was 0.443. The pairwise FST values between the populations in the NA region ranged from −0.006 to 0.911, with approximately 14% being significant (P < 0.05) after sequential Bonferroni correction (Supplementary Table S5). Among the significant pairwise comparisons, the great majority (3 out of 4) involved population LNDD. Due to the geographical distance between the LNDD (located in Northeast China) and the Korean Peninsula and the Japanese archipelago, there was a significant difference in the FST values. The average FST value across populations in the NA region was 0.672. The pairwise FST values between the populations in the self-compatibility region ranged from −0.189 to 0.923, with approximately 3% being significant (P < 0.05) after sequential Bonferroni correction (Supplementary Table S6). Among the significant pairwise comparisons, the great majority (3 out of 5) involved populations GXHZ and HNSY. The average FST value across populations in the SC region was 0.375.
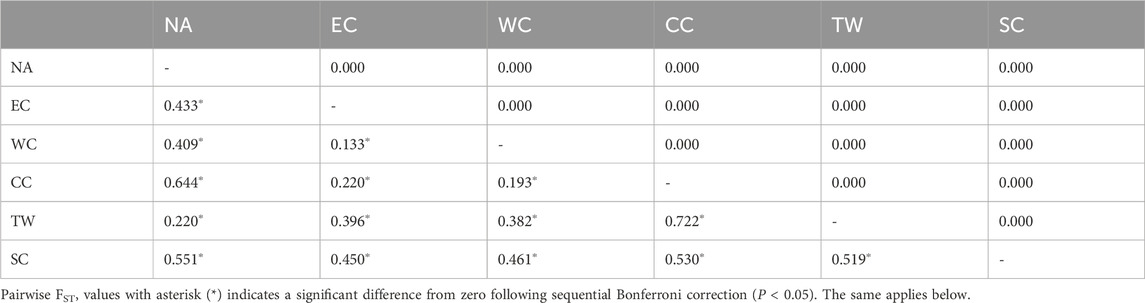
Table 4. Pairwise FST values among the 6 regions of C. japonica: pairwise FST (below diagonal) and P-value after 1,000 permutations (above diagonal).
A comparison of the significant pairwise FST values after sequential Bonferroni correction in the EC, NA, and SC regions revealed that the FST of the EC region was the lowest (0.188, P < 0.05), that of the NA region was the highest (0.806, P < 0.05), and that of the SC region was 0.444 (P < 0.05).
3.7 Historical and contemporary gene flow analysis
The addition of migration events to our ML trees improved the model fit to the data (increased the model log-likelihood and decreased model residuals, but model log-likelihood increases were minimal after three migration events) (Table 5). The first migration event (Figure 7) indicated migration from their common ancestor (except the SC region) to the CC region. The second migration event suggested historical gene flow from their common ancestor to the WC and EC regions. The third migration event suggested occasional, infrequent gene flow from middle latitudes in China (including WC, CC and EC) to EC and WC (Figure 7), which implied historical gene flow in the east‒west direction. The TreeMix results indicated that WC, EC and CC were strongly differentiated from the other regions (Figure 7). These three regions (EC, CC and WC), which are located in the middle latitudes of China, were genetically distinct from the other regions but had greater similarity to the TW and NA regions than to the SC region.
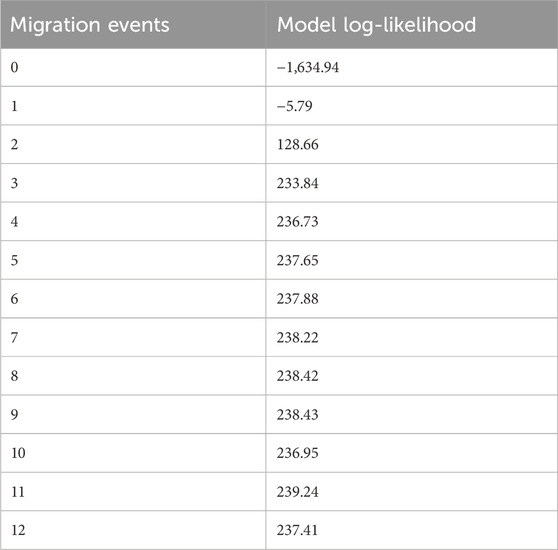
Table 5. Model log-likelihood for TreeMix models with 1–12 migration events.
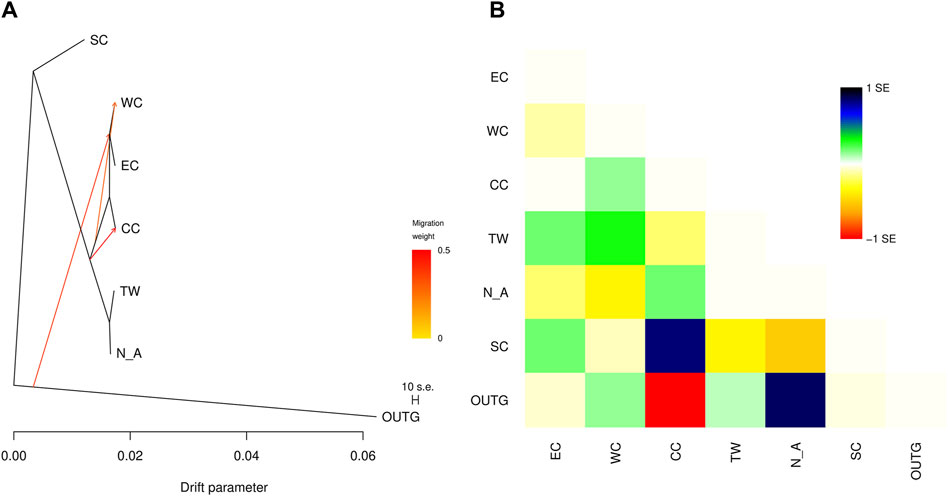
Figure 7. (A) TreeMix graph of the relationships among the sampled C. japonica regions. Migration events corresponding to directional gene flow are indicated by arrows. The arrow color indicates the migration weight, with darker orange indicating a stronger genetic effect on the destination region. (B) Scaled residuals from the fit of the model to the data.
The proportion of populations originating from within each identified region varied from 87.9% to 97.2%, with the highest value found in the SC region and the lowest value found in the EC region (Table 6). Across the six region pairs, migrant ancestry was low (from 0.3% to 9.3%) and nonsignificant (Table 6). The posterior probability values of migration obtained from the run with the lowest estimate of Bayesian deviance suggest strong isolation for all the inferred regions.

Table 6. Matrix of inferred gene flow between genetic regions.
Relative migration analysis of C. japonica using diveRsity software allowed investigation of the strength and direction of gene flow among the six regions. Based on the Jost’s D values, we observed significant asymmetric gene flow patterns in 4 out of the 6 regions. The specific result described indicates stronger migrations within the middle latitudes of East Asia (CC, SC, TW and WC regions) than within the Korean Peninsula, Japanese Archipelago and southern China (NA and SC regions) and relatively limited migration between them (Figure 8A). The EC region appears at the center of the migration network, and there is greater gene flow in this region than out of this region, which suggests that it acts as a sink for the C. japonica populations that emerged from imported gene flow, with limited outbound migration from this region to other regions. In addition, we observed significant asymmetric gene flow from the TW region to the EC and WC regions.
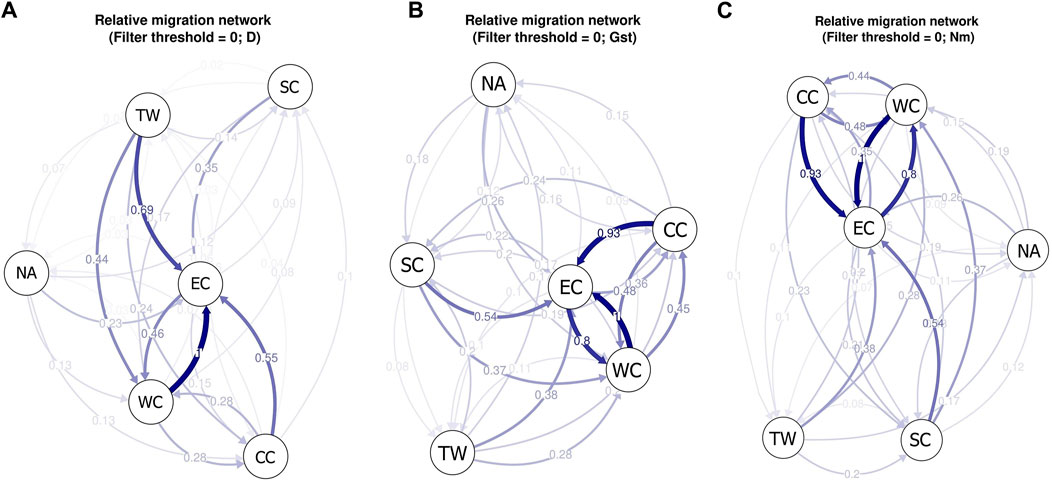
Figure 8. (A) The migration network for C. japonica among different geographic regions based on Jost’s D values; (B) The migration network for C. japonica among different geographic regions based on Nei’s GST values; (C) The migration network for C. japonica among different geographic regions based on Nm values. The arrows indicate the direction of gene flow. The thickness of the arrow indicates the strength of gene flow between different regions, and the number indicates the relative migration value.
Based on Nei’s GST and Nm values, we obtained the same gene flow patterns (Figures 8B, C). The results showed that there was more significant gene flow within mainland East Asia than within the Korean Peninsula, Japanese Archipelago and Taiwan Island and relatively limited migration between them. The main reason may be the isolation between islands and the mainland during species distribution, resulting in a lack of opportunities for gene exchange between them. The SC region also showed lower imported gene flow, and the EC region appeared at the center of the migration network. The obvious difference between gene flow patterns A, B, and C was the absence of significant asymmetric gene flow from the TW region to the EC or WC region.
4 Discussion
The study of genetic diversity and population structure in widespread plants, such as Quercus cerris L. in Europe (Lados et al., 2024), Allium macrostemon Bunge in Japan (Probowati et al., 2023), and Capsicum pubescens Ruiz & Pav. in America (Palombo and Carrizo García, 2022), provides valuable insights into the factors influencing genetic differentiation. These factors include selection pressure, gene flow, and life history (Gamba and Muchhala, 2020). For long-lived species, gene flow among populations can significantly mitigate genetic erosion caused by habitat fragmentation (Fuller and Doyle, 2018). Conversely, short-lived herbs, with their rapid generational turnover, may experience a more pronounced decline in genetic diversity under similar fragmentation conditions (Young et al., 1996). Moreover, plants with abiotic-mediated pollination and seed dispersal are less susceptible to habitat fragmentation than those relying on animal-mediated mechanisms (Sato and Kudoh, 2014; Fontúrbel et al., 2015).
In the case of Cryptotaenia japonica, an annual or biennial herb found in damp forest areas, streams, and ditches, our AMOVA analysis revealed nearly equal genetic variation between and within populations (55.55% and 44.45%, respectively) (Table 3). This finding is consistent with the low and nonsignificant π, HO, HE, and FIS values between populations and pairwise FST values, indicating low genetic differentiation, minimal geographic structure, and high gene flow among C. japonica populations across the studied regions (Tables 1, 3, and 4). Typically, outcrossing species exhibit higher genetic diversity compared to selfing species (Nybom, 2004). The negative inbreeding coefficients (FIS) observed for most populations (Table 2) suggest a lack of common inbreeding within C. japonica populations, which results in lower genetic differentiation but also lower genetic diversity.
Our analysis revealed no clear genetic separation based on geographic distribution for C. japonica populations (Figure 4). Pairwise FST values between populations across regions correlated weakly with geographic distances (Supplementary Tables S1, S5, S6), implying that populations within the same region share similar genetic backgrounds. This pattern is likely due to continuous and similar habitat preferences within geographic units, allowing high gene flow across relatively flat and expansive areas (Mims et al., 2016).
Previous studies have shown that water can significantly aid seed dispersal for wind-dispersed species across fragmented landscapes (Soomers et al., 2012; Yuan et al., 2022). We hypothesize that water flow may similarly facilitate the seed dispersal of C. japonica. Although this hypothesis remains speculative due to the lack of detailed morphological and experimental evidence, the genetic evidence presented here confirms that C. japonica has sufficient seed dispersal capabilities to maintain moderate-to-high levels of gene flow and population connectivity over large spatial and temporal scales.
The discontinuous distribution of C. japonica between mainland China and Taiwan, as well as between mainland China and Japan, can be attributed primarily to geological and climatic history. During the glacial periods of the Pleistocene epoch, lower sea levels resulted in land bridges connecting the Asian mainland to Taiwan and Japan, facilitating plant migration across these regions. Post-ice age sea level rise subsequently submerged these land bridges, isolating mainland plant populations from those on the islands (Harrison et al., 2001; Qiu et al., 2011). Climatic changes, particularly the East Asian Monsoon system, which brings wet summers and dry winters, have also significantly influenced plant distributions. The monsoon’s variable impact across the region, due to topographical differences, has led to diverse microclimates that support genetic differentiation (Qiu et al., 2011).
Gene flow events among the six regions were identified using TreeMix (Figure 7). Notably, strong gene flow was observed from the TW region to the EC region, as indicated by Jost’s D analysis (Figure 8A). The EC region emerged as a central hub for gene flow based on diveRsity gene flow analysis (Jost’s D, Nei’s GST, and Nm), suggesting its role as a genetic “bridge” throughout the East Asian distribution area.
Overall, our findings highlight the complex interplay between genetic diversity, gene flow, and geographic factors in shaping the population structure of C. japonica. The observed high levels of gene flow and low genetic differentiation suggest that C. japonica has maintained connectivity across its range, despite historical and contemporary geographical barriers. This study provides a valuable reference for future research on the genetic diversity of widespread plants in Asia and underscores the importance of considering both historical and contemporary processes in understanding plant population dynamics.
5 Conclusion
This study provides a comprehensive analysis of the genetic diversity and population structure of Cryptotaenia japonica across East Asia. The findings reveal substantial genetic differentiation among populations, with significant variation in genetic diversity metrics across different regions. The lack of isolation by distance suggests that historical and ecological factors may be more influential in shaping the genetic structure of C. japonica populations. These insights contribute to our understanding of the genetic dynamics of widespread plant species in Asia and provide a foundation for future conservation and research efforts.
Data availability statement
The datasets presented in this study can be found in online repositories. The names of the repository/repositories and accession number(s) can be found below: https://www.ncbi.nlm.nih.gov/, PRJNA1051289.
Author contributions
BW: Conceptualization, Funding acquisition, Investigation, Project administration, Resources, Writing–original draft, Writing–review and editing. JW: Data curation, Formal Analysis, Writing–review and editing. RL: Methodology, Software, Writing–review and editing. WZ: Data curation, Writing–review and editing.
Funding
The author(s) declare financial support was received for the research, authorship, and/or publication of this article. This work was funded by the National Natural Science Foundation of China (31,300,166).
Acknowledgments
We would like to thank Kuo-Fang Chung (Biodiversity Research Center, Academia Sinica, Taipei) in Taiwan, David M. Brandenburg and Mark C. Pennell in the United States, Chin Sung in South Korea, and Shota Sakaguchi (Kyoto University, Japan) and Ichiro Tamaki (Gifu Academy of Forest Science and Culture, Japan) in Japan for assisting in the collection of plant materials.
Conflict of interest
The authors declare that the research was conducted in the absence of any commercial or financial relationships that could be construed as a potential conflict of interest.
Publisher’s note
All claims expressed in this article are solely those of the authors and do not necessarily represent those of their affiliated organizations, or those of the publisher, the editors and the reviewers. Any product that may be evaluated in this article, or claim that may be made by its manufacturer, is not guaranteed or endorsed by the publisher.
References
Alexander, D. H., Novembre, J., and Lange, K. (2009). Fast model-based estimation of ancestry in unrelated individuals. Genome Res. 19, 1655–1664. doi:10.1101/gr.094052.109
Cano, M. J., Twyford, A. D., and Hollingsworth, P. M. (2022). Population and conservation genetics using RAD sequencing in four endemic conifers from South America. Biodivers. Conserv. 31, 3093–3112. doi:10.1007/s10531-022-02471-0
Catchen, J., Hohenlohe, P. A., Bassham, S., Amores, A., and Cresko, W. A. (2013). Stacks: an analysis tool set for population genomics. Mol. Ecol. 22, 3124–3140. doi:10.1111/mec.12354
Catchen, J. M., Amores, A., Hohenlohe, P., Cresko, W., and Postlethwait, J. H. (2011). Stacks: building and genotyping loci de novo from short-read sequences. G3 (Bethesda) 1 (3), 171–182. doi:10.1534/g3.111.000240
Chen, S., Li, W., Li, W., Liu, Z., Shi, X., Zou, Y., et al. (2023). Population genetics of Camellia granthamiana, an endangered plant species with extremely small populations in China. Front. Genet. 14, 1252148. doi:10.3389/fgene.2023.1252148
Chen, S., Zhou, Y., Chen, Y., and Gu, J. (2018). fastp: an ultra-fast all-in-one FASTQ preprocessor. Bioinformatics 34, i884–i890. doi:10.1093/bioinformatics/bty560
Danecek, P., Auton, A., Abecasis, G., Albers, C. A., Banks, E., DePristo, M. A., et al. (2011). The variant call format and VCFtools. Bioinformatics 27, 2156–2158. doi:10.1093/bioinformatics/btr330
Excoffier, L., Laval, G., and Schneider, S. (2005). Arlequin (version 3.0): an integrated software package for population genetics data analysis. Evol. Bioinform Online. 4, 117693430500100. doi:10.1177/117693430500100003
Fontúrbel, F. E., Jordano, P., and Medel, R. (2015). Scale-dependent responses of pollination and seed dispersal mutualisms in a habitat transformation scenario. J. Ecol. 103, 1334–1343. doi:10.1111/1365-2745.12443
Fuller, M. R., and Doyle, M. W. (2018). Gene flow simulations demonstrate resistance of long-lived species to genetic erosion from habitat fragmentation. Conserv. Genet. 19, 1439–1448. doi:10.1007/s10592-018-1112-5
Gamba, D., and Muchhala, N. (2020). Global patterns of population genetic differentiation in seed plants. Mol. Ecol. 29, 3413–3428. doi:10.1111/mec.15575
Goslee, S. C. (2009). Correlation analysis of dissimilarity matrices. Plant Ecol. 206, 279–286. doi:10.1007/s11258-009-9641-0
Goslee, S. C., and Urban, D. L. (2007). The ecodist package for dissimilarity-based analysis of ecological data. J. Stat. Soft. 22, 1–19. doi:10.18637/jss.v022.i07
Harrison, S. P., Yu, G., Takahara, H., and Prentice, I. C. (2001). Palaeovegetation. Diversity of temperate plants in east Asia. Nature 413 (6852), 129–130. doi:10.1038/35093166
He, Z., Yao, Z., Wang, K., Li, Y., and Liu, Y. (2023). Genetic structure and differentiation of endangered Cycas species indicate a southward migration associated with historical cooling events. Divers. (Basel). 15, 643. doi:10.3390/d15050643
Hu, L., Le, X.-G., Zhou, S.-S., Zhang, C.-Y., Tan, Y.-H., Ren, Q., et al. (2022). Conservation significance of the rare and endangered tree species, Trigonobalanus doichangensis (fagaceae). Divers. (Basel). 14, 666. doi:10.3390/d14080666
Keenan, K., McGinnity, P., Cross, T. F., Crozier, W. W., and Prodöhl, P. A. (2013). diveRsity: an R package for the estimation and exploration of population genetics parameters and their associated errors. Methods Ecol. Evol. 4, 782–788. doi:10.1111/2041-210x.12067
Lados, B. B., Cseke, K., Benke, A., Köbölkuti, Z. A., Molnár, C. É., Nagy, L., et al. (2024). ddRAD-seq generated genomic SNP dataset of Central and Southeast European Turkey oak (Quercus cerris L.) populations. Genet. Resour. Crop Evol. doi:10.1007/s10722-024-01889-5
Li, W., Liu, L., Wang, Y., Zhang, Q., Fan, G., Zhang, S., et al. (2020). Genetic diversity, population structure, and relationships of apricot (Prunus) based on restriction site-associated DNA sequencing. Hortic. Res. 7, 69. doi:10.1038/s41438-020-0284-6
Liou, S. L. (1990). New taxa of umbelliferae from China(in Chinese). Acta Phytotaxon. Sin. 8 (2), 145–152.
Lu, Z.-J., Wang, T.-R., Zheng, S.-S., Meng, H.-H., Cao, J.-G., Song, Y.-G., et al. (2024). Phylogeography of Pterocarya hupehensis reveals the evolutionary patterns of a Cenozoic relict tree around the Sichuan Basin. For. Res. 4, 0. doi:10.48130/forres-0024-0005
Mims, M. C., Hauser, L., Goldberg, C. S., and Olden, J. D. (2016). Genetic differentiation, isolation-by-distance, and metapopulation dynamics of the Arizona treefrog (Hyla wrightorum) in an isolated portion of its range. PLoS ONE 11, e0160655. doi:10.1371/journal.pone.0160655
Mussmann, S. M., Douglas, M. R., Chafin, T. K., and Douglas, M. E. (2019). BA3-SNPs: contemporary migration reconfigured in BayesAss for next-generation sequence data. Methods Ecol. Evol. 10, 1808–1813. doi:10.1111/2041-210x.13252
Nybom, H. (2004). Comparison of different nuclear DNA markers for estimating intraspecific genetic diversity in plants. Mol. Ecol. 13, 1143–1155. doi:10.1111/j.1365-294x.2004.02141.x
Okuno, Y., Marumoto, S., and Miyazawa, M. (2017). Comparison of essential oils from three kinds of Cryptotaenia japonica Hassk (kirimitsuba, nemitsuba, and itomitsuba) used in Japanese food. J. Oleo Sci. 66, 1273–1276. doi:10.5650/jos.ess17133
Palombo, N. E., and Carrizo García, C. (2022). Geographical patterns of genetic variation in locoto Chile (Capsicum pubescens) in the americas inferred by genome-wide data analysis. Plants 11, 2911. doi:10.3390/plants11212911
Pan, Z. H., and Watson, M. F. (2005). “Cryptotaenia de Candolle,” in Flora of China vol 14. Editors Z. Y. Wu, and H. R. Peter (Beijing: Sciense Press), 80. St.Louis: Missouri Botanical Garden Press.
Paris, J. R., Stevens, J. R., and Catchen, J. M. (2017). Lost in parameter space: a road map for stacks. Methods Ecol. Evol. 8, 1360–1373. doi:10.1111/2041-210x.12775
Phillips, R. D., Dixon, K. W., and Peakall, R. (2012). Low population genetic differentiation in the Orchidaceae: implications for the diversification of the family. Mol. Ecol. 21, 5208–5220. doi:10.1111/mec.12036
Pickrell, J. K., and Pritchard, J. K. (2012). Inference of population splits and mixtures from genome-wide allele frequency data. PLoS Genet. 8, e1002967. doi:10.1371/journal.pgen.1002967
Probowati, W., Koga, S., Harada, K., Nagano, Y., Nagano, A. J., Ishimaru, K., et al. (2023). RAD-Seq analysis of wild Japanese garlic (Allium macrostemon Bunge) growing in Japan revealed that this neglected crop was previously actively utilized. Sci. Rep. 13 (1), 16354. doi:10.1038/s41598-023-43537-5
Qiu, Y.-X., Fu, C.-X., and Comes, H. P. (2011). Plant molecular phylogeography in China and adjacent regions: tracing the genetic imprints of Quaternary climate and environmental change in the world’s most diverse temperate flora. Mol. Phylogenet. Evol. 59, 225–244. doi:10.1016/j.ympev.2011.01.012
Rispail, N., Wohor, O. Z., Osuna-Caballero, S., Barilli, E., and Rubiales, D. (2023). Genetic diversity and population structure of a wide Pisum spp. core collection. IJMS 24, 2470. doi:10.3390/ijms24032470
Rochette, N. C., and Catchen, J. M. (2017). Deriving genotypes from RAD-seq short-read data using Stacks. Nat. Protoc. 12, 2640–2659. doi:10.1038/nprot.2017.123
Rochette, N. C., Rivera-Colón, A. G., and Catchen, J. M. (2019). Stacks 2: analytical methods for paired-end sequencing improve RADseq-based population genomics. Mol. Ecol. 28, 4737–4754. doi:10.1111/mec.15253
Ruang-areerate, P., Sonthirod, C., Sangsrakru, D., Waiyamitra, P., Maknual, C., Wanthongchai, P., et al. (2023). Elucidating SNP-based population structure and genetic diversity of Bruguiera gymnorhiza (L.) Savigny in Thailand. Forests 14, 693. doi:10.3390/f14040693
Sato, Y., and Kudoh, H. (2014). Fine-scale genetic differentiation of a temperate herb: relevance of local environments and demographic change. AoB PLANTS 6, plu070. doi:10.1093/aobpla/plu070
Shan, R. H., and Sheh, M. L. (1985). “Cryptotaenia,” in Editorial committee flora reipublicae popularis sinicae vol. 55 (Beijing: Science Press), 19–20. pt. 2.
Shekhovtsov, S. V., Shekhovtsova, I. N., and Kosterin, O. E. (2022). Genotyping-by-Sequencing analysis shows that siberian lindens are nested within Tilia cordata mill. Divers. (Basel). 14, 256. doi:10.3390/d14040256
Slovák, M., Melichárková, A., Gbúrová Štubňová, E., Kučera, J., Mandáková, T., Smyčka, J., et al. (2022). Pervasive introgression during rapid diversification of the European mountain genus Soldanella (L.) (primulaceae). Syst. Biol. 72 (3), 491–504. doi:10.1093/sysbio/syac071
Soomers, H., Karssenberg, D., Soons, M. B., Verweij, P. A., Verhoeven, J. T. A., and Wassen, M. J. (2012). Wind and water dispersal of wetland plants across fragmented landscapes. Ecosystems 16, 434–451. doi:10.1007/s10021-012-9619-y
Spalik, K., and Downie, S. R. (2007). Intercontinental disjunctions in Cryptotaenia (Apiaceae, Oenantheae): an appraisal using molecular data. J. Biogeogr. 34, 2039–2054. doi:10.1111/j.1365-2699.2007.01752.x
Tamura, K., Stecher, G., and Kumar, S. (2021). MEGA11: molecular evolutionary genetics analysis version 11. Mol. Biol. Evol. 38, 3022–3027. doi:10.1093/molbev/msab120
Tang, L., Duan, J., Cai, Y., Wang, W., and Liu, Y. (2024). Low genetic diversity and small effective population size in the endangered Hopea reticulata (Dipterocarpaceae) on Hainan Island, China. Glob. Ecol. Conserv. 50, e02846. doi:10.1016/j.gecco.2024.e02846
Wang, Q., and Zhang, H.-X. (2022). Population genetic structure and biodiversity conservation of a relict and medicinal subshrub Capparis spinosa in arid central Asia. Divers. (Basel) 14, 146. doi:10.3390/d14020146
Waqar, Z., Moraes, R. C. S., Benchimol, M., Morante-Filho, J. C., Mariano-Neto, E., and Gaiotto, F. A. (2021). Gene flow and genetic structure reveal reduced diversity between generations of a tropical tree, Manilkara multifida penn., in atlantic forest fragments. Genes 12, 2025. doi:10.3390/genes12122025
Wilson, G., and Rannala, B. (2003). Bayesian inference of recent migration rates using multilocus genotypes. Genetics 163, 1177–1191. doi:10.1093/genetics/163.3.1177
Wu, B., Liu, Q., Zhou, W., and Song, C. (2014). Analysis on contents of nutritional components and mineral elements of Cryptotaenia plants in Apiaceae(In Chinese). J. Plant Resour. Environ. 23, 114–116.
Yang, J., Lee, S. H., Goddard, M. E., and Visscher, P. M. (2011). GCTA: a tool for genome-wide complex Trait analysis. Am. J. Hum. Genet. 88, 76–82. doi:10.1016/j.ajhg.2010.11.011
Young, A., Boyle, T., and Brown, T. (1996). The population genetic consequences of habitat fragmentation for plants. Trends. Ecol. Evol. 11, 413–418. doi:10.1016/0169-5347(96)10045-8
Yuan, N., Wei, S., Comes, H. P., Luo, S., Lu, R., and Qiu, Y. (2022). A comparative study of genetic responses to short- and long-term habitat fragmentation in a distylous herb Hedyotis chyrsotricha (rubiaceae). Plants 11, 1800. doi:10.3390/plants11141800
Yuan, R., Li, J., Ma, X., Feng, Z., Xing, R., Chen, S., et al. (2023). Investigation of phylogenetic relationships within Saxifraga diversifolia complex (Saxifragaceae) based on restriction-site associated DNA sequence markers. Ecol. Evol. 13 (11), e10675. doi:10.1002/ece3.10675
Keywords: RAD-seq, Cryptotaenia japonica, Apiaceae , genetic diversity, population structure, gene flow, SNP, dd-RAD sequencing
Citation: Wu B, Wen J, Lu R and Zhou W (2024) Genetic diversity, population structure, and phylogenetic relationships of a widespread East Asia herb, Cryptotaenia japonica Hassk. (Apiaceae) based on genomic SNP data generated by dd-RAD sequencing. Front. Genet. 15:1368760. doi: 10.3389/fgene.2024.1368760
Received: 11 January 2024; Accepted: 02 August 2024;
Published: 14 August 2024.
Edited by:
Gyaneshwer Chaubey, Banaras Hindu University, IndiaReviewed by:
Zhi Chao, Southern Medical University, ChinaBruno Rossini, São Paulo State University, Brazil
Copyright © 2024 Wu, Wen, Lu and Zhou. This is an open-access article distributed under the terms of the Creative Commons Attribution License (CC BY). The use, distribution or reproduction in other forums is permitted, provided the original author(s) and the copyright owner(s) are credited and that the original publication in this journal is cited, in accordance with accepted academic practice. No use, distribution or reproduction is permitted which does not comply with these terms.
*Correspondence: Baocheng Wu, d3ViYW9jaGVuZzIwMTVAMTYzLmNvbQ==