 Muhammad Yasir Nawaz
 Rodrigo Pelicioni Savegnago1
 Dajeong Lim
 Seung Hwan Lee
 Cedric Gondro
95% of researchers rate our articles as excellent or good
Learn more about the work of our research integrity team to safeguard the quality of each article we publish.
Find out more
ORIGINAL RESEARCH article
Front. Genet. , 02 August 2024
Sec. Livestock Genomics
Volume 15 - 2024 | https://doi.org/10.3389/fgene.2024.1368710
This article is part of the Research Topic Omics Applied to Livestock Genetics,volume II View all 16 articles
In this study, we detected signatures of selection in Hanwoo and Angus beef cattle using allele frequency and haplotype-based methods based on imputed whole genome sequence variants. Our dataset included 13,202 Angus animals with 10,057,633 imputed SNPs and 10,437 Hanwoo animals with 13,241,550 imputed SNPs. The dataset was subset down to 6,873,624 SNPs in common between the two populations to identify within population (runs of homozygosity, extended haplotype homozygosity) and between population signals of selection (allele fixation index, extended haplotype homozygosity). Assuming these selection signals were complementary to each other, they were combined into a decorrelated composite of multiple signals to identify regions under selection for each of the breeds. 27 genomic regions spanning 25.15 Mb and harboring 360 genes were identified in Angus on chromosomes 1,3, 4, 5, 6, 7, 8, 12, 13, 14, 16, 20, 21 and 28. Similarly, in Hanwoo, 59 genes and 17 genomic regions spanning 5.21 Mb on chromosomes 2, 4, 5, 6, 7, 8, 9, 10, 13, 17, 20 and 24 were identified. Apart from a small region on chromosome 13, there was no major overlap of selection signals between the two breeds reflecting their largely different selection histories, environmental challenges, breeding objectives and breed characteristics. Positional candidate genes identified in selected genomic regions in Angus have been previously associated with growth, immunity, reproductive development, feed efficiency and adaptation to environment while the candidate genes identified in Hanwoo included important genes regulating meat quality, fat deposition, cholesterol metabolism, lipid synthesis, neuronal development, and olfactory reception.
Natural selection is an adaptive response to the environment a population inhabits, which drives its evolutionary changes by favoring traits that are advantageous and increases their prevalence in the population. Very recently, at least on an evolutionary scale, human driven artificial selection has also become a primary driver of changes in populations by exerting selective pressure on traits of human interest. A prime example of artificial selection is dog breeding: dogs have been bred for various desireable characteristics which led to a wide variety of breeds from the tiny Chihuahua to the massive Great Dane. Such selection processes change allele frequencies in populations and leave traceable marks across the genome. Genomic regions under selective pressure can be identified by their allele frequency distributions, measures of linkage disequilibrium between loci and the structure of their haplotypes. Identification of these genetic patterns or signatures of selection (SOS) help us understand the underlying biological processes of adaptation in different environments and provide insights into the domestication history of agricultural species. They can also help us identify genes or genomic regions that regulate the phenotypic expression of traits of economic importance. For example, studies of signatures of selection have been used to identify genes that regulate coat color and body size in dogs (Pollinger et al., 2005; Sutter et al., 2007), stature in horses (Makvandi-Nejad et al., 2012), and body temperature maintenance under cold stress in cattle (Igoshin et al., 2019). Randhawa et al. (2016) published a meta-assembly of selection signatures in cattle genome by combining results from various studies. They found that a number of selection hotspots have been identified in European cattle but studies on major cattle groups like Zebu, African and Composite cattle have been few. They also observed that most of the selection signals were unique for each breeds while some were shared across breeds. The most prominent peaks were observed in genes of known major effects like coat color, polled locus and muscle hypertrophy.
Various methods have been proposed to identify genomic signatures of selection which can be broadly classified into two main categories: within population measures for a single population (e.g., runs of homozygosity and integrated haplotype score) or between population measures that compare two or more populations (e.g., fixation index and cross-population extended haplotype homozygosity). Each of these test statistics explore unique facets of the genomic architecture of populations but they are not necessarily consistent with each other. Inconsistencies between selection sweeps are observed not only due to the inherent differences in statistical methodologies but also due to differential sensitivity to sampling, demographic history and linkage disequilibrium between loci (Ewing and Jensen, 2016). Therefore, some studies take a more conservative approach and only focus on the regions that are common across different measures, albeit at the risk of not identifying a proportion of the relevant signals in the process. An alternative approach is to consider the selection signals from different methods as complimentary to each other (Ma et al., 2015) and combine them to get a composite score (Randhawa et al., 2014). Various methods to combine individual signals have already been proposed in the literature (Grossman et al., 2010; Utsunomiya et al., 2013b; Randhawa et al., 2014; Ma et al., 2015). Initial approaches to combine the signals did not account for the covariance structure between signals but Ma et al. (2015) suggested a new approach to calculate a decorrelated composite of multiple signals (DCMS) that adjusted for correlations between signals and was more powerful to detect selected regions in the genome.
This study focused on the identification of signatures of selection in Angus and Hanwoo cattle. Both are beef cattle breeds, but they have been subjected to entirely different selection pressures and have different genetic population structures, body characteristics, domestication history, beef quality and breeding program objectives. Hanwoo are Korean taurine cattle, more related to Asian taurine cattle like Japanese Wagyu than to western taurine cattle breeds (Angus, Hereford, etc.) (Lee et al., 2014). Hanwoo have a smaller stature than Angus, but its beef is popular for its juiciness, high levels of marbling, and unique flavor (Cho et al., 2010); which, similarly to Wagyu, attracts a market premium. Hanwoo was historically a draft breed kept by small holder farmers which accounted for more than 99% of the farms in Korea until 1985. Hanwoo steers are typically kept up to 30–32 months of age to improve the marbling score. In 1960s, various breed improvement initiatives were taken in Korea. The recent advances in management of beef production have also led to an increase in the size of beef operations in Korea. Currently, the selection index of the Korean Proven Bulls program is mainly driven by 4 traits–marbling score (MS), carcass weight (CWT), eye muscle area (EMA) and back fat thickness (BF). Consequently, Hanwoo have shown considerable improvement in beef quality. Angus, on the other hand, are European taurine cattle that originated from Scotland. Angus have been intensively selected for growth, stature and feed intake in the 20th century and have become the most common beef cattle in the world. Angus are characterized by their high muscularity, fast growth rate, medium height, and moderate levels of intramuscular fat (Albertí et al., 2008). In contrast to Hanwoo, different selection indices are used in Angus cattle breeding programs worldwide depending on the type of beef production operation and its breeding objectives. The average age at slaughter varies between 12 and 20 months depending on whether the calves are weaned and sent directly to a feeding facility to be finished for slaughter or they are grown on grass pastures at first, followed by a high-energy diet for a short period of time (100–120 days) before slaughter. Therefore, due to stark differences in evolutionary origin, artificial selection, farming systems, and body characteristics, differences in genomic landscape between them may point to genetic basis of adaptive traits and meat production.
The objectives of this study were to identify genome wide signals of selection in Angus and Hanwoo beef cattle using imputed whole genome sequence (WGS) data. We used imputed whole genome sequence data for this analysis to get a higher resolution of selected genomic regions. We also combined individual selection measures to obtain a decorrelated composite of multiple signals (DCMS) for identification of selected genomic regions. These signatures of selection were then mapped to the ARS-UCD1.2 reference assembly to identify candidate genes located in these regions. We also highlight important genes related to meat production and quality.
Imputed whole genome genotypes of 10,437 Hanwoo animals (13,241,550 SNPs) and 13,202 Angus animals (10,057,633 SNPs) were utilized for this analysis. Respectively, the Hanwoo and Angus data consisted of 9,160 and 11,632 animals genotyped on 50k arrays (Illumina Bovine SNP50 BeadChip; Illumina, San Diego, CA), 1,704 and 1,236 animals genotyped on 700k arrays (777k SNP, Illumina Bovine HD Beadchip, Illumina, San Diego, CA), and 203 and 334 reference animals with whole genome sequence (WGS) data. All Hanwoo animals originated from commercial farms in Korea while Angus data was collected from commercial farms primarily in the US. Sequence analysis was performed using integrated variant discovery pipeline (https://github.com/rodrigopsav/IVDP) to call variants. The key steps in the pipeline include read trimming and adapter removal by trimmomatic, read alignment to ARS-UCD1.2 Bos taurus assembly using bwa-mem2, duplicated read marking by sambamba-markdup, base quality recalibration using GATK BaseRecalibratorSpark and ApplyBQSRSpark and variant calling using GATK HaplotypeCaller. Sequenced animals were used a reference to impute genotype data of their respective breeds. Eagle software version 2.3.2 and Minimac3 was used for phasing and imputation respectively. Details on quality control, WGS pipeline and imputation accuracies for Hanwoo were previously reported in Nawaz et al., 2022. Finally, Imputed whole genome data was subset down to the 6,873,624 SNPs that were common between the two breeds to calculate across population measures of selection.
We performed principal component analysis on the combined dataset containing all Angus and Hanwoo animals using plink 1.9 to evaluate population structure in the data. Various selection signals were calculated as explained below.
Runs of homozygosity (ROH) are defined as long continuous homozygous genomic regions that are assumed to be identical DNA segments inherited by descent from a common ancestor, and that serve as an indicator of genomic autozygosity, consanguinity, selection, and population size reduction. ROH detection was done using the homozyg function in plink using the default parameters except for the number of SNPs in a scanning window (homozyg-window-snp) which was increased to 100 instead of default 50 SNPs because of the high density of SNPs in the sequence data. Default values were used for all the other required parameters in homozyg function.
To identify ROH islands, we calculated the autozygosity of each SNP by taking the proportion of individuals in which a SNP was identified within a ROH region.
Integrated haplotype score (iHS) aims to identify genomic regions that were under recent positive selection based on the relationship between an allele’s frequency and the extent of linkage disequilibrium around it. iHS was calculated (Voight et al., 2006) based on extended haplotype homozygosity (EHH) values (Sabeti et al., 2002) calculated using the program hapbin (Maclean et al., 2015). Due to the high dimensionality of our data and computational limitations of the software, the analysis was performed by dividing both Hanwoo and Angus datasets into seven and 14 bins containing 1491 and 943 animals per bin, respectively. The correlation of iHS between sample bins ranged from 0.86 to 0.93. Final values of iHS were calculated by taking the average of iHS values from the data bins. Absolute values of iHS were smoothed out in windows of 1,001 SNPs to identify regions under recent positive selection.
Fixation Index (FST) is a measure of population differentiation. It represents the proportion of total genetic variance that exists within a sub population. Allele frequencies of Angus and Hanwoo datasets were calculated using freq function in plink. Average of Angus and Hanwoo allele frequencies were used as the baseline allele frequency (
To identify prominent genomic regions, FST was smoothed in windows of 1,001 SNPs using runmed function in base R.
Across population extended haplotype homozygosity (XPEHH) (Sabeti et al., 2007) is another population differentiation-based test that is used to detect selective sweeps in which selected regions are close to fixation in one population but remain polymorphic in another population. For XPEHH, we compared the two breeds under study (Angus and Hanwoo) directly against each other to identify regions that were differentially selected between populations. We used the hapbin software (Maclean et al., 2015) to perform this analysis with the xpehh function.
In order to combine the several test statistics, we used the method suggested by Ma et al. (Ma et al., 2015) that takes into account correlations between signals to calculate a decorrelated composite of multiple signals (DCMS) based on their p values. Firstly, fractional ranks of autozyosity and absolute values of ROH, iHS, FST and XPEHH were used to calculate their p values using stat_to_p-value function in R package MINOTAUR (with parameters two.tailed = FALSE, right.tailed = TRUE). Then, a pairwise correlation matrix was created between absolute values of the signals. This matrix was used as an input to DCMS function in MINOTAUR to calculate raw DCMS scores as follows (Ma et al., 2015):
A Bos taurus gene annotation dataset which included positional information for all known bovine genes (n = 27,900) mapped to the latest bovine assembly (ARS_UCD1.2) was downloaded from ensemble with BIOMART. Significant genomic regions were mapped to genes using the GenomicRanges package in R (Lawrence et al., 2013).
The observed heterozygosity in Angus and Hanwoo cattle was 0.30 and 0.31 respectively. Principal component analysis revealed that Angus and Hanwoo animals clearly clustered separately from each other in tight clusters (Figure 1). The first principal component separated the two populations and accounted for 65.1% of genomic variation in the dataset. The second principal component captured variation in Angus animals which accounted for only 5.4% of the total genomic variation in the dataset. These results indicate that majority of the genomic variation in the dataset can be explained by the differences in genomic architecture of the two breeds.
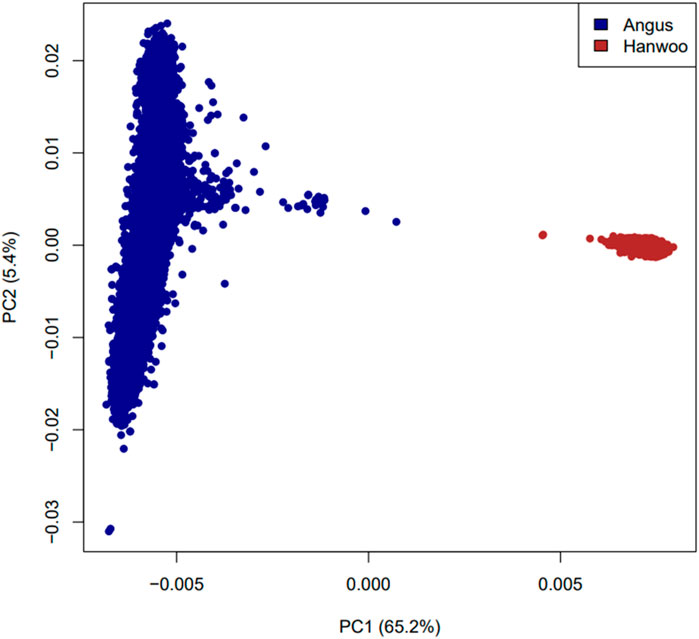
Figure 1. Plot of first two principal components based on a relationship matrix constructed from 6,873,624 SNPs common between Angus and Hanwoo.
ROH: The mean number of ROH detected per animal was higher in Angus (88.7 ± 18.50) as compared to Hanwoo (12.5 ± 8.4) (Table 1). The median length of ROH regions was also higher in Angus (1,565 BP) as compared to Hanwoo (1,384 BP). However, the proportion of ROH regions longer than 5 MB was higher in Hanwoo (12.5%) than Angus (7.1%). Therefore, Hanwoo had fewer ROH regions, but they were longer than in Angus suggesting a comparatively more recent selection in Hanwoo. Mean genome wide autozygosity was higher in Angus (0.08) as compared to Hanwoo (0.01). The highest peak for Hanwoo was observed on CHR 7 (BP 50280340) and smaller peaks were observed on CHR 2, 12, 23, 24 and 29. In Angus, the strongest signal was observed on CHR 13 (BP 63,854,457). Other significant peaks were also identified on CHR 8 and 14.
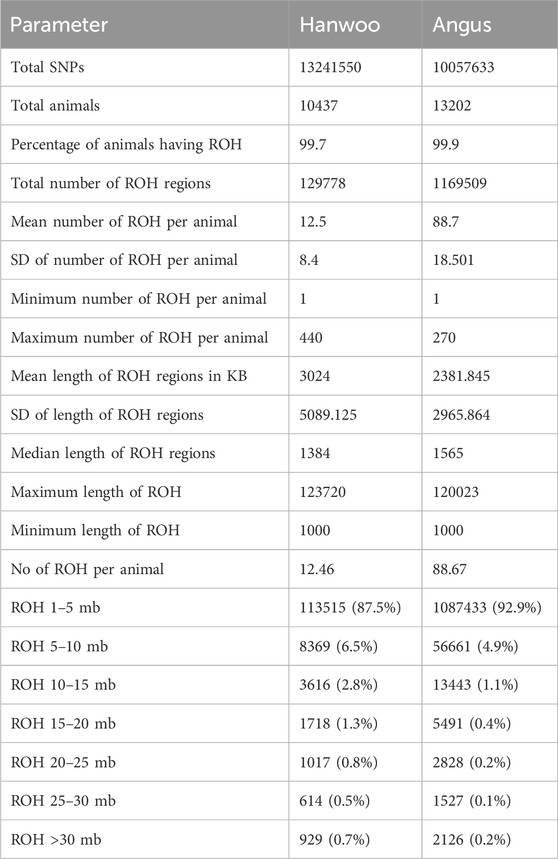
Table 1. Summary of results from runs of homozygosity analysis for Hanwoo and Angus cattle.
iHS: Genome wide distribution of absolute iHS values was similar in Hanwoo and Angus with a mean of 0.31 and 0.30 respectively. Absolute value of iHS indicated genomic regions with unusually long haplotypes on chromosomes 1, 5, 6, 8, 10, 11, 13, 16, 17, 20, 23, 24 and 29 in Angus harboring 13,009 significant SNPs. The strongest signal was detected on CHR 16 (rs208273139) at 40,588,657 BP. In Hanwoo, the strongest signal was observed on chromosome 2 at (rs207720085) 82,874,034 BP. Other peaks were observed on chromosomes 1, 2, 3, 5, 6, 7, 8, 9, 14, 17, 20, 25 and 26 harboring 13,030 significant SNPs. Correlation between iHS values of Angus and Hanwoo was 0.016 indicating differences in the regions of selection sweeps between the two breeds.
We also observed that ROH and iHS were significantly correlated (R = 0.252, 95% confidence interval 0.251–0.253) in Hanwoo and Angus (R = 0.286, 95% interval 0.286–0.287).
Fixation index FST: SNPs with an FST value in the top 0.2% were identified on 18 out of 29 autosomes indicating widespread allele frequency differences between breeds. CHR 4 contained the highest number of significant SNPs (n = 1,577) followed by CHR 8 (n = 1,464) and CHR 5 (n = 1,256). The most significant SNP (rs209900249) was observed on CHR 4 position 69,682,473. Other prominent FST hotspots were observed on CHR 1, 2, 3, 6, 7, 9, 10, 13, 14, 16, 18, 20, 21, 28, and 29.
Across population extended haplotype homozygosity (XPEHH): 13,004 SNPs with top 0.2% XPEHH values were located on CHR 3 (n = 2,216), 8 (n = 4,826), 13 (n = 4,115) and 14 (n = 1,847). The most significant peak was observed on CHR 13 at position 62,594,885 (rs207508467).
We also observed that the two measures of across population measures were significantly correlated, Pearson correlation R = 0.2956 and a 95% confidence interval 0.295–0.296.
Angus: A total of 39,898 SNPs were identified with significant p-values. Genic SNPs accounted for 27.49% of all the significant SNPs. 27 significant genomic regions were identified using the DCMS adjusted p-value (q value) cutoff of 0.05. The mean length of selected regions was 931.613 Kb (±1,255.33) while their total length was 25.153 Mb. The significant genic regions mapped to CHR 1,3, 4, 5, 6, 7, 8, 12, 13, 14, 16, 20, 21, and 28 (Figures 2, 3) that harbor 360 genes (Table 2). The most significant genomic selection signal was observed on CHR 13 where 91 genes were found spread across 3 distinct regions.
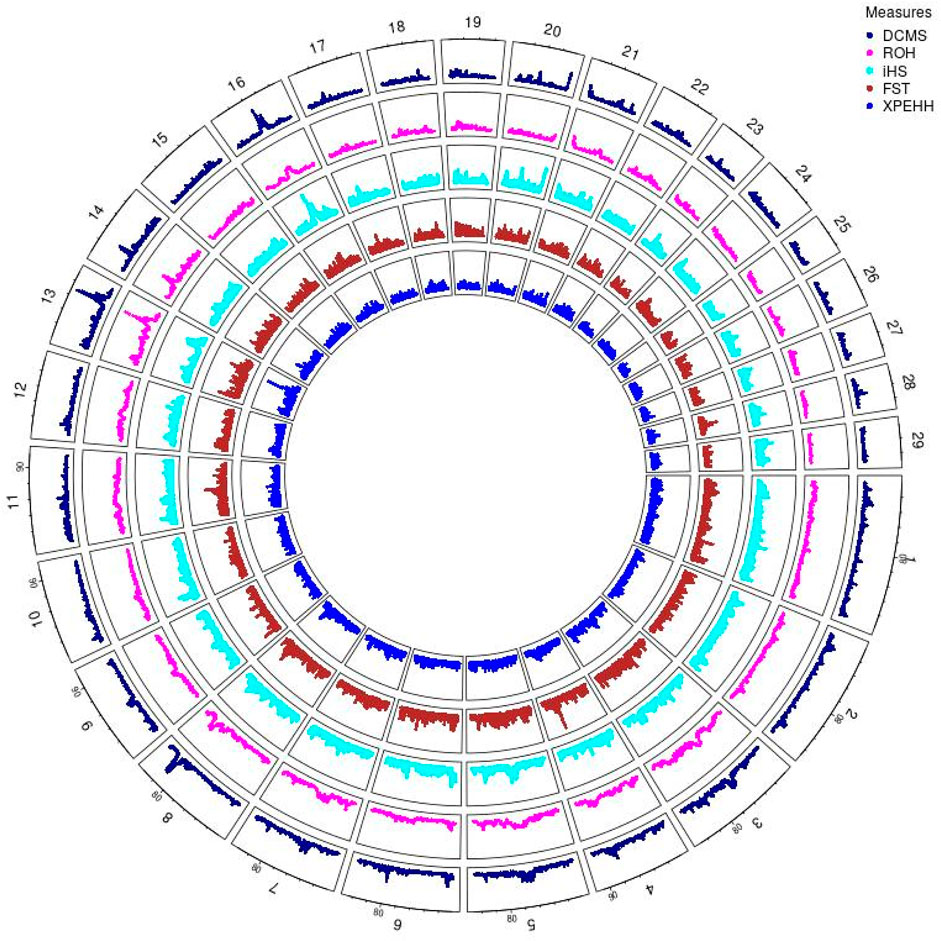
Figure 2. Circos plot of p-values for genome wide signatures of selection in Angus cattle.
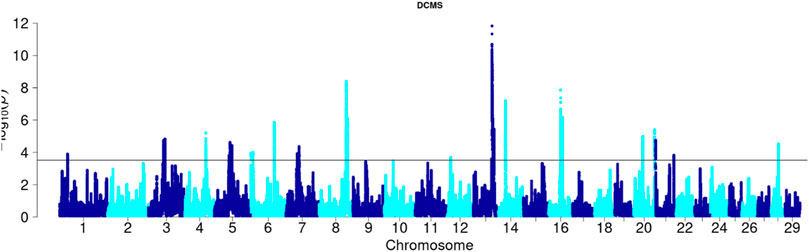
Figure 3. Manhattan plot of DCMS p-values in Angus cattle. Horizontal black line indicates the significance cut off (0.05 FDR).
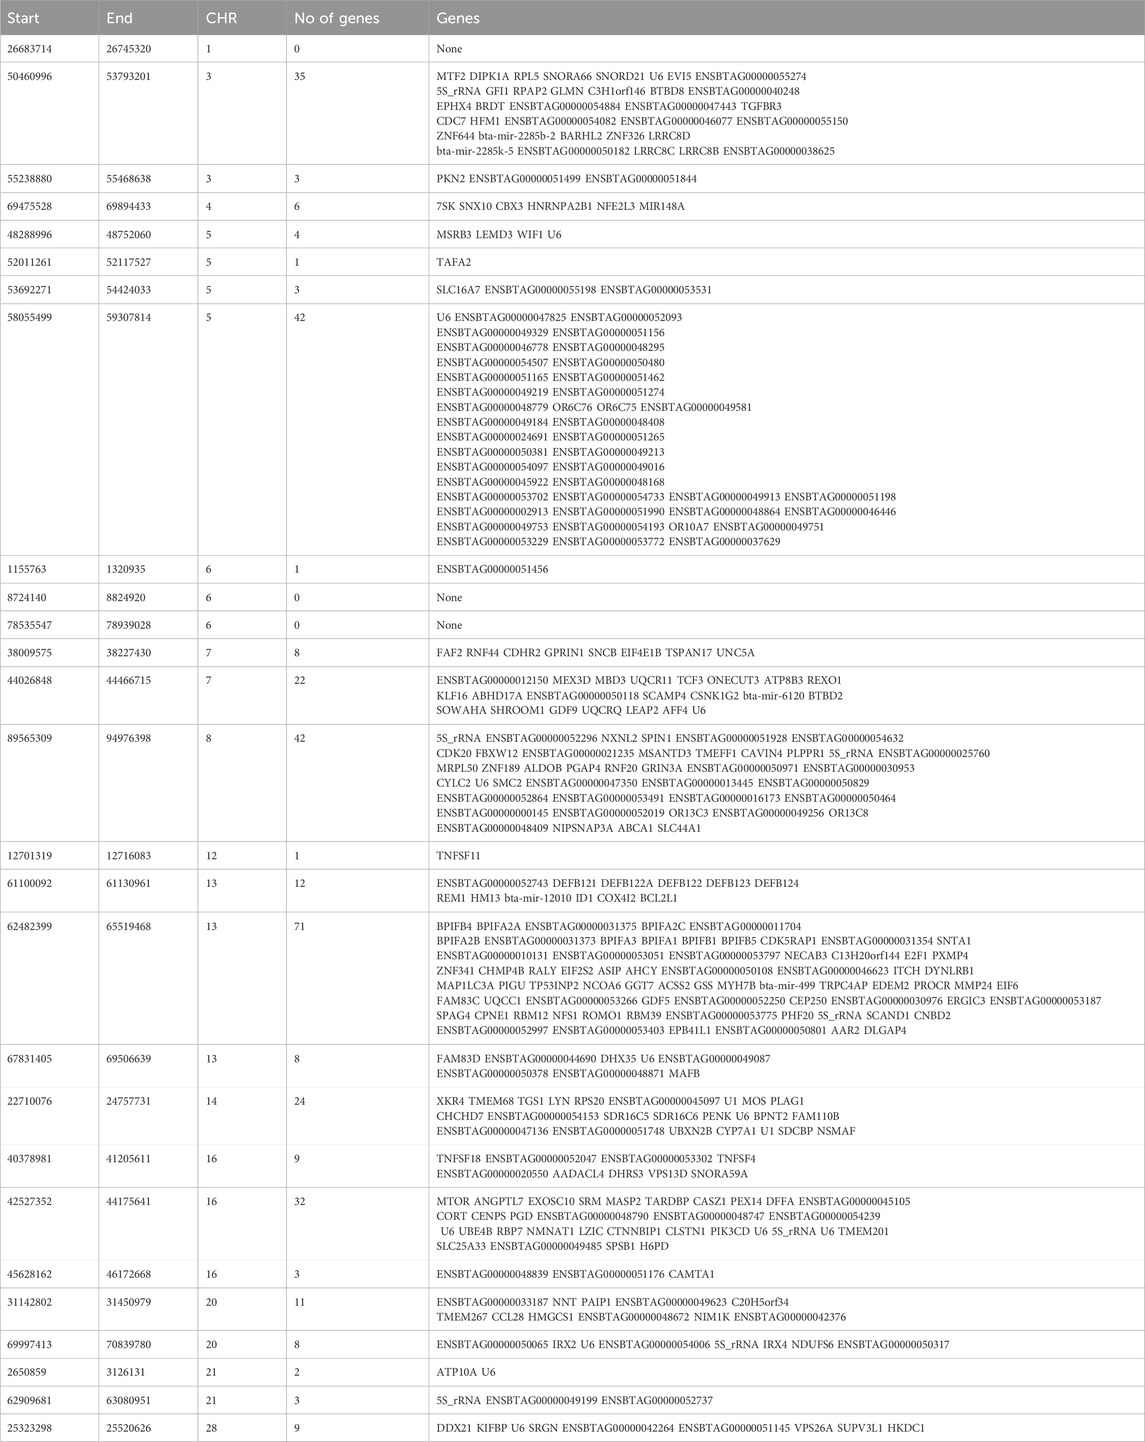
Table 2. Genomic regions under selection in Angus cattle identified by DCMS q values ≤ 0.05 and genes identified in those regions.
Some of the notable genes identified in significant genomic regions were associated with body size and stature (PLAG1, CHCHD7, RPS20, LYN), growth and feed intake (TMEM68, TGS1, LYN, XKR4), growth differentiation factor (GDF5), feed efficiency (OR6C76, PIK3CD), embryonic growth and reproductive development (NMNAT1), immunity related to tropical adaptation (SLC25A33, SPSB1), immune response and immune regulation (PIK3CD), pigmentation and adaptation to environment (ASIP). A complete list of all the regions and genes identified is shown in Table 2.
Hanwoo: A total of 10,162 SNPs were found in significant hotspots of selection using FDR cut off value of 0.05 on adjusted DCMS p values (q value). Out of these only 2,095 (20.6%) SNPs were located in genes. Significant SNPs were used to identify 17 significant genomic regions. The mean length of the selected regions was 306.27 kb (± 337.43) while their total length was 5.21 Mb. Significant genomic regions mapped to CHR 2, 4, 5, 6, 7, 8, 9, 10, 13, 17, 20, and 24 (Figures 4, 5) which harbor 59 genes (Table 3).
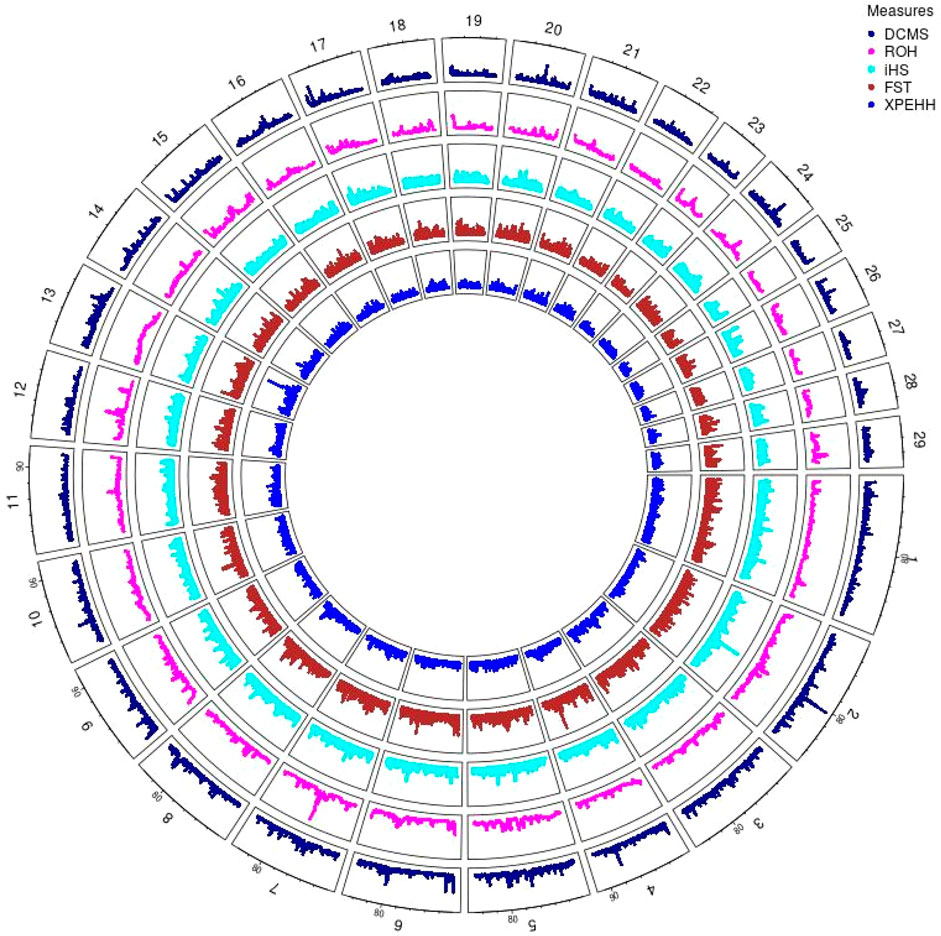
Figure 4. Circos plot of p-values for genome wide signatures of selection in Hanwoo cattle.
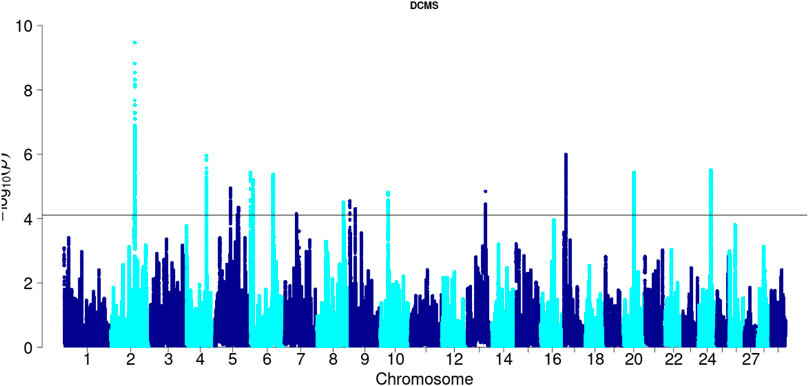
Figure 5. Manhattan plot of DCMS p-values in Hanwoo cattle. Horizontal black line indicates the significance cut off (0.05 FDR).
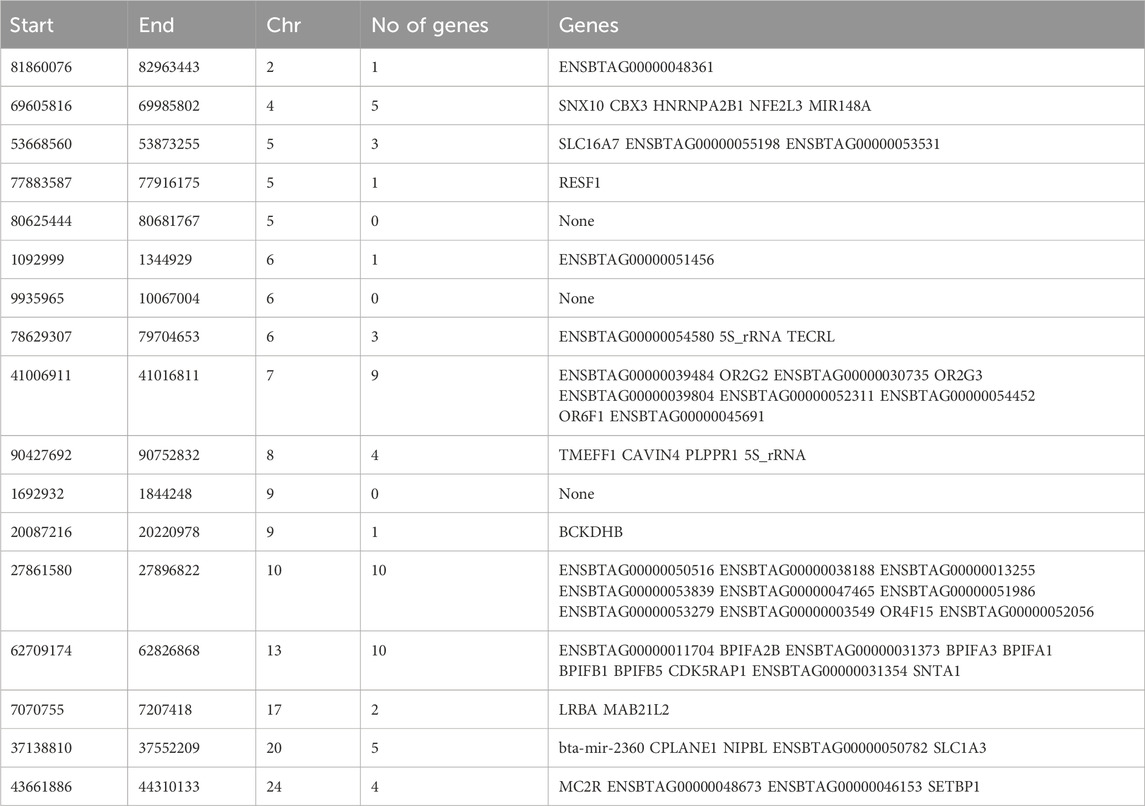
Table 3. Genomic regions under selection in Hanwoo cattle identified by DCMS q values ≤ 0.05 and genes identified in those regions.
The most significant genomic region was on CHR 2 between BP 81860076 and 82963443 BP where only 1 gene was identified (ENSBTAG00000048361). The greatest number of SNPs mapped to a gene on CHR 17 that plays important role in immunity (LRBA). An important region on CHR 24 (BP 43384983–44317964) was identified that contained genes (e.g., MC2R) regulating fat deposition and meat quality. Other genes identified were previously associated with important roles in brain development (CPLANE1), developmental regulation (NIPBL), breakdown of amino acids (BCKDHB), olfactory reception (OR6F1). A complete list of all the regions and genes identified has been provided in Table 3. Interestingly, none of the significantly selected regions were common between Hanwoo and Angus.
The main aim of this study was to identify genomic regions under selective pressure in Angus and Hanwoo cattle utilizing imputed whole genome information. We first identified individual selection signals by four distinct methods primarily based on allele frequency and haplotype patterns. We combined individual signals to identify strong signals of selection. Finally, we identified various positional candidate genes related to beef production and quality. Overall, we observed more genomic regions and genes under selective pressure in Angus than in Hanwoo with a limited overlap of selected regions or genes between the breeds, which is consistent with large differences in breed origin, environmental habitats, divergent selection histories, breeding program objectives and ultimately, the phenotypic differences between the breeds.
Genes identified within selected genomic regions in Angus included previously known regulators of growth, body size, feed intake, reproductive performance, and immunity. For example, PLAG1 regulates cell proliferation and its association with carcass weight and stature has been reported in several cattle breeds (Utsunomiya et al., 2013a; Takasuga, 2016; Fink et al., 2017). Similarly, LYN, another regulator of cell proliferation and RPS20, a catalyst of protein synthesis, have been associated with body weight and preweaning daily gain in Nellore (Utsunomiya et al., 2013a; Fink et al., 2017). CHCHD7 was previously reported as significantly associated with height in Jersey and Holstein (Utsunomiya et al., 2013a; Fink et al., 2017) and with carcass weight in Wagyu cattle (Nishimura et al., 2012). Both PLAG1 and RPS20 have also been associated with fetal growth and calving ease (Takasuga, 2016). Several olfactory receptors were also found in significant genomic regions (e.g., OR6C76, OR6C75, OR10A7, OR13C3, OR13C8). The olfactory transduction pathway has been associated with feed intake as it affects the perception of odor and in turn influences food preference and consumption (Abo-Ismail et al., 2010). Olfactory receptor loci have also been identified in other selective sweep studies in cattle and there are indications of recent duplication events (Ramey et al., 2013); which suggests that olfactory receptors may be under strong selection. TMEM68 (a cyltransferase involved in glycerolipid metabolism) and XKR4 have been associated with growth and feed intake in Nellore (Terakado et al., 2018). XKR4 has also been associated with subcutaneous fat in indicine and composite cattle (Porto Neto et al., 2012). TGS1 (trimethylguanosine synthase 1) has pleitropic effects in growth traits and feed efficiency (Terakado et al., 2018; Ghoreishifar et al., 2020). GDF5 (growth differentiation factor) is critical for normal skeletal development. Loss of GDF5 function results in developmental delay and a shortened appendicular skeleton (Buxton et al., 2001). PIK3CD (a component of the phosphatidylinositol-3-kinase pathway) is involved in lymphocyte signaling. Mutations in PIK3CD causes immune dysregulation and disease pathogenesis (Tangye et al., 2019). SPSB1 (splA/ryanodine receptor domain and SOCS box containing 1) is an important component of mammalian innate immune system regulation that recognizes foreign molecules derived from pathogens (Lewis et al., 2011). We also identified solute carrier genes (SLC44A1, SLC16A7, SLC25A33) which belong to a major class of transport proteins in the cell membrane and play an important role in response to metabolic states and environmental conditions (Pizzagalli et al., 2021). Various solute carrier genes were also identified in another study directly comparing zebu and taurine cattle using differential allele frequency and haplotype diversity methods (Chan et al., 2010). This strongly suggests their role in adaptation to tropical environments. ASIP (Agouti signaling protein) is a well-known gene associated with coat color pigmentation and environmental adaptation in several species (Bertolini et al., 2018).
Considering the breed’s innate characteristics and the high focus of the Hanwoo breeding program to select for increased marbling, it was reasonable to expect that some genomic regions under selection would be related to marbling score. An important region on CHR 24 was identified which contained ENSBTAG00000046153, MC2R and SETBP1 genes. The same region was also identified by composite signal in a multi breed study within a Hanwoo-specific signal (Gutiérrez-Gil et al., 2015). MC2R (adrencorticotropin receptor) and MC5R (melanocortin 5 receptor) genes belong to a family of melanocortin receptors (reviewed by Switonski et al. (2013)) that are involved in fatty acid and lipid metabolism pathways and reproduction. These genes have been previously located within a QTL region for marbling and backfat thickness and meat quality in pigs (Kováčik et al., 2012; Switonski et al., 2013). MC5R is a functional candidate for fatness in domestic animals and obesity in humans (Switonski et al., 2013) because it regulates interleukin 6 (IL6) (Jun et al., 2010) and downregulates leptin secretion (Hoggard et al., 2004) respectively resulting in increased fat deposition and increased feed intake. Based on these findings, we conclude that this selected region on CHR 24 is an important functional region for meat quality and should be further investigated in future studies in Hanwoo and/or other beef cattle.
Although it is common to focus on the genes identified in selected genomic regions, it should also be considered that much of the phenotypic diversity originates from differential regulation of gene expression by regulatory elements like promoters, enhancers, silencers, etc. (van Laere et al., 2003; Salinas et al., 2016). In this study 29.67% and 27.3% of the significant SNPs found in Angus and Hanwoo were annotated to gene coding regions, while the majority of the significant variants were located elsewhere. Similarly, Vernot et al. (2012) reported that the number of regulatory variants under selection far exceeded the number of variants in protein coding regions although their effect sizes may be small. Therefore, apart from the genes highlighted above, there may also be important regulatory elements within these significant genomic regions that play an important role in determining the phenotypic diversity of these breeds.
Detection of signatures of selection in populations can be challenging as it may be confounded with various other events in the population’s history that can lead to false positive results, e.g., population bottlenecks, migration, and genetic drift. Ascertainment bias is also a common problem in SNP data (Vitti et al., 2013). This study utilized whole genome sequence information from thousands of animals which should, to some extent, mitigate these issues. However, our study did not account for variation in the rate of recombination which may mimic the characteristics of selection signals (Haasl and Payseur, 2016). We also did not focus on other types of structural variants under selection such as copy number variants and tandem repeats which can play important biological roles. Moreover, the cutoff values used to initially filter the raw selection sweep signals across methods is largely arbitrary. For example, studies analyzing genotype data tend to adopt more liberal cutoffs of top 1% or 5% while those based on sequence data typically use a more conservative cutoff value such as the top 0.1% or 0.01%. For discovery of important QTLs or therapeutic targets, these thresholds may have downstream implications. In this study we first used 0.02% as a threshold of significance for individual selection signals just to highlight the peak genomic regions. We acknowledge this choice is subjective and these peaks were not used for any downstream analysis. Importantly, for the DCMS p-values we adopted a more conservative approach and used FDR cutoff of 0.05 which is widely used and acceptable in animal breeding and genetics. Candidate gene search was only performed for SNPs that passed the FDR cut-off based on the DCMS p-values. Theoretically, this approach should control the false positive rate in this study.
Signatures of selection can serve as a complementary method to genome-wide association studies for identification of functional variants in the genome and to provide new insights into the underlying biology of traits important for agricultural production. Since detecting selected genomic regions does not require phenotypic data, these studies can be particularly useful to identify genes for traits that are difficult or at time impossible to measure, for example, adaption to extreme environment and disease resistance. Significant genomic regions in this study may be used to select SNPs in future and test for their predictive ability. However, SNPs located in conserved genomic regions may have lower frequencies making it difficult to estimate their effects correctly and thus using them for prediction. These challenges may be overcome by overlapping results from various selection sweeps as well as GWAS particularly for traits that are known to be regulated by large effect loci. Finally, future projects comparing Hanwoo and Angus against indicine cattle breeds may also reveal candidate genes related to environmental adaptation.
To date, this is the largest signatures of selection study in Angus and Hanwoo beef cattle, both in terms of the density of SNPs and the number of animals per breed. We detected more selected genomic regions in Angus than in Hanwoo and the total length of genomic regions with evidence of selection was also higher in Angus. Moreover, we observed that the signatures of selection in Hanwoo and Angus are unique markedly reflecting differences in their selection history, genomic architecture and breed characteristics. More specifically, in Angus, we identified genes associated with growth, body size, feed intake, reproductive development and immunity, while in Hanwoo important genes associated with immunity, fat deposition, cholesterol metabolism, neuronal development and meat quality were identified. Future studies may help independently validate key functional genes regulating traits associated with these breeds.
The data analyzed in this study is subject to the following licenses/restrictions: Parts of the data that support the findings of this study were available from the Rural Development Administration, Republic of Korea and American Angus Association. Restrictions apply to the availability of these data, which were used under license for this study. Requests to access these datasets should be directed to Z29uZHJvY2VAbXN1LmVkdQ==.
Ethical approval was not required for the study involving animals in accordance with the local legislation and institutional requirements because this study was conducted on data from commercial animals.
MN: Writing–original draft, Conceptualization, Formal Analysis, Methodology, Visualization. RS: Methodology, Software, Writing–review and editing. DL: Funding acquisition, Project administration, Resources, Writing–review and editing. SL: Funding acquisition, Project administration, Resources, Supervision, Writing–review and editing. CC: Conceptualization, Funding acquisition, Resources, Supervision, Writing–review and editing.
The author(s) declare that financial support was received for the research, authorship, and/or publication of this article. This work was supported by the Next-Generation BioGreen21 Program, by the Rural Development Administration, Republic of Korea, and by the National Institute of Food and Agriculture (AFRI Projects No. 2019-67015-29323 and 2021-67015-33411). MN was supported by an internship from Angus Genetics Inc.
The authors declare that the research was conducted in the absence of any commercial or financial relationships that could be construed as a potential conflict of interest.
All claims expressed in this article are solely those of the authors and do not necessarily represent those of their affiliated organizations, or those of the publisher, the editors and the reviewers. Any product that may be evaluated in this article, or claim that may be made by its manufacturer, is not guaranteed or endorsed by the publisher.
The Supplementary Material for this article can be found online at: https://www.frontiersin.org/articles/10.3389/fgene.2024.1368710/full#supplementary-material
Abo-Ismail, M. K., Voort, G. V., Squires, J. J., Swanson, K. C., Mandell, I. B., Liao, X., et al. (2010). Factors affecting beef cattle producer perspectives on feed efficiency. J. Anim. Sci. 88, 3749–3758. doi:10.2527/jas.2010-2907
Albertí, P., Panea, B., Sañudo, C., Olleta, J. L., Ripoll, G., Ertbjerg, P., et al. (2008). Live weight, body size and carcass characteristics of young bulls of fifteen European breeds. Livest. Sci. 114, 19–30. doi:10.1016/j.livsci.2007.04.010
Bertolini, F., Servin, B., Talenti, A., Rochat, E., Kim, E. S., Oget, C., et al. (2018). Signatures of selection and environmental adaptation across the goat genome post-domestication 06 Biological Sciences 0604 Genetics. Genet. Sel. Evol. 50, 1–24. doi:10.1186/s12711-018-0421-y
Buxton, P., Edwards, C., Archer, C. W., and Francis-West, P. (2001). Growth/differentiation factor-5 (GDF-5) and skeletal development. J. Bone Jt. Surg. 83-A Suppl 1, S23–30.
Chan, E. K. F., Nagaraj, S. H., and Reverter, A. (2010). The evolution of tropical adaptation: comparing taurine and zebu cattle. Anim. Genet. 41, 467–477. doi:10.1111/j.1365-2052.2010.02053.x
Cho, S. H., Kim, J., Park, B. Y., Seong, P. N., Kang, G. H., Kim, J. H., et al. (2010). Assessment of meat quality properties and development of a palatability prediction model for Korean Hanwoo steer beef. Meat Sci. 86, 236–242. doi:10.1016/j.meatsci.2010.05.011
Ewing, G. B., and Jensen, J. D. (2016). The consequences of not accounting for background selection in demographic inference. Mol. Ecol. 25, 135–141. doi:10.1111/mec.13390
Fink, T., Tiplady, K., Lopdell, T., Johnson, T., Snell, R. G., Spelman, R. J., et al. (2017). Functional confirmation of PLAG1 as the candidate causative gene underlying major pleiotropic effects on body weight and milk characteristics. Sci. Rep. 7, 44793–44798. doi:10.1038/srep44793
Ghoreishifar, S. M., Eriksson, S., Johansson, A. M., Khansefid, M., Moghaddaszadeh-Ahrabi, S., Parna, N., et al. (2020). Signatures of selection reveal candidate genes involved in economic traits and cold acclimation in five Swedish cattle breeds. Genet. Sel. Evol. 52, 52–15. doi:10.1186/s12711-020-00571-5
Grossman, S. R., Shlyakhter, I., Karlsson, E. K., Byrne, E. H., Morales, S., Frieden, G., et al. (2010). A composite of multiple signals distinguishes causal variants in regions of positive selection. Science 327 (327), 883–886. doi:10.1126/science.1183863
Gutiérrez-Gil, B., Arranz, J. J., and Wiener, P. (2015). An interpretive review of selective sweep studies in Bos taurus cattle populations: identification of unique and shared selection signals across breeds. Front. Genet. 6, 167. doi:10.3389/fgene.2015.00167
Haasl, R. J., and Payseur, B. A. (2016). Fifteen years of genomewide scans for selection: trends, lessons and unaddressed genetic sources of complication. Mol. Ecol. 25, 5–23. doi:10.1111/mec.13339
Hoggard, N., Hunter, L., Duncan, J. S., and Rayner, D. V. (2004). Regulation of adipose tissue leptin secretion by alpha-melanocyte-stimulating hormone and agouti-related protein: further evidence of an interaction between leptin and the melanocortin signalling system. J. Mol. Endocrinol. 32, 145–153. doi:10.1677/jme.0.0320145
Igoshin, A. V., Yurchenko, A. A., Belonogova, N. M., Petrovsky, D. V., Aitnazarov, R. B., Soloshenko, V. A., et al. (2019). Genome-wide association study and scan for signatures of selection point to candidate genes for body temperature maintenance under the cold stress in Siberian cattle populations. BMC Genet. 20, 26. doi:10.1186/s12863-019-0725-0
Jun, D. J., Na, K. Y., Kim, W., Kwak, D., Kwon, E. J., Yoon, J. H., et al. (2010). Melanocortins induce interleukin 6 gene expression and secretion through melanocortin receptors 2 and 5 in 3T3-L1 adipocytes. J. Mol. Endocrinol. 44, 225–236. doi:10.1677/JME-09-0161
Kováčik, A., Bulla, J., Trakovická, A., Žitný, J., and Rafayová, A. (2012). The effect of the porcine melanocortin-5 receptor (Mc5R) gene associated with feed intake, carcass and physico-chemical characteristics. J. Microbiol. 1, 498–506.
Lawrence, M., Huber, W., Pagès, H., Aboyoun, P., Carlson, M., Gentleman, R., et al. (2013). Software for computing and annotating genomic ranges. PLoS Comput. Biol. 9, 1–10. doi:10.1371/journal.pcbi.1003118
Lee, S.-H., Park, B.-H., Sharma, A., Dang, C.-G., Lee, S.-S., Choi, T.-J., et al. (2014). Hanwoo cattle: origin, domestication, breeding strategies and genomic selection. J. Anim. Sci. Technol. 56, 2. doi:10.1186/2055-0391-56-2
Lewis, R. S., Kolesnik, T. B., Kuang, Z., D’Cruz, A. A., Blewitt, M. E., Masters, S. L., et al. (2011). TLR regulation of SPSB1 controls inducible nitric oxide synthase induction. J. Immunol. 187, 3798–3805. doi:10.4049/jimmunol.1002993
Ma, Y., Ding, X., Qanbari, S., Weigend, S., Zhang, Q., and Simianer, H. (2015). Properties of different selection signature statistics and a new strategy for combining them. Hered. (Edinb) 115, 426–436. doi:10.1038/hdy.2015.42
Maclean, C. A., Chue Hong, N. P., and Prendergast, J. G. D. (2015). Hapbin: an efficient program for performing haplotype-based scans for positive selection in large genomic datasets. Mol. Biol. Evol. 32, 3027–3029. doi:10.1093/molbev/msv172
Makvandi-Nejad, S., Hoffman, G. E., Allen, J. J., Chu, E., Gu, E., Chandler, A. M., et al. (2012). Four loci explain 83% of size variation in the horse. PLoS One 7, 1–6. doi:10.1371/journal.pone.0039929
Nawaz, M. Y., Bernardes, P. A., Savegnago, R. P., Lim, D., Lee, S. H., and Gondro, C. (2022). Evaluation of whole-genome sequence imputation strategies in Korean Hanwoo cattle. Animals 12, 2265. doi:10.3390/ani12172265
Nishimura, S., Watanabe, T., Mizoshita, K., Tatsuda, K., Fujita, T., Watanabe, N., et al. (2012). Genome-wide association study identified three major QTL for carcass weight including the PLAG1-CHCHD7 QTN for stature in Japanese Black cattle. BMC Genet. 13, 40. doi:10.1186/1471-2156-13-40
Pizzagalli, M. D., Bensimon, A., and Superti-Furga, G. (2021). A guide to plasma membrane solute carrier proteins. FEBS J. 288, 2784–2835. doi:10.1111/febs.15531
Pollinger, J. P., Bustamante, C. D., Fledel-Alon, A., Schmutz, S., Gray, M. M., and Wayne, R. K. (2005). Selective sweep mapping of genes with large phenotypic effects. Genome Res. 15, 1809–1819. doi:10.1101/gr.4374505
Porto Neto, L. R., Bunch, R. J., Harrison, B. E., and Barendse, W. (2012). Variation in the XKR4 gene was significantly associated with subcutaneous rump fat thickness in indicine and composite cattle. Anim. Genet. 43, 785–789. doi:10.1111/j.1365-2052.2012.02330.x
Ramey, H. R., Decker, J. E., McKay, S. D., Rolf, M. M., Schnabel, R. D., and Taylor, J. F. (2013). Detection of selective sweeps in cattle using genome-wide SNP data. BMC Genomics 14, 382. doi:10.1186/1471-2164-14-382
Randhawa, I. A. S., Khatkar, M. S., Thomson, P. C., and Raadsma, H. W. (2014). Composite selection signals can localize the trait specific genomic regions in multi-breed populations of cattle and sheep. BMC Genet. 15, 34–19. doi:10.1186/1471-2156-15-34
Randhawa, I. A. S., Khatkar, M. S., Thomson, P. C., and Raadsma, H. W. (2016). A meta-assembly of selection signatures in cattle. PLoS One 11, e0153013–e0153030. doi:10.1371/journal.pone.0153013
Sabeti, P. C., Reich, D. E., Higgins, J. M., Levine, H. Z. P., Richter, D. J., Schaffner, S. F., et al. (2002). Detecting recent positive selection in the human genome from haplotype structure. Nature 419, 832–837. doi:10.1038/nature01140
Sabeti, P. C., Varilly, P., Fry, B., Lohmueller, J., Hostetter, E., Cotsapas, C., et al. (2007). Genome-wide detection and characterization of positive selection in human populations. Nature 449 (7164), 913–918. doi:10.1038/nature06250
Salinas, F., De Boer, C. G., Abarca, V., García, V., Cuevas, M., Araos, S., et al. (2016). Natural variation in non-coding regions underlying phenotypic diversity in budding yeast. Sci. Rep. 6, 21849–21913. doi:10.1038/srep21849
Sutter, N. B., Bustamante, C. D., Chase, K., Gray, M. M., Zhao, K., Zhu, L., et al. (2007). A single IGF1 allele is a major determinant of small size in dogs. Science 316, 112–115. doi:10.1126/science.1137045
Switonski, M., Mankowska, M., and Salamon, S. (2013). Family of melanocortin receptor (MCR) genes in mammals-mutations, polymorphisms and phenotypic effects. J. Appl. Genet. 54, 461–472. doi:10.1007/s13353-013-0163-z
Takasuga, A. (2016). PLAG1 and NCAPG-LCORL in livestock. Animal Sci. J. 87, 159–167. doi:10.1111/asj.12417
Tangye, S. G., Bier, J., Lau, A., Nguyen, T., Uzel, G., and Deenick, E. K. (2019). Immune dysregulation and disease pathogenesis due to activating mutations in PIK3CD—the goldilocks’ effect. J. Clin. Immunol. 39, 148–158. doi:10.1007/s10875-019-00612-9
Terakado, A. P. N., Costa, R. B., De Camargo, G. M. F., Irano, N., Bresolin, T., Takada, L., et al. (2018). Genome-wide association study for growth traits in Nelore cattle. Animal 12, 1358–1362. doi:10.1017/S1751731117003068
Utsunomiya, Y. T., do Carmo, A. S., Carvalheiro, R., Neves, H. H. R., Matos, M. C., Zavarez, L. B., et al. (2013a). Genome-wide association study for birth weight in Nellore cattle points to previously described orthologous genes affecting human and bovine height. BMC Genet. 14, 52. doi:10.1186/1471-2156-14-52
Utsunomiya, Y. T., Pérez O’Brien, A. M., Sonstegard, T. S., Van Tassell, C. P., do Carmo, A. S., Mészáros, G., et al. (2013b). Detecting loci under recent positive selection in dairy and beef cattle by combining different genome-wide scan methods. PLoS One 8, 1–11. doi:10.1371/journal.pone.0064280
Van Laere, A. S., Nguyen, M., Braunschweig, M., Nezer, C., Collette, C., Moreau, L., et al. (2003). A regulatory mutation in IGF2 causes a major QTL effect on muscle growth in the pig. Nature 425, 832–836. doi:10.1038/nature02064
Vernot, B., Stergachis, A. B., Maurano, M. T., Vierstra, J., Neph, S., Thurman, R. E., et al. (2012). Personal and population genomics of human regulatory variation. Genome Res. 22, 1689–1697. doi:10.1101/gr.134890.111
Vitti, J. J., Grossman, S. R., and Sabeti, P. C. (2013). Detecting natural selection in genomic data. Annu. Rev. Genet. 47, 97–120. doi:10.1146/annurev-genet-111212-133526
Voight, B. F., Kudaravalli, S., Wen, X., and Pritchard, J. K. (2006). A map of recent positive selection in the human genome. PLoS Biol. 4, e72–e0458. doi:10.1371/journal.pbio.0040072
Keywords: signatures of selection, Hanwoo, Angus, WGS, beef cattle
Citation: Nawaz MY, Savegnago RP, Lim D, Lee SH and Gondro C (2024) Signatures of selection in Angus and Hanwoo beef cattle using imputed whole genome sequence data. Front. Genet. 15:1368710. doi: 10.3389/fgene.2024.1368710
Received: 11 January 2024; Accepted: 09 July 2024;
Published: 02 August 2024.
Edited by:
Nuno Carolino, National Institute for Agricultural and Veterinary Research (INIAV), PortugalReviewed by:
Mohammad Hossein Banabazi, Swedish University of Agricultural Sciences, SwedenCopyright © 2024 Nawaz, Savegnago, Lim, Lee and Gondro. This is an open-access article distributed under the terms of the Creative Commons Attribution License (CC BY). The use, distribution or reproduction in other forums is permitted, provided the original author(s) and the copyright owner(s) are credited and that the original publication in this journal is cited, in accordance with accepted academic practice. No use, distribution or reproduction is permitted which does not comply with these terms.
*Correspondence: Cedric Gondro, Z29uZHJvY2VAbXN1LmVkdQ==
Disclaimer: All claims expressed in this article are solely those of the authors and do not necessarily represent those of their affiliated organizations, or those of the publisher, the editors and the reviewers. Any product that may be evaluated in this article or claim that may be made by its manufacturer is not guaranteed or endorsed by the publisher.
Research integrity at Frontiers
Learn more about the work of our research integrity team to safeguard the quality of each article we publish.