
94% of researchers rate our articles as excellent or good
Learn more about the work of our research integrity team to safeguard the quality of each article we publish.
Find out more
ORIGINAL RESEARCH article
Front. Genet. , 16 June 2023
Sec. Computational Genomics
Volume 14 - 2023 | https://doi.org/10.3389/fgene.2023.906346
 Yongfeng Wang1,2,3,4†
 Dongzhi Zhang1,2,3,4†Yuxi Li1†Yue Wu1Haizhong Ma3,4
 Xianglai Jiang2,3Liangyin Fu2
 Guangming Zhang1Haolan Wang2Xingguang Liu1*Hui Cai1,2,3,4*
Background: Colon cancer (CC) is a prevalent malignant tumor that affects people all around the world. In this study, N6-methylandenosine-related long non-coding RNAs (m6A-related lncRNAs) in 473 colon cancers and 41 adjacent tissues of CC patients from The Cancer Genome Atlas (TCGA) were investigated.
Method: The Pearson correlation analysis was conducted to examine the m6A-related lncRNAs, and the univariate Cox regression analysis was performed to screen 38 prognostic m6A-related lncRNAs. The least absolute shrinkage and selection operator (LASSO) regression analysis were carried out on 38 prognostic lncRNAs to develop a 14 m6A-related lncRNAs prognostic signature (m6A-LPS) in CC. The availability of the m6A-LPS was evaluated using the Kaplan–Meier and Receiver Operating Characteristic (ROC) curves.
Results: Three m6A modification patterns with significantly different N stages, survival time, and immune landscapes were identified. It has been discovered that the m6A-LPS, which is based on 14 m6A-related lncRNAs (TNFRSF10A-AS1, AC245041.1, AL513550.1, UTAT33, SNHG26, AC092944.1, ITGB1-DT, AL138921.1, AC099850.3, NCBP2-AS1, AL137782.1, AC073896.3, AP006621.2, AC147651.1), may represent a new, promising biomarker with great potential. It was re-evaluated in terms of survival rate, clinical features, tumor infiltration immune cells, biomarkers related to Immune Checkpoint Inhibitors (ICIs), and chemotherapeutic drug efficacy. The m6A-LPS has been revealed to be a novel potential and promising predictor for evaluating the prognosis of CC patients.
Conclusion: This study revealed that the risk signature is a promising predictive indicator that may provide more accurate clinical applications in CC therapeutics and enable effective therapy strategies for clinicians.
Globally, colon cancer is a common malignant tumor in humans that has a high morbidity and mortality rate (Lu and Zhang, 2020; Xiaoyong et al., 2022). A poor prognosis leads to CC posing a serious threat to the health of humans. Most colon cancers are caused by poor dietary habits, age, lifestyle, lack of exercise, and smoking (Xavier and Podolsky, 2007). In recent years, there have been increased studies focusing on the modification of m6A within the epigenetics field. The m6A modification, which transfers the methyl group to the nitrogen-6 position of the adenosine base in RNA, is the most abundant and reversible mRNA epigenetic modification (Zhang et al., 2021a). The m6A methyltransferase, also known as “writers”, installs m6A modification from RNA, while the demethylase, also known as “erasers”, removes m6A modification from RNA (Xu et al., 2021a). After m6A modification, the mature mRNA is recognized by the “reader” when it is exported from the nucleus to the cytoplasm (Zaccara et al., 2019). The “reader” is a binding protein capable of recognizing important chemical signals for m6A modification. As a promising biomarker, m6A-related regulatory factors participate in various biological processes in the occurrence and progression of numerous diseases, especially malignant tumors (Tian et al., 2020). The m6A-related regulatory factors are involved in almost every RNA metabolism and processing step that influence RNA function (Lan et al., 2021).
Long non-coding RNA (lncRNA), a type of transcribed RNA, has various important biological functions (Johnsson et al., 2014). As lncRNA is vital in almost all aspects of biological function, it is indispensable for modulation, especially m6A. Furthermore, lncRNA may also regulate m6A methylation through certain pathways. In addition, m6A modification may affect lncRNA by several regulatory mechanisms. Furthermore, m6A modification may alter the structure of sectional RNA, allowing the corresponding RNA-binding proteins to enter the ambient m6A residues. Moreover, modification of m6A may affect the formation of the RNA-DNA triplex, modulating the binding of RNA to target DNA, and thereby regulating target genomic sites (Ma et al., 2019). It has been reported that m6A-related lncRNAs contribute to improving prognostic risk assessment and the development of individualized therapy decisions in various cancers. For example, Feng et al. (2021) demonstrated the prognostic predictive value of the 6A-LPS, which included four m6A-related lncRNAs, and evaluated the correlation with PD-L1 in head and neck squamous cell carcinoma. Xu et al. (2021b) elucidated a risk signature composed of 12 m6A-related lncRNAs as promising prediction targets in lung adenocarcinoma prognosis and immune responses. The m6A-related lncRNA signature has been shown to have significant molecular prognostic value in gastric cancer and may improve the development of personalized immunotherapy strategies (Wang et al., 2021). However, the specific mechanism through which m6A-related lncRNAs promote CC occurrence and development remains unknown.
In this study, the expression data of 14,142 lncRNAs and 21 m6A regulators from TCGA were analyzed to identify three m6A modification patterns, as well as develop an m6A-LPS using the LASSO regression analysis. The 14 lncRNAs used to construct the m6A-LPS were reported in CC for the first time. In addition, a nomogram was established to predict the survival time of CC patients. Finally, the relationship with immunotherapy responses was investigated.
The transcriptome sequencing results, relevant clinical details, and somatic mutation data of CC patients were collated via TCGA (https://cancergenome.nih.gov/), which embodied mRNA and lncRNA expression data from 473 colon cancers and 41 adjacent tissues of CC patients. The GTF file was downloaded via Ensembl for annotation to distinguish between mRNA and lncRNAs. Furthermore, a list of 21 m6A-related genes was screened based on previous literature, including 8 writers (RBM15, RBM15B, WTAP, METTL3, METTL14, KIAA1429, CBLL1, and ZC3H13), 2 erasers (FTO and ALKBH5), and 11 readers (YTHDC1, YTHDC2, IGF2BP1, IGF2BP2, IGF2BP3, HNRNPC, HNRNPA2B1, YTHDF1, YTHDF2, YTHDF3, and RBMX). If the expression level of a lncRNA was related to one or more of these genes, it was identified as an m6A-related lncRNA. The correlation between lncRNA and m6a regulators in the dataset was determined by the Pearson method. The square of correlation coefficient∣R2∣>0.5 and p < 0.001 were used as the identification criteria for m6A-related lncRNAs.
Consensus clustering analysis was used to identify distinct modification patterns and cluster the TCGA-COAD samples based on the expression levels of prognostic lncRNAs. Consensus clustering was used to determine the optimal number of clusters. The ConsensusClusterPlus R package, which was the unsupervised clustering method, provided stable visual evidence to estimate the number of unsupervised clusters in a dataset (Wilkerson et al., 2010). In order to ensure the classification was stable, 1,000 repetitions were performed utilizing ConsensuClusterPlus package (Wilkerson et al., 2010). In order to analyze the differences in immune infiltration levels among multiple clusters, 22 immune cell types infiltrating the TCGA-COAD samples were identified using the CIBERSORT package (Wang et al., 2021; Wang et al., 2021; Y et al., 2022). The p-value corresponding to the output result is of < 0.05 was considered statistically significant.
The single-factor Cox regression was used in conjunction with survival data, and the prognosis-related lncRNAs with p < 0.05 were screened using the log-rank test according to the TCGA database. Subsequently, the Lasso regression analysis was carried out on these lncRNAs to develop the m6A-LPS. The risk score for each case was determined based on the expression of the predicted lncRNA multiplied by the coefficient from the LASSO algorithm. The Kaplan–Meier (K-M) method was used for assessing the difference in overall survival (OS). The receiver operating characteristic (ROC) curve was drawn using the R package “survivalROC”. The sensitivity and specificity of the m6A-LPS were examined using the area under the curve (AUC). In order to determine if the m6A- LPS and clinicopathological features served as independent factors for OS, the univariate and multivariate Cox regression analyses were carried out. The principal component analysis (PCA) was used to compare the distribution of high- and low-risk score patients in CC by the “prcomp” function of the “stats” R package.
In order to assess the various immune landscapes in the different risk subgroups, the currently acknowledged methods were utilized to identify the infiltration of 22 immune cell types in the TCGA-COAD samples, including TIMER (Li et al., 2017; Wang et al., 2020), CIBER SORT (Chen et al., 2018; Zhang et al., 2020), XCELL (Aran et al., 2017; Aran, 2020), QUANTISEQ (Plattner et al., 2020), MCPcounter (Dienstmann et al., 2019), EPIC (Racle et al., 2017), and CIBERSORT-ABS (Tamminga et al., 2020). A detailed Spearman correlation analysis was performed using the R ggplot2 packages. A p-value of < 0.05 was considered statistically significant. The differences of 22 immune cell types were also analyzed by the Wilcoxon test using the R ggpubr package. The differences in the expression levels of biomarkers related to Immune Checkpoint Inhibitors (ICIs) between different subgroups were examined using a violin plot obtained with the R ggpubr package.
We used GSEA to examine immune function and biological pathways. Functional enrichment analyses via Gene Ontology (GO) and the Kyoto Gene and Genomic Encyclopedia (KEGG) pathway analyses, were conducted by gene set enrichment analysis (GSEA) 4.1.0 (Subramanian et al., 2005; Kanehisa et al., 2017). p < 0.05 was considered a significant category.
In accordance with the instructions of the manufacturer, cDNA synthesis was performed by using the SYBR-Green Mix (Vazyme Biotech Co.,Ltd.). The Real-time PCR (qRT-PCR) analysis was conducted on The LightCycler 480 Real-Time PCR System. The primers used for qRT-PCR were purchased from Servicebio (Wuhan China). The related GAPDH mRNA expression was used as an endogenous control. The primer sequences used in our study were summarized in Table 1.
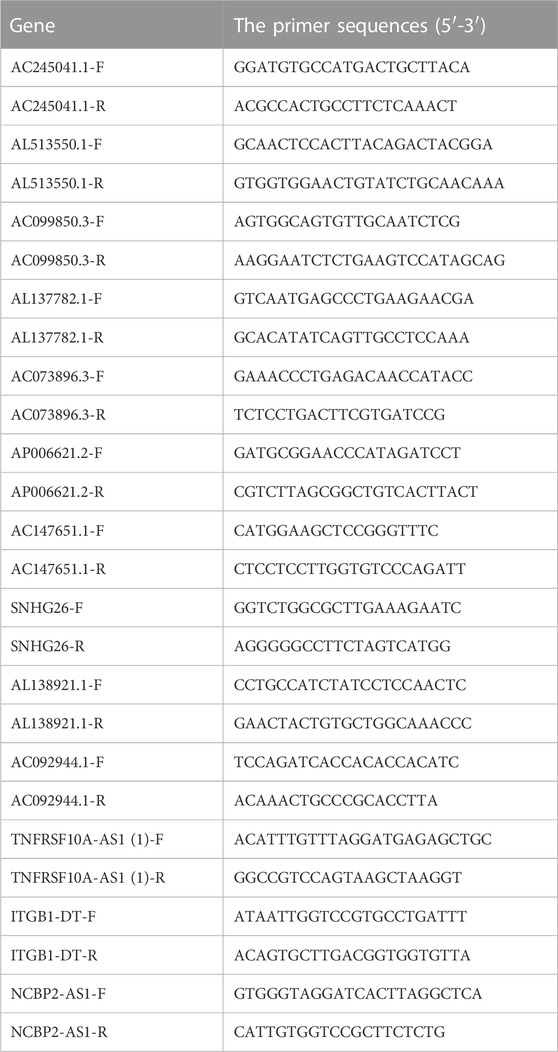
TABLE 1. The primer sequences for qRT-PCR.
Gene expression and risk scores between subgroups were compared using the Wilcox test. The Kaplan–Meier (K-M) method was used for assessing the difference in OS among three subgroups. An assessment of linear correlation between two random variables was performed using the Pearson correlation coefficient. All statistical analyses were performed using R (version 3.6.2), GraphPad Prism 9 and Perl software in the present experiment. All analyses performed were bilateral, with p < 0.05 being statistically significant.
The workflow for the m6A-LPS analysis is illustrated in Figure 1. Initially, the expression data of 14,142 lncRNAs and 21 m6A regulators from TCGA, as well as the survival status, and clinical data, were identified and obtained. A total of 1,234 lncRNAs were identified by determining the Pearson coefficient of the lncRNA-mRNA co-expression analysis (Figure 2A; Supplementary Table S1). As shown in Figure 2B; Supplementary Table S2, 38 prognostic m6A-related lncRNAs were filtered through a univariate Cox regression analysis. The differences in expression of the 38 prognostic lncRNAs in CC and normal samples were analyzed using the Wilcoxon test. The differential expression of 38 lncRNA heatmaps (Figure 2C) and boxplots (Figure 2D) were plotted using the “pheatmap” and “ggpot2” packages, respectively. The correlations between the 38 prognostic lncRNAs and PD-L1 in TCGA were examined using Spearman’s method, as displayed in Figure 2E

FIGURE 1. Study flow chart.
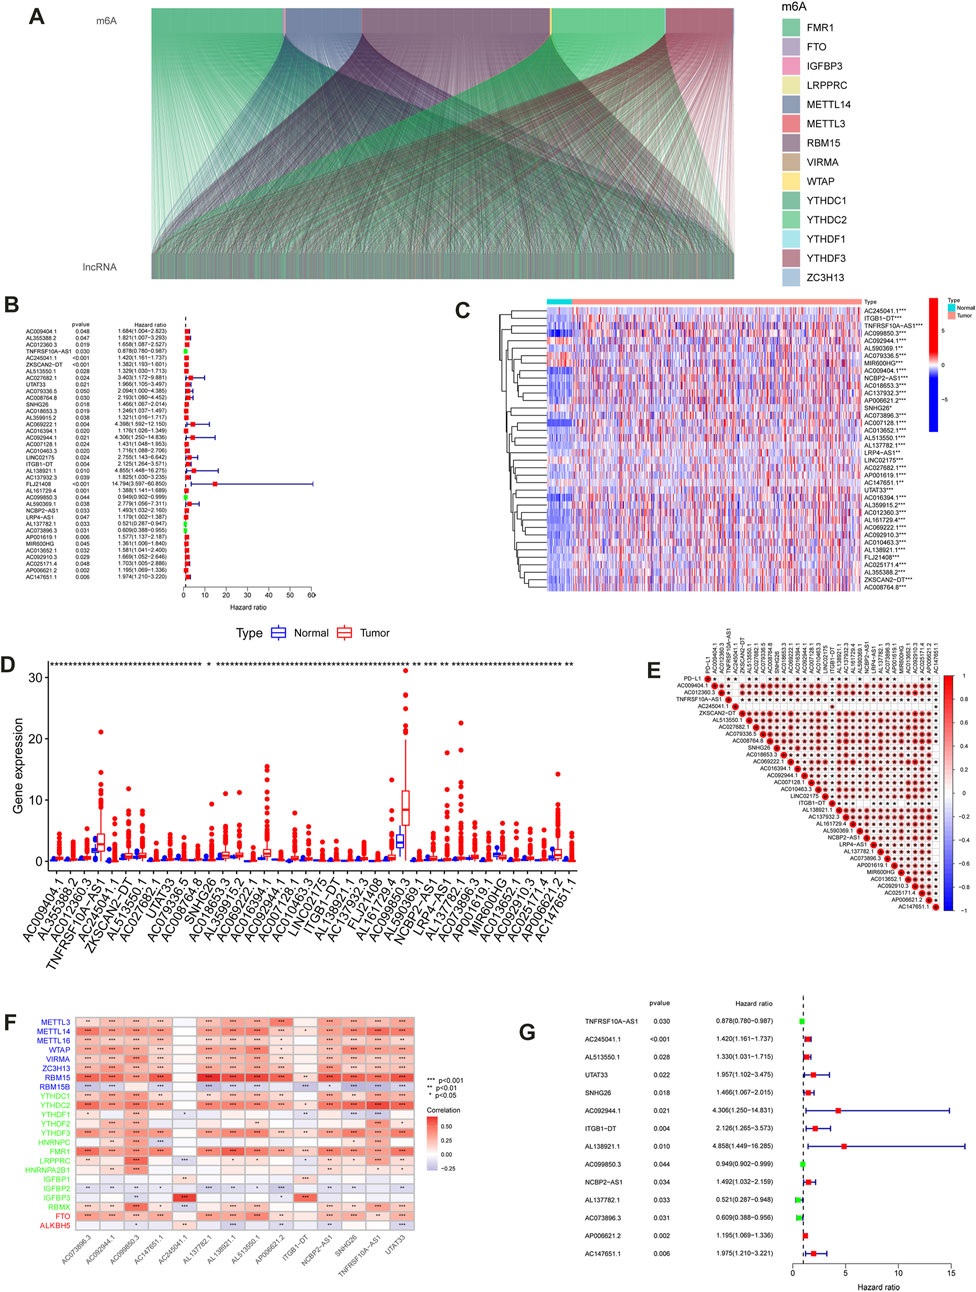
FIGURE 2. Identification of m6A-related lncRNAs in CC. (A) Sankey relational diagram for 21 m6A genes and m6A-related lncRNAs. (B) Univariate Cox regression analysis forest map of the 38 m6A-Related prognostic lncRNAs. Heat map (C) and box plot (D) of the differential expression of the 38 m6A-Related prognostic lncRNAs. (E) The correlation among expression of the m6A-related prognostic lncRNAs and PD-L1. (F) Heatmap for the correlations between 21 m6A genes and the 14 prognostic m6A-related lncRNAs. (G) Univariate Cox regression analysis for 14 m6A-related prognostic lncRNAs in the m6A-LPS. (***p < 0.001; **p < 0.01; *p < 0.05)
Consensus cluster analysis was used to further explore the expression characteristics of m6A-related lncRNAs in the TCGA-COAD samples. The TCGA-COAD cohort was clustered into k subtypes (k = 2–9) based on the 38 prognostic lncRNA expression levels with the R package ConsensusClusterPlus (Figures 3A–D; Supplementary Figure S1). The proportion of ambiguous clustering measurements and the similarity in expression levels we measured for the m6A-related lncRNAs shared by TCGA ultimately determined k = 3 to have the best cluster stability. There was also the least crossover between CC samples, when the consistency matrix with a k value of 3 was selected.
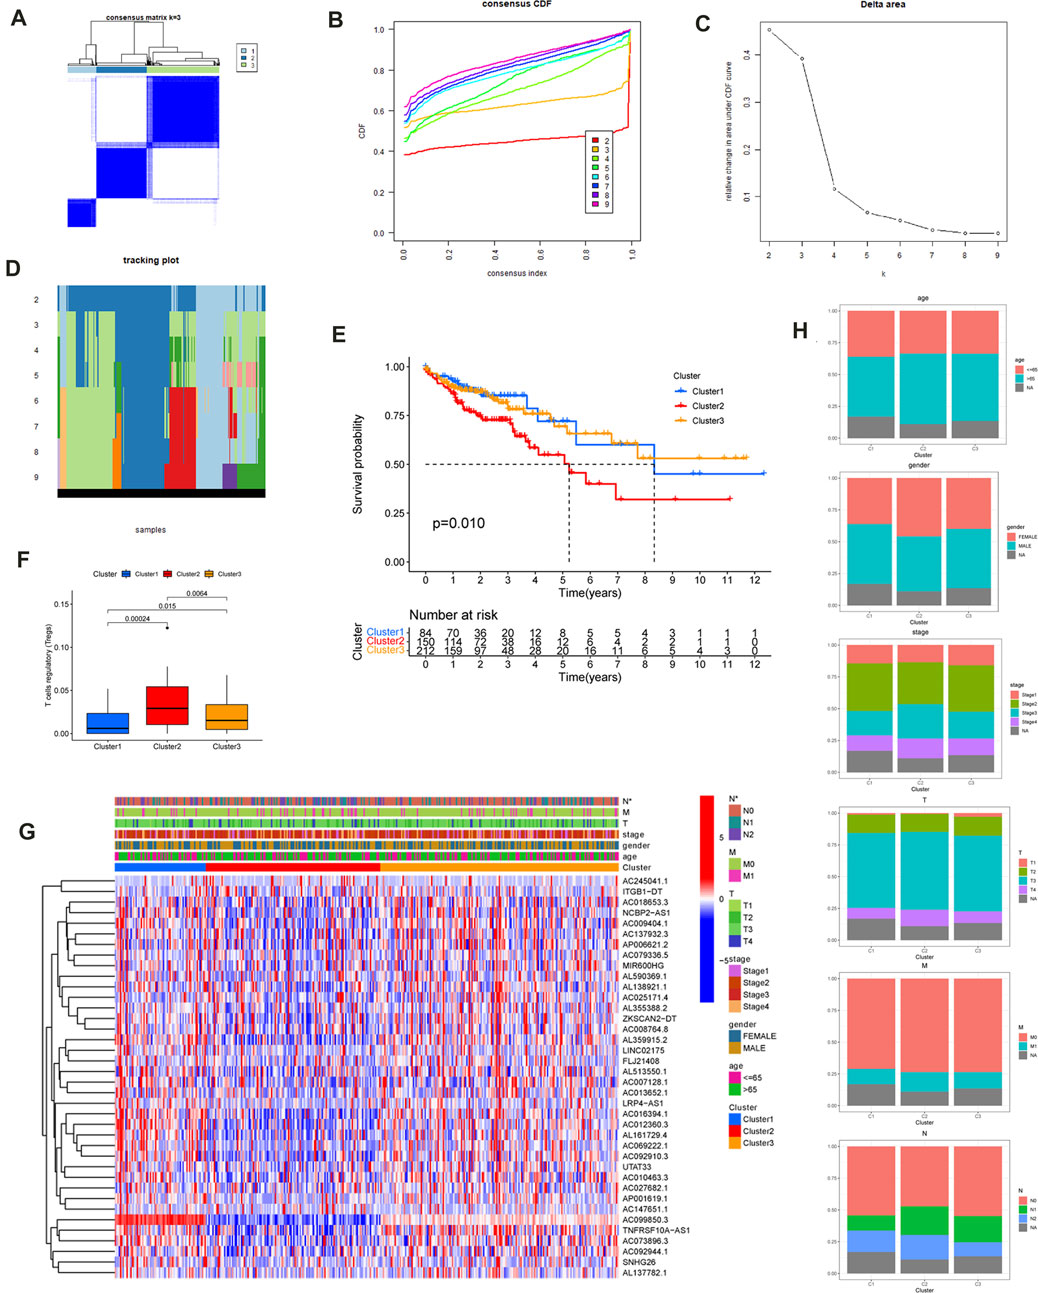
FIGURE 3. Consensus Clustering of the m6A-Related prognostic lncRNAs and Comparison of Immune Cell Infiltration. (A) The consensus clustering matrix at k = 3 and their correlation area. The rows and columns of the matrix represent samples. The values of the consistency matrix are shown in white to dark blue from 0 to 1, which represents the degree of consensus. (B) Consensus clustering cumulative distribution function (CDF) for k = 2 to 9. (C) The relative variation of the area under the CDF curve that k from 2 to 9. Delta area curve of consensus clustering, indicating the relative change in area under the CDF curve for each category number k compared with k–1. The horizontal axis represents the category number k and the vertical axis represents the relative change in area under CDF curve. (D) Tracking plot for k from 2 to 9. (E) Kaplan–Meier survival curves of COAD for three clusters. (F) The T cells regulatory (Tregs) differed significantly among three clusters. (G)The heatmap of the expression of the m6A-Related prognostic lncRNAs for three clusters. (***p < 0.001; **p < 0.01; *p < 0.05). (H) age, gender, T stage, N stage, M stage, and clinical stage distributions for three clusters.
In order to explore the clinical application value among the three clusters, the relationship between cluster and clinical features was evaluated using the Chi-square test, and the obtained heatmap is displayed in Figure 3G Among the three clusters, there was a significant difference in the N stage and, according to the Kaplan–Meier method (p = 0.010) (Figure 3E), a clear difference in survival time. The intracluster proportions for the three clusters were then analyzed based on age, gender, T, N, M, and clinical stage as shown in Figure 3H Subsequently, the CIBERSORT algorithm was used to analyze the infiltration of 22 immune cell types among three clusters. It was found that the Tregs differed significantly among the three clusters (Supplementary Figure S2). The T cells regulatory (Tregs) differed significantly among three clusters (Figure 3F). Furthermore, cluster3 displayed a greater number of Mast cells resting compared with cluster1. The NK cells resting, CD4 T cells memory activated, CD8 T cells, T cells gamma delta, and T cells regulatory differed significantly between cluster1 and cluster2. The T cells CD4 memory activated, NK cells resting, T cells gamma delta, and T cells regulatory differed significantly between cluster3 and cluster2.
The LASSO regression analysis was performed on 38 prognostic lncRNAs to develop a 14 m6A-LPS in TCGA dataset (Figures 4A, B; Supplementary Table 3). The correlations between the 14 prognostic lncRNAs and the m6A genes in TCGA were displayed in Figure 2F As shown in Figure 2G; Table 2, forest maps corresponding to these 14 prognostic lncRNAs were drawn, with the prognostic favorable factors TNFRSF10A-AS1, AC099850.3, AL137782.1, and AC073896.3 among them. The rest, on the other hand, were classified as prognostic unfavorable factors, and their over-expression might reduce survival. The Kaplan–Meier method was used to determine the prognostic value of the 14 hub lncRNAs in CC, with the median expression being the cutoff value. As displayed in Supplementary Figure S3, the four of the 14 hub lncRNAs (AC092944.1, AL138921.1, SNHG26, and TNFRSF10A-AS1) were identified using the Kaplan Meier-plotter (p < 0.05).
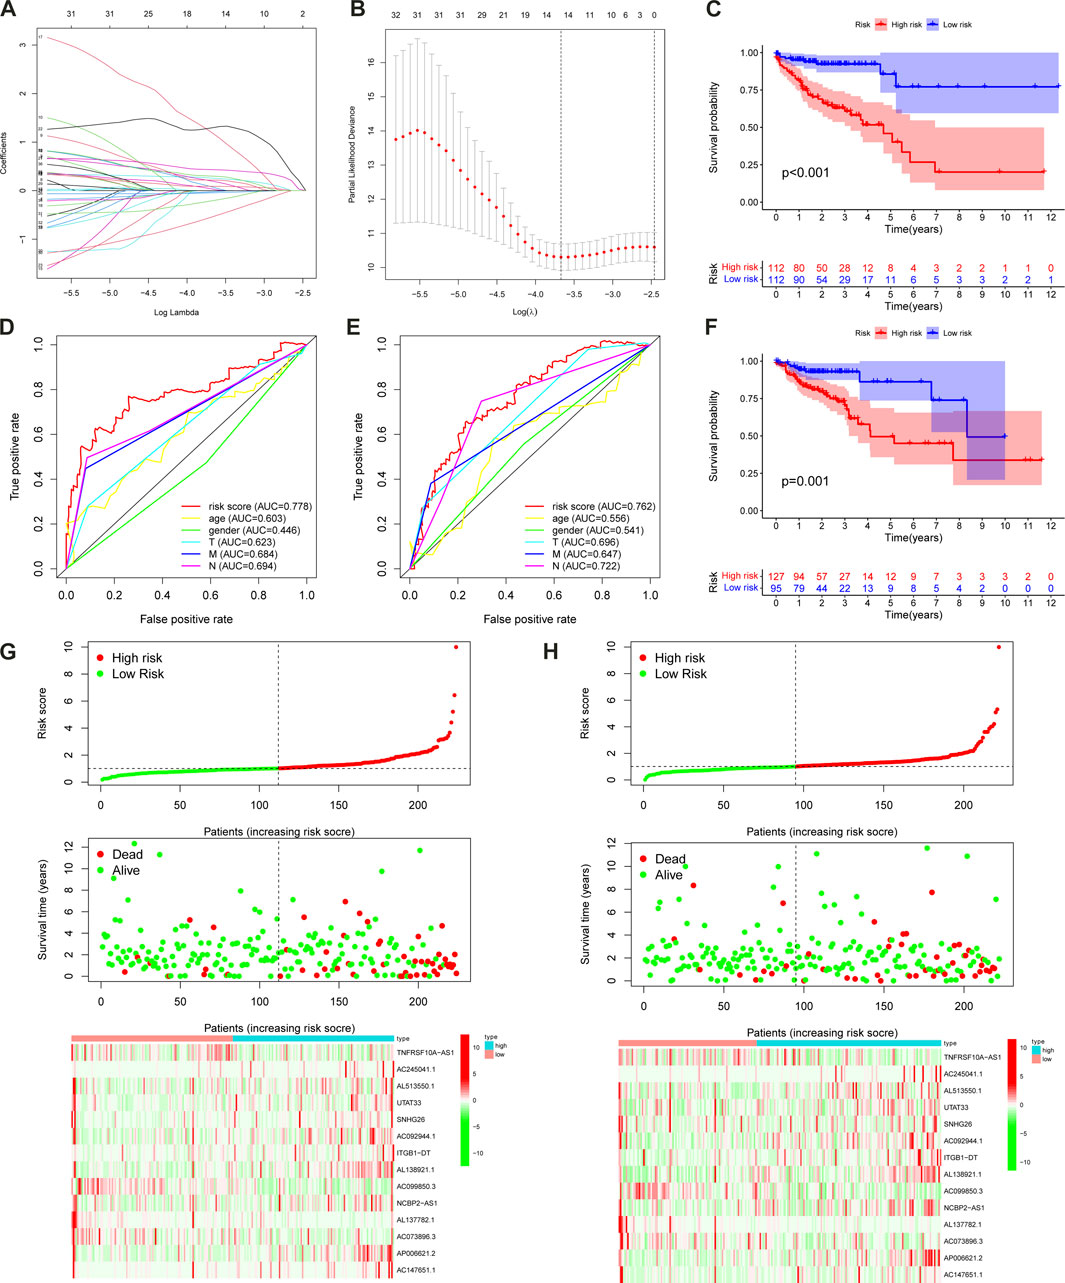
FIGURE 4. The m6A-LPS predicts overall survival in patients with CC. LASSO regression was performed, calculating the minimum criteria (A,B). The patients in the high-risk cohort had significantly shorter OS than those in the low-risk cohort in the training (C) and test sets (F); ROC curves of the m6A-LPS and clinical features for prediction of 3-year OS in the training (D) and test sets (E); risk score distribution, the distribution of survival time and survival status, and the heatmap of the expression of 14 m6A-related prognostic lncRNAs in the training (G) and test sets (H).
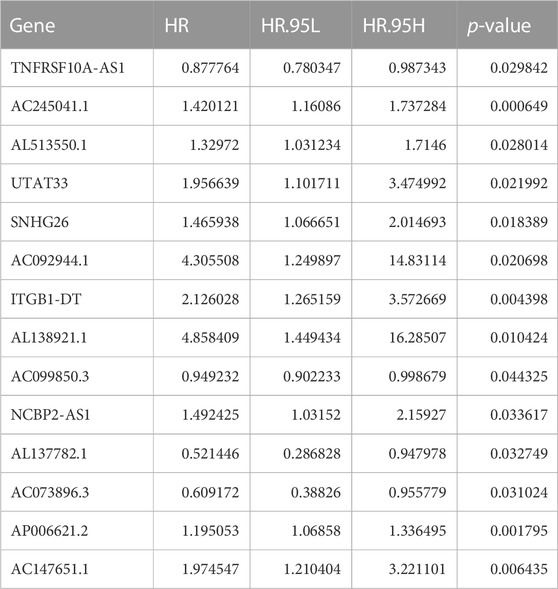
TABLE 2. Univariate Cox regression analysis of the 14 m6A-related prognostic lncRNAs.
We obtained the risk score of each case; risk score = (−0.02102 × TNFRSF10A-AS1 expression) + (0.259351 × AC245041.1 expression) + (0.19614 × AL513550.1 expression) + (0.21851 × UTAT33 expression) + (0.075165 × SNHG26 expression) + (1.187719 × AC092944.1 expression) + (0.433276 × ITGB1-DT expression) + (1.296707 × AL138921.1 expression) + (−0.04355 × AC099850.3 expression) + (0.034475 × NCBP2-AS1 expression) + (−0.53815 × AL137782.1 expression) + (−0.20653 × AC073896.3 expression) + (0.09041 × AP006621.2 expression) + (0.299669 × AC147651.1 expression). In order to validate the accuracy of the m6A-LPS, all cases were randomly separated into either a training set or test set. Furthermore, all cases in the TCGA-COAD cohort were separated into high- and low-risk subgroups in every set based on the median risk score. The K-M analysis revealed that the OS of high-risk patients declined compared to the low-risk patients in the training set (p < 0.001) (Figure 4C), which was further validated by the results of the test set (p = 0.001) (Figure 4F). Finally, the ROC curve revealed that the m6A-LPS exhibited a relatively decent predictive value in both the training and test sets in predicting a 3-year OS of CC in comparison to other clinical factors, as shown in Figures 4D, E. Figures 4G, H displays the risk score distribution, survival status, survival time, and expression heatmap based on the m6A-LPS in both the training and test sets. The ROC analysis revealed that the AUCs of the m6A-LPS at 1-, 3-, 5-year was 0.714, 0.777, 0.799 in the training set, respectively (Figure 5A); and that the AUCs of the m6A-LPS at 1-, 3-, 5-year was 0.686, 0.768, 0.774 in the test set (Figure 5B), respectively. The calibration curves for the probability of OS at 1, 3, 5 year showed good consistency between the actual observation and the m6A-LPS prediction (Figures 5C, D). According to Figures 5E, F, the mortality rate of the high-risk patients was higher in the training and test sets than in the low-risk patients. Following that, PCA indicated that the training (Figure 5G) and test sets (Figure 5H) should be distributed in two directions.
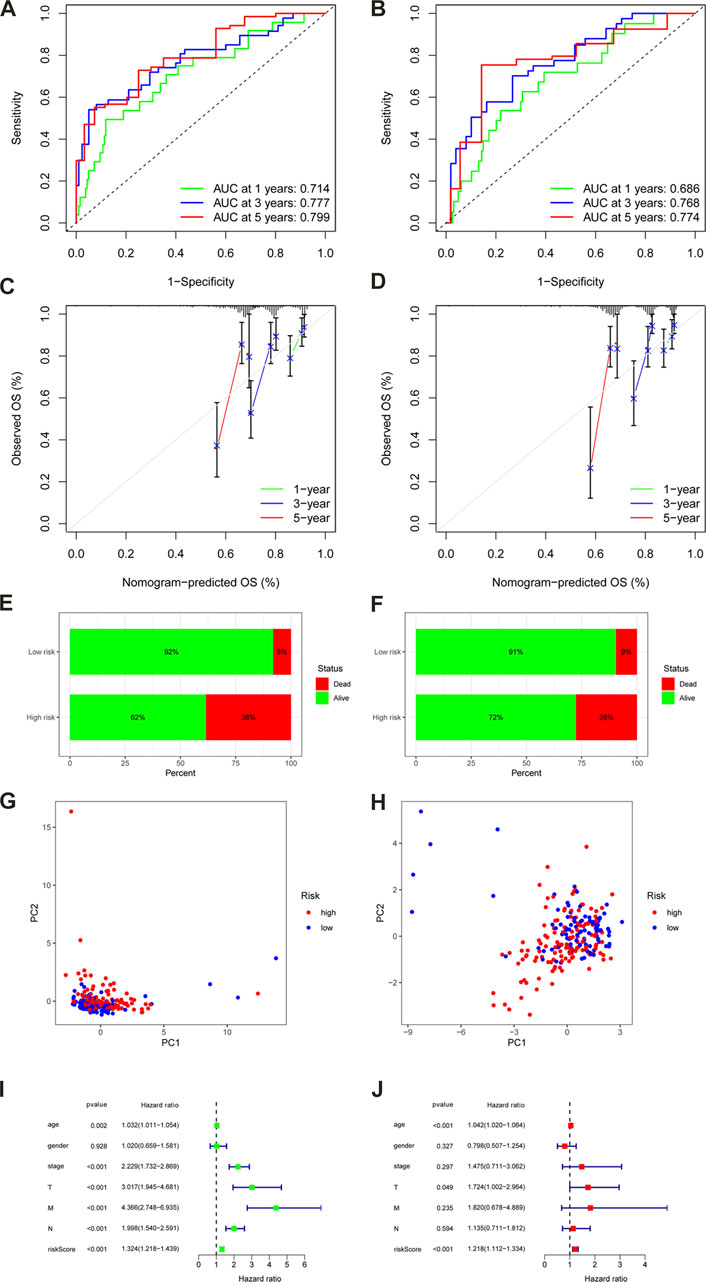
FIGURE 5. ROC curves of the m6A-LPS to predict 1-, 3-, and 5-year survival in the training (A) and test sets (B). A calibration plot of the m6A-LPS to predict 1-, 3-, and 5-year survival in the training (C) and test sets (D). Mortality rates of the low- and high-risk subgroups in the training (E) and test sets (F). Principal component analysis (PCA) plot in the training (G) and test sets (H). Univariable (I)and multivariable (J) analyses for the risk score and other clinical features.
The univariate and multivariate Cox regression analyses were conducted to confirm whether the m6A-LPS and clinicopathological features had independent prognostic characteristics for patients with CC in the TCGA-COAD cohort. The univariate Cox regression analyses revealed that the m6A-LPS, age, clinical stage, T, M, and N were all significantly related to OS (Figure 5I). Furthermore, the findings of the multivariate Cox analysis indicated that both m6A- LPS, and T were independent predictors for determining the OS of CC patients in the TCGA-COAD cohort (Figure 5J). As an applicable quantitative tool in the clinic, a nomogram containing m6A- LPS with clinical features was established to evaluate the life expectancy of CC patients in the TCGA-COAD cohort (Figure 6A). The total score for each case was obtained by calculating the points of every parameter to predict the 1-year, 3-year, and 5-year OS among CC patients. The calibration curves for the probability of OS at 1, 3, 5 year showed good consistency between the actual observation and the nomogram prediction (Figure 6B). Finally, as shown in Figure 6C, the ROC curve revealed that the m6A-LPS-based nomogram had relatively decent predictive value in predicting 1-year (AUCs = 0.779), 3-year (AUCs = 0.812) and 5-year (AUCs = 0.820) OS.
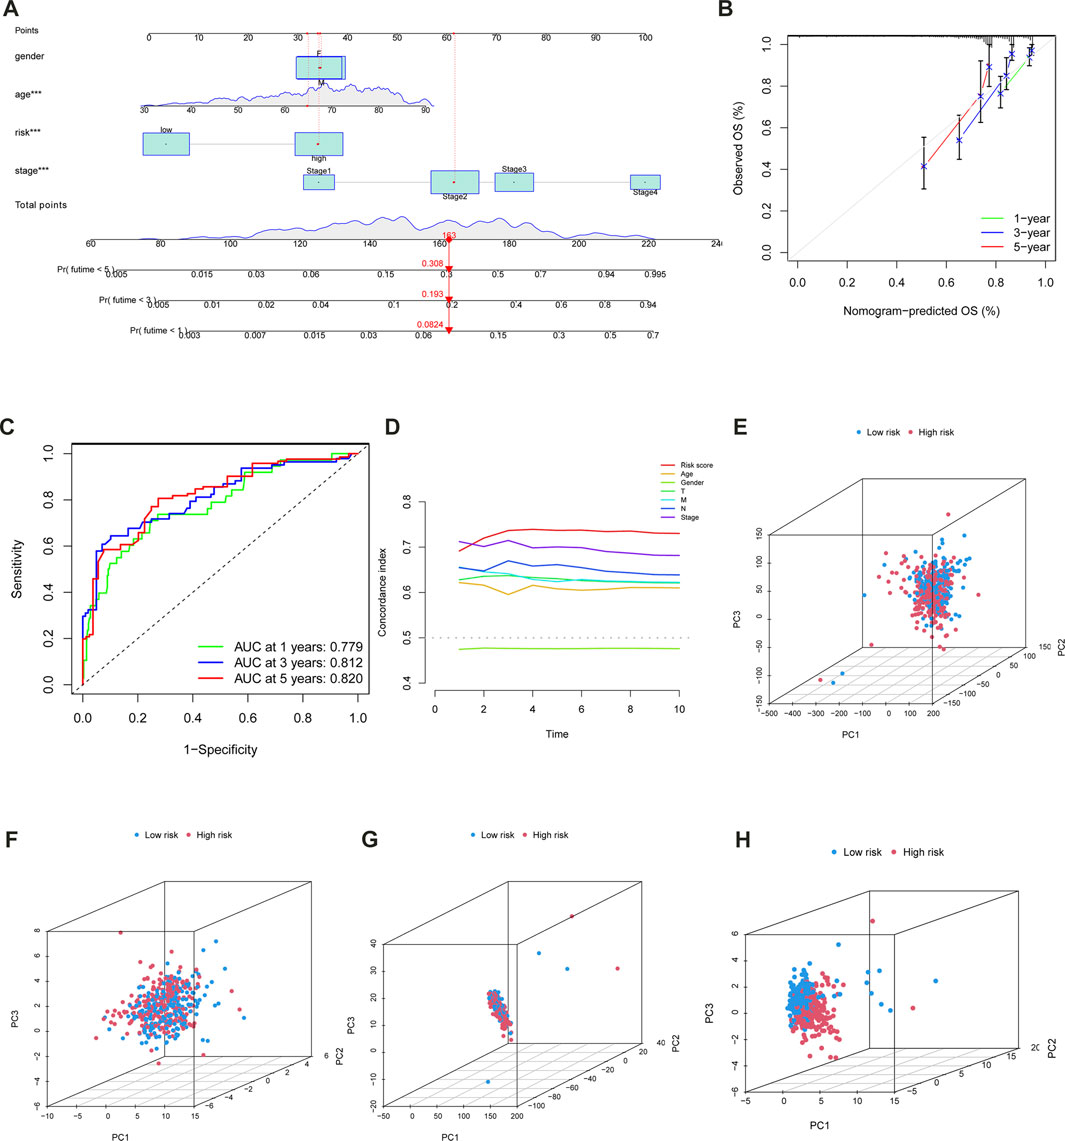
FIGURE 6. (A) Nomogram incorporated with the m6A-LPS and clinical features for prediction of 1-, 3- and 5- years OS in patients with CC. (B) Calibration plot of the nomogram to predict 1-, 3-, and 5-year survival. (C) ROC curves of the nomogram to predict 1-, 3-, and 5-year survival.f of m6A-LPS for the patients divided by each clinical characteristic. (D) The concordance of risk score and other clinical indicators. PCA was used to identify the distinct patterns of m6A distribution on expression profiles of the whole gene (E), 21 m6A genes (F), m6A-related lncRNAs (G), and 14 hub lncRNAs of the m6A-LPS (H).
To validate risk models, PCA was also applied, and the results were displayed using the R software’s “scatterplot3D” tools. PCA was used to identify the distinct patterns of m6A distribution on expression profiles of the whole gene (Figure 6E), 21 m6A genes (Figure 6F), m6A-related lncRNAs(Figure 6G), and 14 hub lncRNAs of the m6A-LPS (Figure 6H). It was clear from the m6A-LPS results that there were more noticeable differences in distributions between the low- and high-risk groups than from the other three approaches. Based on the m6A-LPS, we intuitively observed that CC patients were effectively divided into two subgroups. The risk score’s concordance index increased over time, outpacing the concordance index of other clinical indicators (Figure 6D). In light of these findings, the m6A-LPS may be a better predictor of the prognosis of CC.
In order to explore the clinical practice of the m6A- LPS, the chi-square test was used to investigate the relationship between the m6A-LPS and clinical features. The heatmap from the resulting diagram is displayed in Figure 8A. The cluster, T, N, and clinical stages were all significantly different in the various risk-subgroups. Following that, the Wilcoxon or Kruskal-Wallis tests were used to examine the relationships between 14 hub lncRNAs and clinical features (Figure 7B—M; Supplementary Table 4). AC147651.1, TNFRSF10A-AS1, and the m6A- LPS were significantly linked to the clinical stage; AL138921.1 and the m6A- LPS were significantly linked to the T stage; AC099850.3-N, SNHG26, TNFRSF10A-AS1, and the m6A- LPS were significantly linked to the N stage; AC245041.1 was significantly linked to age; AL137782.1 was significantly associated linked to the M stage.
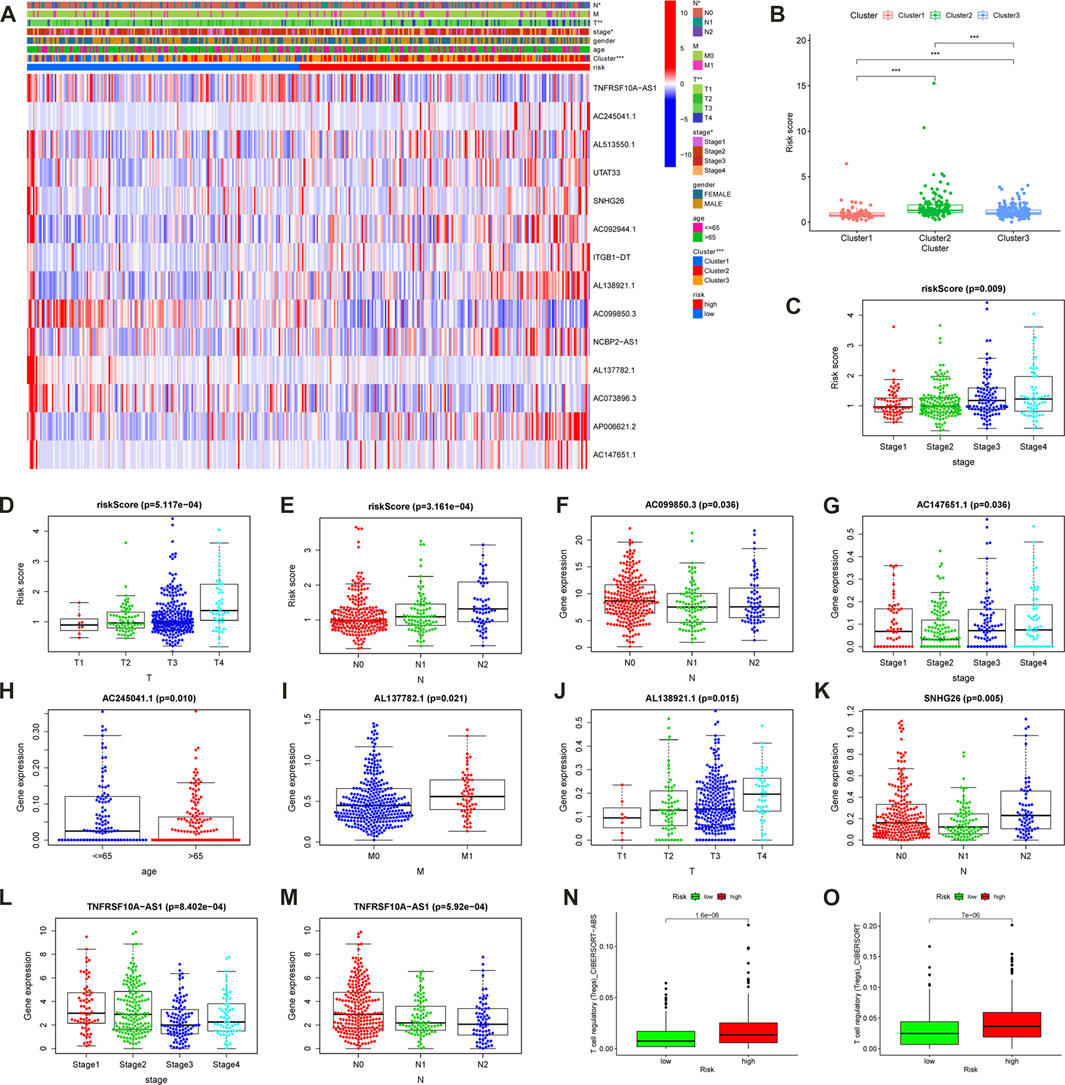
FIGURE 7. Clinical Application Value of the m6A- LPS. (A) The heatmap of m6A-related gene expression, cluster, clinical features, and m6A- LPS. The box plots along with the scatter plots showed that cluster (B), clinical stage(C), T stage(D), and N stage (E) were significantly associated with the risk score. (F–M) Correlations between 14 hub lncRNAs and clinical features. (N,O) The difference of Treg cell infiltration in high and low risk groups.
A detailed correlation analysis using the Spearman method was performed to determine the correlation between the m6A-LPS and tumor-infiltrating immune cells based on the cohort data from TCGA-COAD, with the results shown in a bubble plot (Figure 8A). The results indicated that the m6A-LPS had a negative relation with neutrophils, plasmacytoid dendritic cells, and resting mast cells, and a positive relation with regulatory T cells, monocytes, B cells, and CD8+ T cells (Supplementary Figure 5; Supplementary Table 5). The results were similar to consensus clustering analysis. The regulatory T cells are highly expressed in both cluster 2 and high-risk groups, and both have the worse prognosis (Figures 7N, O). As ICIs were recommended for treating CC in clinics, the differences in ICI-related biomarkers between the two subgroups in the TCGA-COAD cohort were investigated. The Box-Violin plots revealed that ICI-related biomarkers, such as CD274 (PD-L1), CXCL10, GZMB, and IFNG, were upregulated in high-risk patients in the TCGA-COAD cohort (Figures 8B–F), whereas TBX2 was downregulated.
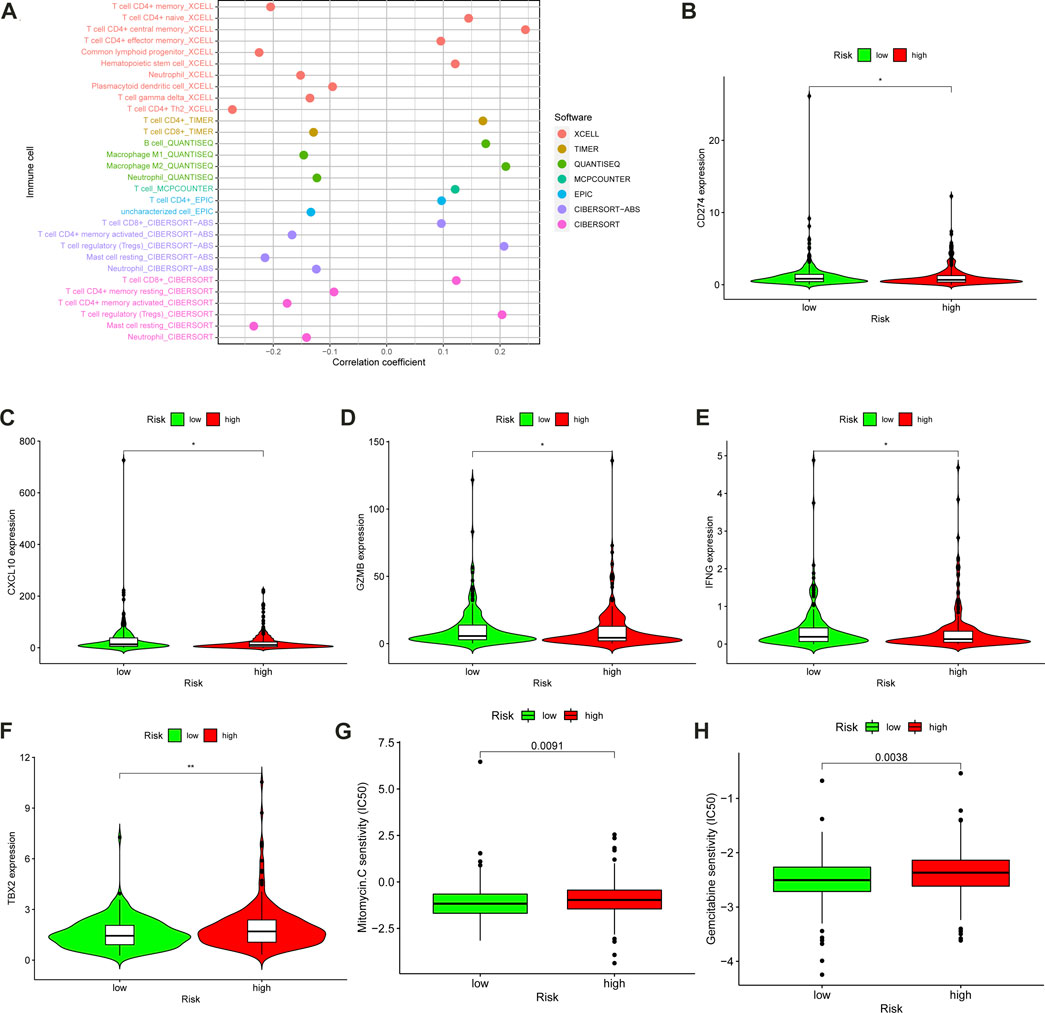
FIGURE 8. Assessment of Tumor-Infiltrating Cells and Immunosuppressed Molecules by the m6A-LPS. (A) The bubble plot visualized the correlation between the m6A-LPS and tumor infiltration immune cells by Spearman correlation analysis. Box-Violin plots visualized the correlation between the m6A-LPS and immune-checkpoint-relevant genes, CD274 (B), CXCL10 (C), GZMB (D), IFNG (E), and TBX2 (F); *p < 0.05, ** p < 0.01, and *** p < 0.001. Boxplots evaluating the response to the mitomycin (G) and gemcitabine (H) chemotherapeutic between high-and low-risk patients.
In order to evaluate the m6A-LPS in clinical practice for treating CC, the therapeutic response was estimated by calculating the half-maximal inhibitory concentration (IC50) of the standard chemotherapeutic drugs for each sample. IC50 of chemotherapeutics was obtained from the Genomics of Drug Sensitivity in Cancer (GDSC) website in TCGA. The differences in the IC50 between the high- and low-risk subgroups were examined using the Wilcoxon signed-rank test. The results were displayed in a box plot obtained utilizing the R packages ggpubr, pRRophetic, and ggplot2. The box plot revealed a positive association between a high-risk score and a higher IC50 of mitomycin (p = 0.0091) (Figure 8G) and gemcitabine (p = 0.0038) (Figure 8H), suggesting that the m6A-LPS has potential as a predictor in CC patients for chemosensitivity.
The maftools R package was utilized to explore the differences between the two subgroups in tumor mutation burden (TMB) in the TCGA-COAD cohort. Figures 9A, B showed the first 20 most frequently mutated genes in the high- and low-risk subgroups. It indicates that the low-risk subgroup has a more extensive TMB than the high-risk subgroup. Then, all cases in the TCGA-COAD cohort were separated into high TMB and low TMB subgroups according to the cutoff of TMB. The K-M analysis revealed that the OS of the high TMB subgroup declined compared to the low TMB subgroup (p = 0.036) (Figure 9C). Following that, the synergistic effect of TMB and risk score in the prognostic stratification of CC patients was assessed. The survival curve of TMB combined with risk score showed that there was a clear difference in survival time among the four subgroups (p < 0.001), including high TMB & high-risk score, high TMB & low-risk score, low TMB & low-risk score, and Low TMB & high-risk score (Figure 9D).
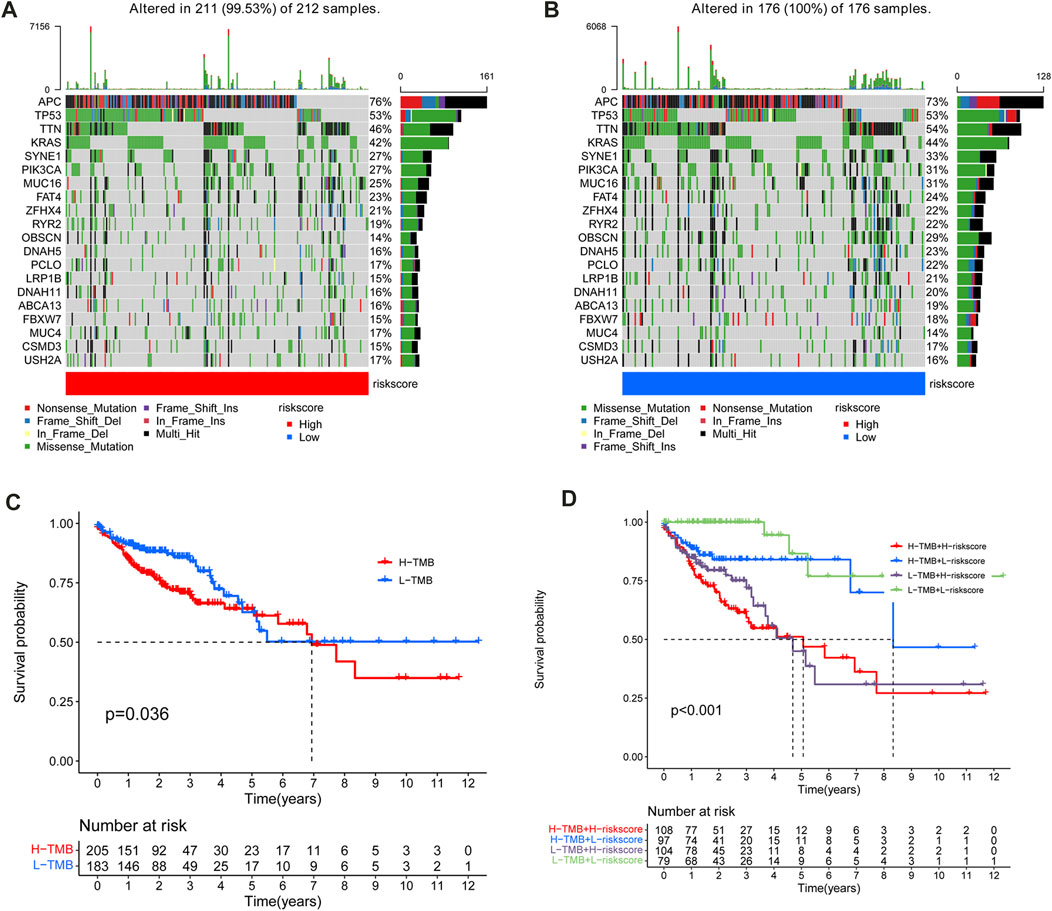
FIGURE 9. Mutation frequency of the top 20 genes with the most frequent mutations in the training (A) and test sets (B). (C) Kaplan–Meier curves for patients with high and low TMB subgroups in the TCGA cohort. (D)Survival analysis of distinct groups stratified by both TMB and risk score.
GSEA was applied to predict the potential GO and KEGG pathways, and the top 5 most relevant items were selected. Figures 10A–F showed the potential functions and access among the three clusters. Following that, GSEA was applied to predict the potential GO and KEGG pathways in the high- and low-risk subgroups. With regard to KEGG pathway analysis as shown in Figure 10G, we found that the following pathways were active in high-risk subgroups: “oocyte meiosis”, “pathways in cancer”, “regulation of actin cytoskeleton”; and that the following pathways were active in low-risk: “drug metabolism cytochrome p450”, “retinol metabolism”, “glycine serine and threonine metabolism”, “tryptophan metabolism”, “fatty acid metabolism”. In addition, the results of GO analysis (Figure 10H) indicated that “negative regulation of cellular amide metabolic process,” and “intrinsic apoptotic signaling pathway,” were mainly enriched in high-risk subgroups, and that “monocarboxylic acid catabolic process,” “organic acid catabolic process,” “aromatase activity,” “fatty acid catabolic process,” and “fatty acid beta-oxidation” were mainly enriched in low-risk subgroups. The results revealed the differentially enriched pathway and biological processes were mostly related to tumor progression and metabolism.
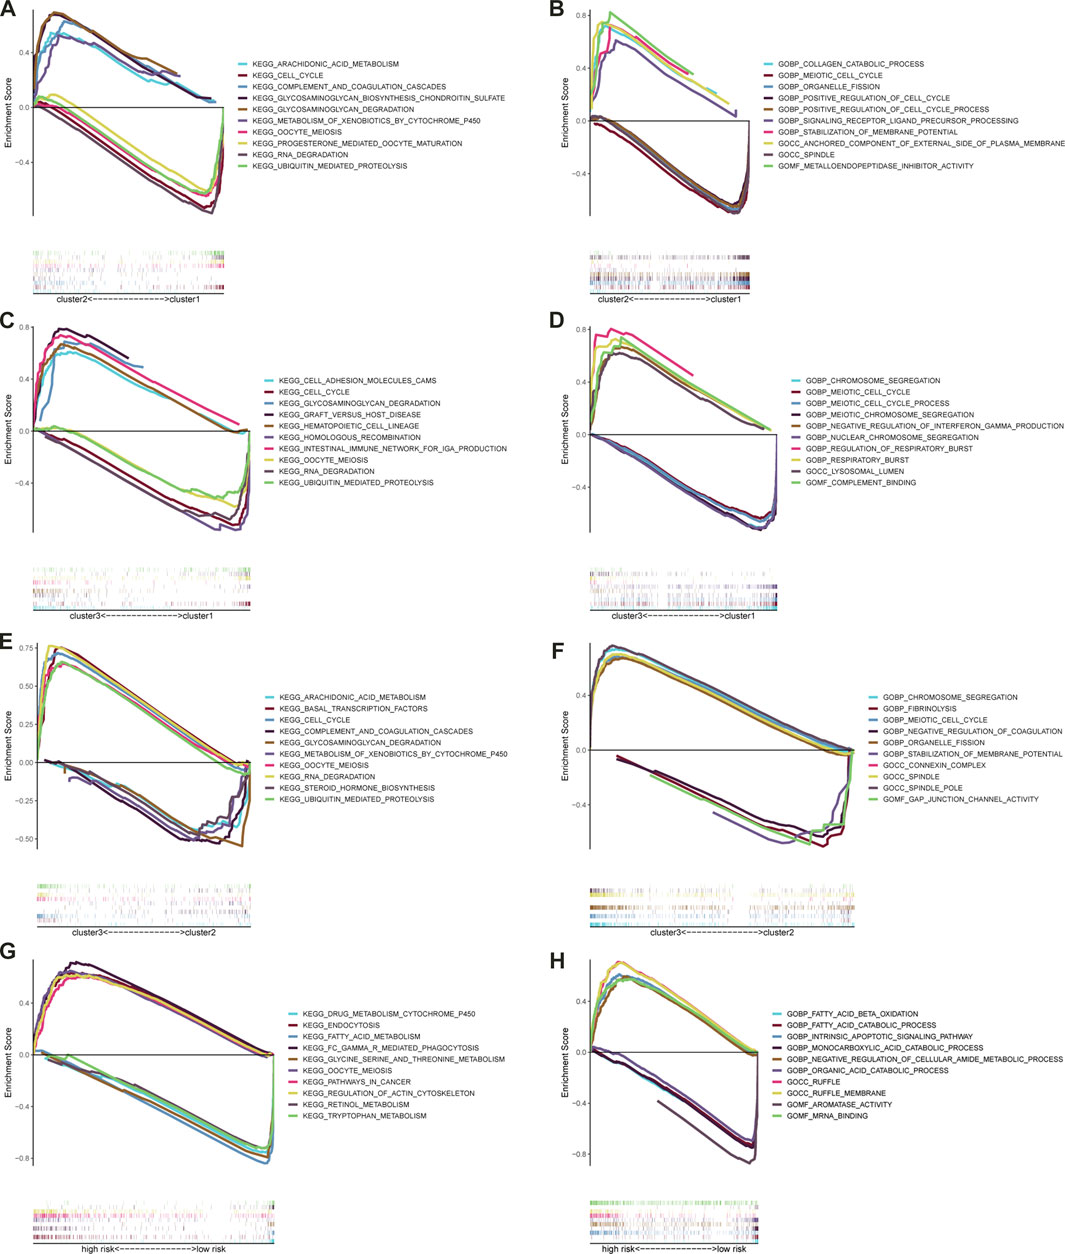
FIGURE 10. Significantly enriched GO terms and KEGG pathways via GSEA. The top five most relevant items GO terms (A) and KEGG pathways (B) between the cluster2 and cluster1; The top five most relevant items GO terms (C) and KEGG pathways (D) between the cluster3 and cluster1; The top five most relevant items GO terms (E) and KEGG pathways (F) between the cluster3 and cluster2; The top five most relevant items GO terms (G) and KEGG pathways (H) between the high- and low-risk subgroups.
The data of 452 CC patients in the TCGA-COAD cohort were examined. In addition, a K-M curve was drawn to demonstrate the correlation between clinicopathologic characteristics and prognosis. The results indicated that age, T, N, M, and clinical stage were statistically significant for prognosis (Supplementary Figure S4). Following that, a stratified analysis for CC patients was performed, which revealed that the m6A-LPS, as a dependable prognostic indicator, had a robust predictive ability for the survival of CC patients (Figure 11A—F). However, the m6A-LPS was not able to independently estimate the survival of CC patients in the T1-2 (Figure 11D) subgroups.
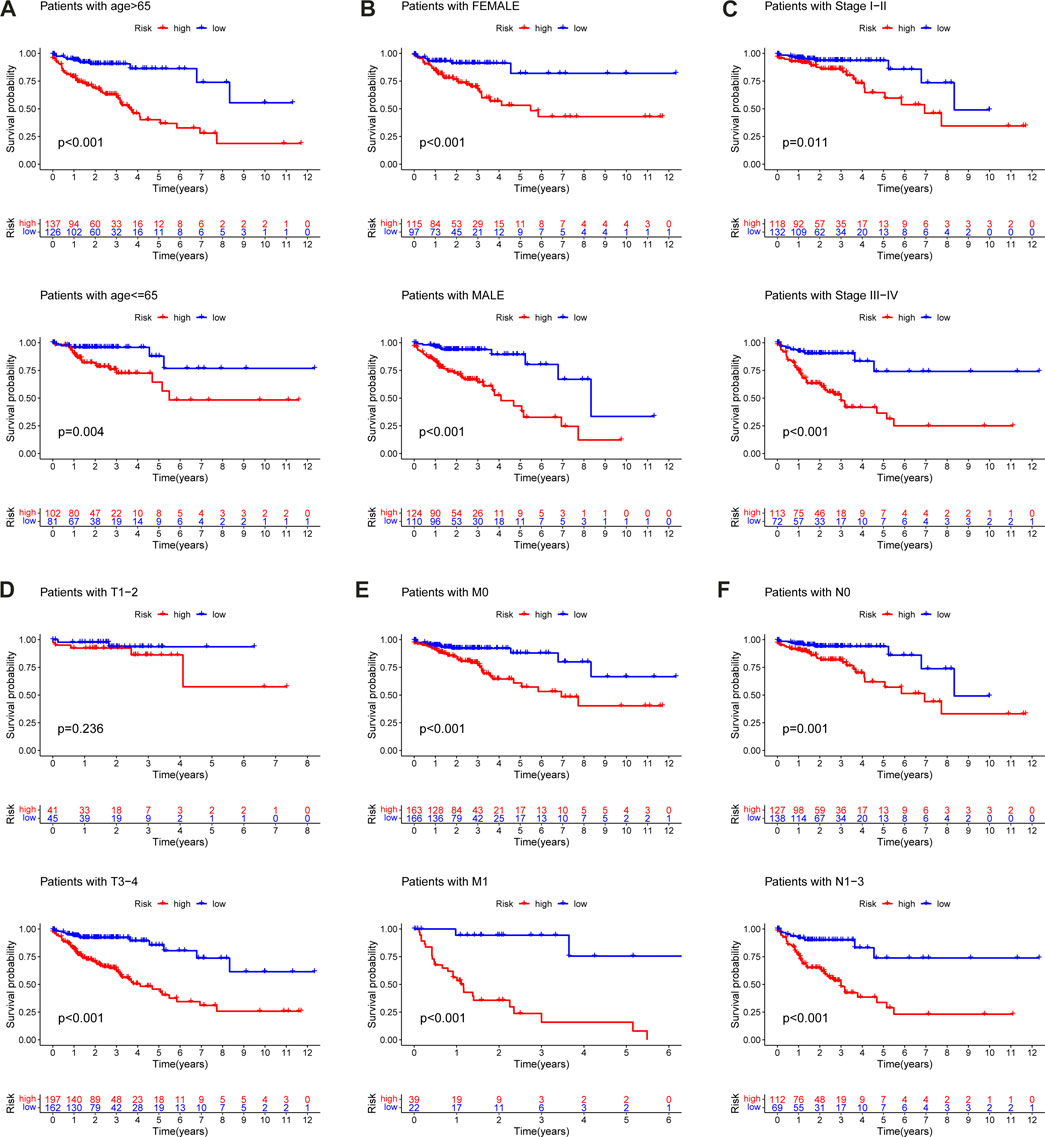
FIGURE 11. Kaplan–Meier curves for the prognostic value of m6A-LPS for the patients divided by each clinical characteristic. (A) age, (B) gender, (C) stage (D) T, (E) M, (F) N.
The expression of the 14 prognostic lncRNAs significantly differed in CC and normal samples (p < 0.05, Figures 12A–N) in the TCGA-COAD cohort. The expression levels of 11 prognostic lncRNAs were investigated in 3 CC cell lines (HCT116, HT29, SW620), normal colon epithelial cells (NCM460) as control (Figures 12O–Y). The results showed that AC073896.3, AC099850.3, AL137782.1, AP006621.2, ITGB1-DT, NCBP2-AS1, SNHG26, and TNFRSF10A-AS1 were significantly increased in CC cell lines, compared with NCM460. AC092944.1, AC245041.1, and AL513550.1 were significantly decreased in CC cell lines cell line, compared with NCM460.
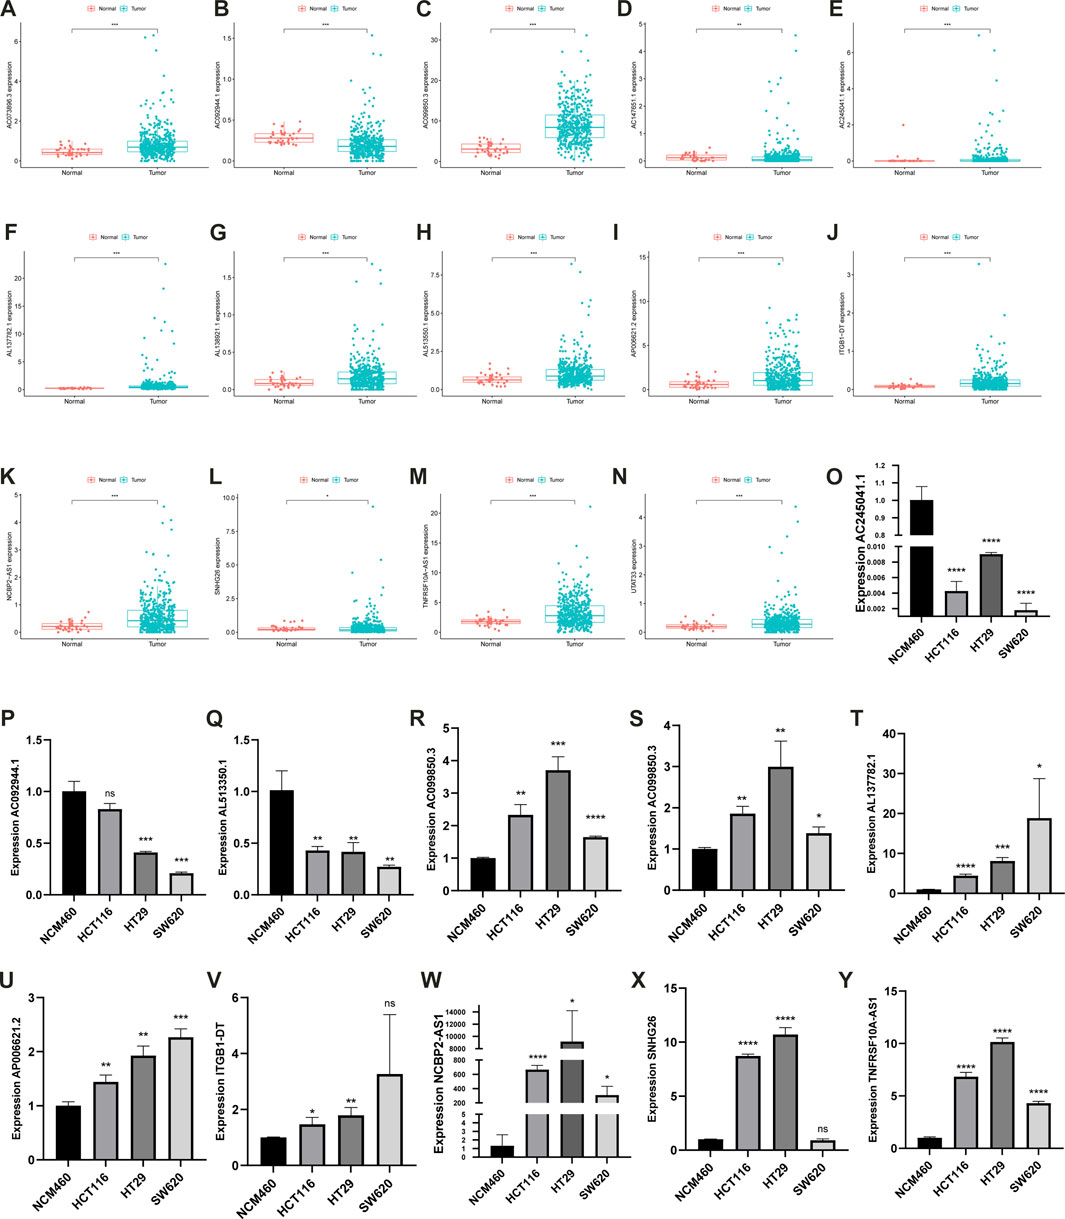
FIGURE 12. The bar plot of 14 prognostic lncRNAs in normal and tumor tissues (A–N). The expression characteristics of the AC092944.1, AC245041.1, AL513550.1, AC073896.3, AC099850.3, AL137782.1, AP006621.2, ITGB1-DT, NCBP2-AS1, SNHG26, TNFRSF10A-AS1 in multiple types of CC cell lines (O–Y).
LncRNAs have been shown to promote or inhibit protein-coding genes in a number of physiological and pathological processes (Wilusz et al., 2009; Ma et al., 2017; Zhang et al., 2019). Increasing evidence suggests that m6A-related genes can regulate the incidence and progression of a variety of malignant tumors by modifying specific lncRNAs. Furthermore, lncRNAs could be used as competitive endogenous RNAs to regulate tumor invasive progression by targeting m6A-related genes.
Recently, several studies reported that the m6A-associated regulators were dysregulated in CC, as well as being involved in the initiation and progression of the disease. Ni et al. (2019) identified a novel negative functional loop, the lncRNA GAS5-YAP-YTHDF3 axis, in a clinical study. Compared to the adjacent tissues, the expression of GAS5 was lower in CRC tissues. In CRC patients, the high expression levels of YAP and YTHDF3 were linked to the low expression of GAS5. These findings offer a novel therapeutic option for CRC patients. According to Yang et al. (2020), METTL14 was downregulated in CRC and the low expression of METTL14 may be associated with the proliferation and invasion in CRC. Moreover, it was discovered that lncRNA XIST was a downstream target of METTL14, and that the expression of XIST was negatively correlated with METTL14 and YTHDF2. The lncRNA RP11 is upregulated in clinical settings and is regulated by m6A methylation. Furthermore, m6A-induced lncRNA RP11 can promote CRC cell metastasis and proliferation through the upregulation of Zeb1 (Wu et al., 2019).
The majority of previously published studies focused on the intrinsic carcinogenic pathways of CC. However, how lncRNA interacts with m6A regulators in carcinogenesis and progression of CC, as well as the overall patterns of the m6A-related lncRNA in CC, remain unknown. Therefore, in-depth studies of the m6A-related lncRNA will contribute to the identification of therapeutic biomarkers that have clinical prognostic value and the development of more effective therapeutic strategies. In the present study, we identified the m6A-related lncRNAs using correlation analysis implemented by the Pearson method from TCGA. The TCGA confirmed 38 m6A-related lncRNAs related to the prognosis, and three m6A modification patterns with significantly different N stages, survival time, and immune landscape were identified according to these lncRNAs. Additionally, 14 of 38 prognostic lncRNAs were applied to develop an m6A-related lncRNA model to predict the OS of CC patients. In further analysis, the overall survival, cluster, T, N, and clinical stage significantly differed in the different risk-subgroups in further analysis. Notably, the ROC curve revealed that the m6A-LPS exhibited a relatively decent predictive value in both the training and test sets in predicting a 3-year OS of CC in comparison to other clinical factors. In addition, a nomogram was established to predict the survival time of CC patients. Finally, the relationship with immunotherapy responses was investigated. Surprisingly, there was a significant correlation between the m6A-LPS and the tumor-infiltrating immune cells. The m6A-LPS has potential as a predictor of ICI treatment response and chemosensitivity in CC patients.
Chang et al. (2021) identified a positive feedback loop “ITGB1-DT/ITGB1/Wnt/β-catenin/MYC” among the 14 hub lncRNAs, significantly promoting the proliferation, migration, and invasive ability of lung adenocarcinoma cells. The enhanced expression of ITGB1-DT, an oncogenic lncRNA, has been linked to the poor OS and disease-free survival (Chang et al., 2021). NCBP2-AS1 has been implicated in a model of colon adenocarcinoma recurrence prognosis based on competing endogenous RNAs (Jin et al., 2020). In renal cell carcinoma, AP006621.2 has been identified as a redox-related prognostic factor (Qi-Dong et al., 2020). In bladder cancer, SNHG26 was discovered to be an epithelial-mesenchymal transition-related prognostic factor (Tong et al., 2021). In addition, AC073896.3 and TNFRSF10A-AS1 have been used as components of an autophagy-related lncRNA signature to improve colorectal cancer prognosis (Wei et al., 2020; Zhou et al., 2020). Meanwhile, AC073896.3 and TNFRSF10A-AS1 are prognostic favorable factors for colon cancer, which is consistent with our study (Wei et al., 2020; Zhou et al., 2020). AL137782.1 and AC073896.3 are protective factors for colon cancer, which is consistent with our study (Zhang et al., 2021b). Recently, AC099850.3 was proven to be involved in the migration and proliferation of hepatocellular carcinoma by regulating the expression of cell-cycle-related molecules (Wu et al., 2021). In addition, AC099850.3 was highly expressed in HCC and squamous cell carcinoma of the tongue and increased the predicted value of the signature through coexpression and the ceRNA mechanism (Zhou et al., 2019; Jia et al., 2020; Wu et al., 2020; Jiang et al., 2021). However, there have been few reports on the other lncRNAs.
Compared with the similar study by Chen S (Chen et al., 2021), our model has a better predictive value for OS of cancer patients at 1-, 3-, 5-year. Furthermore, we also comprehensively investigated the relationship between the model and consensus cluster, tumor infiltration immune cells, immunosuppressed biomarkers, somatic variants, and chemotherapeutic drug efficacy. Inevitably, there were several limitations to this study. As a retrospective study, this study demonstrated a certain degree of heterogeneity among patients, hence, future validation studies are required. In addition, the m6A-LPS, as well as its correlation with TME, did not undergo external verification because of insufficient data from other independent cohorts. Therefore, several methods were utilized to verify this novel prognostic signature. Finally, the data of TCGA released publicly was mainly mined and analyzed as this study required further external validation in multicenter cohorts.
This is the first study that comprehensively identified and systematically analyzed the expression data of m6A-related lncRNAs in CC in the TCGA database. The m6A-LPS, which is based on 14 m6A-related lncRNAs, has been revealed to be a novel potential and promising biomarker for evaluating the prognosis of CC patients. The survival rate, clinical features, tumor infiltration immune cells, immunosuppressed biomarkers, and chemotherapeutic drug efficacy were all re-evaluated. This study revealed that the risk signature is a promising predictive indicator that may provide more accurate clinical applications in CC therapeutics and enable effective therapy strategies for clinicians.
The original contributions presented in the study are included in the article/Supplementary Material, further inquiries can be directed to the corresponding author.
YWa and HC conceived and designed the study, and revised the manuscript. DZ, YL, YWu, HM, XL, HW, XJ, GZ, and LF conducted all data collection and analysis and compiled charts. All authors read and approved the final manuscript. All authors contributed to the article and approved the submitted version.
This work was funded by The 2021 Central-Guided Local Science and Technology Development Fund (ZYYDDFFZZJ-1), Natural Science Foundation of Gansu Province, China (No. 18JR3RA052), Lanzhou Talent Innovation and Entrepreneurship Project Task Contract (No. 2016-RC-56), Gansu Da Vinci robot high-end diagnosis and treatment team construction project, Excellent master/doctoral program of Gansu Provincial People's Hospital (22GSSYD-1), National Key Research and Development Program (No. 2018YFC1311500), COVID-19 prevention and control technology research project (2020-XG-1), Gansu Province Excellent Doctor Fund Project (23JRRA1320), and National Key Research and Development Program (No. 2018YFC1311500).
This work has benefited from TCGA. The authors thank Key Laboratory of Molecular Diagnostics and Precision Medicine for Surgical Oncology in Gansu Province and the DaVinci Surgery System Database (DSSD, www.davincisurgerydatabase.com) and for their help and support in the methodology.
The authors declare that the research was conducted in the absence of any commercial or financial relationships that could be construed as a potential conflict of interest.
All claims expressed in this article are solely those of the authors and do not necessarily represent those of their affiliated organizations, or those of the publisher, the editors and the reviewers. Any product that may be evaluated in this article, or claim that may be made by its manufacturer, is not guaranteed or endorsed by the publisher.
The Supplementary Material for this article can be found online at: https://www.frontiersin.org/articles/10.3389/fgene.2023.906346/full#supplementary-material
Aran, D. (2020). Cell-type enrichment analysis of bulk transcriptomes using xCell. Methods Mol. Biol. 2120, 263–276. doi:10.1007/978-1-0716-0327-7_19
Aran, D., Hu, Z., and Butte, A. J. (2017). xCell: digitally portraying the tissue cellular heterogeneity landscape. Genome Biol. 18, 220. doi:10.1186/s13059-017-1349-1
Chang, R., Xiao, X., Fu, Y., Zhang, C., Zhu, X., and Gao, Y. (2021). ITGB1-DT facilitates lung adenocarcinoma progression via forming a positive feedback loop with ITGB1/wnt/β-catenin/MYC. Front. Cell Dev. Biol. 9, 631259. doi:10.3389/fcell.2021.631259
Chen, B., Khodadoust, M. S., Liu, C. L., Newman, A. M., and Alizadeh, A. A. (2018). Profiling tumor infiltrating immune cells with CIBERSORT. Methods Mol. Biol. 1711, 243–259. doi:10.1007/978-1-4939-7493-1_12
Chen, S., Li, X., Guo, L., Zhang, J., Li, L., Wang, X., et al. (2021). Characterization of the m6A-related lncRNA signature in predicting prognosis and immune response in patients with colon cancer. J. B.U.ON, official J. Balkan Union Oncol. 26, 1931–1941.
Dienstmann, R., Villacampa, G., Sveen, A., Mason, M. J., Niedzwiecki, D., Nesbakken, A., et al. (2019). Relative contribution of clinicopathological variables, genomic markers, transcriptomic subtyping and microenvironment features for outcome prediction in stage II/III colorectal cancer. Ann. Oncol. 30, 1622–1629. doi:10.1093/annonc/mdz287
Feng, Z., Gao, H., and Feng, T. (2021). Immune infiltrates of m6A RNA methylation-related lncRNAs and identification of PD-L1 in patients with primary head and neck squamous cell carcinoma. Front. Cell Dev. Biol. 9, 672248. doi:10.3389/fcell.2021.672248
Jia, Y., Chen, Y., and Liu, J. (2020). Prognosis-predictive signature and nomogram based on autophagy-related long non-coding RNAs for hepatocellular carcinoma. Front. Genet. 11, 608668. doi:10.3389/fgene.2020.608668
Jiang, Q., Xue, D., Shi, F., and Qiu, J. (2021). Prognostic significance of an autophagy-related long non-coding RNA signature in patients with oral and oropharyngeal squamous cell carcinoma. Oncol. Lett. 21, 29. doi:10.3892/ol.2020.12290
Jin, L., Liu, T., Meng, F., and Tai, J. (2020). Prognosis prediction model based on competing endogenous RNAs for recurrence of colon adenocarcinoma. BMC cancer 20, 968. doi:10.1186/s12885-020-07163-y
Johnsson, P., Lipovich, L., Grander, D., and Morris, K. V. (2014). Evolutionary conservation of long non-coding RNAs; sequence, structure, function. Biochim. Biophys. Acta 1840, 1063–1071. doi:10.1016/j.bbagen.2013.10.035
Kanehisa, M., Furumichi, M., Tanabe, M., Sato, Y., and Morishima, K. (2017). Kegg: New perspectives on genomes, pathways, diseases and drugs. Nucleic Acids Res. 45, D353–D361. doi:10.1093/nar/gkw1092
Lan, Y., Liu, B., and Guo, H. (2021). The role of M6A modification in the regulation of tumor-related lncRNAs. Mol. Ther. Nucleic acids 24, 768–779. doi:10.1016/j.omtn.2021.04.002
Li, T., Fan, J., Wang, B., Traugh, N., Chen, Q., Liu, J. S., et al. (2017). Timer: A web server for comprehensive analysis of tumor-infiltrating immune cells. Cancer Res. 77, e108–e110. doi:10.1158/0008-5472.Can-17-0307
Lu, G., and Zhang, Y. (2020). Long non-coding RNA ATB promotes human non-small cell lung cancer proliferation and metastasis by suppressing miR-141-3p. PLoS ONE 15, e0229118. doi:10.1371/journal.pone.0229118
Ma, S., Chen, C., Ji, X., Liu, J., Zhou, Q., Wang, G., et al. (2019). The interplay between m6A RNA methylation and noncoding RNA in cancer. J. Hematol. Oncol. 12, 121. doi:10.1186/s13045-019-0805-7
Ma, Z., Huang, H., Xu, Y., He, X., Wang, J., Hui, B., et al. (2017). Current advances of long non-coding RNA highly upregulated in liver cancer in human tumors. Onco Targets Ther. 10, 4711–4717. doi:10.2147/OTT.S136915
Ni, W., Yao, S., Zhou, Y., Liu, Y., Huang, P., Zhou, A., et al. (2019). Long noncoding RNA GAS5 inhibits progression of colorectal cancer by interacting with and triggering YAP phosphorylation and degradation and is negatively regulated by the m6A reader YTHDF3. Mol. cancer 18, 143. doi:10.1186/s12943-019-1079-y
Plattner, C., Finotello, F., and Rieder, D. (2020). Deconvoluting tumor-infiltrating immune cells from RNA-seq data using quanTIseq. Methods Enzymol. 636, 261–285. doi:10.1016/bs.mie.2019.05.056
Qi-Dong, X., Yang, X., Lu, J., Liu, C., Sun, J., Li, C., et al. (2020). Development and validation of a nine-redox-related long noncoding RNA signature in renal clear cell carcinoma. Oxidative Med. Cell. Longev. 2020, 6634247. doi:10.1155/2020/6634247
Racle, J., de Jonge, K., Baumgaertner, P., Speiser, D. E., and Gfeller, D. (2017). Simultaneous enumeration of cancer and immune cell types from bulk tumor gene expression data. Elife 6, e26476. doi:10.7554/eLife.26476
Subramanian, A., Tamayo, P., Mootha, V. K., Mukherjee, S., Ebert, B. L., Gillette, M. A., et al. (2005). Gene set enrichment analysis: A knowledge-based approach for interpreting genome-wide expression profiles. Proc. Natl. Acad. Sci. U. S. A. 102, 15545–15550. doi:10.1073/pnas.0506580102
Tamminga, M., Hiltermann, T. J. N., Schuuring, E., Timens, W., Fehrmann, R. S., and Groen, H. J. (2020). Immune microenvironment composition in non-small cell lung cancer and its association with survival. Clin. Transl. Immunol. 9, e1142. doi:10.1002/cti2.1142
Tian, S., Lai, J., Yu, T., Li, Q., and Chen, Q. (2020). Regulation of gene expression associated with the N6-methyladenosine (m6A) enzyme System and its significance in cancer. Front. Oncol. 10, 623634. doi:10.3389/fonc.2020.623634
Tong, H., Li, T., Gao, S., Yin, H., Cao, H., and He, W. (2021). An epithelial-mesenchymal transition-related long noncoding RNA signature correlates with the prognosis and progression in patients with bladder cancer. Biosci. Rep. 41, BSR20203944. doi:10.1042/bsr20203944
Wang, B., Lu, Z., Huang, Y., and Lin, T. (2020). Prognostic impact of lncRNA-ATB expression in malignant solid tumors: A meta-analysis. Pathology Res. Pract. 216, 152897. doi:10.1016/j.prp.2020.152897
Wang, H., Meng, Q., and Ma, B. (2021). Characterization of the prognostic m6A-related lncRNA signature in gastric cancer. Front. Oncol. 11, 630260. doi:10.3389/fonc.2021.630260
Wang, Y., Lin, K., Xu, T., Wang, L., Fu, L., Zhang, G., et al. (2021). Development and validation of prognostic model based on the analysis of autophagy-related genes in colon cancer. Aging. 13(14), 19028-19047.
Wang, Y., Fu, L., Lu, T., Zhang, G., Zhang, J., Zhao, Y., et al. (2021). Clinicopathological and Prognostic Significance of Long Non-coding RNA MIAT in Human Cancers: A Review and Meta-Analysis. Frontiers in genetics. 12, 729768.
Wei, J., Ge, X., Tang, Y., Qian, Y., Lu, W., Jiang, K., et al. (2020). An autophagy-related long noncoding RNA signature contributes to poor prognosis in colorectal cancer. J. Oncol. 2020, 4728947. doi:10.1155/2020/4728947
Wilkerson, M., and Hayes, D.ConsensusClusterPlus (2010). ConsensusClusterPlus: A class discovery tool with confidence assessments and item tracking. Bioinforma. Oxf. Engl. 26, 1572–1573. doi:10.1093/bioinformatics/btq170
Wilusz, J. E., Sunwoo, H., and Spector, D. L. (2009). Long noncoding RNAs: Functional surprises from the RNA world. Genes Dev. 23, 1494–1504. doi:10.1101/gad.1800909
Wu, F., Wei, H., Liu, G., and Zhang, Y. (2021). Bioinformatics profiling of five immune-related lncRNAs for a prognostic model of hepatocellular carcinoma. Front. Oncol. 11, 667904. doi:10.3389/fonc.2021.667904
Wu, H., Liu, T., Qi, J., Qin, C., and Zhu, Q. (2020). Four autophagy-related lncRNAs predict the prognosis of HCC through coexpression and ceRNA mechanism. BioMed Res. Int. 2020, 3801748. doi:10.1155/2020/3801748
Wu, Y., Yang, X., Chen, Z., Tian, L., Jiang, G., Chen, F., et al. (2019). m6A-induced lncRNA RP11 triggers the dissemination of colorectal cancer cells via upregulation of Zeb1. Mol. cancer 18, 87. doi:10.1186/s12943-019-1014-2
Xiaoyong, H., Rangyin, Z., Guangming, Z., Yajun, J., Yongfeng, W., Da, W., et al. (2022). Association of Retinol and Carotenoids Content in Diet and Serum With Risk for Colorectal Cancer: A Meta-Analysis. Frontiers in nutrition 9, 918777. doi:10.3389/fnut.2022.918777
Xavier, R. J., and Podolsky, D. K. (2007). Unravelling the pathogenesis of inflammatory bowel disease. Nature 448, 427–434. doi:10.1038/nature06005
Xu, F., Huang, X., Li, Y., Chen, Y., and Lin, L. (2021). m6A-related lncRNAs are potential biomarkers for predicting prognoses and immune responses in patients with LUAD. Mol. Ther. Nucleic acids 24, 780–791. doi:10.1016/j.omtn.2021.04.003
Xu, R., Pang, G., Zhao, Q., Yang, L., Chen, S., Jiang, L., et al. (2021). The momentous role of N6-methyladenosine in lung cancer. J. Cell. physiology 236, 3244–3256. doi:10.1002/jcp.30136
Y, W., X, J., D, Z., Y, Z., X, H., L, Z., et al. (2022). LncRNA DUXAP8 as a prognostic biomarker for various cancers: A meta-analysis and bioinformatics analysis. Frontiers in genetics 13, 907774.
Yang, X., Zhang, S., He, C., Xue, P., Zhang, L., He, Z., et al. (2020). METTL14 suppresses proliferation and metastasis of colorectal cancer by down-regulating oncogenic long non-coding RNA XIST. Mol. cancer 19, 46. doi:10.1186/s12943-020-1146-4
Zaccara, S., Ries, R., and Jaffrey, S. (2019). Reading, writing and erasing mRNA methylation. Nat. Rev. Mol. Cell Biol. 20, 608–624. doi:10.1038/s41580-019-0168-5
Zhang, H., Li, R., Cao, Y., Gu, Y., Lin, C., Liu, X., et al. (2020). Poor clinical outcomes and immunoevasive contexture in intratumoral IL-10-producing macrophages enriched gastric cancer patients. Ann. Surg. 275, e626–e635. doi:10.1097/sla.0000000000004037
Zhang, J., Zhang, X., Piao, C., Bi, J., Zhang, Z., Li, Z., et al. (2019). A long non-coding RNA signature to improve prognostic prediction in clear cell renal cell carcinoma. Biomed. Pharmacother. = Biomedecine Pharmacother. 118, 109079. doi:10.1016/j.biopha.2019.109079
Zhang, L., Wan, Y., Zhang, Z., Jiang, Y., Gu, Z., Ma, X., et al. (2021). IGF2BP1 overexpression stabilizes PEG10 mRNA in an m6A-dependent manner and promotes endometrial cancer progression. Theranostics 11, 1100–1114. doi:10.7150/thno.49345
Zhang, P., Liu, G., and Lu, L. (2021). N6-Methylandenosine-Related lncRNA signature is a novel biomarkers of prognosis and immune response in colon adenocarcinoma patients. Front. Cell Dev. Biol. 9, 703629. doi:10.3389/fcell.2021.703629
Zhou, R., Zhang, E., Sun, Q., Ye, Z., Liu, J., Zhou, D., et al. (2019). Integrated analysis of lncRNA-miRNA-mRNA ceRNA network in squamous cell carcinoma of tongue. BMC cancer 19, 779. doi:10.1186/s12885-019-5983-8
Keywords: colon cancer, m6A-related lncRNAs, tumor immune microenvironment, prognostic signatures, immune landscape
Citation: Wang Y, Zhang D, Li Y, Wu Y, Ma H, Jiang X, Fu L, Zhang G, Wang H, Liu X and Cai H (2023) Constructing a novel signature and predicting the immune landscape of colon cancer using N6-methylandenosine-related lncRNAs. Front. Genet. 14:906346. doi: 10.3389/fgene.2023.906346
Received: 28 March 2022; Accepted: 28 April 2023;
Published: 16 June 2023.
Edited by:
Maurice HT Ling, Temasek Polytechnic, SingaporeReviewed by:
Ho Chun Loong, Southern University of Science and Technology, ChinaCopyright © 2023 Wang, Zhang, Li, Wu, Ma, Jiang, Fu, Zhang, Wang, Liu and Cai. This is an open-access article distributed under the terms of the Creative Commons Attribution License (CC BY). The use, distribution or reproduction in other forums is permitted, provided the original author(s) and the copyright owner(s) are credited and that the original publication in this journal is cited, in accordance with accepted academic practice. No use, distribution or reproduction is permitted which does not comply with these terms.
*Correspondence: Hui Cai, Y2FpYWxvbnRlYW1AMTYzLmNvbQ==; Xingguang Liu, Y2hlbmhvbmdrb3VxaWFuZ0AxMjYuY29t
†These authors share first authorship
Disclaimer: All claims expressed in this article are solely those of the authors and do not necessarily represent those of their affiliated organizations, or those of the publisher, the editors and the reviewers. Any product that may be evaluated in this article or claim that may be made by its manufacturer is not guaranteed or endorsed by the publisher.
Research integrity at Frontiers
Learn more about the work of our research integrity team to safeguard the quality of each article we publish.