 Sufang Chen
 Wenyan Li2
 Xianggang Shi
 Wenbo Liao
 Qiang Fan
- 1State Key Laboratory of Biocontrol and Guangdong Provincial Key Laboratory of Plant Resources, School of Life Sciences, Sun Yat-sen University, Guangzhou, China
- 2Shenzhen Dapeng Peninsula National Geopark, Shenzhen, China
- 3College of Forestry and Landscape Architecture, South China Agricultural University, Guangzhou, China
- 4School of Ecology, Sun Yat-sen University, Shenzhen, China
- 5Shenzhen Academy of Environmental Sciences, Shenzhen, China
Introduction: Camellia, the largest genus of Theaceae, is well-known for having high economic values. Camellia granthamiana demonstrates large beautiful flowers with some primitive characters, such as multiple large and persistent bracteoles and sepals, was listed as Vulnerable species on the IUCN Red List.
Methods: In this study, we investigated all possible records of the species, and sampled four natural populations and five cultivated individuals. By applying shallow-genome sequencing for nine individuals and RAD-seq sequencing for all the sampled 77 individuals, we investigated population genetic diversity and population structure of the species.
Results and discussion: The results showed that the population sampled from Fengkai, previously identified as C. albogigias, possessed different plastid genome from other species possibly due to plastid capture; the species possesses strong population structure possibly due to the effect of isolation by distance, habitat fragmentation, and self-crossing tendency of the species, whose effective population size declined quickly in the past 4,000 years. Nevertheless, C. granthamiana maintains a medium level of genetic diversity within population, and significant differentiation was observed among the four investigated populations, it is anticipated that more populations are expected to be found and all these extant populations should be taken into instant protection.
1 Introduction
Camellia, the largest genus of Theaceae, contains approximately 280 species distributed near the Tropic of Cancer in East Asia, and 238 species were recorded in China, which are mainly distributed in Yunnan, Guangxi, Guangdong, and Sichuan provinces (Chang, 1998). Camellia is well known for its high economic values (such as C. sinensis (Linnaeus) Kuntze, known as China tea, and C. oleifera C. Abel, as an important source of oil) and ornamental values (such as C. japonica Linnaeus, widely cultivated for beautiful flowers).
Karyotypic studies on Camellia (Chang, 1998; Li, 2001) showed that the number of chromosomes of most Camellia species was estimated to be 30, with some exceptions such as Camellia albogigas Hu and Camellia granthamiana Sealy (2n = 4x = 60) and C. vietnamensis and C. grandiflora (2n = 8x = 120). Both C. granthamiana and C. albogigas were ascribed to the sect. Archecamellia Sealy of subgen. Protocamellia Chang in Flora Reipublicae Popularis Sinicae, as they demonstrate some primitive characters, such as multiple large and persistent bracteoles and sepals (Chang, 1998). Geographically, C. albogigas was recorded only in Fengkai, Guangdong, while C. granthamiana was recorded in the western and eastern areas of Guangdong and Hong Kong, China. Currently, C. albogigas is treated as a synonym of C. granthamiana in the Flora of China (Min and Bartholomew, 2007) and C. granthamiana is listed as vulnerable on the IUCN Red List (http://www.iucnredlist.org).
For the better understanding of threats to endangered species, phylogenetics and population genetics have been widely used in conservation genetics and (or) conservation biology to investigate the causes of species decline, such as habitat fragmentation, genetic drift, and barriers to gene flow, and identify counteracting measures and conservation units. However, recent advancements in genomic tools have further enabled the utilization of vastly expanded datasets of single-nucleotide polymorphisms (SNPs), providing unprecedented insights into the importance of genetic diversity in conservation (Willi, et al., 2022). Currently, we are reviewing all specimen records in the Chinese Virtual Herbarium (https://www.cvh.ac.cn/) and the online Flora of China (http://www.iplant.cn/). We have successfully collected three populations of C. granthamiana and one population of C. albogigas in Guangdong, China. Furthermore, we utilized the shallow-genome sequencing method to de novo assemble the chloroplast genomes and construct a plastid phylogenetic tree. At the same time, we performed the restriction-site-associated DNA sequencing method on all the sampled populations. Through these efforts, we endeavored to investigate whether C. albogigas and C. granthamiana constitute one species or two, assess the population structure and genetic diversity of these species, and eventually provide some valuable information for their conservation.
2 Materials and methods
2.1 Sample collection and Illumina sequencing
Fresh leaves were sampled for the three populations of C. granthamiana and one population of C. albogigas. For each population, geographical information was recorded using a Garmin GPS unit (GPSMAP 62sc, Shanghai, Table 1; Figure 1). Specimens were deposited in the herbarium of Sun Yat-sen (SYS) University, China. The type specimen of C. granthamiana was recorded in Hong Kong, China. In Sun Yat-sen University, five individuals of C. granthamiana or C. albogigas were cultivated: one was transplanted from Hong Kong, China (C. granthamiana), and the others were transplanted from Fengkai, Guangdong, China (C. albogigas). As it is difficult to make clear which individual was transplanted from Hong Kong, China, we sampled fresh leaves from all five individuals (Table 1).
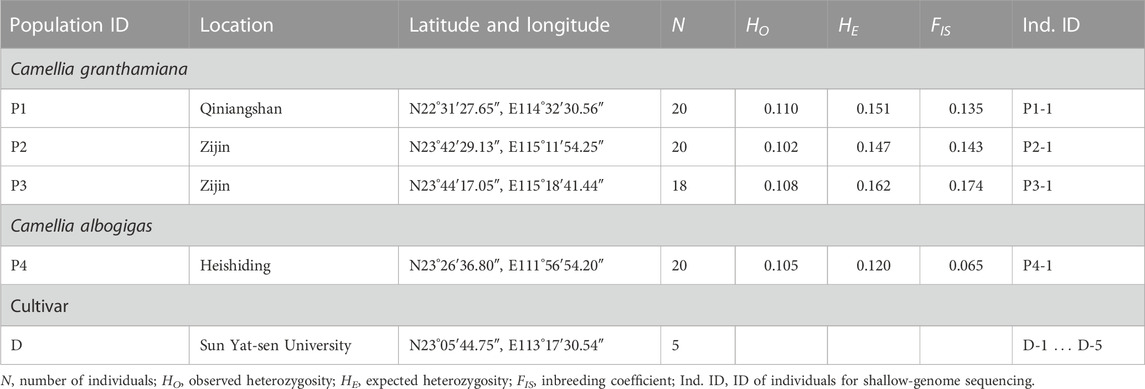
TABLE 1. Geographical information for sampled populations of C. granthamiana and C. albogigas.
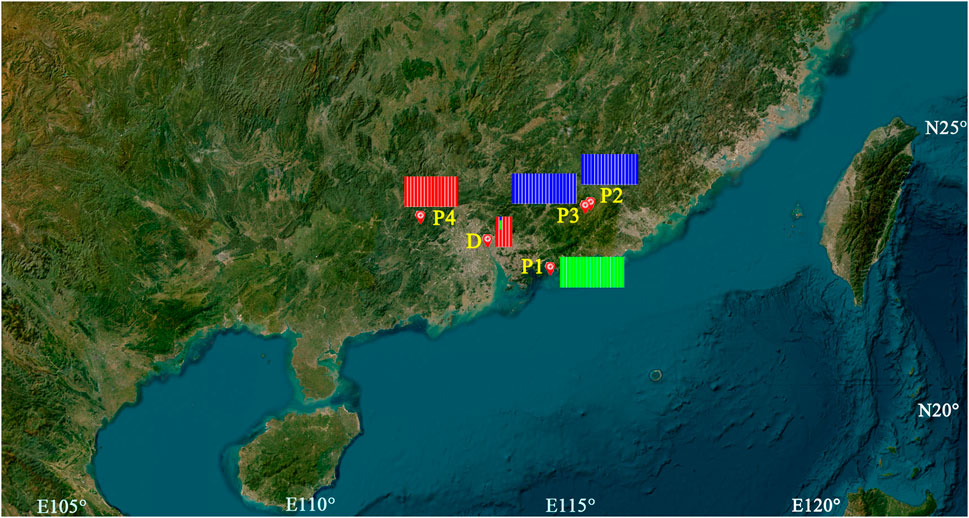
FIGURE 1. Geographical locations and ADMIXTURE analysis of the samples of C. granthamiana and C. albogigas. P1, P2, P3, P4, and D: population ID. Map data: Google, TerraMetrics.
For each population, one individual was randomly selected for shallow-genome sequencing, while RAD-seq was performed on the four populations. For the five individuals sampled from the Bamboo Garden of Sun Yat-sen University, both RAD-seq and shallow-genome sequencing were performed. The fresh leaves were dried and preserved on silica gel in sealed bags and then sent to JieRui BioScience Co., Ltd. (Guangzhou, China) for DNA extraction, library preparation, and Illumina sequencing.
Briefly, genomic DNA for each sample was extracted using the modified CTAB method (Doyle and Doyle, 1987) and purified using magnetic beads. For shallow-genome sequencing, a library was constructed for each sample using the TruePrep DNA Library Prep Kit and then sent for Illumina sequencing on the NovaSeq 6000 platform according to the standard operation procedure. For RAD-seq, the purified genomic DNA was digested with EcoR I and Mse I restriction enzymes, barcodes and Illumina adapter sequences were ligated to the digested DNA fragments, and subset fragments with different barcodes were pooled together. Then, the pooled fragments were purified and size-selected to 350–550 bp in agarose, and these selected fragments were amplified using PCR. Finally, we removed residual primers and purified PCR libraries using magnetic beads, and Illumina sequencing was conducted on the NovaSeq 6000 platform according to the standard operation procedure.
2.2 Plastid genome assembly and phylogenetic tree construction
The raw data were produced from Illumina sequencing, and nine plastid genomes were successfully assembled using NOVOPlasty 2.7.2.pl (Dierckxsens, et al., 2017), in which the plastid genome C. granthamiana (NC_038181.1) was used as a reference and its rbcL gene was used as a seed. Furthermore, plastid genomes for 111 samples of Camellia and one sample of Polyspora hainanensis were downloaded from the NCBI website (https://www.ncbi.nlm.nih.gov/). In total, 120 plastid genome sequences were aligned using MAFFT, which performs well in reducing CPU time and increasing the accuracy of alignments for sequences with large insertions or extensions (Katoh et al., 2002). Sites with missing/ambiguous data and gaps were excluded using MEGA X (Kumar et al., 2018), and a phylogenetic tree based on the maximum likelihood method was constructed using IQ-TREE v2.2.0 (Nguyen, et al., 2015) by setting “-m MFP -bb 2000.”
2.3 RAD-seq data processing and population analyses
The raw reads produced from the Illumina platform were processed using Stacks 2.55 software (Catchen, et al., 2013). Initially, the procedure process_radtags was used to demultiplex RAD tags, and five samples were randomly selected from each population to determine the optimal values for M (number of mismatches allowed between stacks within samples) and n (number of mismatches allowed between stacks between samples). Then, the Perl script denovo-map.pl was applied to process all the samples, and the procedure populations was used to filter the results by setting “--min-maf 0.05 --max-obs-het 0.8 -R 0.6 –write-random-snp,” in which one random SNP was extracted for each locus.
Principal coordinate analysis (PCA) was performed using PLINK v1.90 (Chang, et al., 2015), and a Python script was used to draw the scatter diagram. Then, Bayesian cluster analysis was conducted using ADMIXTURE v1.3.0 software (Alexander, et al., 2009). The number of groups (K) was set in the range of 2–6, and the optimal K was determined with the lowest cross-validation (CV) error. The produced VCF file was transformed to a PHY file using the Python script vcf2phylip.py (Ortiz, 2019), and a phylogenetic tree was constructed using the IQ-TREE program by setting “-m MFP -bb 2000.”
Applying the software Arlequin (Excoffier and Lischer, 2010), an analysis of molecular variance (AMOVA) was performed. In this analysis, four populations were assigned to three groups according to PCA and ADMIXTURE analysis, pairwise FST was calculated based on the Kimura 2P method, and NM was estimated based on the formula NM = 1/(4*FST + 1). The Mantel test was performed using GenAlEx 6.5 (Peakall and Smouse, 2012) to calculate the correlation between genetic distance FST/(1-FST) and geographic distance (ln) by setting 999 permutations (Diniz, et al., 2013).
2.4 Historical demographic changes
Unfolded site frequency spectra (SFS) were generated using easySFS (https://github.com/isaacovercast/easySFS). The values were projected downward to maximize the number of segregating sites for both species. Stairway Plot v. 2.1.1 was used to infer recent historical dynamics of the effective population size of C. granthamiana and C. albogigas based on unfolded SFS (Liu and Fu, 2015). Using whole-genome sequencing, the nucleotide substitution rate of walnut was estimated to be 2.29 × 10⁻⁹ per site per year (Luo, et al., 2015), which is quite close to other woody perennials such as palms (2.61 × 10⁻⁹, Gaut et al., 1996), poplar (2.5 × 10⁻⁹, Buschiazzo, et al., 2012), 6.5 times slower than Arabidopsis lineage (1.5 × 10⁻⁸, Koch, et al., 2000), and 4.7 times slower than Medicago lineage (1.08 × 10⁻⁸, Young et al., 2011). These data suggested that the molecular clock in plants is related to the life-cycle length (Luo, et al., 2015). In this analysis, the mutation rate was set to 2.29 × 10⁻⁹ per site per year according to walnut, which starts to bear fruit in 4 years (Chen, 2020), and the generation time for C. granthamiana was set to 5 years based on field observations.
3 Results
3.1 Plastid phylogenetic tree
For shallow-genome sequencing, approximately 6 G raw data were produced for each sample, and nine plastid genomes were successfully assembled and circularized in this study (Table 1). The length of these plastid genomes was smallest for the three samples P2-1, P3-1, and D-2 (156,971–156,980 bp), at a medium level for the other five samples D-1, D-3, D-4, D-5, and P4-1 (157,001–157,010 bp), and was largest for the sample P1-1 (158,031 bp). Manual inspection of these nine plastid genome sequences showed no ambiguity at base “N,” and two heterozygous positions with base “M” were corrected to base “C” according to other plastid sequences.
Together with the 111 plastid genomes downloaded from NCBI, the phylogenetic tree containing 72 Camellia species (Figure 2) could be further divided into eight clades (A–H), although relationships among these clades were not fully resolved with high support values. The representative sample of the population P4 (P4-1) and the four samples collected from Sun Yat-sen University (D-1, D-3, D-4, and D-5) clustered together with the two plastid genomes downloaded from NCBI with high support values (PP: 100), forming subclade H3. The three representative samples of the population P1–P3 (P1-1, P2-1, and P3-1) and one sample collected from Sun Yat-sen University (D-2) clustered together with the other five Camellia species, forming subclade H2; subclade H2 formed a sister relationship with H3 and then clustered together with subclade H1.
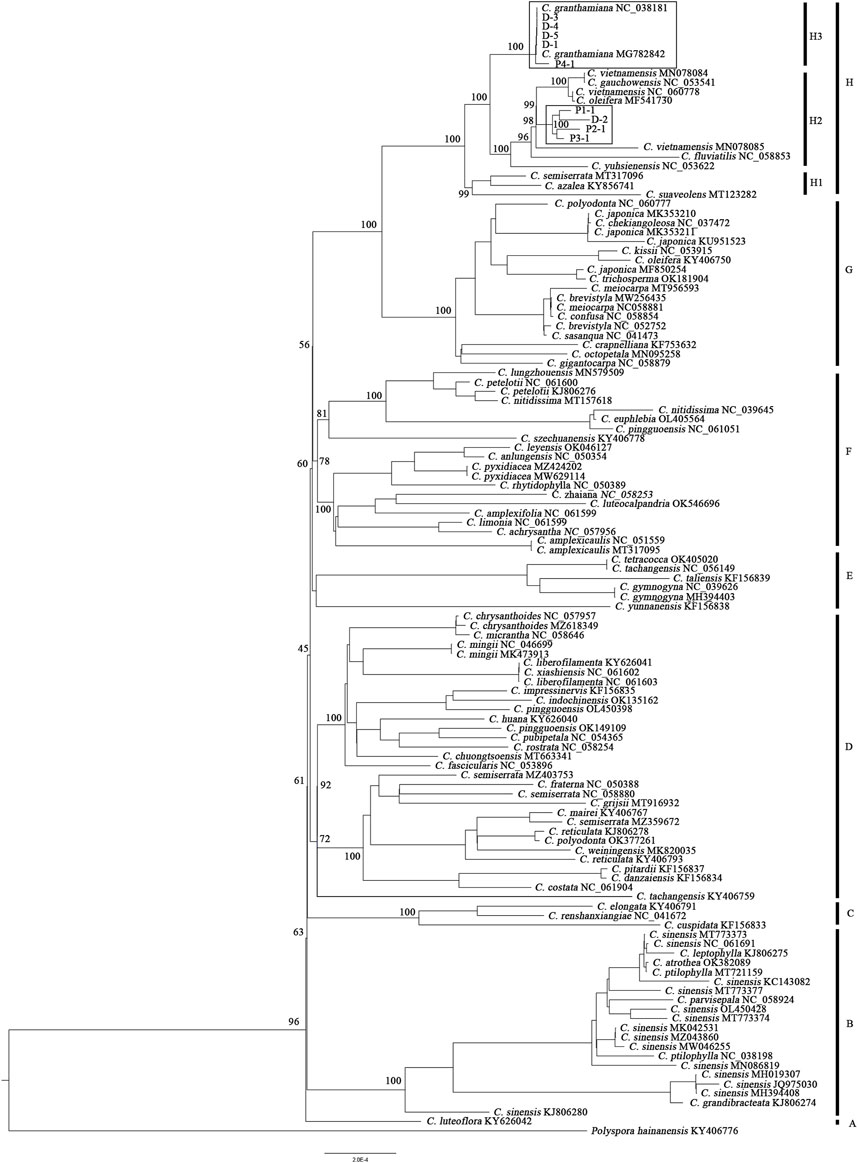
FIGURE 2. Phylogenetic tree of 72 Camellia species constructed from 120 plastid genomes based on the maximum likelihood method. At the nodes of the tree, maximum likelihood ultrafast bootstrap support values are shown for the main clades.
3.2 RAD-seq data processing
A total of 12 G raw data were produced for the 77 samples of Camellia, and the number of tags retained for each sample ranged from 178,956 to 3,101,602 (average number of tags: 2,240,608). After filtering with the program “populations,” a total of 9,036 loci containing 7,152 variant sites were retained for further analysis. The observed heterozygosity (HO) ranged from 0.102 to 0.110, the expected heterozygosity (HE) ranged from 0.120 to 0.162, and the inbreeding coefficient (FIS) ranged from 0.065 to 0.174 (Table 1).
3.3 Population structure
In PCA (Figure 3), the first, second, and third axes account for 16.42%, 9.86%, and 7.47% of total variances, respectively. The first and second axes divided the four natural populations into three clusters: P1 and P4 were ascribed to an independent cluster, respectively, while P2 and P3 were ascribed to the same cluster. Among the five individuals cultivated at Sun Yat-sen University, four shared the same cluster with P1, while the remaining one (D-2) remained separate from all other populations.
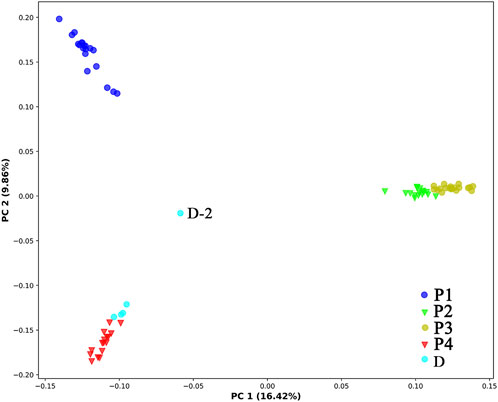
FIGURE 3. Principal coordinate analysis of the 78 individuals of C. granthamiana and C. albogigas. P1, P2, P3, P4, and D: population ID.
ADMIXTURE analysis (Figure 1) showed that the least value of CV was obtained when K = 3, P1 and P4 were assigned to one group each, and P2 and P3 shared the same group. Among the five individuals cultivated at Sun Yat-sen University, D-1, D-3, D-4, and D-5 were assigned to the same group as population P4 and the last individual was assigned to the admixture of the three groups. AMOVA showed that the genetic variation of C. granthamiana is primarily maintained within populations (44.02%, FST = 0.215, p < 0.001, Table 2).
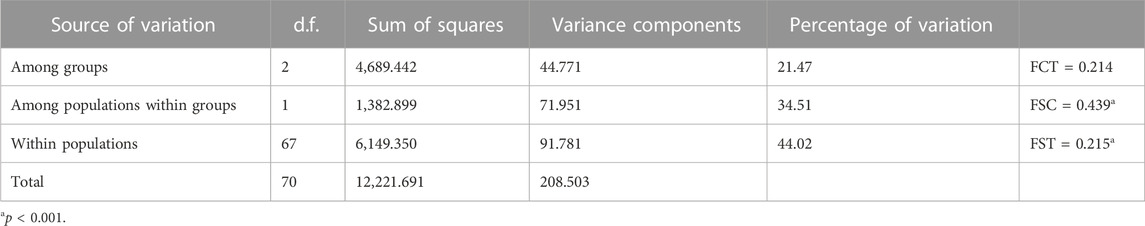
TABLE 2. Analysis of molecular variance for the four populations of C. granthamiana.
A phylogenetic tree constructed from RAD-seq data (Figure 4) showed that individuals collected from the same population formed an independent monogroup, and four clades (C1–C4) could be found: the clade C1 (including all individuals of the population P1) was clustered together with C4 (including all individuals of the population P4), while C2 (including all the individuals of the population P2) was clustered together with C3 (including all the individuals of the population P3). Among the five cultivated samples at Sun Yat-sen University, D-1, D-3, D-4, and D-5 formed a monogroup and then clustered together with all the individuals sampled from P4, forming the clade C4 with a high support value (100%), while the last individual, D-2, was placed at the root of the clade C4 with a weak support value.
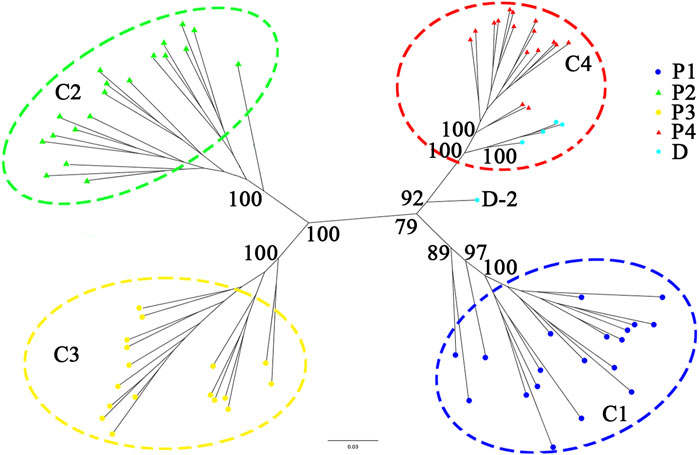
FIGURE 4. Phylogenetic tree constructed from nuclear RAD-seq data of the C. granthamiana and C. albogigas. At the nodes of the tree, maximum likelihood ultrafast bootstrap support values are shown for the four main clades.
Pairwise FST estimation (Table 3) showed that the significant FST values were detected between each pair of populations, and the highest FST value was detected between the populations P2 and P4 (FST = 0.628), while the lowest FST was detected between P2 and P3 (FST = 0.365). The Mantel test showed that the genetic distance estimated using FST/(1-FST) between geographical distance (ln) was highly correlated (Figure 5, r = 0.912), although the p-value was not significant (p = 0.088).
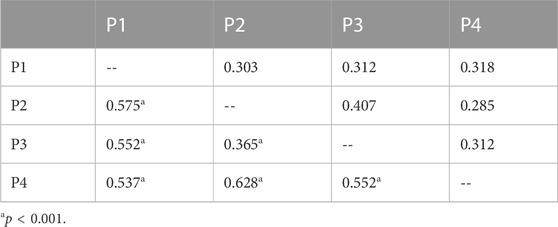
TABLE 3. Pairwise FST (below the diagonal lines) and NM (above the diagonal lines) among the four populations of C. granthamiana.
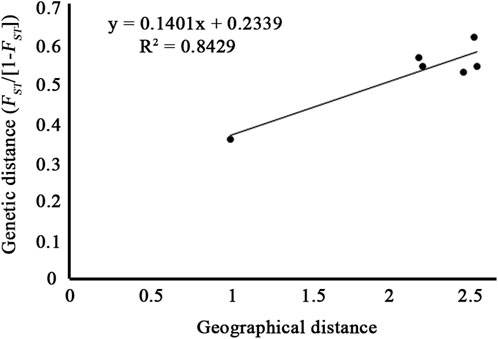
FIGURE 5. Mantel test between pairwise genetic distance (FST/1-FST) and geographical distance (ln) of the four populations of C. granthamiana and C. albogigas.
3.4 Demographic history reconstruction
Based on the site frequency spectrum of the 7,152 variant sites, the effective population size (NE) of C. granthamiana was estimated to have expanded quickly since ca. 60,000 years ago (YA), reached a maximum level 40,000 YA, then remained stable till 4,000 YA, and kept declining to date (Figure 6).
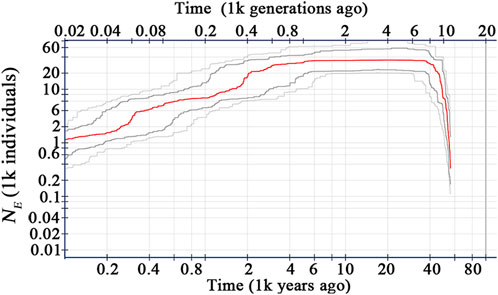
FIGURE 6. Estimates of the effective population size (NE) of C. granthamiana.
4 Discussion
4.1 Treating C. albogigas as a synonym of C. granthamiana
The type specimen of C. granthamiana was recorded in Hong Kong, China, and we have not successfully collected fresh leaf tissue from Hong Kong yet. It is fortunate that in the Bamboo Garden of Sun Yat-sen University, both C. albogigas and C. granthamiana were cultivated and introduced from their respective localities. The plastid and nuclear tree supported that four of five cultivated individuals (D-1, D-3, D-4, and D-5) clustered together with C. albogigas (population P4) with high support values (Figures 2, 4), supporting that these four individuals should be transplanted from the type locality of C. albogigas. In the plastid tree, the last cultivated individual (D-2) clustered with P1-1, whose geographic location (Qiniangshan, Shenzhen, China) is just near Hong Kong, China, revealing that this individual should be introduced from the type locality of C. granthamiana (Hong Kong, China). It is interesting that D-2 is located at the root of clade P4 with a weak support value in the nuclear tree (Figure 4), while it is shown to be the admixture of the three groups in the ADMIXTURE analysis (Figure 1) and at the center of the other three clusters in the PCA (Figure 3). These data indicated an ancient position of D-2, which was introduced from Hong Kong, China.
In the Flora of China (Min and Bartholomew, 2007), C. albogigas was treated as a synonym of C. granthamiana despite some minor morphological differentiations between them (Chang, 1998). In this study, the only population of C. albogigas (P4) clustered together with the population P1 of C. granthamiana (Figures 1, 3), supporting this research. Although the plastid tree (Figure 2) showed that P4-1 was in subclade H2, P1-1, P2-1, and P3-3 were placed in subclade H3. The plastid genome of P4-1 could possibly result from plastid capture, which is frequently observed in many plant species (Liu, et al., 2020; Yang, et al., 2021). The occurrence of plastid capture, usually caused by repeated hybridization events, could also lead to the minor differences in morphological characters between C. albogigas and C. granthamiana.
4.2 Population differentiation within C. granthamiana
PCA and ADMIXTURE analysis (Figures 1, 3) showed that the four populations could be divided into three clusters (groups); AMOVA revealed that 21.47% genetic variation was maintained among groups (Table 2), and significant FST values were detected between each population pair (Table 3). These data supported a strong population structure within the species, possibly due to isolation by distance, as a high correlation was found between genetic and geographical distances (r = 0.912), and the lack of statistical significance (p = 0.088) could be caused by the limited number of populations (Figure 5). The demographic history construction (Figure 6) showed that the effective population size expanded since 60,000 YA, remained stable, and declined since 4,000 YA, suggesting that the species could be thriving during the Last Glacial Maximum and maintained its populations till 4,000 YA. At this time, human activities became more prevalent, which could have significantly affected the survival of the species and led to habitat fragmentation of many forest species (Aguilar, et al., 2006; Salmona, et al., 2017; Valenzuela-Aguayo, et al., 2020). The inbreeding coefficient FIS of the species is estimated to be 0.065–0.174 (Table 1), suggesting a self-crossing tendency of the species that may have also resulted from habitat fragmentation. This self-crossing tendency could further facilitate the effect of genetic drift on small populations and lead to a strong population structure. In short, the species could have been widely distributed around Guangdong Province but experienced substantial retreat due to human disturbance over the past 4,000 years. It was only sporadically recorded in few locations up to date and then diverged significantly due to isolation by distance (Schaal and Leverich, 1996; Young, et al., 1996; Honnay, et al., 2005).
4.3 Genetic diversity and conservation of the species
It is inspiring that the four populations of C. granthamiana maintained a medium level of genetic diversity (HE: 0.120–0.162, Table 1), which is much higher than other endemic species, such as Firmiana danxiaensis (average HE: 0.115, RAD-seq, Chen, et al., 2023), Primulina danxiaensis (average HE: 0.064, RAD-seq, Chen, et al., 2021), and Thuja sutchuenensis (average HE: 0.082, RAD-seq, Yao et al., 2021), and lower than Hemiculter leucisculus in the Xinjiang Tarim River (average HE: 0.198, RAD-seq, Sun et al., 2022). Although only four populations were recorded, the largest geographical distance between them is close to 350 km; it is anticipated that more individuals (populations) will be found in the future. The significant differentiation between these populations and the strong population structure (Table 2; Figure 3) suggested that all the populations possess their own unique genetic variations and that more attention should be paid for their conservation.
Data availability statement
RAD raw data was deposited to the NCBI SRA database with BioProject PRJNA990452. Plastid genomes for nine C. granthamiana samples were deposited in GenBank with accession number OR224267-OR224275.
Author contributions
QF and WBL designed the project; QF, WYL, XS, ZL collected the samples; SC ran the experiment, SC, WYL, WL and YZ analyzed the results; SC, WBL, QF wrote the manuscript. All authors contributed to the article and approved the submitted version.
Funding
This work was supported by the project of the Research on Co-evolution of Vegetation and Geological Environment of Shenzhen Dapeng Peninsula Geopark (2020F36).
Acknowledgments
The authors would like to thank Wanyi Zhao, Zhiming Zhong, Weinan Ye, and Buchu Li for their help in sample collection.
Conflict of interest
The authors declare that the research was conducted in the absence of any commercial or financial relationships that could be construed as a potential conflict of interest.
Publisher’s note
All claims expressed in this article are solely those of the authors and do not necessarily represent those of their affiliated organizations, or those of the publisher, the editors, and the reviewers. Any product that may be evaluated in this article, or claim that may be made by its manufacturer, is not guaranteed or endorsed by the publisher.
References
Aguilar, R., Ashworth, L., Galetto, L., and Aizen, M. A. (2006). Plant reproductive susceptibility to habitat fragmentation: review and synthesis through a meta-analysis. Ecol. Lett. 9, 968–980. doi:10.1111/j.1461-0248.2006.00927.x
Alexander, D. H., Novembre, J., and Lange, K. (2009). Fast model-based estimation of ancestry in unrelated individuals. Genome Res. 19, 1655–1664. doi:10.1101/gr.094052.109
Buschiazzo, E., Ritland, C., Bohlmann, J., and Ritland, K. (2012). Slow but not low: genomic comparisons reveal slower evolutionary rate and higher dN/dS in conifers compared to angiosperms. BMC Evol. Biol. 12, 8. doi:10.1186/1471-2148-12-8
Catchen, J., Hohenlohe, P. A., Bassham, S., Amores, A., and Cresko, W. A. (2013). Stacks: an analysis tool set for population genomics. Mol. Ecol. 22, 3124–3140. doi:10.1111/mec.12354
Chang, C. C., Chow, C. C., Tellier, L. C. A. M., Vattikuti, S., Purcell, S. M., and Lee, J. J. (2015). Second-generation PLINK: rising to the challenge of larger and richer datasets. Gigascience 4 (1), doi:10.1186/S13742-015-0047-8
Chen, S. F., Guo, W., Chen, Z. X., Liao, W. B., and Fan, Q. (2021). Strong genetic structure observed in Primulina danxiaensis, a small herb endemic to Mount Danxia with extremely small populations. Front. Genet. 12, 722149. doi:10.3389/fgene.2021.722149
Chen, S. F., Zhao, W. Y., Huang, Y. S., Meng, K. K., Huang, K. Y., Hou, R. F., et al. (2023). The origin and dispersal of Firmiana danxiaensis among isolated specific landscapes. J. Syst. Evol. doi:10.1111/jse.12954
Chen, T. F. (2020). Grow seedling and afforestation techniques of Carya illinoinensis (In Chinese). Mod. Agric. Sci. Technol. 1, 129–131.
Dierckxsens, N., Mardulyn, P., and Smits, G. (2017). NOVOPlasty: de novo assembly of organelle genomes from whole genome data. Nucleic Acids Res. 45 (4), e18. doi:10.1093/nar/gkw955
Diniz, J. A. F., Soares, T. N., Lima, J. S., Dobrovolski, R., Landeiro, V. L., Telles, M. P. D., et al. (2013). Mantel test in population genetics. Genet. Mol. Biol. 36, 475–485. doi:10.1590/S1415-47572013000400002
Doyle, J. J., and Doyle, J. L. (1987). A rapid DNA isolation procedure from small quantities of fresh leaf tissues. Phytochem. Bull. 19, 11–15. doi:10.2307/4119796
Excoffier, L., and Lischer, H. E. L. (2010). Arlequin suite ver 3.5: A new series of programs to perform population genetics analyses under linux and windows. Mol. Ecol. Resour. 10, 564–567. doi:10.1111/j.1755-0998.2010.02847.x
Gaut, B. S., Morton, B. R., McCaig, B. C., and Clegg, M. T. (1996). Substitution rate comparisons between grasses and palms: synonymous rate differences at the nuclear gene adh parallel rate differences at the plastid gene rbcL. Proc. Natl. Acad. Sci. U. S. A. 93 (19), 10274–10279. doi:10.1073/pnas.93.19.10274
Honnay, O., Jacquemyn, H., Bossuyt, B., and Hermy, M. (2005). Forest fragmentation effects on patch occupancy and population viability of herbaceous plant species. New Phytol. 166, 723–736. doi:10.1111/j.1469-8137.2005.01352.x
Katoh, K., Misawa, K., Kuma, K., and Miyata, T. (2002). Mafft: A novel method for rapid multiple sequence alignment based on fast fourier transform. Nucleic Acids Res. 30 (14), 3059–3066. doi:10.1093/nar/gkf436
Koch, M. A., Haubold, B., and Mitchell-Olds, T. (2000). Comparative evolutionary analysis of chalcone synthase and alcohol dehydrogenase loci in Arabidopsis, Arabis, and related genera (Brassicaceae). Mol. Biol. Evol. 17, 1483–1498. doi:10.1093/oxfordjournals.molbev.a026248
Kumar, S., Stecher, G., Li, M., Knyaz, C., and Tamura, K. (2018). Mega X: molecular evolutionary genetics analysis across computing platforms. Mol. Biol. Evol. 35 (6), 1547–1549. doi:10.1093/molbev/msy096
Li, G. T. (2001). New advance in karyotype studies of genus Camellia. Chin. Wild Plant Resour. 20 (5), 9–14.
Liu, L. X., Du, Y. X., Folk, R. A., Wang, S. Y., Soltis, D. E., Shang, F. D., et al. (2020). Plastome evolution in Saxifragaceae and multiple plastid capture events involving Heuchera and Tiarella. Front. Plant Sci. 11, 361. doi:10.3389/fpls.2020.00361
Liu, X. M., and Fu, Y. X. (2015). Exploring population size changes using SNP frequency spectra. Nat. Genet. 47, 555–559. doi:10.1038/ng.3254
Luo, M. C., You, F. M., Li, P. C., Wang, J. R., Zhu, T. T., Dandekar, A. M., et al. (2015). Synteny analysis in Rosids with a walnut physical map reveals slow genome evolution in long-lived woody perennials. BMC Genomics 16 (1), 707. doi:10.1186/s12864-015-1906-5
Min, T. L., and Bartholomew, B. (2007). “Theaceae,” in Flora of China. Editors C. Y. Wu, P. H. Raven, and D. Y. Hong (Beijing: Science Press), 12, 366–478.
Nguyen, L. T., Schmidt, H. A., von Haeseler, A., and Minh, B. Q. (2015). IQ-TREE: A fast and effective stochastic algorithm for estimating maximum-likelihood phylogenies. Mol. Biol. Evol. 32, 268–274. doi:10.1093/molbev/msu300
Ortiz, E. M. (2019). vcf2phylip v2.0: convert a VCF matrix into several matrix formats for phylogenetic analysis. Zenodo. doi:10.5281/zenodo.2540861
Peakall, R., and Smouse, P. E. (2012). GenAlEx 6.5: genetic analysis in excel. Population genetic software for teaching and research-an update. Bioinformatics 28, 2537–2539. doi:10.1093/bioinformatics/bts460
Salmona, J., Heller, R., Quemere, E., and Chikhi, L. (2017). Climate change and human colonization triggered habitat loss and fragmentation in Madagascar. Mol. Ecol. 26, 5203–5222. doi:10.1111/mec.14173
Schaal, B. A., and Leverich, W. J. (1996). Molecular variation in isolated plant populations. Plant Species Biol. 11, 33–40. doi:10.1111/j.1442-1984.1996.tb00106.x
Sun, S. Y., Hu, Z. Y., Lu, Z. Y., Liu, L., Liu, X., Zhou, Q., et al. (2022). Genetic diversity and population structure of Hemiculter leucisculus (basilesky, 1855) in Xinjiang Tarim River. Genes 13 (10), 1790. doi:10.3390/genes13101790
Valenzuela-Aguayo, F., McCracken, G. R., Manosalva, A., Habit, E., and Ruzzante, D. E. (2020). Human-induced habitat fragmentation effects on connectivity, diversity, and population persistence of an endemic fish, Percilia irwini, in the Biobio River basin (Chile). Evol. Appl. 13, 794–807. doi:10.1111/eva.12901
Willi, Y., Kristensen, T. N., Sgro, C. M., Weeks, A. R., Orsted, M., and Hoffmann, A. A. (2022). Conservation genetics as a management tool: the five best-supported paradigms to assist the management of threatened species. Proc. Natl. Acad. Sci. U. S. A. 119 (1), e2105076119. doi:10.1073/pnas.2105076119
Yang, Y. Y., Qu, X. J., Zhang, R., Stull, G. W., and Yi, T. S. (2021). Plastid phylogenomic analyses of Fagales reveal signatures of conflict and ancient chloroplast capture. Mol. Phylogenetics Evol. 163, 107232. doi:10.1016/j.ympev.2021.107232
Yao, Z., Wang, X., Wang, K., Yu, W., Deng, P., Dong, J., et al. (2021). Chloroplast and nuclear genetic diversity explain the limited distribution of endangered and endemic Thuja sutchuenensis in China. Front. Genet. 12, 801229. doi:10.3389/fgene.2021.801229
Young, A., Boyle, T., and Brown, T. (1996). The population genetic consequences of habitat fragmentation for plants. Trends Ecol. Evol. 11, 413–418. doi:10.1016/0169-5347(96)10045-8
Keywords: Camellia granthamiana, restriction-site-associated DNA sequencing, population genomics, extremely small populations, shallow-genome sequencing, Guangdong, Theaceae
Citation: Chen S, Li W, Li W, Liu Z, Shi X, Zou Y, Liao W and Fan Q (2023) Population genetics of Camellia granthamiana, an endangered plant species with extremely small populations in China. Front. Genet. 14:1252148. doi: 10.3389/fgene.2023.1252148
Received: 03 July 2023; Accepted: 18 September 2023;
Published: 05 October 2023.
Edited by:
Siti Nordahliawate Mohamed Sidique, Universiti Malaysia Terengganu, MalaysiaReviewed by:
Jian-Feng Mao, Beijing Forestry University, ChinaMichele Wyler, MWSchmid GmbH, Switzerland
Copyright © 2023 Chen, Li, Li, Liu, Shi, Zou, Liao and Fan. This is an open-access article distributed under the terms of the Creative Commons Attribution License (CC BY). The use, distribution or reproduction in other forums is permitted, provided the original author(s) and the copyright owner(s) are credited and that the original publication in this journal is cited, in accordance with accepted academic practice. No use, distribution or reproduction is permitted which does not comply with these terms.
*Correspondence: Qiang Fan, ZmFucWlhbmdAbWFpbC5zeXN1LmVkdS5jbg==