
95% of researchers rate our articles as excellent or good
Learn more about the work of our research integrity team to safeguard the quality of each article we publish.
Find out more
ORIGINAL RESEARCH article
Front. Genet. , 17 August 2023
Sec. Livestock Genomics
Volume 14 - 2023 | https://doi.org/10.3389/fgene.2023.1234757
 Chen Chen1
 Huibo Ren1Huali Li1Yuan Deng1Qingming Cui1Ji Zhu1Siyang Zhang2Jine Yu2Huiming Wang2Xiaodan Yu2Shiliu Yang2Xionggui Hu1Yinglin Peng1,3*
Fat deposition is an economically important trait in pigs. Ningxiang pig, one of the four famous indigenous breeds in China, is characterized by high fat content. The underlying gene expression pattern in different developmental periods of backfat tissue remains unclear, and the purpose of this investigation is to explore the potential molecular regulators of backfat tissue development in Ningxiang pigs. Backfat tissue (three samples for each stage) was initially collected from different developmental stages (60, 120, 180, 240, 300, and 360 days after birth), and histological analysis and RNA sequencing (RNA-seq) were then conducted. Fragments per kilobase of transcript per million (FPKM) method was used to qualify gene expressions, and differentially expressed genes (DEGs) were identified. Furthermore, strongly co-expressed genes in modules, which were named by color, were clustered by Weighted gene co-expression network analysis (WGCNA) based on dynamic tree cutting algorithm. Gene ontology (GO) and kyoto encyclopedia of genes and genomes (KEGG) enrichment were subsequently implemented, and hub genes were described in each module. Finally, QPCR analysis was employed to validate RNA-seq data. The results showed that adipocyte area increased and adipocyte number decreased with development of backfat tissue. A total of 1,024 DEGs were identified in five comparison groups (120 days vs. 60 days, 180 days vs. 120 days, 240 days vs. 180 days, 300 days vs. 240 days, and 360 days vs. 300 days). The turquoise, red, pink, paleturquoise, darkorange, and darkgreen module had the highest correlation coefficient with 60, 120, 180, 240, 300, and 360 days developmental stage, while the tan, black and turquoise module had strong relationship with backfat thickness, adipocyte area, and adipocyte number, respectively. Thirteen hub genes (ACSL1, ACOX1, FN1, DCN, CHST13, COL1A1, COL1A2, COL6A3, COL5A1, COL14A1, OAZ3, DNM1, and SELP) were recognized. ACSL1 and ACOX1 might perform function in the early developmental stage of backfat tissue (60 days), and FN1, DCN, COL1A1, COL1A2, COL5A1, COL6A3, and COL14A1 have unignorable position in backfat tissue around 120 days developmental stage. Besides, hub genes SELP and DNM1 in modules significantly associated with backfat thickness and adipocyte area might be involved in the process of backfat tissue development. These findings contribute to understand the integrated mechanism underlying backfat tissue development and promote the progress of genetic improvement in Ningxiang pigs.
Pigs are not only a major source of meat worldwide, but also have been used in biomedical studies because of the similarity to human in physiology (Miao et al., 2018). Ningxiang pig, one of the four famous indigenous pig breeds in China, is native to Hunan province and is characterized by high fat content, delicious meat, strong adaptability to the local environment, and stronger disease resistance (Li et al., 2021). Adipose tissue secretes a variety of proteins that impact a number of physiological and metabolic processes (Hausman et al., 2007). Adipose tissue in pigs is an important trait, which influences meat quality and fattening efficiency (Stachowiak et al., 2016), and backfat deposition greatly influences porcine growth performance, carcass, meat production and final farming profit (Davoli et al., 2018).
Weighted gene co-expression network analysis (WGCNA) is a bioinformatics algorithm method that has been widely utilized to explore highly correlated gene clusters related to biological traits (Wang et al., 2022; Wu et al., 2022; Xu et al., 2022). Instead of focusing on a single gene, WGCNA intends to extract hub genes from co-expression networks to preferably investigate the biological regulations. Recently, WGCNA method was popularly applied, and mounting genes were found to participate in various lipid related processes, including obesity, adipogenic differentiation of stem cell, polyunsaturated fatty acid (Han et al., 2020; Liu et al., 2021; Xiao et al., 2022; Zhang et al., 2022). Although the study on gene profiles in subcutaneous adipose tissue at four developmental stages in Ningxiang pigs has been reported (Gong et al., 2021), the underlying molecular mechanism of subcutaneous adipose tissue development in different periods is still unclear.
In view of the important role of adipose tissue, the present study collected backfat tissue across six postnatal developmental stages (60, 120, 180, 240, 300, and 360 days after birth, hereafter referred to as 60, 120, 180, 240, 300, and 360 days, respectively) in Ningxiang pigs. These time points cover major morphological and physiological changes in pig growth and development due to the fact that backfat tissue development in pigs is varying according to their age (Mersmann et al., 1973; Hood and Allen, 1977).
Here, backfat tissue was subjected to histological analysis and RNA-sequencing (RNA-seq). The genes profiles in backfat tissue from six developmental stages were investigated, and differentially expressed genes (DEGs) in five comparison groups were identified. Furthermore, WGCNA was performed to analyze the gene expression profile, and the key modules and hub genes with strong correlation with developmental stages and traits were explored, respectively. In addition, RNA-seq result was validated by quantitative real-time polymerase chain reaction (QPCR) experiment. These findings unprecedentedly depicted the gene co-expression network for backfat tissue development at each period in Ningxiang pigs, which not only helps to understand the integrated mechanism underlying lipid metabolism, but also promotes the progress of genetic improvement in pigs.
Eighteen castrated male Ningxiang pigs in six developmental stages (60, 120, 180, 240, 300, and 360 days) were used in this study. Six groups of pigs were half-sibs, and the three samples in each developmental stage were full-sibs. All the experimental pigs were reared under the standard environmental conditions in Hunan Liushahe Ecological Animal Husbandry Co., Ltd. Three healthy individuals with similar body weight were selected for slaughtering in each developmental stage. The carcass was split longitudinally after removing the head, feet, tail, and viscera, except for the suet and kidneys, and then the left side of carcass was hung upside down. The midline backfat thickness at the position of the thickest point in shoulder, last rib and lumbosacral junction was separately measured, and the average value was calculated. Furthermore, the backfat tissue at the position of the thickest point in shoulder were collected within 30 min after slaughter, and each sample was divided into two parts. One part was fixed in 10% paraformaldehyde for histological analysis, and the other part was immediately frozen in liquid nitrogen and stored in −80°C refrigerator for RNA extraction.
The histological analysis of backfat tissue was measured by hematoxylin and eosin (HE) staining. Briefly, the paraformaldehyde-fixed backfat samples were subjected to dehydration and embedding in paraffin. Three serial tissue sections of each sample were obtained using Leica cryostat (RM 2016, Germany) and then stained with hematoxylin/eosin. Adipocyte area and adipocyte number were calculated according to four randomly selected fields from each section using Caseviewer software. The sections were viewed at ×200 magnification using 3D digital scanner (Pannoramic 250, Hungary).
Total RNA was isolated using Trizol reagent (Invitrogen, United States) following the manufacturer’s protocol. The purity and integrity of total RNA for each sample were assessed using ND-1000 (NanoDrop, United States) and bioanalyzer 2100 (Agilent, United States) with RIN number >7.0, and confirmed by electrophoresis with denaturing agarose gel. And then mRNA library was constructed. In brief, approximately 5 μg of total RNA was used to eliminate ribosomal RNA according to the Ribo-Zero™ rRNA removal Kit (Illumina, United States), and the ribo-minus RNA was fragmented into small pieces. Finally, the 2 × 150 bp paired-end sequencing (PE150) was executed on an Illumina Novaseq™ 6000 (LC-Bio Technology Co., Ltd., China). Furthermore, Cutadapt (V1.9, default) (Martin, 2011) was initially applied to obtain valid data by removing the reads that contained adapter contamination, low quality bases (the number of bases with quality score ≤10 accounts for more than 20% of reads) and undetermined bases (the number of bases with undetermined information accounts for more than 5% of reads). Then sequence quality was verified using FastQC (V0.11.9, default) (Brown et al., 2017). Hisat2 software (V2.0.4, default) (Kim et al., 2019) was used to map valid reads to the Sus scrofa reference genome (V11.1, Ensembl V96), and the mapped reads were assembled using StringTie (V1.3.4, default) (Pertea et al., 2015).
The expression levels of genes were estimated by calculating fragments per kilobase of transcript per million (FPKM) (Trapnell et al., 2010) through StringTie. The DEGs were selected with | log2 (fold change) | ≥ 1 and FDR adjusted p-value (q value) (Benjamini-Hochberg method) ≤ 0.05 by R package edgeR (Robinson et al., 2010). The volcano plot was drawn using ggplot2 package (Ito and Murphy, 2013), while the heatmap was drawn by pheatmap package (Hu, 2021). To assess the potential biological functions of DEGs, gene ontology (GO) (Ashburner et al., 2000) and kyoto encyclopedia of genes and genomes (KEGG) (Kanehisa et al., 2012) enrichment analysis were performed by DAVID software (https://david.ncifcrf.gov/). GO terms and KEGG pathways with p-value ≤0.05 were considered significantly enriched.
Co-expression analysis was performed using WGCNA package in R (Langfelder and Horvath, 2008) under the guidelines of the published tutorials. Genes with FPKM <1 in all samples were filtered. Hierarchical clustering of the eighteen samples was conducted based on Euclidean distance computed on gene expression data. Network topology analysis ensured a scale-free topology network with the defined soft-thresholding power of 9. A total of 41 modules were identified based on the dynamic tree cutting algorithm with the parameters of minModuleSize at 30 and mergeCutHeight at 0.25. For each module, the eigengene (the first component expression of genes in module) was determined, and the correlations of eigengenes with backfat thickness, adipocyte area, and adipocyte number were then subsequently calculated. Genes with high connectivity in the respective modules were considered hub genes. The co-expression relationships in modules were analyzed and visualized by Cytoscape (V3.8.2) (Shannon et al., 2003).
To validate the gene expression levels, total RNA was extracted from backfat tissue in six developmental stages using Trizol reagent (Invitrogen, United States). cDNA was synthesized using RevertAid™ first strand cDNA synthesis kit (K1622, Fermentas) according to the manufacturer’s instructions. QPCR analysis was performed using SYBR Green Supermix (Biomed) on CFX96 machine (Bio-Rad, United States). Porcine β-actin was used as endogenous control. Each QPCR reaction was performed in triplicate, and the relative expression level of gene was calculated using the 2−ΔΔCT method. The sequences of QPCR primers were listed in Supplementary Table S1.
With development of backfat tissue in Ningxiang pigs, the average backfat thickness in 60 and 120 days were significantly lower than that in other stages (p < 0.01), and there were remarkable differences in the average backfat thickness between 180 and 240 days (p < 0.05), 180 and 300 days (p < 0.01), 180 and 360 days (p < 0.01), 240 and 360 days (p < 0.01), respectively (Figure 1A). Additionally, obvious differences in adipocyte phenotype were examined by HE staining (Figure 1B). Adipocyte area gradually increased, and adipocyte number showed a progressive downward trend. Adipocyte area in 60 days was notably smaller than that in other stages, and 300 days (p < 0.05) and 360 days (p < 0.01) had larger adipocyte area than 120 days. Meanwhile, the adipocyte number in 60 days was markedly higher (p < 0.01) that than in other stages except for 120days, and the adipocyte numbers in 240, 300, and 360 days were lower (p < 0.05) compared with that in 120 days. These results displayed the intelligible features during development of backfat tissue in Ningxiang pigs.
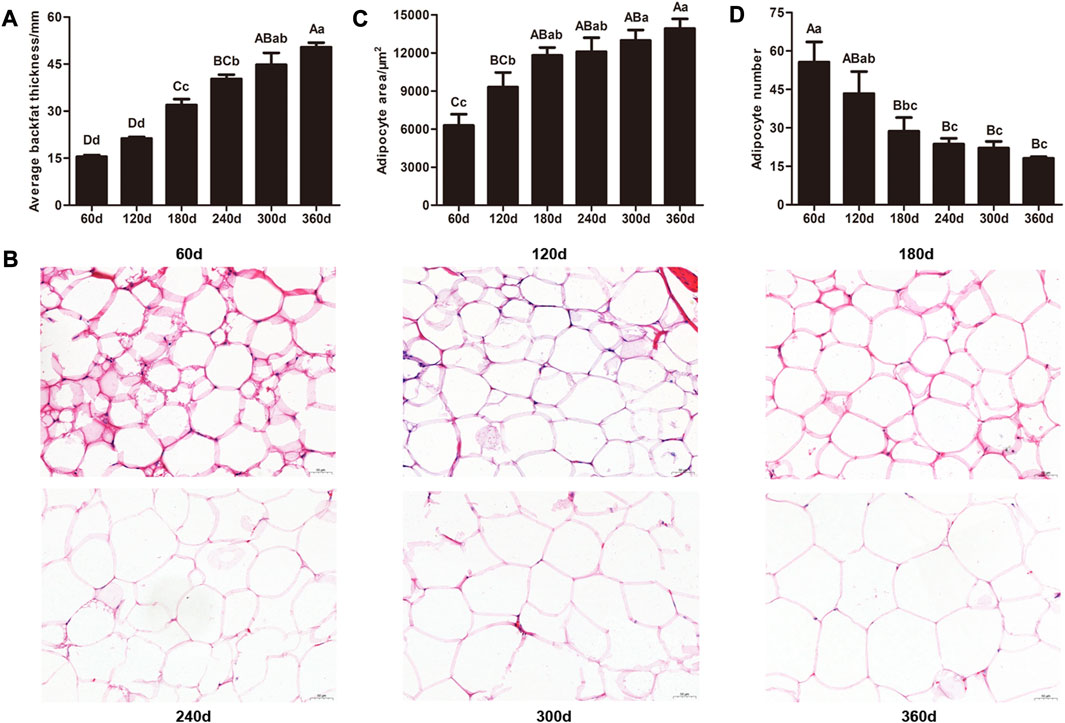
FIGURE 1. Histological analysis of backfat tissue from the six developmental stages in Ningxiang pigs. (A) Average backfat thickness of experimental pigs. (B) Representative images of HE staining of backfat tissue (magnification: ×200, scale bar = 50 μm). (C) Adipocyte area and (D) adipocyte number of backfat tissue. Statistical analysis of the data from backfat thickness, adipocyte area, and adipocyte number were performed by one-way analysis of variance program with SPSS 20.0 software. All results were expressed as mean values and standard error. Different lowercase letters above columns indicated statistical differences (p ≤ 0.05), and values with different uppercase letters were significantly different (p ≤ 0.01).
A total of eighteen libraries were constructed using backfat tissue from the developmental stage of 60, 120, 180, 240, 300, and 360 days. We obtained 89,249,470–97,751,248 raw reads and 81,225,086–90,086,352 valid reads with Q30 ratio of 97.56%–97.99% and GC content of 45.50%–51.50%. Moreover, 87.35%–91.85% of valid reads was mapped to the Sus scrofa reference genome. After assembly, 56,294–57,783 transcripts and 23,416–24,057 genes were obtained (Supplementary Table S2). In addition, a total of 27,883 genes were identified from the eighteen libraries, including 19,755 known genes and 8,128 novel genes.
Five comparison groups (120 days vs. 60days, 180 days vs. 120days, 240 days vs. 180days, 300 days vs. 240 days, and 360 days vs. 300 days) were established. A total of 1,024 DEGs were recognized (Table 1), and the DEGs among these groups were visualized as heatmap (Figure 2A) and volcano plot (Figure 2B), respectively. The detailed information about these DEGs was documented in Supplementary Table S3.
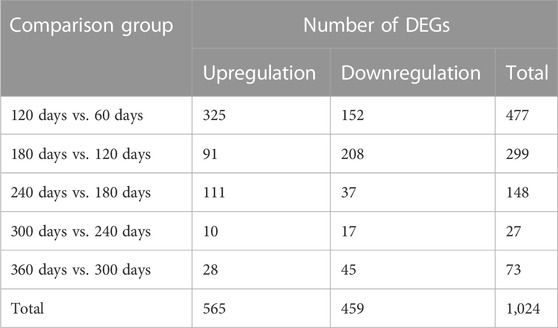
TABLE 1. The number of DEGs in five comparison groups.
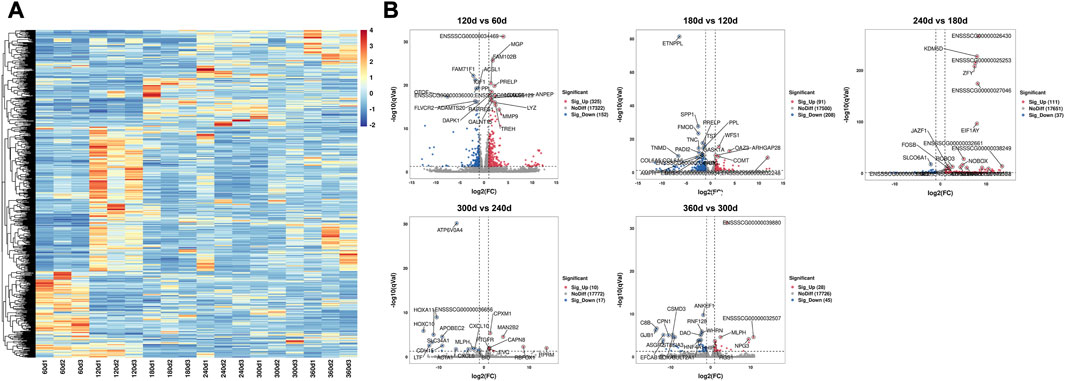
FIGURE 2. The heatmap and volcano plot of 1,024 DEGs in different developmental stages. (A) The heatmap of DEGs in six developmental stages. Each row indicated a gene, and each column indicated a sample. (B) The volcano plot of DEGs in 120 days vs. 60 days, 180 days vs. 120 days, 240 days vs. 180 days, 300 days vs. 240 days, and 360 days vs. 300 days comparison groups. The X-axis represented log2 value of fold change, and the Y-axis represented–log10 value of q value for each gene. The red dots demonstrated the significantly upregulated genes while the blue dots demonstrated the significantly downregulated genes, and the grey dots demonstrated the genes with no significant differential expression. The top 20 DEGs with significant difference were noted.
A cut-off of R2 = 0.85 was utilized to select the soft-threshold β, and β = 9 was selected for network construction (Figure 3A). Strongly co-expressed genes in modules were clustered with different colors, while the genes not clustered were grouped into the grey module (Figure 3B). The detailed information about modules was shown in Supplementary Table S4. The correlation in module-stage relationship was displayed as a heatmap (Figure 3C). Among these modules, turquoise (0.95, p = 6e-09), red (0.87, p = 6e-06), pink (0.64, p = 0.006), paleturquoise (0.58, p = 0.02), darkorange (0.59, p = 0.01), and darkgreen (0.68, p = 0.003) module had the highest correlation coefficient with 60, 120, 180, 240, 300, and 360 days, respectively. Meanwhile, the correlation of modules with traits was presented in Figure 3D, and tan (0.77, p = 3e-04), black (0.71, p = 0.001) and turquoise (0.80, p = 1e-04) had strong correlation with backfat thickness, adipocyte area, and adipocyte number, respectively.
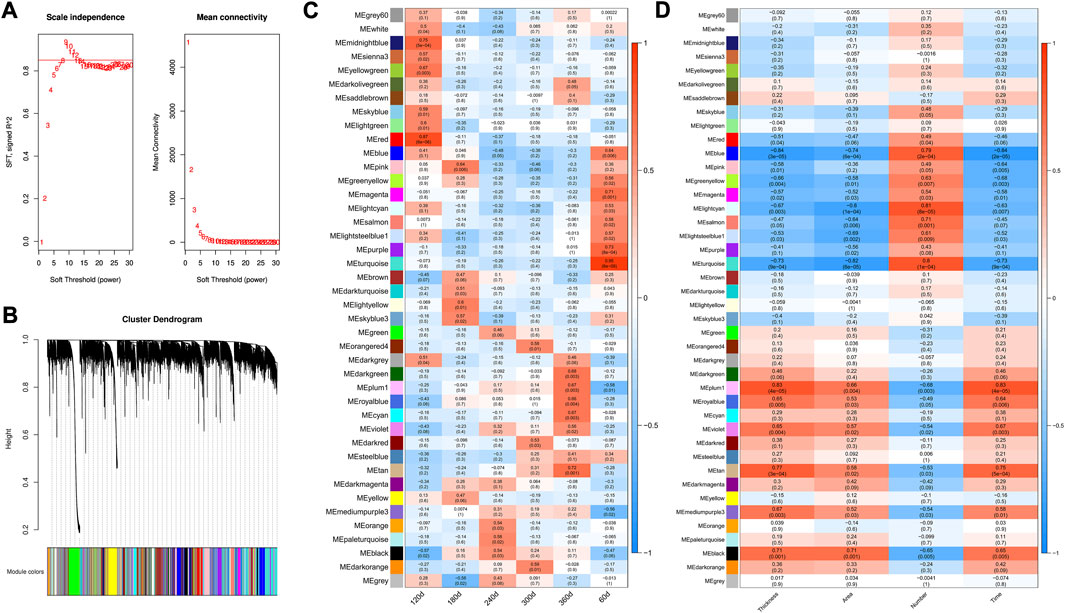
FIGURE 3. Weighted gene co-expression network construction. (A) Determination of best soft-threshold β for WGCNA. The red line corresponding to 0.85. Nine is selected based on the consideration of both scale independence and mean connectivity. SFT means scale free topology. (B) Clustering tree (dendrogram) defined by WGCNA representing the co-expression modules. Branches of the dendrogram correspond to gene modules labeled with different colors (C) Heatmap of correlation coefficient between genes modules and developmental stages. (D) Heatmap of correlation coefficient between genes modules and traits. Thickness: backfat thickness; Area: adipocyte area; Number: adipocyte number. Red indicated a strong positive association, and blue indicated a strong negative correlation. The numbers in brackets represent the p-value between gene module and developmental stage/trait.
The GO analysis and KEGG enrichment were performed for the genes in the turquoise, red, pink, paleturquoise, darkorange and darkgreen modules in module-stage relationship, respectively. The result of GO analysis was illustrated in Figure S1; Supplementary Table S5. The comprehensive content about the KEGG enriched pathways was exhibited in Supplementary Table S6, and the top 20 significantly enriched pathways were shown in Figures 4A–F, respectively. The turquoise module, which was related to 60 days, was enriched with 306 pathways, of which 245 pathways were noticeably enriched, such as fatty acid degradation, glycerolipid metabolism, glycerophospholipid metabolism, fatty acid elongation, biosynthesis of unsaturated fatty acids, ether lipid metabolism, alpha-linolenic acid metabolism, sphingolipid signaling pathway, non-alcoholic fatty liver disease, fat digestion and absorption, adipocytokine signaling pathway, regulation of lipolysis in adipocyte, bile secretion, and cholesterol metabolism. A total of 121 terms were distinctly enriched in red module, and the KEGG pathways included glycerolipid metabolism, glycerophospholipid metabolism, ether lipid metabolism, sphingolipid metabolism, arachidonic acid metabolism, and regulation of lipolysis in adipocyte. The pink module correlated to 180 days were enriched in 152 significant pathways. For example, sphingolipid metabolism, sphingolipid signaling pathway, non-alcoholic fatty liver disease, and adipocytokine signaling pathway were all connected with lipid metabolism. There were 60 KEGG pathways in the paleturquoise module, of which 30 were remarkably enriched, including steroid hormone biosynthesis and arachidonic acid metabolism. The darkorange module correlated to 300 days was strikingly enriched in 50 terms, of which fatty acid biosynthesis, sphingolipid metabolism, steroid hormone biosynthesis, and sphingolipid signaling pathway were detected. The darkgreen module was enriched with 127 pathways, of which 50 pathways were significantly enriched, such as sphingolipid metabolism, fatty acid degradation, fatty acid biosynthesis, primary bile acid biosynthesis, steroid biosynthesis, sphingolipid signaling pathway, and adipocytokine signaling pathway.
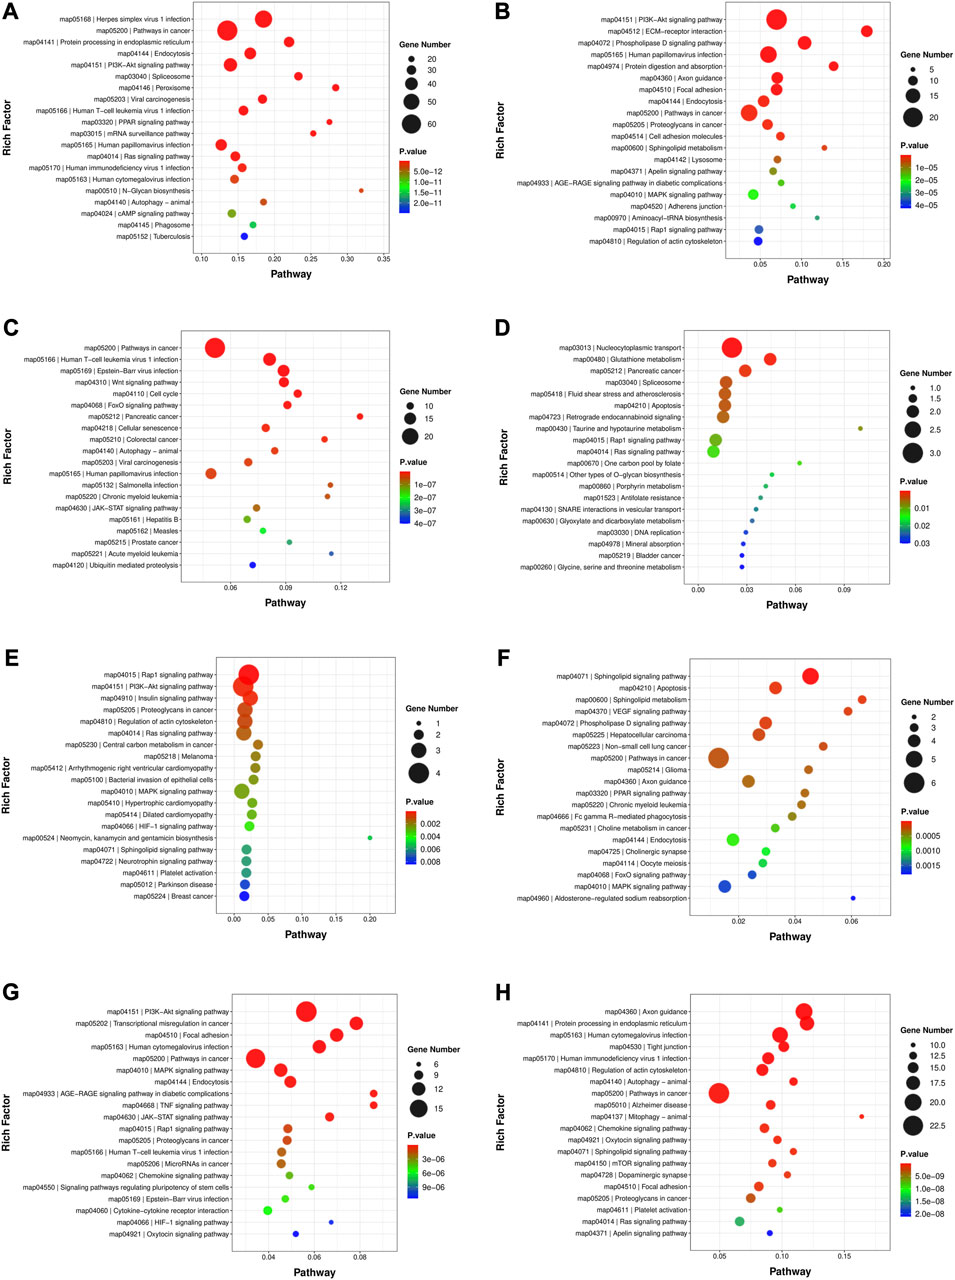
FIGURE 4. The top 20 significantly enriched KEGG pathways in developmental stage related and trait related modules. (A) Turquoise module. (B) Red module. (C) Pink module. (D) Paleturquoise module. (E) Darkorange module. (F) Darkgreen module. (G) Tan module. (H) Black module.
Furthermore, the GO analysis (Supplementary Figure S1; Supplementary Table S5) and KEGG enrichment of genes in module-trait relationship were also carried out. As exhibited in Figure 4; Supplementary Table S7, in the notably KEGG enriched pathways related to lipid metabolism, the tan module (Figure 4G) was involved in sphingolipid signaling pathway, regulation of lipolysis in adipocytes and adipocytokine signaling pathway; the black module (Figure 4H) were associated with glycerophospholipid metabolism, arachidonic acid metabolism, fatty acid degradation, glycerolipid metabolism, fatty acid elongation, adipocytokine signaling pathway, and regulation of lipolysis in adipocytes; the turquoise module (Figure 4A) was the same as that in module-stage relationship.
In order to research the interaction of genes in each module based on module-stage and module-trait relationship, the gene co-expression network was constructed by cytoscape software. And the connectivity between genes in each module was listed in Supplementary Table S8. The gene co-expression network with 364 nodes and 741 edges, 470 nodes and 1,100 edges, 380 nodes and 1,051 edges, 27 nodes and 21 edges, 40 nodes and 35 edges, and 54 nodes and 56 edges in turquoise, red, pink, paleturquoise, darkorange, and darkgreen module, respectively. In addition, the gene co-expression network with 238 nodes and 557 edges and 498 nodes and 1,427 edges in tan and black module. After removing the isolated nodes and node pairs, the gene co-expression network in module was visualized. The top 10% connectivity genes in turquoise, red and pink module and all connectivity genes in paleturquoise, darkorange and darkgreen module with the greatest number of edges were considered as hub genes (Figures 5A–F). And the top 10% connectivity genes in tan and black module with the greatest number of edges were also regarded as hub genes (Figure 6).
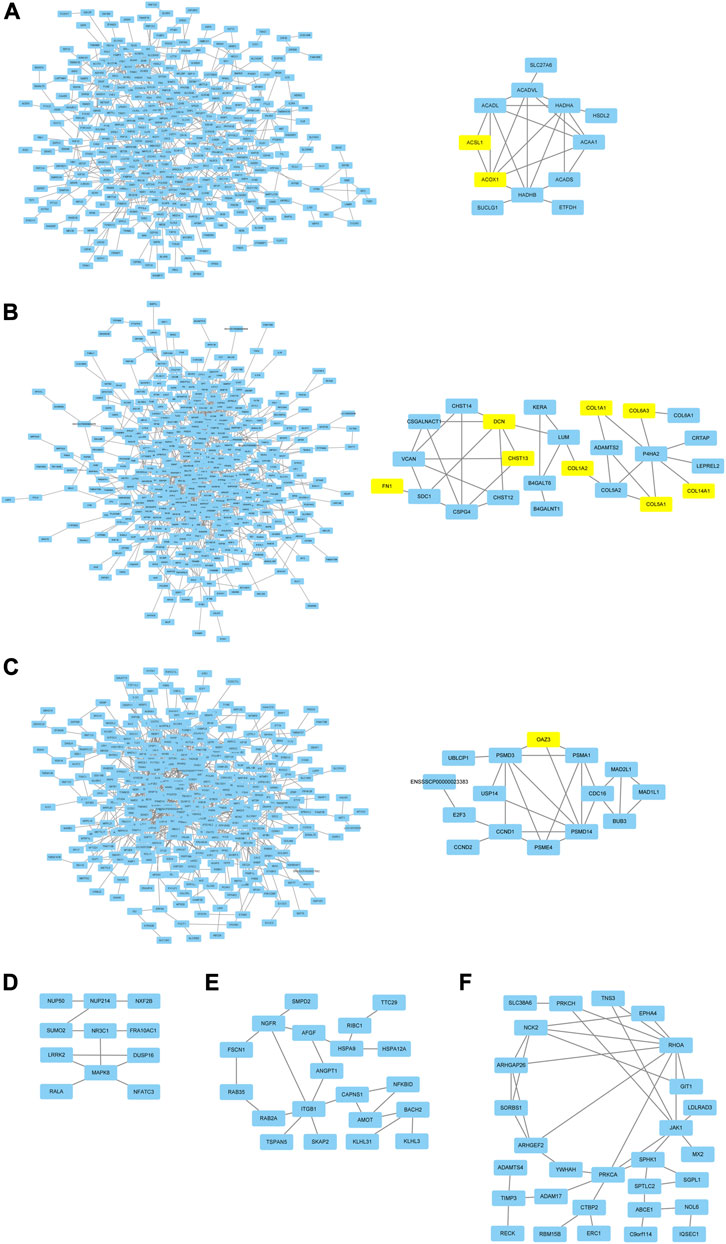
FIGURE 5. Gene co-expression networks and hub genes in developmental stage related modules. (A) Network (left) and hub genes (right) in turquoise module. (B) Network (left) and hub genes (right) in red module. (C) Network (left) and hub genes (right) in pink module. (D) hub genes in paleturquoise module. (E) hub genes in darkorange module. (F) hub genes in darkgreen module. The yellow rectangles represented DEGs.
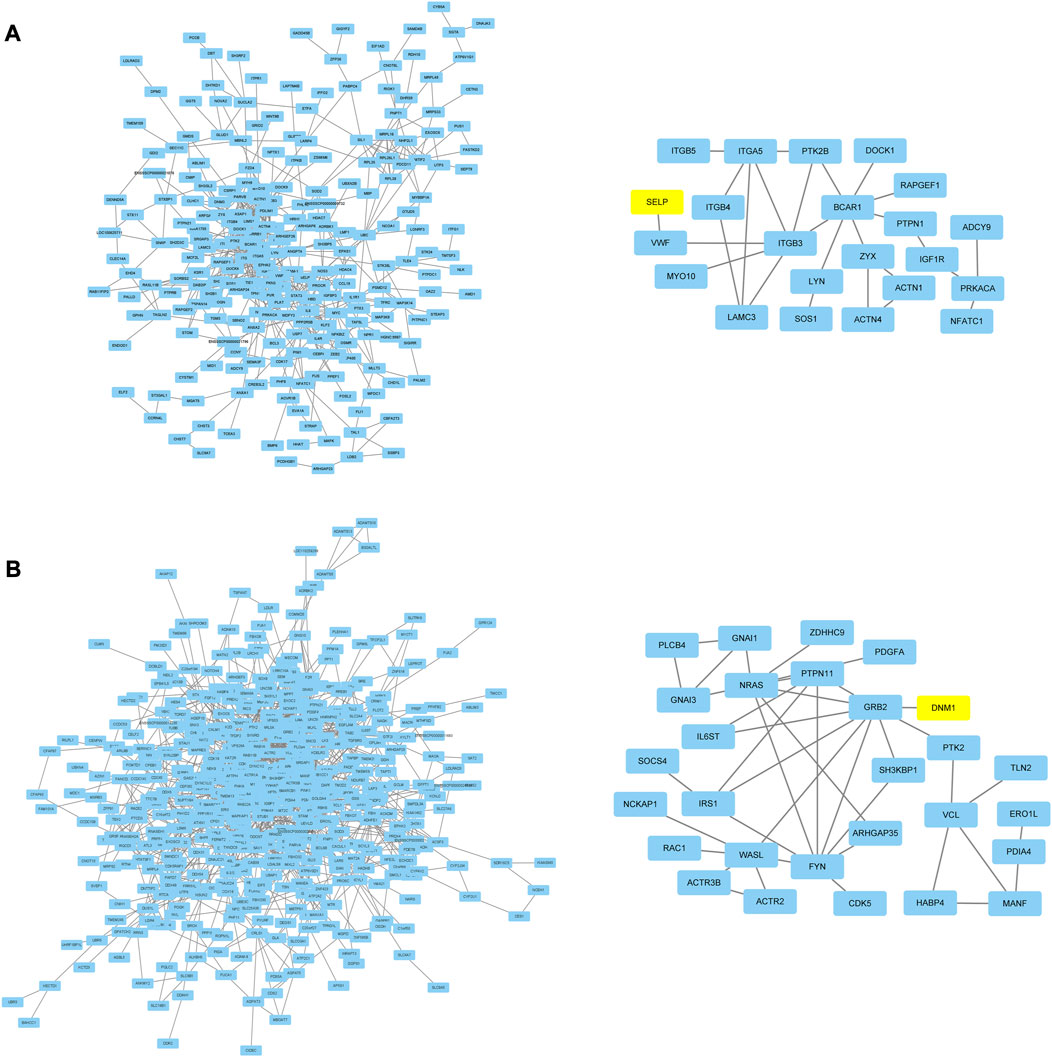
FIGURE 6. Gene co-expression networks and hub genes in trait related modules. (A) Network (left) and hub genes (right) in tan module. (B) Network (left) and hub genes (right) in black module. The yellow rectangles represented DEGs.
Thirteen DEGs and hub genes from 8 modules were selected for validation by QPCR analysis, including ACSL1, ACOX1, FN1, DCN, CHST13, COL1A1, COL1A2, COL6A3, COL5A1, COL14A1, OAZ3, DNM1, and SELP. The expression trend of all these genes showed strong consistency with RNA-seq data (Figure 7), manifesting the reliability and accuracy of our study.
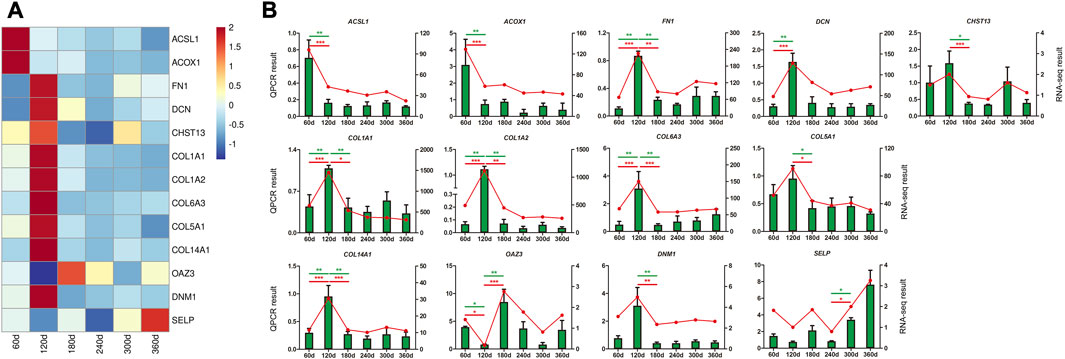
FIGURE 7. QPCR validation of DEGs and hub genes in backfat tissue. (A) The heatmap of DEGs and hub genes. (B) QPCR validation of DEGs and hub genes. The X-axis represented the developmental stages of Ningxiang pigs. QPCR result was exhibited as green column labeled on the Y-axis on the left, and β-actin was used as endogenous control. The data from RNA-seq result was displayed as red line labeled on the Y-axis on the right, and the expression was normalized as FPKM. Statistical analysis of the data from QPCR assay were performed by one-way analysis of variance program with SPSS 20.0 software, and the results were expressed as mean values and standard error. Differences were considered to be significant at p ≤ 0.05 (* p ≤ 0.05 and ** p ≤ 0.01).
This study aimed at identifying 1,024 DEGs across five comparison groups during backfat tissue development in Ningxiang pigs. The WGCNA results depicted that six and three modules were predominantly associated with developmental stages and traits (backfat thickness, adipocyte area, and adipocyte number), respectively, and thirteen DEGs and hub genes were recognized for the first time.
The turquoise module was remarkably associated with the 60 days developmental stage. Enrichment analysis of this module revealed the significance of Acyl-CoA synthetase long chain family member 1 (ACSL1) and Acyl-CoA oxidase 1 (ACOX1), which are involved in the peroxisome, PPAR signaling pathway, fatty acid degradation, and biosynthesis of unsaturated fatty acids in the early developmental stage of backfat tissue. ACSL1 plays a crucial role in lipid metabolism; it converts long chain fatty acids to fatty acyl-CoAs by esterification, and ACSL1 level is prominently elevated during the early stage of porcine preadipocyte differentiation (Shan et al., 2022). Additionally, ACSL1 overexpression suppresses lipolysis and fatty acid β-oxidation and upregulates polyunsaturated fatty acid synthesis, triglyceride accumulation, and lipid droplet aggregation (Li et al., 2020a; Zhao et al., 2020; Shan et al., 2022). ACOX1, the first rate-limiting enzyme involved in peroxisomal fatty acid β-oxidation, is predominantly associated with lipid homeostasis and preadipocyte adipogenesis. Prior research depicted that hepatic ACOX1 deficiency substantially lowers triglyceride accumulation in mice (He et al., 2020), and gain-of-function and loss-of-function assays demonstrated that ACOX1, governed by transcription factors C/EBPα and miR-25-3p, stimulates the adipogenesis of bovine intramuscular preadipocyte (Zhang et al., 2021). However, a recent study documented that ACOX1 inhibition promotes triglyceride accumulation in mouse hepatocytes (Yang et al., 2023). The discrepancy in these findings may be attributed to specific experimental conditions and different cell sources. The present study exhibited considerably higher levels of ACSL1 and ACOX1 expression in 60 days, implying a conceivable action in the early developmental stage of backfat tissue in Ningxiang pigs.
Analysis of the red module, which was distinctly related to the 120 days developmental stage, revealed enrichment of the PI3K-Akt signaling pathway, extracellular matrix (ECM)-receptor interaction, protein digestion and absorption, and focal adhesion. FN1, DCN, CHST13, COL1A1, COL1A2, COL5A1, COL6A3, and COL14A1 were further selected as the DEGs and hub genes. Intriguingly, these genes displayed similar expression trends in expression in backfat tissue across the six developmental stages, with the highest expression observed in 120 days.
Fibronectin (FN), one of the major fibrillary components of the ECM and an adipocyte-specific dysregulated gene product in obese adipose tissue, plays a vital role in tissue development, cell morphology, and mesenchymal stem cell differentiation (Wang et al., 2019; Yu et al., 2022). FN1 knockout adversely affects the adipogenic differentiation of induced human infrapatellar fat pad-derived stem cells, as evidenced by remarkably low adipogenic gene expressions and lipid droplets (Wang et al., 2019). Our findings were corroborated by KEGG and protein-protein interaction network analysis, which presented FN1 as a hub gene in subcutaneous adipose tissue derived adipocyte of obese patients; consequently, FN1 and its associated signaling pathways could be rendered potential targets in treating obesity (Yu et al., 2022). Decorin (DCN), a small leucine rich proteoglycan component of the ECM in various tissues, is overexpressed in adipose tissue, binds to a variety of collagens, and contributes to collagen fibril formation (Meissburger et al., 2016; Svärd et al., 2019). The expression of glycanation site deficient DCN in 3T3-L1 cells promotes proliferation but suppresses lipid accumulation upon adipogenic induction (Daquinag et al., 2011). Another study suggested that the prevalence of DCN in murine visceral preadipocyte correlates with the reduced propensity of these cells to undergo adipogenic differentiation (Meissburger et al., 2016). Considering the essential functions of fibronectin and different types of collagen in adipocyte differentiation, the detrimental impact of DCN on adipogenesis may at least be partly attributable to alterations in ECM formation. These observations indicated a crucial role for DCN in adipogenesis. Carbohydrate sulfotransferase 13 (CHST13), a member of the carbohydrate sulfotransferase gene family, encodes a chondroitin sulfating and chondroitin sulfate synthesizing enzyme. Previous researches suggested that CHST13 is prominently associated with several biological processes, including liver injury, cell invasion, and cancer (Ryanto et al., 2020; Wang et al., 2022; Southekal et al., 2023); however, the correlation between CHST13 and adipose deposition remains largely unexplored and warrants further research.
Collagens expressed by adipose tissue, namely COL1A1, COL1A2, COL5A1, COL6A3, and COL14A1 (Ullah et al., 2013; Côté et al., 2017; Yu et al., 2022), are key constituents of the ECM and play crucial roles in regulating stem cell stemness, preadipocyte differentiation and adipose tissue expandability (Berger et al., 2015; Wang et al., 2019; Johnston and Abbott, 2022).
COL1A1 is a major ECM gene in adipose tissue that is overexpressed following weight loss or reduction in obese adipose tissue (Berger et al., 2015). COL1A2 is an adipogenic marker in multipotent antler stem cells, and any drastic change in distinct adipocyte morphology and accumulated lipid droplets is paralleled by a 2.5-fold upregulation of COL1A2 expression (Berg et al., 2007). Additionally, COL1A1 and COL1A2 have been identified as hub genes in obesity-induced cardiac fibrosis (Pan et al., 2022). COL5A1 is differentially expressed before and after bariatric surgery and may be a novel candidate gene for modulating adipose tissue function (Dankel et al., 2010). In PLXND1 gene deficient zebrafish visceral adipose tissue, the induction of COL5A1 promotes adipocyte proliferation and differentiation, culminating in hyperplastic visceral adipose tissue morphology and reduced lipid accumulation (Minchin et al., 2015). Moreover, COL5A1 has been deemed a hub gene associated with bovine subcutaneous adipose tissue by WGCNA, which is consistent with our results (Sheng et al., 2022). Increasing evidence suggests that COL6A3 expression is distinctly correlated with adipose tissue mass, adipocyte size, weight gain or loss, insulin resistance, and inflammation (Pasarica et al., 2009; Dankel et al., 2014; McCulloch et al., 2015). COL6A3 knockdown elevates the expression of adipogenic genes and triglyceride content in human adipocyte (Gesta et al., 2016). COL14 is a fibril-associated collagen that is predominantly expressed in well differentiated tissues, and it could potentially trigger the differentiation of 3T3-L1 preadipocyte into adipocyte, as evidenced by lipid accumulation (Ruehl et al., 2005). Bioinformatic analysis revealed that COL14A1 is downregulated in the ECM of adipogenically differentiated mesenchymal stem cells (Ullah et al., 2013), indicating its significance in adipose tissue development.
Recent investigations have verified that the COL1 network is the last to form and remains well organized during the later stage of adipocyte differentiation, and the extracellular network of COL5 and COL6 is formed in the middle stage of adipocyte differentiation and maintained until the late stage of adipocyte differentiation (Sheng et al., 2022). Another study has designated COL1A2, COL5A1, COL6A3 as DEGs in obese and healthy adipocyte excised from subcutaneous tissue in humans. GO analysis demonstrated that these three DEGs are enriched in ECM organization in biological process; in ECM and collagen trimer in cellular component. KEGG pathway enrichment further revealed that the aforementioned three DEGs are primarily involved in ECM-receptor interaction, protein digestion and absorption, and PI3K-Akt signaling pathway (Yu et al., 2022). These results are in accordance with those of our investigation, although the functional relevance of COL1A1, COL1A2, COL5A1, COL6A3, and adipogenesis needs to be further elucidated.
The pink, paleturquoise, darkorange, and darkgreen module had the highest correlation coefficient with 180, 240, 300, and 360 days developmental stage, respectively. Besides, tan, black and turquoise module had strong relationship with backfat thickness, adipocyte area and adipocyte number in turn. OAZ3, SELP, and DNM1 were apprehended as DEGs and hub genes in the pink, tan, and black module, respectively. Ornithine decarboxylase antizyme 3 (OAZ3) is a member of the antizyme gene family, and its mRNA is exclusively expressed in post-meiotic male germ cells (Ruan et al., 2011). OAZ3 evidently aids in the regulation of polyamine concentration during spermiogenesis and contributes to sperm function and fertility (Gòdia et al., 2020; Sarkar et al., 2022). P-selectin (SELP) belongs to the selectin proteins family and is primarily expressed in platelets, endothelial cells, and immune cells (Wang et al., 2023). SELP modulates thrombus formation through platelets activation, and a positive correlation has been observed between age and SELP expression in hyperlipidemia and thrombosis related diseases (Koyama et al., 2003; Yeini and Satchi-Fainaro, 2022). Nevertheless, few investigations have reported the relationship between OAZ3, SELP and adipogenic differentiation and adipogenesis, to date. This study provides novel mechanistic insights into the regulation of adipogenesis. Dynamin 1 (DNM1), a member of the dynamin superfamily of proteins, plays a central role in mitochondrial and peroxisomal distribution and fission processes (Koch et al., 2003; Tamura et al., 2011) and has displayed functionality in brown and white adipose tissue. It has been reported that the lipid droplets in adipose tissue of adipose tissue-specific DNM1 knockout mice exhibit more unilocular morphology with larger sizes, with DNM1 deficiency effecting abnormal retention of nascent micro-lipid droplets in endoplasmic reticulum, decreased lipolysis, and accumulation of unhealthy adipocyte in adipose tissue. In contrast, the retention of lipid droplets in endoplasmic reticulum can be rescued by DNM1 overexpression in adipocyte (Li. et al., 2020). Furthermore, DNM1 is overexpressed in brown adipose tissue, and its level escalates during beige and brown adipocyte differentiation. Inhibition of DNM1 expression was confirmed to mitigate beige adipocyte differentiation, thereby validating its essential role in beige and brown adipogenesis (Mooli et al., 2020).
Taken together, a total of thirteen DEGs and hub genes were recognized from six developmental stages related modules and three trait related modules in backfat tissue in Ningxiang pigs, among which, ACSL1 and ACOX1, well known biomarkers of adipogenesis, might perform function in the early developmental stage of backfat tissue (60 days). Other DEGs and hub genes in modules, such as FN1, DCN, COL1A1, COL1A2, COL5A1, COL6A3, and COL14A1, play regulatory roles in cell adipogenic differentiation, lipid droplet accumulation, triglyceride content, and adipose tissue mass, illustrating their unignorable position around 120 days developmental stage of backfat tissue in Ningxiang pigs (Figure 8). In addition, OAZ3, SELP and DNM1 were also identified as hub genes, and the functional relevance associated with the lipid metabolism requires further elucidation.
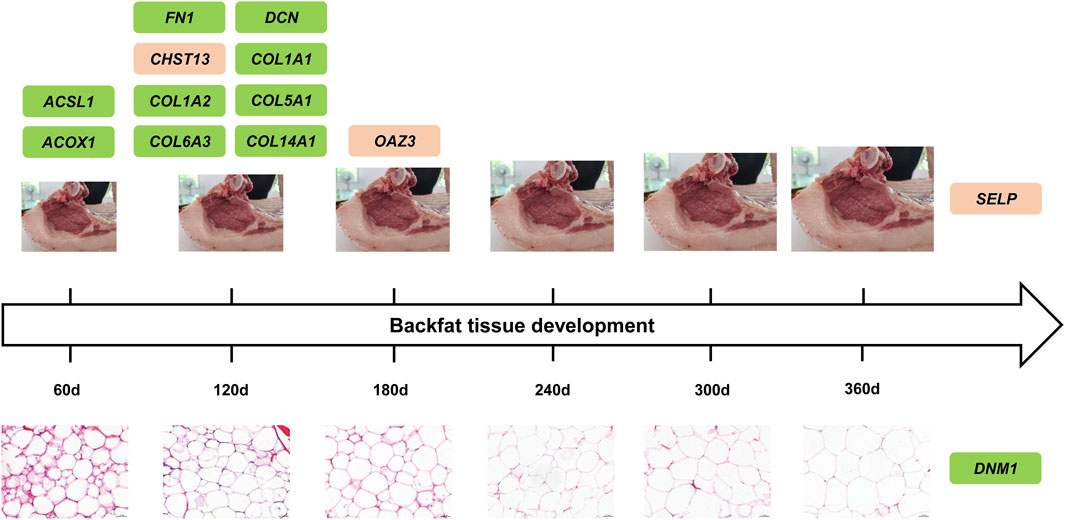
FIGURE 8. Proposed model of DEGs and hub genes during developmental stage of backfat tissue in Ningxiang pigs. The upper row of figures represented the developmental trend of backfat tissue, and the size of figures exemplified backfat thickness. The lower row of figures manifested adipocyte area in backfat tissue. Additionally, the green rectangles represented genes are closely associated with adipogenesis and lipid metabolism which have been validated previously, while the orange rectangles represented genes might involve in adipogenesis and lipid metabolism which warrants further investigation.
The data presented in the study are deposited in the NCBI repository, accession number GSE234796.
The animal studies were approved by Hunan Institute of Animal and Veterinary Science. The studies were conducted in accordance with the local legislation and institutional requirements. Written informed consent was obtained from the owners for the participation of their animals in this study.
CC, SY, and YP designed and initiated the project. HR, HL, XY, and XH collected and analyzed the data. YD conducted the histological analysis. QC and JZ performed molecular experiments. SZ, JY, and HW raised the experimental pigs. CC wrote the original draft. YP participated in the revision of the manuscript. CC and YP were in charge of project administration and supervised the study. All authors contributed to the article and approved the submitted version.
This work was supported by Seed Industry Vitalization Program of Ningxiang Animal Husbandry and Fishery Technology Service Center (1-43010100), Natural Science Foundation of Hunan Province (2021JJ30386), Innovation Platform and Talent Plan Project of Human Province (2021NK1009), Open Research Program of Hunan Provincial Key Laboratory (2017TP1030), Technology Achievement Transformation and Industrialization Plan Project (2022GK4016), Modern Swine Industry Technology System of Hunan Province, and Changsha China Longping Seed Industry Silicon Valley Project.
The authors sincerely express appreciation to Hunan Liushahe Ecological Animal Husbandry Co., Ltd. for providing the experimental pigs.
Authors SZ, JY, HW, XY, and SY were employed by Hunan Liushahe Ecological Animal Husbandry Co., Ltd.
The remaining authors declare that the research was conducted in the absence of any commercial or financial relationships that could be construed as a potential conflict of interest.
All claims expressed in this article are solely those of the authors and do not necessarily represent those of their affiliated organizations, or those of the publisher, the editors and the reviewers. Any product that may be evaluated in this article, or claim that may be made by its manufacturer, is not guaranteed or endorsed by the publisher.
The Supplementary Material for this article can be found online at: https://www.frontiersin.org/articles/10.3389/fgene.2023.1234757/full#supplementary-material
SUPPLEMENTARY TABLE S1 | The sequences of primers in QPCR analysis.
SUPPLEMENTARY TABLE S2 | Statistical data of RNA-seq.
SUPPLEMENTARY TABLE S3 | The detailed information about DEGs in five comparison groups.
SUPPLEMENTARY TABLE S4 | The detailed information about modules.
SUPPLEMENTARY TABLE S5 | GO analysis for the genes in developmental stage related and trait related modules.
SUPPLEMENTARY TABLE S6 | KEGG enriched pathways for the genes in developmental stage related modules.
SUPPLEMENTARY TABLE S7 | KEGG enriched pathways for the genes in trait related modules.
SUPPLEMENTARY TABLE S8 | The connectivity between genes in developmental stage related and trait related modules.
SUPPLEMENTARY FIGURE S1 | The top 20 significantly GO terms in developmental stage related and trait related modules. (A) Turquoise module. (B) Red module. (C) Pink module. (D) Paleturquoise module. (E) Darkorange module. (F) Darkgreen module. (G) Tan module. (H) Black module.
ACSL1, acyl-CoA synthetase long chain family member 1; ACOX1, acyl-CoA oxidase 1; CHST13, carbohydrate sulfotransferase 13; COL, collagen; DCN, decorin; DEGs, differentially expressed genes; DNM1, Dynamin 1; ECM, extracellular matrix; FN1, fibronectin 1; FPKM, fragments per kilobase of transcript per million; GO, gene ontology; HE, hematoxylin and eosin; KEGG, kyoto encyclopedia of genes and genomes; OAZ3, ornithine decarboxylase antizyme 3; QPCR, quantitative real-time polymerase chain reaction; RNA-seq, RNA-sequencing; SELP, P-selectin; WGCNA, weighted gene co-expression network analysis.
Ashburner, M., Ball, C. A., Blake, J. A., Botstein, D., Butler, H., Cherry, J. M., et al. (2000). Gene ontology: tool for the unification of biology. The gene ontology consortium. Nat. Genet. 25 (1), 25–29. doi:10.1038/75556
Berg, D. K., Li, C. Y., Asher, G., Wells, D. N., and Oback, B. (2007). Red deer cloned from antler stem cells and their differentiated progeny. Bio. Reprod. 77 (3), 384–394. doi:10.1095/biolreprod.106.058172
Berger, E., Héraud, S., Mojallal, A., Lequeux, C., Weiss-Gayet, M., Damour, O., et al. (2015). Pathways commonly dysregulated in mouse and human obese adipose tissue: FAT/CD36 modulates differentiation and lipogenesis. Adipocyte 4 (3), 161–180. doi:10.4161/21623945.2014.987578
Brown, J., Pirrung, M., and McCue, L. A. (2017). FQC dashboard: integrates FastQC results into a web-based, interactive, and extensible FASTQ quality control tool. Bioinformatics 33 (19), 3137–3139. doi:10.1093/bioinformatics/btx373
Côté, J. A., Lessard, J., Pelletier, M., Marceau, S., Lescelleur, O., Fradette, J., et al. (2017). Role of the TGF-β pathway in dedifferentiation of human mature adipocytes. FEBS Open Biol. 7 (8), 1092–1101. doi:10.1002/2211-5463.12250
Dankel, S. N., Fadnes, D. J., Stavrum, A. K., Stansberg, C., Holdhus, R., Hoang, T., et al. (2010). Switch from stress response to homeobox transcription factors in adipose tissue after profound fat loss. PLoS One 5 (6), e11033. doi:10.1371/journal.pone.0011033
Dankel, S. N., Svärd, J., Matthä, S., Claussnitzer, M., Klöting, N., Glunk, V., et al. (2014). COL6A3 expression in adipocytes associates with insulin resistance and depends on PPARγ and adipocyte size. Obes. (Silver Spring) 22 (8), 1807–1813. doi:10.1002/oby.20758
Daquinag, A. C., Zhang, Y., Amaya-Manzanares, F., Simmons, P. J., and Kolonin, M. G. (2011). An isoform of decorin is a resistin receptor on the surface of adipose progenitor cells. Cell. Stem Cell. 9 (1), 74–86. doi:10.1016/j.stem.2011.05.017
Davoli, R., Gaffo, E., Zappaterra, M., Bortoluzzi, S., and Zambonelli, P. (2018). Identification of differentially expressed small RNAs and prediction of target genes in Italian Large White pigs with divergent backfat deposition. Anim. Genet. 49 (3), 205–214. doi:10.1111/age.12646
Gesta, S., Guntur, K., Majumdar, I. D., Akella, S., Vishnudas, V. K., Sarangarajan, R., et al. (2016). Reduced expression of collagen VI alpha 3 (COL6A3) confers resistance to inflammation-induced MCP1 expression in adipocytes. Obes. (Silver Spring) 24 (8), 1695–1703. doi:10.1002/oby.21565
Gòdia, M., Reverter, A., González-Prendes, R., Ramayo-Caldas, Y., Castelló, A., Rodríguez-Gil, J. E., et al. (2020). A systems biology framework integrating GWAS and RNA-seq to shed light on the molecular basis of sperm quality in swine. Genet. Sel. Evol. 52 (1), 72. doi:10.1186/s12711-020-00592-0
Gong, Y., He, J., Li, B., Xiao, Y., Zeng, Q. H., Xu, K., et al. (2021). Integrated analysis of lncRNA and mRNA in subcutaneous adipose tissue of Ningxiang pig. Biol. (Basel) 10 (8), 726. doi:10.3390/biology10080726
Han, Y. Y., Wang, W. G., Jia, J., Sun, X. M., Kuang, D. X., Tong, P. F., et al. (2020). WGCNA analysis of the subcutaneous fat transcriptome in a novel tree shrew model. Exp. Biol. Med. (Maywood) 245 (11), 945–955. doi:10.1177/1535370220915180
Hausman, G. J., Barb, C. R., and Dean, R. G. (2007). Patterns of gene expression in pig adipose tissue: transforming growth factors, interferons, interleukins, and apolipoproteins. J. Anim. Sci. 85 (10), 2445–2456. doi:10.2527/jas.2007-0142
He, A. Y., Chen, X. W., Tan, M., Chen, Y. L., Lu, D. L., Zhang, X. Y., et al. (2020). Acetyl-CoA derived from hepatic peroxisomal β-oxidation inhibits autophagy and promotes steatosis via mTORC1 activation. Mol. Cell. 79 (1), 30–42. doi:10.1016/j.molcel.2020.05.007
Hood, R. L., and Allen, C. E. (1977). Cellularity of porcine adipose tissue: effects of growth and adiposity. J. Lipid Res. 18 (3), 275–284. doi:10.1016/S0022-2275(20)41676-1
Hu, K. J. (2021). Become competent in generating RNA-seq heat maps in one day for novices without prior R experience. Methods Mol. Biol. 2239, 269–303. doi:10.1007/978-1-0716-1084-8_17
Ito, K., and Mruphy, D. (2013). Application of ggplot2 to pharmacometric graphics. CPT Pharmacometrics Syst. Pharmacol. 2 (10), e79. doi:10.1038/psp.2013.56
Johnston, E. K., and Abbott, R. D. (2022). Adipose tissue development relies on coordinated extracellular matrix remodeling, angiogenesis, and adipogenesis. Biomedicines 10 (9), 2227. doi:10.3390/biomedicines10092227
Kanehisa, M., Goto, S., Sato, Y., Furumichi, M., and Tanabe, M. (2012). KEGG for integration and interpretation of large-scale molecular data sets. Nucleic Acids Res. 40, D109–D114. doi:10.1093/nar/gkr988
Kim, D., Paggi, J. M., Park, C., Bennett, C., and Salzberg, S. L. (2019). Graph-based genome alignment and genotyping with HISAT2 and HISAT-genotype. Nat. Biotechnol. 37 (8), 907–915. doi:10.1038/s41587-019-0201-4
Koch, A., Thiemann, M., Grabenbauer, M., Yoon, Y., McNiven, M. A., and Schrader, M. (2003). Dynamin-like protein 1 is involved in peroxisomal fission. J. Biol. Chem. 278 (10), 8597–8605. doi:10.1074/jbc.M211761200
Koyama, H., Maeno, T., Fukumoto, S., Shoji, T., Yamane, T., Yokoyama, H., et al. (2003). Platelet P-selectin expression is associated with atherosclerotic wall thickness in carotid artery in humans. Circulation 108 (5), 524–529. doi:10.1161/01.CIR.0000081765.88440.51
Langfelder, P., and Horvath, S. (2008). Wgcna: an R package for weighted correlation network analysis. BMC Bioinforma. 9, 559. doi:10.1186/1471-2105-9-559
Li, B., Yang, J. Z., He, J., Peng, X., Zeng, Q. H., Song, Y. K., et al. (2021). Characterization of the whole transcriptome of spleens from Chinese indigenous breed Ningxiang pig reveals diverse coding and non-coding RNAs for immunity regulation. Genomics 113 (4), 2468–2482. doi:10.1016/j.ygeno.2021.05.025
Li, T. T., Li, X. D., Meng, H. Y., Chen, L. L., and Meng, F. B. (2020a). ACSL1 affects triglyceride levels through the PPARγ pathway. Int. J. Med. Sci. 17 (6), 720–727. doi:10.7150/ijms.42248
Li, X., Yang, L., Mao, Z. M., Pan, X. Y., Zhao, Y. S., Gu, X., et al. (2020b). Novel role of dynamin-related-protein 1 in dynamics of ER-lipid droplets in adipose tissue. FASEB J. 34 (6), 8265–8282. doi:10.1096/fj.201903100RR
Liu, Y., Tingart, M., Lecouturier, S., Li, J. Z., and Eschweiler, J. (2021). Identification of co-expression network correlated with different periods of adipogenic and osteogenic differentiation of BMSCs by weighted gene co-expression network analysis (WGCNA). BMC Genomics 22 (1), 254. doi:10.1186/s12864-021-07584-4
Martin, M. (2011). Cutadapt removes adapter sequences from high-throughput sequencing reads. EMBnet 17 (1), 10–12. doi:10.14806/ej.17.1.200
McCulloch, L. J., Rawling, T. J., Sjöholm, K., Franck, N., Dankel, S. N., Price, E. J., et al. (2015). COL6A3 is regulated by leptin in human adipose tissue and reduced in obesity. Endocrinology 156 (1), 134–146. doi:10.1210/en.2014-1042
Meissburger, B., Perdikari, A., Moest, H., Müller, S., Geiger, M., and Wolfrum, C. (2016). Regulation of adipogenesis by paracrine factors from adipose stromal-vascular fraction-a link to fat depot-specific differences. Biochim. Biophys. A 1861 (9), 1121–1131. doi:10.1016/j.bbalip.2016.06.010
Mersmann, H. J., Underwood, M. C., Brown, L. J., and Houk, J. M. (1973). Adipose tissue composition and lipogenic capacity in developing swine. Am. J. Physiol. 224 (5), 1130–1135. doi:10.1152/ajplegacy.1973.224.5.1130
Miao, Z. G., Wang, S., Zhang, J. Z., Wei, P. P., Guo, L. P., Liu, D. Y., et al. (2018). Identification and comparison of long non-conding RNA in Jinhua and Landrace pigs. Biochem. Biophys. Res. Commun. 506 (3), 765–771. doi:10.1016/j.bbrc.2018.06.028
Minchin, J. E. N., Dahlman, I., Harvey, C. J., Mejhert, N., Singh, M. K., Epstein, J. A., et al. (2015). Plexin D1 determines body fat distribution by regulating the type V collagen microenvironment in visceral adipose tissue. Proc. Natl. Acad. Sci. U. S. A. 112 (14), 4363–4368. doi:10.1073/pnas.1416412112
Mooli, R. G. R., Mukhi, D., Chen, Z. H., Buckner, N., and Ramakrishnan, S. K. (2020). An indispensable role for dynamin-related protein 1 in beige and brown adipogenesis. J. Cell. Sci. 133 (18), jcs247593. doi:10.1242/jcs.247593
Pan, X. Y., Chen, X., Ren, Q. J., Yue, L., Niu, S., Li, Z. L., et al. (2022). Single-cell transcriptomics identifies Col1a1 and Col1a2 as hub genes in obesity-induced cardiac fibrosis. Biochem. Biophys. Res. Commun. 618, 30–37. doi:10.1016/j.bbrc.2022.06.018
Pasarica, M., Gowronska-Kozak, B., Burk, D., Remedios, I., Hymel, D., Gimble, J., et al. (2009). Adipose tissue collagen VI in obesity. J. Clin. Endocrinol. Metab. 94 (12), 5155–5162. doi:10.1210/jc.2009-0947
Pertea, M., Pertea, G. M., Antonescu, C. M., Chang, T. C., Mendell, J. T., and Salzberg, S. L. (2015). StringTie enables improved reconstruction of a transcriptome from RNA-seq reads. Nat. Biotechnol. 33 (3), 290–295. doi:10.1038/nbt.3122
Robinson, M. D., McCarthy, D. J., and Smyth, G. K. (2010). Edger: A bioconductor package for differential expression analysis of digital gene expression data. Bioinformatics 26 (1), 139–140. doi:10.1093/bioinformatics/btp616
Ruan, Y. B., Cheng, M., Ou, Y., Oko, R., and van der Hoorn, F. A. (2011). Ornithine decarboxylase antizyme oaz3 modulates protein phosphatase activity. J. Biol. Chem. 286 (33), 29417–29427. doi:10.1074/jbc.M111.274647
Ruehl, M., Erben, U., Schuppan, D., Wagner, C., Zeller, A., Freise, C., et al. (2005). The elongated first fibronectin type III domain of collagen XIV is an inducer of quiescence and differentiation in fibroblasts and preadipocytes. J. Biol. Chem. 280 (46), 38537–38543. doi:10.1074/jbc.M502210200
Ryanto, G. R. T., Yorifuji, K., Ikeda, K., and Emoto, N. (2020). Chondroitin sulfate mediates liver responses to injury induced by dual endothelin receptor inhibition. Can. J. Physiol. Pharmacol. 98 (9), 618–624. doi:10.1139/cjpp-2019-0649
Sarkar, S., Yadav, S., Mehta, P., Gupta, G., and Rajender, S. (2022). Histone methylation regulates gene expression in the round spermatids to set the RNA payloads of sperm. Reprod. Sci. 29 (3), 857–882. doi:10.1007/s43032-021-00837-3
Shan, B. S., Yan, M. T., Yang, K., Lin, W. M., Yan, J. Y., Wei, S. J., et al. (2022). MiR-218-5p affects subcutaneous adipogenesis by targeting ACSL1, a novel candidate for pig fat deposition. Genes. (Basel) 13 (2), 260. doi:10.3390/genes13020260
Shannon, P., Markiel, A., Ozier, O., Baliga, N. S., Wang, J. T., Ramage, D., et al. (2003). Cytoscape: A software environment for integrated models of biomolecular interaction networks. Genome Res. 13 (11), 2498–2504. doi:10.1101/gr.1239303
Sheng, H., Pan, C. L., Wang, S. Z., Yang, C. Y., Zhang, J. X., Hu, C. L., et al. (2022). Weighted gene co-expression network analysis identifies key modules and central genes associated with bovine subcutaneous adipose tissue. Front. Vet. Sci. 9, 914848. doi:10.3389/fvets.2022.914848
Southekal, S., Shakyawar, S. K., Bajpai, P., Elkholy, A., Manne, U., Mishra, N. K., et al. (2023). Molecular subtyping and survival analysis of osteosarcoma reveals prognostic biomarkers and key canonical pathways. Cancers (Basel) 15 (7), 2134. doi:10.3390/cancers15072134
Stachowiak, M., Szczerbal, I., and Switonski, M. (2016). Genetics of adiposity in large animal models for human obesity-studies on pigs and dogs. Prog. Mol. Biol. Transl. Sci. 140, 233–270. doi:10.1016/bs.pmbts.2016.01.001
Svärd, J., Røst, T. H., Sommervoll, C. E. N., Haugen, C., Gudbrandsen, O. A., Mellgren, A. E., et al. (2019). Absence of the proteoglycan decorin reduces glucose tolerance in overfed male mice. Sci. Rep. 9 (1), 4614. doi:10.1038/s41598-018-37501-x
Tamura, Y., Itoh, K., and Sesaki, H. (2011). SnapShot: mitochondrial dynamics. Cell. 145 (7), 1158, 1158.e1. doi:10.1016/j.cell.2011.06.018
Trapnell, C., Williams, B. A., Pertea, G., Mortazavi, A., Kwan, G., van Baren, M. J., et al. (2010). Transcript assembly and quantification by RNA-seq reveals unannotated transcripts and isoform switching during cell differentiation. Nat. Biotechnol. 28 (5), 511–515. doi:10.1038/nbt.1621
Ullah, M., Sittinger, M., and Ringe, J. (2013). Extracellular matrix of adipogenically differentiated mesenchymal stem cells reveals a network of collagen filaments, mostly interwoven by hexagonal structural units. Matrix Biol. 32 (7-8), 452–465. doi:10.1016/j.matbio.2013.07.001
Wang, D. H., Zhao, P., Lv, Y., Ming, J., Yang, E. P., Li, Y. M., et al. (2023). Proteomic-based platelet activation-associated protein SELP may be a novel biomarker for coagulation and prognostic in essential thrombocythemia. J. Clin. Med. 12 (3), 1078. doi:10.3390/jcm12031078
Wang, K., Zheng, Q., Liu, X., Geng, B. C., Dong, N. G., and Shi, J. W. (2022a). Identifying hub genes of calcific aortic valve disease and revealing the immune infiltration landscape based on multiple WGCNA and single-cell sequence analysis. Front. Immunol. 13, 1035285. doi:10.3389/fimmu.2022.1035285
Wang, W., Lu, S. B., Peng, L. Q., Zhang, Z. D., Zhang, Y. L., Guo, D. D., et al. (2022b). Integrated analysis of necroptosis-related genes for evaluating immune infiltration and colon cancer prognosis. Front. Immunol. 13, 1085038. doi:10.3389/fimmu.2022.1085038
Wang, Y. M., Fu, Y. W., Yan, Z. Q., Zhang, X. B., and Pei, M. (2019). Impact of fibronectin knockout on proliferation and differentiation of human infrapatellar fat pad-derived stem cells. Front. Bioeng. Biotechnol. 7, 321. doi:10.3389/fbioe.2019.00321
Wu, Q. B., Pan, Y. B., Su, Y. C., Zou, W. H., Xu, F., Sun, T. T., et al. (2022). WGCNA identifies a comprehensive and dynamic gene co-expression network that associates with smut resistance in sugarcane. Int. J. Mol. Sci. 23 (18), 10770. doi:10.3390/ijms231810770
Xiao, C., Chen, S. L., Yang, C. R., Liu, J. Y., and Yu, M. (2022). Identification of polyunsaturated fatty acids related key modules and genes in metabolic dysfunction-associated fatty liver disease using WGCNA analysis. Front. Genet. 13, 951224. doi:10.3389/fgene.2022.951224
Xu, R., Wu, Q. B. A., Gong, Y. H., Wu, Y. Z., Chi, Q. J., and Sun, D. (2022). A novel prognostic target-gene signature and nomogram based on an integrated bioinformatics analysis in hepatocellular carcinoma. Biocell 46 (5), 1261–1288. doi:10.32604/biocell.2022.018427
Yang, C. H., Li, Q., Lin, Y. Q., Wang, Y., Shi, H. B., Huang, L., et al. (2023). MCD inhibits lipid deposition in goat intramuscular preadipocytes. Genes. (Basel) 14 (2), 440. doi:10.3390/genes14020440
Yeini, E., and Satchi-Fainaro, R. (2022). The role of P-selectin in cancer-associated thrombosis and beyond. Thromb. Res. 213, S22–S28. doi:10.1016/j.thromres.2021.12.027
Yu, Y., Zhang, Y. H., Liu, L., Yu, L. L., Li, J. P., Rao, J. A., et al. (2022). Bioinformatics analysis of candidate genes and potential therapeutic drugs targeting adipose tissue in obesity. Adipocyte 11 (1), 1–10. doi:10.1080/21623945.2021.2013406
Zhang, F., Xiong, Q., Tao, H., Liu, Y., Zhang, N., Li, X. F., et al. (2021). ACOX1, regulated by C/EBPα and miR-25-3p, promotes bovine preadipocyte adipogenesis. J. Mol. Endocrinol. 66 (3), 195–205. doi:10.1530/JME-20-0250
Zhang, L. H., Liu, X., and Jia, H. (2022). WGCNA Analysis of important modules and hub genes of compound probiotics regulating lipid metabolism in heat-stressed broilers. Anim. (Basel) 12 (19), 2644. doi:10.3390/ani12192644
Keywords: Ningxiang pig, backfat tissue, different developmental stage, WGCNA, hub gene, lipid metabolism
Citation: Chen C, Ren H, Li H, Deng Y, Cui Q, Zhu J, Zhang S, Yu J, Wang H, Yu X, Yang S, Hu X and Peng Y (2023) Identification of crucial modules and genes associated with backfat tissue development by WGCNA in Ningxiang pigs. Front. Genet. 14:1234757. doi: 10.3389/fgene.2023.1234757
Received: 05 June 2023; Accepted: 07 August 2023;
Published: 17 August 2023.
Edited by:
Shi-Yi Chen, Sichuan Agricultural University, ChinaReviewed by:
Fuyi Xu, University of Tennessee Health Science Center (UTHSC), United StatesCopyright © 2023 Chen, Ren, Li, Deng, Cui, Zhu, Zhang, Yu, Wang, Yu, Yang, Hu and Peng. This is an open-access article distributed under the terms of the Creative Commons Attribution License (CC BY). The use, distribution or reproduction in other forums is permitted, provided the original author(s) and the copyright owner(s) are credited and that the original publication in this journal is cited, in accordance with accepted academic practice. No use, distribution or reproduction is permitted which does not comply with these terms.
*Correspondence: Yinglin Peng, eWxwZW5nXzE5NjVAMTYzLmNvbQ==
Disclaimer: All claims expressed in this article are solely those of the authors and do not necessarily represent those of their affiliated organizations, or those of the publisher, the editors and the reviewers. Any product that may be evaluated in this article or claim that may be made by its manufacturer is not guaranteed or endorsed by the publisher.
Research integrity at Frontiers
Learn more about the work of our research integrity team to safeguard the quality of each article we publish.