 Xinhua Liu
 Ling Gao1†
 Ju Wang
- 1Department of Biochemistry and Molecular Biology, School of Basic Medical Sciences, Hangzhou Normal University, Hangzhou, Zhejiang, China
- 2School of Biomedical Engineering and Technology, Tianjin Medical University, Tianjin, China
- 3Shanghai Center for Systems Biomedicine, Shanghai Jiao Tong University, Shanghai, China
Background: Phenotype similarity calculation should be used to help improve drug repurposing. In this study, based on the MeSH terms describing the phenotypes deposited in OMIM, we proposed a method, namely, PheSom (Phenotype Similarity On MeSH), to measure the similarity between phenotypes. PheSom counted the number of overlapping MeSH terms between two phenotypes and then took the weight of every MeSH term within each phenotype into account according to the term frequency-inverse document frequency (FIDC). Phenotype-related genes were used for the evaluation of our method.
Results: A 7,739 × 7,739 similarity score matrix was finally obtained and the number of phenotype pairs was dramatically decreased with the increase of similarity score. Besides, the overlapping rates of phenotype-related genes were remarkably increased with the increase of similarity score between phenotypes, which supports the reliability of our method.
Conclusion: We anticipate our method can be applied to identifying novel therapeutic methods for complex diseases.
Background
The rapid development of high-throughput technologies in the past decades, such as gene microarray, RNA Sequencing (RNA-Seq), and whole exome sequencing (WES), has revolutionized the evolution of biological studies. Those technologies allow the simultaneous measurement of expression values, as well as the sequence mutation and structural variation of thousands of genes, all of which greatly improve our understanding of the underlying mechanisms of complex diseases. Identification of mutated or differentially expressed genes is the beginning in the progress of the exploration of a disease in that most diseases are caused by the interplay of multiple biological processes (Menche et al., 2015). However, false positives or negatives of high-throughput experiments were one of their most common defects in the screening of valuable disease-associated information, so exploration of disease initiation and progression in other aspects is urgently needed.
Phenotypes are the observable characteristics of organisms arising from their response to stimuli in vivo or in vitro (Collier et al., 2015; Hoehndorf et al., 2015), and similar phenotypes might be induced by similar factors (van Driel et al., 2006; Kohler et al., 2008). In recent years, lots of effort has been paid toward the management of emerging scientific or clinical phenotypes in the literature. The Human Phenotype Ontology (HPO) (Kohler et al., 2014) is one of the most prevalent databases that applies standardized hierarchical terms for the description of human phenotypes through a directed acyclic graph. Based on the managed phenotypes, some algorithms were developed for their comparison and one of the approaches was to group phenotypes into clusters based on semantic similarity or other information (Groth et al., 2010; Westbury et al., 2015). In the study of Menche et al. (2015), based on the incomplete interactome of proteins, a mathematical method was proposed for the identification of disease modules and it was thought perturbations in one module could disrupt pathways of other disease modules. Groth et al. (2010) developed Phenoclustering, an online tool for the mining of cross-species phenotypes which could not only provide phenotypes clusters but phenotype descriptions, their similar Gene Ontology (GO) annotations, amino acid sequence similarity, and so on. Those methods may be of value for the study of diseases with less known or unknown pathophysiology.
Online Mendelian Inheritance in Man (OMIM) is a catalog of human phenotypes and their associated genes which is maintained by Johns Hopkins University (Amberger et al., 2011). A unique OMIM ID was assigned to every entry and different prefixes stand for different types of entries, such as "#" represents a descriptive entry, usually of a phenotype, "+" indicates the entry contains the description of a gene of known sequence and a phenotype. For phenotypes, OMIM provides us with their clinical symptoms, text description from literature which was curated by specialists, as well as their references, etc. This abundant information permits in-depth mining for the comparison between phenotypes and screening of association between phenotypes and genes. The HPO provides controlled terms for all of the phenotypic abnormalities in OMIM, which promotes the development of large-scale computational analysis and databases of the human phenome, e.g., DECIPHER (Firth et al., 2009) and ECARUCA (Vulto-van Silfhout et al., 2013), which are comprehensive databases of organized phenotype description and their potential associated chromosomal imbalance. Through applying normalized pointwise mutual information (NPMI) to co-occurrences of phenotypes and diseases in OMIM and Orphanet (Hoehndorf et al., 2013), Hoehndorf et al. (2015) developed a method for the calculation of similarity between diseases and constructed a human disease network, in which closely related diseases were clustered together. There are also some tools for the calculation of similarity between phenotypes based on semantic similarities, such as Phenomizer (Kohler et al., 2009), OWLSim (Washington et al., 2009), PhenoDigm (Smedley et al., 2013), etc., but most of them obtained the information from HPO, which might cause them to miss valuable resources in other databases. Phenomizer uses mainly the information from the directed acyclic graph of HPO, which first assigns information content (IC) to a term as the negative natural logarithm of its frequency, and then calculates the similarity between two terms as the IC of their most informative common ancestor. The similarity between two phenotypes is defined by Phenomizer as the average similarity between terms used to annotate them. OWLSim is primarily applied for cross-species phenotype comparison by using varieties of ontology-based annotation to record the affected phenotype and how it is affected. PhenoDigm is built on the top of the OWLSim algorithm, which is used for linking human diseases to model organisms for elucidating potential novel disease-gene associations, and adds zebrafish as a compared model organism in addition to mouse.
In this study, we extracted all of the phenotype entries from OMIM and retrieved their Medical Subject Headings (MeSH, a comprehensive universal controlled vocabulary for the purpose of indexing journal articles and books in the life sciences) terms within those entries. Based on those MeSH terms, PheSom (Phenotype Similarity On MeSH), a method to calculate the similarity between phenotypes, was developed. Through our method, a similarity score was assigned to phenotype-phenotype pairs and a higher score indicated higher similarity. This study would be helpful for the identification of novel candidate genes of phenotypes of interest.
Methods
Phenotype entries and their MeSH terms in OMIM
The entire OMIM database (http://www.ncbi.nlm.nih.gov/omim/) was downloaded, which consisted of 24,010 entries including 7,739 phenotype items. MeSH (Medical Subject Heading) terms were downloaded from the National Center for Biotechnology Information (http://www.ncbi.nlm.nih.gov/mesh/meshhome.html), and in total, 56,341 terms were obtained. Similar to HPO, MeSH terms also have a hierarchical structure with general information represented by the terms at the top level while terms at the lower level represent more detailed information. To exemplify, in Table 1, “Breast” holds more detailed information than “Body Regions”, but less detailed information than “Mammary Glands”, which indicated their different information content (IC) in describing a phenotype.
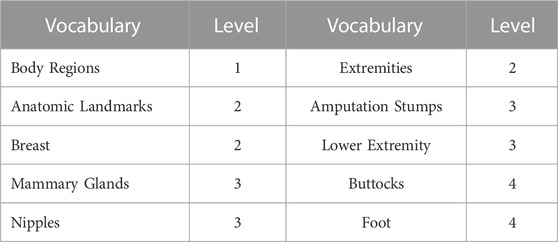
TABLE 1. Example of MeSH vocabularies’ level.
Measuring phenotype similarity based on common MeSH terms
For each phenotype, the MeSH terms included in its OMIM entry were fetched. Briefly, MeSH terms were one-by-one searched from the text description of every OMIM entry, and the term that occurs in an entry along with those terms contained in its upper level in the MeSH hierarchical structure was assigned to the entry. The number of overlapping MeSH terms between every two phenotypes can be counted to initially measure the similarity between two phenotypes, which is referred to as VOR (vocabulary overlapping rate-based) method hereafter. Generally, two phenotypes would be more similar if they were annotated by more common terms.
Measuring phenotype similarity based on weighted common MeSH terms
Commonly, a MeSH term occurs a different number of times (“hits”) in different phenotype entries, so it would contribute differently to those phenotypes according to the Term Frequency (TF) theory, which was first proposed by Luhn in 1957 based on the assumption that the weight of a term occurs in a document is simply proportional to the term frequency (Luhn, 1957). So, the weight of a MeSH term in a specific phenotype item could be preliminarily obtained as follows:
In Eq. (1), freqtj is the hits of a MeSH term tj in a specific OMIM phenotype item.
While, by using the TF method alone, some common MeSH terms might be incorrectly assigned a high weight in phenotypes, such as the terms “mutation” and “patients”, and meanwhile the importance of some meaningful but low-frequency MeSH terms, such as “osteocytes” and “oogonia”, are largely overlooked. Given that point, the Inverse Document Frequency (IDF) theory, which was developed by Karen Spärck Jones based on the idea of the specificity of a term can be quantified as an inverse function of the number of documents in which it occurs (Jones, 1972), was therefore applied to overcome excessively large or small weight in TF. The weight of a MeSH term in the scenario of the total OMIM phenotype document according to IDF was calculated by the following equation:
In Eq (2), L was set to 0.01 to avoid error in the condition of DFj just is 0, N was the total number of OMIM phenotype entries, and here was 7,739, DFj was the number of OMIM phenotype items which contained tj, i.e., Document Frequency.
By combining TF and IDF, i.e., TF-IDF, a numerical statistic that is used to reflect how important a word is to a document in a corpus, the weight of a MeSH term in a specific OMIM phenotype item in this study could be obtained via Eq (3):
In Eq. (3), Wi,j was the weight of MeSH term tj in OMIM phenotype item di, and n was the number of MeSH terms in di.
According to Eq (3), a weight matrix could be obtained as follows:
In Eq. (4), Wij was the weight of MeSH term tj in OMIM phenotype item di, m was the total number of OMIM phenotype records, n was the number of MeSH terms contained in all of the OMIM phenotype items.
In this study, cosine similarity (CS), a measurement of similarity between two vectors of an inner product space that measures the cosine of the angle between them, was used for the calculation of the similarity score between every two OMIM phenotype items. The similarity score between phenotype di = (Wi1, Wi2, … … , Win) and dj = (Wj1, Wj2, … … , Wjn) could be calculated as follows:
In Eq (5),
Evaluation of the phenotype similarity calculation method
Similar phenotypes tend to be caused by functionally related genes or neighbors of disease genes in a network (Wu et al., 2015; Xuan et al., 2015). Here, the number of overlapping genes between the phenotype-associated genes retrieved from every OMIM phenotype item was used for the evaluation of the VOR and VW methods.
In Eq (6),
As a point of comparison, a random process was performed, in detail.
(i). Genes contained in all of the 7,739 OMIM phenotype items were fetched which obtained a total of 6,181 genes that were referred to as OMIMGene;
(ii). The number of genes contained in phenotype di and dj (i,j = 1, 2, 3, … , m) was counted, and the same number of random genes from OMIMGene as their real associated gene number was used as the random genes of di and dj;
(iii). The overlapping rate of random genes of di and dj was calculated through Eq (6);
(iv). Steps (i)–(iii) were repeated 100 times and the average overlapping rate between any two phenotype items was calculated.
Overlapping rates of both phenotype-associated and random genes were calculated between each phenotype item pair. Wilcoxon’s Sign Rank Test was used for the comparison between the distribution of the two types of overlapping rates.
For the comprehensive understanding of our method, we provided a flow chart in Figure 1.
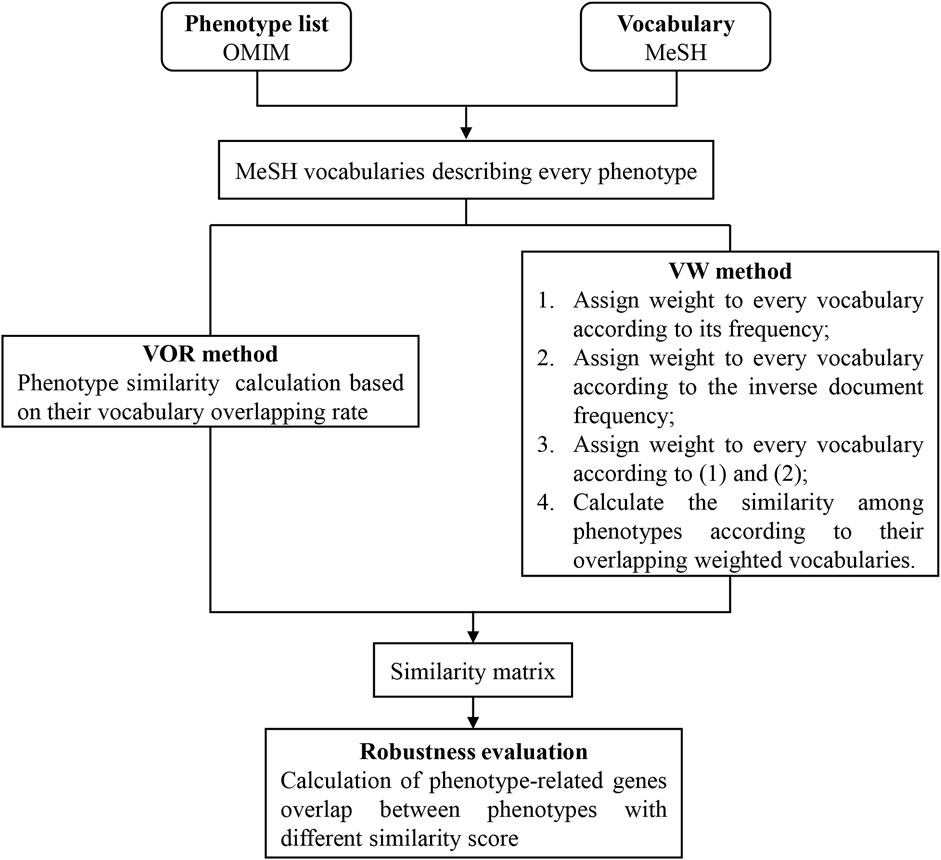
FIGURE 1. Flow chart of this study.
Results
Similarity score distribution
A 7,739 × 7,739 similarity score matrix was obtained via the VOR and VW method in this study, and the lowest and highest score were 0 and 1, respectively. To exemplify, two 8 × 8 similarity score matrices extracted from the full matrix for the VOR and VW methods are provided in Table 2 and Table 3, respectively. Furthermore, the distribution of similarity scores across all of the 7,739 phenotype pairs was calculated based on the bin of 0.1 as shown in Figure 2. Most of the phenotype pairs had relatively low similarity scores, and only a few phenotype pairs could reach a similarity score above 0.9 through both VOR and VW methods.
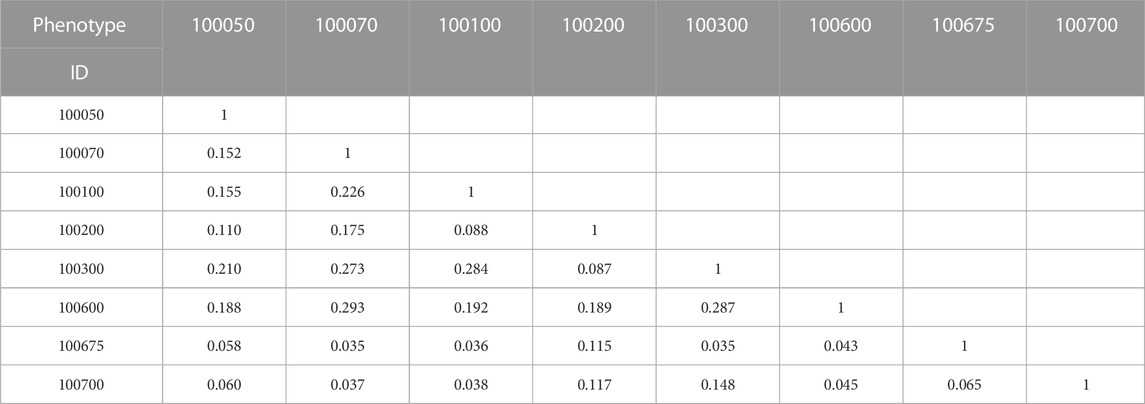
TABLE 2. An 8 × 8 table from the similarity matrix obtained via VOR method.

TABLE 3. An 8 × 8 table from the similarity matrix obtained via VW based method.
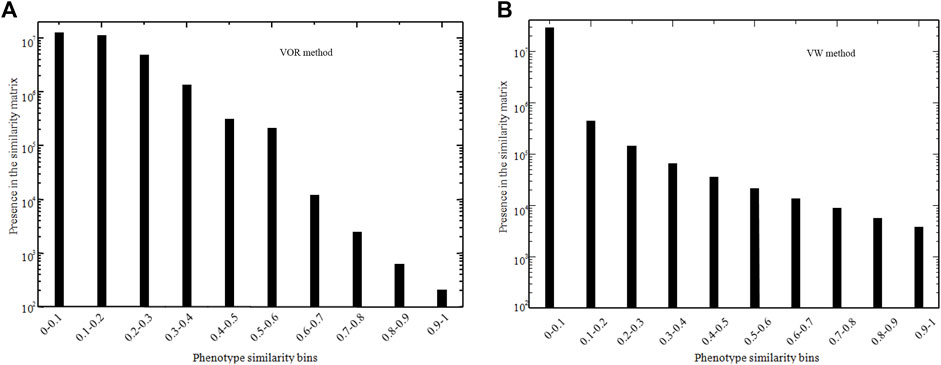
FIGURE 2. Number of phenotype pairs within different similarity score bins in VOR (A) and VW (B) methods.
Evaluation of VOR and VW methods
The associated genes of every phenotype were fetched from the corresponding phenotype item, and the gene overlapping rate between any two phenotype items was obtained via Eq (6). The overlapping rates within different similarity score bins in VOR and VW methods were shown in Figure 3 from which we observe that the overlapping rates were gradually increased with the increase of similarity score.
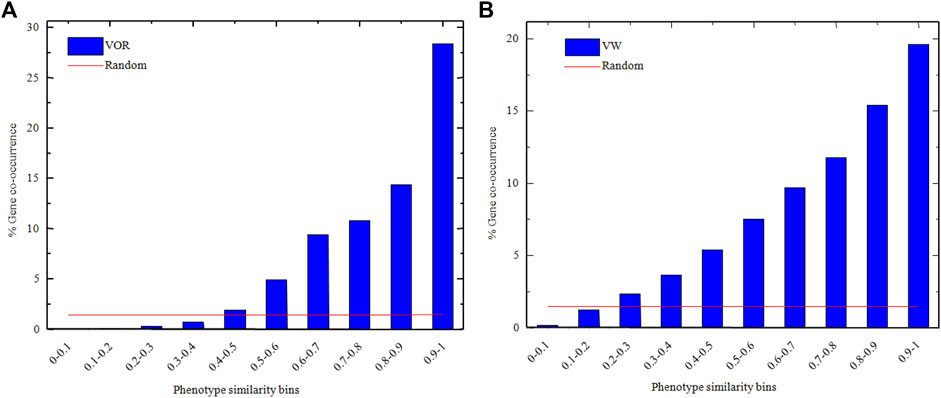
FIGURE 3. The overlapping rates of phenotypes-related genes within different similarity score bins in VOR (A) and VM (B) methods. Blue histograms and red lines represented VOR/VW methods and random gene assignment processes, respectively.
The average overlapping rates of the 100 random gene assignment processes within different similarity score bins (red line in Figure 3) were also obtained, and there was no significant difference in overlapping rates across the similarity score bins. Besides, the p-value of Wilcoxon’s Sign Rank Test (Wilcoxon, 1946) between the overlapping rates obtained through the random gene assignment process and the VOR method, as well as the random gene assignment process and the VW method were all less than 0.05, which indicated that the overlapping rates were significantly different between our methods and the random gene assignment process.
Comparisons between our own phenotype comparison methods and three others
We used breast cancer as a specific example to compare the performance of our methods and three other common phenotype comparison methods, i.e., Phenosim, Jiang and Conrath (1997) and Resnik (1995). Similarity scores between breast cancer and the remaining phenotypes were calculated by the VW method, and a total of 658 phenotypes had similarity scores greater than 0. Similarity scores between breast cancer and each of those 658 phenotypes were then calculated by VOR, Phenosim, Jiang and Conrath (1997) and Resnik (1995). Jiang and Conrath (1997) and Resnik (1995) mainly used the combination of information content and lexical taxonomy to evaluate semantic similarity. Phenosim was primarily designed for simulating phenotypes, by which phenotypic similarity could also be obtained based on the genetic and epidemiology information. As a result, the distribution of similarity scores between breast cancer and other phenotypes calculated by all five methods were comparable except for Jiang and Conrath (1997), which obtained relatively higher similarity scores than the other four methods as shown in Figure 4A. Besides, there were 86 (Figure 4B; Supplementary Table S1) and 4 phenotypes (Figure 4C; Table 4) that had similarity scores greater than 0 and 0.2 in the results of all five methods, respectively. Those data indicate that our methods have reliable performance in calculating phenotype similarity and should be complementary with other methods.
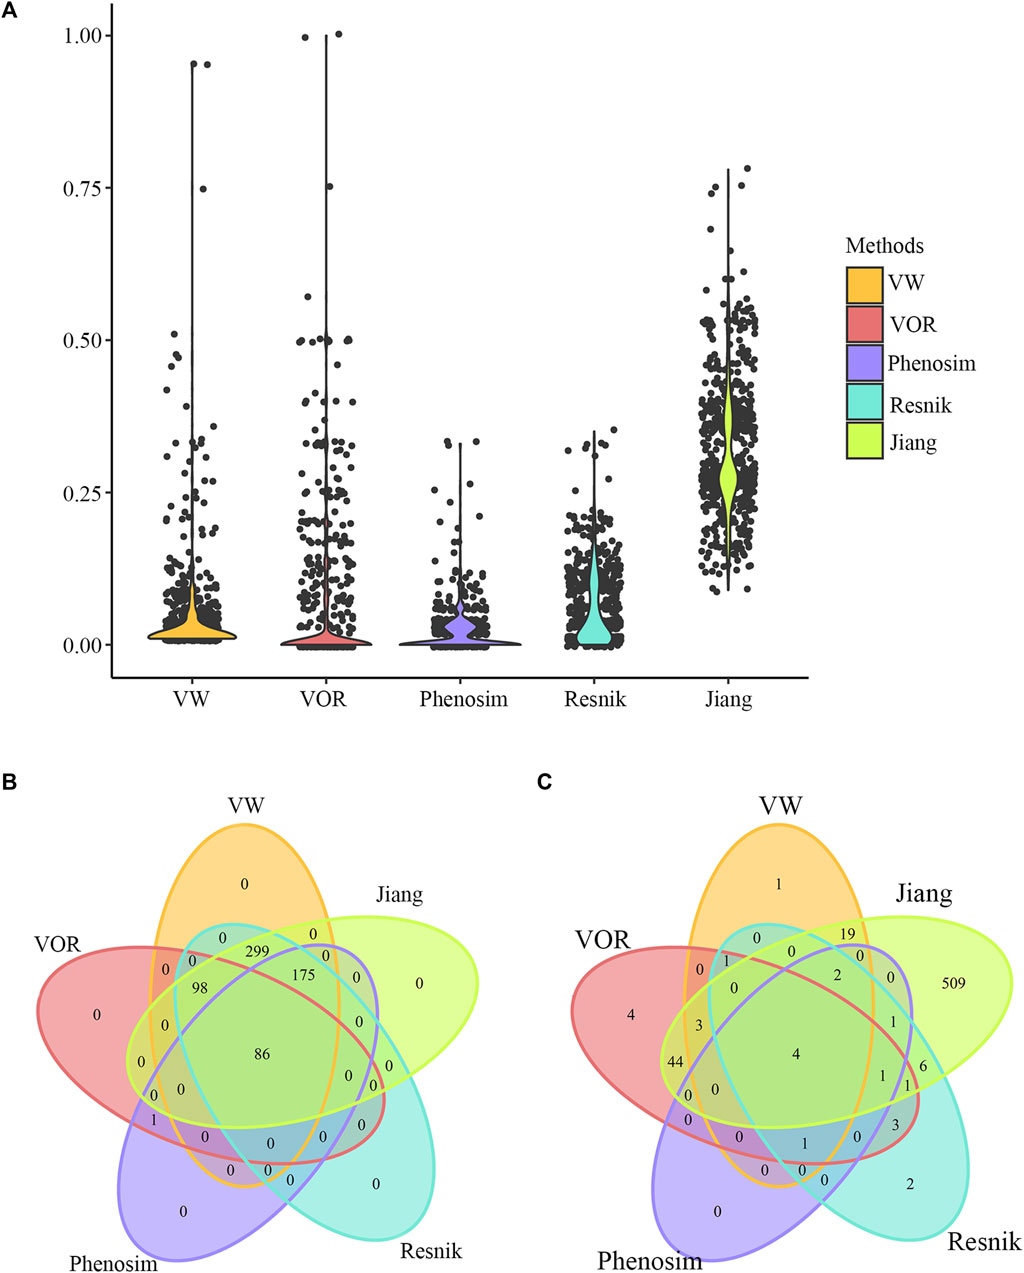
FIGURE 4. Phenotype comparison results of breast cancer. (A) Distribution of similarity scores calculated by VW, VOR, Phenosim, Renisk, et al., and Jiang and Conrath (1997), between breast cancer and the 658 phenotypes that had similarity scores greater than 0 obtained through the VW method. (B) Venn diagram depicting overlaps of phenotypes that had similarity scores with breast cancer greater than 0 in all the five methods. (C) Venn diagram depicting overlaps of phenotypes that had similarity scores with breast cancer greater than 0.2 in all the five methods.
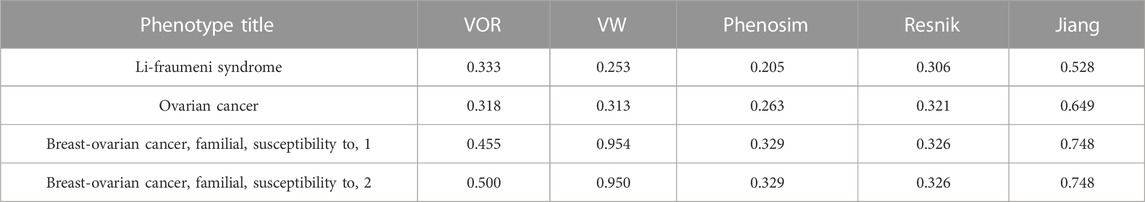
TABLE 4. The 4 overlapping phenotypes that had similarity score with breast cancer greater than 0.2 in all the five methods.
Phenotypes similar to nicotine addiction
Nicotine addiction is one of the most common substance-abuse diseases whose development is associated with many genes and pathways (De Palma et al., 2010; Quik et al., 2011; Durazzo et al., 2015). In our previous study, 220 genes were identified as the optimal nicotine addiction-related genes through a multi-source-based approach (Liu X. et al., 2015). Besides, biochemical pathways related to neurodevelopment, the immune system, and metabolism were found to be enriched in those 220 genes in another study of ours (Liu et al., 2015b). Here, based on VOR and VW methods, some phenotypes similar to nicotine addiction were obtained and the top 5 phenotypes according to the similarity score were provided in Table 5, all of which were closely associated with substance abuse and immune deficiency or tobacco-use related lung cancer. Additionally, a total of 27 nicotine addiction-related genes (Supplementary Table S2) were fetched from its OMIM phenotype item, and 19 out of which were found to be overlapped with the 220 prioritized genes in our previous study (Liu et al., 2015b). A total of 29 and 15 phenotype-related genes were fetched for the top 5 phenotypes obtained through VOR and VW methods, and there were 11 and 9 overlapping genes between the 29 and 15 phenotype-related genes and the 220 previously prioritized genes (Liu et al., 2015b), respectively. The remaining genes of those similar phenotypes might provide novel candidate genes for nicotine addiction.
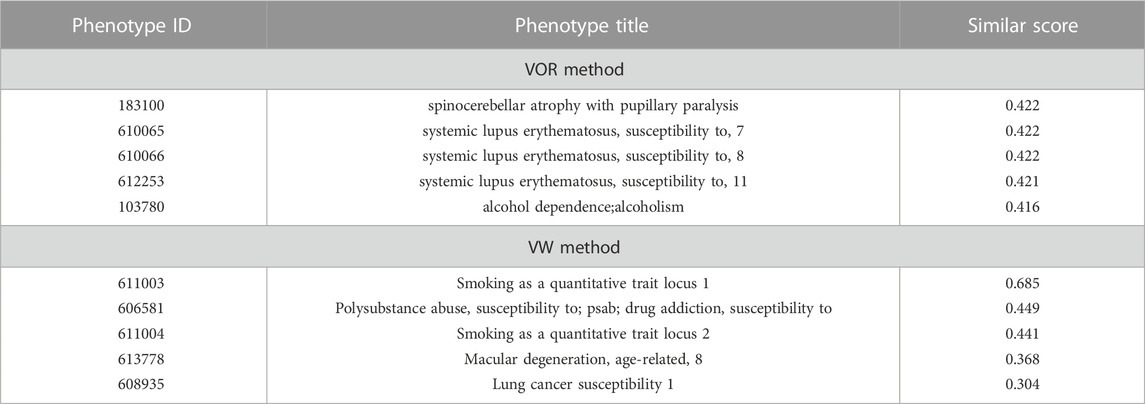
TABLE 5. The top 5 similar phenotypes of nicotine addiction obtained by VOR and VM methods.
Discussion
In the post-genomic era, screening of candidate genes becomes a more and more prevalent method for the study of complex genetic diseases (Botstein and Risch, 2003; McCarthy et al., 2003; Oti and Brunner, 2007) and it is important for the improvement of medical care (Luo and Liang, 2015). Lots of methods have been proposed for this purpose, including Genome-wide association studies (GWAS) (Lewis et al., 2011; Martelle et al., 2016; Smith et al., 2016), whole exome sequencing (Friedman et al., 2014; Butler et al., 2015; Chapman et al., 2015; Bruse et al., 2016), as well as network-based methods (Yao et al., 2011; Luo and Liang, 2015), etc. Some disease-gene/protein, as well as gene-protein relationships, were uncovered, while little effort has been applied to the relationships at the phenotype level, which would be of benefit for the biological interpretation of complex diseases with similar phenotypes that might be caused by functionally related genes. Here, we developed a novel method that could robustly estimate the similarity among phenotypes deposited in the OMIM database. This study finally obtained a matrix containing pairwise similarities among 7,739 phenotypes and there are more overlaps between phenotype-related genes among phenotypes that exhibit higher similarity than those exhibit lower similarity.
Most of the human Mendelian syndromes have been deposited in the OMIM database and described in detail, while the lack of a controlled term to consistently annotate them has limited the development of computational tools at the phenotype level in the past. For this purpose, HPO was developed for the improvement of annotation of phenotypes in OMIM with controlled terms in the form of a directed acyclic graph, which could also be used to calculate phenotypic similarities between diseases (Robinson et al., 2008). Some methods or tools have been proposed for the measurement of phenotypic similarity of diseases based on HPO. Through semantic similarity metrics and taking the interrelationships between terms in HPO into account, Kohler et al. (2009) developed a web-based application for the human Mendelian disorders, from which a similarity score and p-value could be obtained for the rank of similar diseases. Deng et al. (2015) even developed an HPO-based R package, HPOSim, for the calculation of phenotypic similarity through seven commonly used semantic similarity measures: Resnik measure (Resnik, 1995), Lin measure (Lin, 1998), Jiang-Conrath measure (Jiang and Conrath, 1997), relevance measure (Schlicker et al., 2006), information coefficient measure (Li et al., 2010), graph IC measure (Pesquita et al., 2007) and Wang measure (Wang et al., 2007). Besides, hypergeometric enrichment analysis and network ontology analysis could also be conducted via HPOSim While, few studies employed the MeSH terms on the calculation of phenotype similarity, which is a valuable medical controlled vocabulary similar to HPO.
In this study, the PheSom (VOR and VW) method was developed for the comparison of phenotypes in OMIM, and two 7,739 × 7,739 similarity score matrices were obtained. The overlapping rates of phenotypes-related genes in different similarity score bins indicated our method is reliable in identifying similar phenotypes which would be helpful in the collection of novel candidate genes for complex diseases. Sarkar IN (Sarkar, 2012) proposed a vector space model-based method, which implicates two vectors including gene vector, i.e., genes that are associated with queried genes that are directly related to a disease retrieved through BLAST+ from GeneBank, and a disease vector that is the quantification of relative relationships between candidate diseases and the related genes, to identify genetically related diseases. Resemblances indeed exist between Sarkar’s and this study, such as vector-based representation for phenotype and cosine similarity for quantification of the relationship between phenotypes. However, differences in the materials used in the two studies, i.e., genetic information for diseases in Sarkar’s study and MeSH term annotation for diseases in this study, differentiate the two studies and suggest they may complement each other.
The number of phenotype pairs decreased with the increase of similarity score in both of the two methods and there were only 0.501% and 1.048% out of all phenotype pairs with a similarity score >0.6 in VOR and VW methods, respectively. Our results were consistent with the study of Driel et al., which compared the similarity between phenotypes in OMIM based on the text mining analysis of MeSH terms inside the phenotypes records (van Driel et al., 2006). This might indicate the low similarity between most of the phenotypes. While, we should pay attention to some conditions which would influence the calculation of the similarity score, such as if tj, a MeSH term, is important for the description of di, an OMIM phenotype item, but the hits of tj are low in di, its weight in di would be lower than expected according to Eq. (2), and the similarity score might become lower between di and the other phenotypes contained more tj. Xue et al. also presented a study for estimating phenotype similarity based on HPO terms by incorporating not only HPO structure but terms’ definition. Several similarities exist between Xue’s and our study, e.g., TF-IDF method, and cosine similarity, while phenotype annotations used in our study are standardized MeSH terms fetched from every OMIM entry, which were manually reviewed and should be reliable and comprehensive.
For nicotine addiction, the two methods obtained some phenotypes with high similarity scores. Table 5 indicated that the similar phenotypes obtained through VOR and VW were mainly involved in immune- and substance-abuse-related processes respectively. Nicotine addiction is a substance-abuse disease that could also reduce the immune response (Schumacher, 2013; Alving et al., 2014; Liu et al., 2015b; Mishra et al., 2015) and pose similar mechanisms to the addiction to other substances, such as drugs (Motlagh et al., 2016; van Wel et al., 2016). Besides, compared with the prioritized genes of nicotine addiction obtained in our previous study, many overlapping genes were identified and the overlap rates were 38% and 60% in VOR and VW methods respectively, which indicated the reliability of our two methods and VW might outperform than VOR. Some discrepancies also existed between nicotine addiction-related genes that were prioritized in our previous study and genes that were contained in the top 5 most similar phenotype entries. An example is FAAH, which is recorded as a related gene for the second most similar phenotype, i.e., “POLYSUBSTANCE ABUSE, SUSCEPTIBILITY TO; PSAB”, for nicotine addiction by VW method, was not prioritized by our previous method. However, the association between FAAH and nicotine addiction is supported by some other studies (Simonnet et al., 2017; Pavon et al., 2018). STAT4 represents another gene that is included in the top five most similar phenotype items but was not identified by our previous study. STAT4 is a transcriptional factor encoding gene that is phenotypically associated with immune-related diseases, such as systemic lupus erythematosus and rheumatoid arthritis (Salmaninejad et al., 2017; Ebrahimiyan et al., 2019). Nicotine addiction has been previously reported to be immune dysregulation-related (Wang et al., 2011; Liu et al., 2015c), so STAT4 might serve as a potential candidate for nicotine addiction.
This study provides the most comprehensive OMIM-based comparisons among different phenotypes so far. Our method directly quantifies the similarity among phenotypes, which would be helpful for the drug repurposing in the scenario of the existence of well-known drugs for one phenotype but the candidate drug is lacking in highly similar phenotypes. Besides, this study should also be helpful for identifying novel candidate genes for some diseases in similar phenotypes that might share causal genes. Limitations of this study do exist, such as the similarity matrix should be manually updated with the constant expansion of vocabulary describing the physiological or pathological states. Additionally, it would be better to add the laboratory-based validation for the novel related genes of specific diseases identified through our method.
Conclusion
In conclusion, we developed two methods for the calculation of similarity scores between phenotypes in OMIM through the semantic similarity of MeSH terms. The overlapping rates of phenotype-related genes in different similarity score bins indicate the reliability of our methods and suggest they would be helpful for the identification of novel candidate genes of complex genetic diseases.
Data availability statement
Publicly available datasets were analyzed in this study. This data can be found here: https://www.omim.org/.
Author contributions
JW and XL designed the study. XL, YP, and ZF performed data analysis. XL and JW wrote the manuscript. All authors contributed to the article and approved the submitted version.
Funding
This study was supported in part by grants from the National Natural Science Foundation of China (No. 82203471). The funding bodies played no role in the design of the study and collection, analysis, and interpretation of data, or in the writing of the manuscript.
Acknowledgments
I would like to thank Xianfu Yi of Tianjin Medical University for his help in the data arrangement of this study.
Conflict of interest
The authors declare that the research was conducted in the absence of any commercial or financial relationships that could be construed as a potential conflict of interest.
Publisher’s note
All claims expressed in this article are solely those of the authors and do not necessarily represent those of their affiliated organizations, or those of the publisher, the editors and the reviewers. Any product that may be evaluated in this article, or claim that may be made by its manufacturer, is not guaranteed or endorsed by the publisher.
Supplementary material
The Supplementary Material for this article can be found online at: https://www.frontiersin.org/articles/10.3389/fgene.2023.1185790/full#supplementary-material
Abbreviations
RNA-Seq, RNA Sequencing; WES, whole exome sequencing; HPO, Human Phenotype Ontologies; GO, Gene Ontology; OMIM, Online Mendelian Inheritance in Man; MeSH, Medical Subject Headings; PheSom, Phenotype Similarity On MeSH; NPMI, normalized pointwise mutual information; IC, information content; TF, Term Frequency; IDF, Inverse Document Frequency; CS, cosine similarity; VOR, vocabulary overlapping rate-based; VW, vocabulary weighted; GWAS, Genome-wide association study.
References
Alving, C. R., Matyas, G. R., Torres, O., Jalah, R., and Beck, Z. (2014). Adjuvants for vaccines to drugs of abuse and addiction. Vaccine 32 (42), 5382–5389. doi:10.1016/j.vaccine.2014.07.085
Amberger, J., Bocchini, C., and Hamosh, A. (2011). A new face and new challenges for Online Mendelian Inheritance in Man (OMIM®). Hum. Mutat. 32 (5), 564–567. doi:10.1002/humu.21466
Botstein, D., and Risch, N. (2003). Discovering genotypes underlying human phenotypes: Past successes for mendelian disease, future approaches for complex disease. Nat. Genet. 33, 228–237. doi:10.1038/ng1090
Bruse, S., Moreau, M., Bromberg, Y., Jang, J. H., Wang, N., Ha, H., et al. (2016). Whole exome sequencing identifies novel candidate genes that modify chronic obstructive pulmonary disease susceptibility. Hum. Genomics 10 (1), 1. doi:10.1186/s40246-015-0058-7
Butler, M. G., Rafi, S. K., Hossain, W., Stephan, D. A., and Manzardo, A. M. (2015). Whole exome sequencing in females with autism implicates novel and candidate genes. Int. J. Mol. Sci. 16 (1), 1312–1335. doi:10.3390/ijms16011312
Chapman, N. H., Nato, A. Q., Bernier, R., Ankenman, K., Sohi, H., Munson, J., et al. (2015). Whole exome sequencing in extended families with autism spectrum disorder implicates four candidate genes. Hum. Genet. 134 (10), 1055–1068. doi:10.1007/s00439-015-1585-y
Collier, N., Groza, T., Smedley, D., Robinson, P. N., Oellrich, A., and Rebholz-Schuhmann, D. (2015). PhenoMiner: From text to a database of phenotypes associated with OMIM diseases. Database (Oxford) 2015, bav104. doi:10.1093/database/bav104
De Palma, G., Dick, F. D., Calzetti, S., Scott, N. W., Prescott, G. J., Osborne, A., et al. (2010). A case-control study of Parkinson's disease and tobacco use: Gene-tobacco interactions. Mov. Disord. 25 (7), 912–919. doi:10.1002/mds.22980
Deng, Y., Gao, L., Wang, B., and Guo, X. (2015). HPOSim: an R package for phenotypic similarity measure and enrichment analysis based on the human phenotype ontology. PLoS One 10 (2), e0115692. doi:10.1371/journal.pone.0115692
Durazzo, T. C., Meyerhoff, D. J., and Murray, D. E. (2015). Comparison of regional brain perfusion levels in chronically smoking and non-smoking adults. Int. J. Environ. Res. Public Health 12 (7), 8198–8213. doi:10.3390/ijerph120708198
Ebrahimiyan, H., Mostafaei, S., Aslani, S., Jamshidi, A., and Mahmoudi, M. (2019). Studying the association between STAT4 gene polymorphism and susceptibility to rheumatoid arthritis disease: An updated meta-analysis. Iran. J. Immunol. 16 (1), 71–83. doi:10.22034/IJI.2019.39408
Firth, H. V., Richards, S. M., Bevan, A. P., Clayton, S., Corpas, M., Rajan, D., et al. (2009). Decipher: Database of chromosomal imbalance and phenotype in humans using ensembl resources. Am. J. Hum. Genet. 84 (4), 524–533. doi:10.1016/j.ajhg.2009.03.010
Friedman, E., Moran, D. S., Ben-Avraham, D., Yanovich, R., and Atzmon, G. (2014). Novel candidate genes putatively involved in stress fracture predisposition detected by whole-exome sequencing. Genet. Res. (Camb) 96, e004. doi:10.1017/S001667231400007X
Groth, P., Kalev, I., Kirov, I., Traikov, B., Leser, U., and Weiss, B. (2010). Phenoclustering: Online mining of cross-species phenotypes. Bioinformatics 26 (15), 1924–1925. doi:10.1093/bioinformatics/btq311
Hoehndorf, R., Schofield, P. N., and Gkoutos, G. V. (2013). An integrative, translational approach to understanding rare and orphan genetically based diseases. Interface Focus 3 (2), 20120055. doi:10.1098/rsfs.2012.0055
Hoehndorf, R., Schofield, P. N., and Gkoutos, G. V. (2015). Analysis of the human diseasome using phenotype similarity between common, genetic, and infectious diseases. Sci. Rep. 5, 10888. doi:10.1038/srep10888
Jiang, J. J., and Conrath, D. W. (1997). Semantic similarity based on corpus statistics and lexical taxonomy. arXiv e-prints. doi:10.48550/arXiv.cmp-lg/9709008
Jones, K. S. (1972). A statistical interpretation of term specificity and its application in retrieval. J. documentation 28 (1), 11–21. doi:10.1108/eb026526
Kohler, S., Bauer, S., Horn, D., and Robinson, P. N. (2008). Walking the interactome for prioritization of candidate disease genes. Am. J. Hum. Genet. 82 (4), 949–958. doi:10.1016/j.ajhg.2008.02.013
Kohler, S., Schulz, M. H., Krawitz, P., Bauer, S., Dölken, S., Ott, C. E., et al. (2009). Clinical diagnostics in human genetics with semantic similarity searches in ontologies. Am. J. Hum. Genet. 85 (4), 457–464. doi:10.1016/j.ajhg.2009.09.003
Kohler, S., Doelken, S. C., Mungall, C. J., Bauer, S., Firth, H. V., Bailleul-Forestier, I., et al. (2014). The human phenotype ontology project: Linking molecular biology and disease through phenotype data. Nucleic Acids Res. 42, D966–D974. Database issue. doi:10.1093/nar/gkt1026
Lewis, S. N., Nsoesie, E., Weeks, C., Qiao, D., and Zhang, L. (2011). Prediction of disease and phenotype associations from genome-wide association studies. PLoS One 6 (11), e27175. doi:10.1371/journal.pone.0027175
Li, B., Wang, J. Z., and Feltus, F. A. (2010). Effectively integrating information content and structural relationship to improve the GO-based similarity measure between proteins. arXiv preprint arXiv:1001.0958.
Liu, X., Liu, M., Li, X., Zhang, L., Fan, R., and Wang, J. (2015a). Prioritizing genes related to nicotine addiction via a multi-source-based approach. Mol. Neurobiol. 52 (1), 442–455. doi:10.1007/s12035-014-8874-7
Liu, M., Fan, R., Liu, X., Cheng, F., and Wang, J. (2015b). Pathways and networks-based analysis of candidate genes associated with nicotine addiction. PLoS One 10 (5), e0127438. doi:10.1371/journal.pone.0127438
Luhn, P. H. (1957). A statistical approach to mechanized encoding and searching of literary information. IBM J. Res. Dev. 1 (4), 309–317. doi:10.1147/rd.14.0309
Luo, J., and Liang, S. (2015). Prioritization of potential candidate disease genes by topological similarity of protein-protein interaction network and phenotype data. J. Biomed. Inf. 53, 229–236. doi:10.1016/j.jbi.2014.11.004
Martelle, S. E., Raffield, L. M., Palmer, N. D., Cox, A. J., Freedman, B. I., Hugenschmidt, C. E., et al. (2016). Dopamine pathway gene variants may modulate cognitive performance in the DHS - mind Study. Brain Behav. 6, e00446. doi:10.1002/brb3.446
McCarthy, M. I., Smedley, D., and Hide, W. (2003). New methods for finding disease-susceptibility genes: Impact and potential. Genome Biol. 4 (10), 119. doi:10.1186/gb-2003-4-10-119
Menche, J., Sharma, A., Kitsak, M., Ghiassian, S. D., Vidal, M., Loscalzo, J., et al. (2015). Disease networks. Uncovering disease-disease relationships through the incomplete interactome. Science 347 (6224), 1257601. doi:10.1126/science.1257601
Mishra, A., Chaturvedi, P., Datta, S., Sinukumar, S., Joshi, P., and Garg, A. (2015). Harmful effects of nicotine. Indian J. Med. Paediatr. Oncol. 36, 24–31. doi:10.4103/0971-5851.151771
Motlagh, F. E., Ibrahim, F., Rashid, R. A., Seghatoleslam, T., and Habil, H. (2016). Acupuncture therapy for drug addiction. Chin. Med. 11, 16. doi:10.1186/s13020-016-0088-7
Oti, M., and Brunner, H. G. (2007). The modular nature of genetic diseases. Clin. Genet. 71 (1), 1–11. doi:10.1111/j.1399-0004.2006.00708.x
Pavon, F. J., Serrano, A., Sidhpura, N., Polis, I., Stouffer, D., de Fonseca, F. R., et al. (2018). Fatty acid amide hydrolase (FAAH) inactivation confers enhanced sensitivity to nicotine-induced dopamine release in the mouse nucleus accumbens. Addict. Biol. 23 (2), 723–734. doi:10.1111/adb.12531
Pesquita, C., Faria, D., and Bastos, H. P. (2007). Evaluating GO-based semantic similarity measures. Proc. 10th Annu. Bio-Ontologies Meet. 37 (40), 38.
Quik, M., Perez, X. A., and Grady, S. R. (2011). Role of α6 nicotinic receptors in CNS dopaminergic function: Relevance to addiction and neurological disorders. Biochem. Pharmacol. 82 (8), 873–882. doi:10.1016/j.bcp.2011.06.001
Resnik, P. (1995). Using information content to evaluate semantic similarity in a taxonomy. arXiv preprint. arXiv:cmp-lg/9511007.
Robinson, P. N., Köhler, S., Bauer, S., Seelow, D., Horn, D., and Mundlos, S. (2008). The human phenotype ontology: A tool for annotating and analyzing human hereditary disease. Am. J. Hum. Genet. 83 (5), 610–615. doi:10.1016/j.ajhg.2008.09.017
Salmaninejad, A., Mahmoudi, M., Aslani, S., Poursani, S., Ziaee, V., and Rezaei, N. (2017). Association of STAT4 gene single nucleotide polymorphisms with Iranian juvenile-onset systemic lupus erythematosus patients. Turkish J. Pediatr. 59 (2), 144–149. doi:10.24953/turkjped.2017.02.005
Sarkar, I. N. (2012). A vector space model approach to identify genetically related diseases. J. Am. Med. Inf. Assoc. 19 (2), 249–254. doi:10.1136/amiajnl-2011-000480
Schlicker, A., Domingues, F. S., Rahnenführer, J., and Lengauer, T. (2006). A new measure for functional similarity of gene products based on Gene Ontology. BMC Bioinforma. 7, 302. doi:10.1186/1471-2105-7-302
Schumacher, B. (2013). Immune to nicotine addiction? MMW Fortschr Med. 155 (5), 23–24. doi:10.1007/s15006-013-0267-8
Simonnet, A., Zamberletti, E., Cador, M., Rubino, T., and Caillé, S. (2017). Chronic FAAH inhibition during nicotine abstinence alters habenular CB1 receptor activity and precipitates depressive-like behaviors. Neuropharmacology 113, 252–259. doi:10.1016/j.neuropharm.2016.10.007
Smedley, D., Oellrich, A., Köhler, S., Ruef, B., Westerfield, M., Robinson, P., et al. Sanger Mouse Genetics Project (2013). PhenoDigm: Analyzing curated annotations to associate animal models with human diseases. Database (Oxford) 2013, bat025. doi:10.1093/database/bat025
Smith, D. J., Escott-Price, V., Davies, G., Bailey, M. E. S., Colodro-Conde, L., Ward, J., et al. (2016). Genome-wide analysis of over 106 000 individuals identifies 9 neuroticism-associated loci. Mol. Psychiatry 21, 1644. doi:10.1038/mp.2016.177
van Driel, M. A., Bruggeman, J., Vriend, G., Brunner, H. G., and Leunissen, J. A. M. (2006). A text-mining analysis of the human phenome. Eur. J. Hum. Genet. 14 (5), 535–542. doi:10.1038/sj.ejhg.5201585
van Wel, J. H., Gracia-Lor, E., van Nuijs, A. L. N., Kinyua, J., Salvatore, S., Castiglioni, S., et al. (2016). Investigation of agreement between waste water-based epidemiology and survey data on alcohol and nicotine use in a community. Drug Alcohol Depend. 162, 170–175. doi:10.1016/j.drugalcdep.2016.03.002
Vulto-van Silfhout, A. T., van Ravenswaaij, C. M. A., Hehir-Kwa, J. Y., Verwiel, E. T. P., Dirks, R., van Vooren, S., et al. (2013). An update on ECARUCA, the European cytogeneticists association register of unbalanced chromosome aberrations. Eur. J. Med. Genet. 56 (9), 471–474. doi:10.1016/j.ejmg.2013.06.010
Wang, J. Z., Du, Z., Payattakool, R., Yu, P. S., and Chen, C. F. (2007). A new method to measure the semantic similarity of GO terms. Bioinformatics 23 (10), 1274–1281. doi:10.1093/bioinformatics/btm087
Wang, J., Cui, W., Wei, J., Sun, D., Gutala, R., Gu, J., et al. (2011). Genome-wide expression analysis reveals diverse effects of acute nicotine exposure on neuronal function-related genes and pathways. Front. Psychiatry 2, 5. doi:10.3389/fpsyt.2011.00005
Washington, N. L., Haendel, M. A., Mungall, C. J., Ashburner, M., Westerfield, M., and Lewis, S. E. (2009). Linking human diseases to animal models using ontology-based phenotype annotation. PLoS Biol. 7 (11), e1000247. doi:10.1371/journal.pbio.1000247
Westbury, S. K., Turro, E., Greene, D., Lentaigne, C., Kelly, A. M., Bariana, T. K., et al. (2015). Human phenotype ontology annotation and cluster analysis to unravel genetic defects in 707 cases with unexplained bleeding and platelet disorders. Genome Med. 7 (1), 36. doi:10.1186/s13073-015-0151-5
Wilcoxon, F. (1946). Individual comparisons of grouped data by ranking methods. J. Econ. Entomol. 39, 269. doi:10.1093/jee/39.2.269
Wu, S., Shao, F., Ji, J., Sun, R., Dong, R., Zhou, Y., et al. (2015). Network propagation with dual flow for gene prioritization. PLoS One 10 (2), e0116505. doi:10.1371/journal.pone.0116505
Xuan, H., Li, X., Ren, S., and Zhang, S. (2015). Modular organization of the human disease genes: A text-based network inference. Bioinformation 11 (9), 432–436. doi:10.6026/97320630011432
Keywords: phenotype, mesh, OMIM, similarity score, FIDC
Citation: Liu X, Gao L, Peng Y, Fang Z and Wang J (2023) PheSom: a term frequency-based method for measuring human phenotype similarity on the basis of MeSH vocabulary. Front. Genet. 14:1185790. doi: 10.3389/fgene.2023.1185790
Received: 14 March 2023; Accepted: 21 June 2023;
Published: 11 July 2023.
Edited by:
Nguyen Quoc Khanh Le, Taipei Medical University, TaiwanReviewed by:
Qian He, City University of Hong Kong, Hong Kong SAR ChinaHermann A. M. Mucke, H. M. Pharma Consultancy, Austria
Copyright © 2023 Liu, Gao, Peng, Fang and Wang. This is an open-access article distributed under the terms of the Creative Commons Attribution License (CC BY). The use, distribution or reproduction in other forums is permitted, provided the original author(s) and the copyright owner(s) are credited and that the original publication in this journal is cited, in accordance with accepted academic practice. No use, distribution or reproduction is permitted which does not comply with these terms.
*Correspondence: Xinhua Liu, bGl1eGluaHVhQHRtdS5lZHUuY24=; Ju Wang, d2FuZ2p1QHRtdS5lZHUuY24=
†These authors have contributed equally to this work