 Rongli Fan
 Die Hu1
 Maiqiu Wang
 Huilin Zheng
95% of researchers rate our articles as excellent or good
Learn more about the work of our research integrity team to safeguard the quality of each article we publish.
Find out more
ORIGINAL RESEARCH article
Front. Genet. , 30 May 2023
Sec. RNA
Volume 14 - 2023 | https://doi.org/10.3389/fgene.2023.1153518
Introduction: Stroke, of which ischemic stroke (IS) is the major type, is the second leading cause of disability and death worldwide. Circular RNAs (circRNAs) are reported to play important role in the physiology and pathology of IS. CircRNAs often act as competing endogenous RNA (ceRNA) to regulate gene expression by acting as miRNA sponges. However, whole transcriptome-wide screenings of circRNA-mediated ceRNA networks associated with IS are still lacking. In the present study, we constructed a circRNA-miRNA-mRNA ceRNA network by whole transcriptome-wide analysis.
Methods: CircRNAs, miRNAs and mRNAs expression profiles were downloaded from the Gene Expression Omnibus (GEO) datasets. We identified differentially expressed (DE) circRNAs, miRNAs, and mRNAs in IS patients. StarBase and CircBank databases were used to predict the miRNA targets of DEcircRNAs, and mirDIP database was used to predict the mRNA targets of DEmiRNAs. CircRNA-miRNA pairs and miRNA-mRNA pairs were established. Then, we identified hub genes via protein-protein interaction analysis and constructed a core ceRNA sub-network.
Results: In total, 276 DEcircRNAs, 43 DEmiRNAs, and 1926 DEmRNAs were explored. The ceRNA network included 69 circRNAs, 24 miRNAs, and 92 mRNAs. The core ceRNA subnetwork included hsa_circ_0011474, hsa_circ_0023110, CDKN1A, FHL2, RPS2, CDK19, KAT6A, CBX1, BRD4, and ZFHX3.
Discussion: In conclusion, we established a novel hsa_circ_0011474 - hsa-miR-20a-5p/hsa-miR-17-5p - CDKN1A ceRNA regulatory axis associated with IS. Our findings provide new insights into the pathogenesis of IS and offer promising diagnostic and predictive biomarkers.
Stroke is the leading cause of permanent disability (Diener and Hankey, 2020). The latest global burden of disease (GBD) study (GBD 2019 Diseases and Injuries Collaborators, 2020) indicated that stroke is the leading cause of death in the Chinese population. The overall lifetime risk of stroke in China was 39.9%, ranking first worldwide. Ischemic stroke (IS) is one of the two major subtypes of strokes, accounting for approximately 80% of all subtypes of strokes (Wang et al., 2017), and is the focus of stroke prevention and treatment. At present, stroke diagnosis mainly relies on clinical symptoms and medical imaging technology. Thrombolytic therapy is the most effective treatment for acute IS (AIS). However, the time window for therapy is narrow, and most patients do not exhibit typical imaging changes in time. Missing this therapeutic window may lead to irreversible brain damage (Herpich and Rincon, 2020; Phipps and Cronin, 2020). Therefore, the emergence of biomarkers for the diagnosis and prediction of IS has come to fruition.
These biomarkers include numerous IS susceptibility genes, such as matrix metalloproteinase-9 (MMP-9) (Singh et al., 2018; Lorente et al., 2019), C-reactive protein (CRP) (Kitagawa et al., 2017), and metabolic intermediate plasma homocysteine (Hcy) (Chen et al., 2017). However, protein-coding regions represent only 1.5%–2% of the human genome, and the non-protein-coding portion of the genome is of crucial functional importance for normal development and physiology, as well as diseases (Esteller, 2011). MiRNAs, one kind of non-conding RNA (ncRNA), have been reported that play crucial role in IS. MiR-145, miR-424, and miR-223 were differentially expressed in patients with is (Zhu et al., 2014). Previous studies have explained that there were many miRNAs involved in the post-transcriptional regulation of Nrf2, and 85 miRNAs can bind to cytoplasmic Nrf2 and affect its translation (Papp et al., 2012). MiR-93 inhibited the expression of Nrf2 and heme oxygenase-1 (HO-1) by targeting Nrf2 (Wang et al., 2016). The Nrf2/HO-1 pathway was an important cellular defense mechanism against oxidative stress induced by ischemia/reperfusion (Jiang et al., 2017). Circular RNAs (circRNAs), another kind of ncRNA, have unique covalently-closed structures, which are insensitive to nucleic acid exonucleases and confers relative higher pharmaceutical stability compared to other linear RNAs, such as miRNAs and mRNAs. Additionally, circRNAs are conserved across species. Therefore, circRNAs have obvious advantages as clinical diagnostic biomarkers. CircRNAs have been reported to play important role in the physiology and pathology of IS. A study found that the expression of circFUNDC1 (hsa_circ_0007290) increased in patients with AIS, and it combined with other circRNAs, with a specificity of 91% and a sensitivity of 71.5% in the diagnosis of AIS (Zuo et al., 2020). Meanwhile, Bai et al. found that the expression level of circFUNDC1 was increased in serum exosomes of patients with AIS (Bai et al., 2022).
CircRNAs often act as miRNA sponges to regulate gene expression, and circRNA-miRNA-mRNA can be called ceRNA network. The ceRNA network has garnered significant attention in the academic community in recent years, representing a novel paradigm of gene expression regulation. In comparison to the regulatory networks involving individual RNA molecules, the ceRNA regulatory network is characterized by its intricacy and complexity. The ceRNA network establishes connections between the gene expression modulation of mRNAs and non-coding RNAs such as circRNAs, miRNAs, and lncRNAs, thereby facilitating a more profound and comprehensive understanding of the roles played by non-coding RNAs in critical biological phenomena, including cellular development and the molecular mechanisms underlying diseases. Among them, the ceRNA mechanism of IS-associated circRNAs has been extensively investigated. The ceRNA network guided by circRNAs typically satisfies the following conditions: circRNAs can act as “sponges” for endogenous miRNAs by possessing miRNA response elements or binding sites, thereby regulating the interaction between miRNAs and their target mRNAs (Kristensen et al., 2019). Thus, circRNAs can regulate mRNA expression and protein levels through ceRNA networks. These networks contain clues to the pathogenesis of IS, and the circRNA-related ceRNA networks associated with IS may serve as potential therapeutic targets. For example, circHECTD1 was overexpressed in plasma samples from mouse stroke models of transient middle cerebral artery occlusion (tMCAO) and patients with AIS. CircHECTD1 overexpression increased the risk of IS via miR-142/TIPARP (Han et al., 2018). In addition, Chen et al. found that circUCK2 was involved in IS regulation through the circUCK2/miR-125b-5p/GDF11 functional network (Chen et al., 2020a). Another study found that circSHOC2 regulated autophagy and acted on the miR-7670-3p/SIRT1 axis (Chen et al., 2020b), thereby inhibiting neuronal apoptosis and reducing neuronal damage.
The above studies employed sequencing analyses of individual circRNAs and predictions of target miRNAs and mRNAs, and their results were possibly subject to a certain degree of artificial bias. To address this point, we screened the circRNA, miRNA, and mRNA expression profiles of patients through the National Center for Biotechnology Information Gene Expression Omnibus (GEO) database via integrated analysis, constructed an IS-associated ceRNA network which included 69 circRNAs, 24 miRNAs, and 92 mRNAs. We analyzed and validated the core sub-network of the ceRNA network to obtain promising diagnostic biomarkers for IS. This network will facilitate the identification of new treatment targets. The flow chart illustrating the steps of the whole analysis was shown in Figure 1.
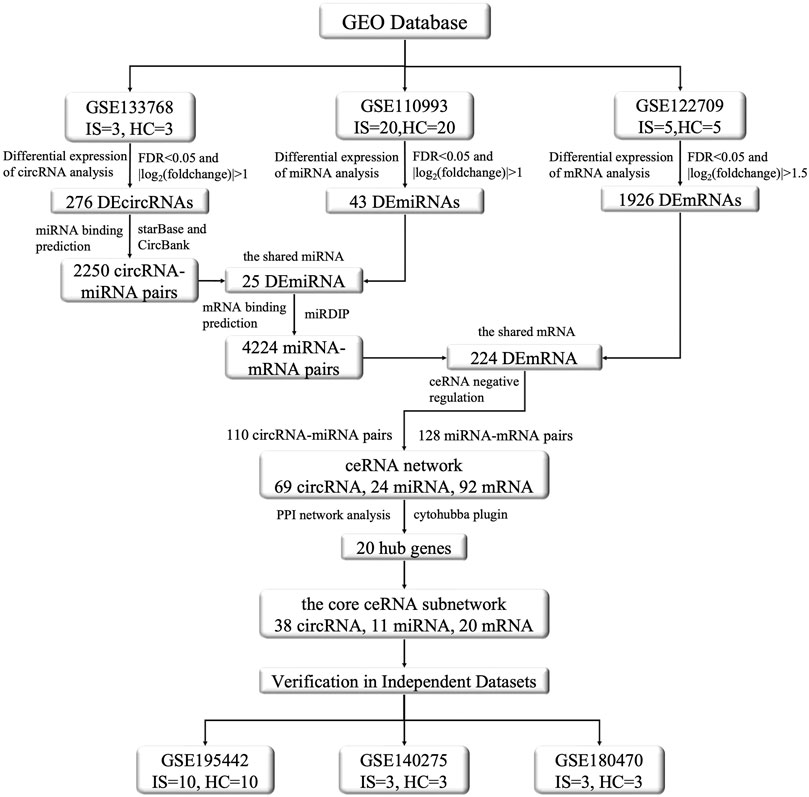
FIGURE 1. The flow chart of this study. This study contains the following three main aspects: (1) Dowloading and pre-processing datasets. The datasets included circRNA microarray dataset (GSE133768), miRNA and mRNA sequencing dataset (GSE110993, GSE122709). Differential expression analysis, prediction of miRNAs targeted by DEcircRNAs, prediction of DEmiRNAs binding mRNAs, gene enrichment analysis, etc., were conducted on the aforementioned datasets to explore DEcircRNAs, DEmiRNAs, and DEmRNAs and their functional roles between IS and normal control groups. (2) Construction of ceRNA regulatory network and selection of core genes. By integrating the DEcircRNAs, DEmiRNAs, and DEmRNAs obtained in the first step and screening their interactions, we constructed the ceRNA functional network of circRNA-miRNA-mRNA and visualized it using the Cytoscape software. We used the STRING protein database to construct a protein interaction network and used the MCODE algorithm in cytohubba to screen the core genes, and then selected the core sub-network of the ceRNA network based on them. (3) Validation by other independent datasets. For the nodes involved in the above core sub-network, we used other datasets to verify their significance and consistency in differential expression. The validation set were GSE195442 (circRNA), GSE199942 (miRNA), GSE140275 and GSE180470 (mRNA).
We downloaded circRNA, miRNA, and mRNA expression profile datasets from the public GEO database (http://www.ncbi.nlm.nih.gov/geo/). The circRNA data were obtained from GSE133768, which included data from plasma samples collected within 72 h of symptom onset from 3 IS patients and 3 healthy controls (HCs). This data was sequenced on the GPL21825 platform using Agilent Arraystar Human CircRNA microarray V2, and 10,799 probes were yielded. MiRNA data were downloaded from GSE110993, which included data from samples collected from 20 patients with IS and 20 HCs. Platelet-poor plasma samples from these patients were collected within 24 h of symptom onset. High-throughput transcriptome sequencing, performed on the GPL15456 platform using Illumina HiScanSQ, yielded 4,447 probes. GSE122709 contained mRNA and lncRNA data from 5 IS patients and 5 HCs. Samples of peripheral blood mononuclear cells were collected from patients 24 h and 7 days after the onset of symptoms. High-throughput transcriptome sequencing was performed on the GPL20795 platform using HiSeq X Ten, and 54,262 probes were yielded.
After the circRNA microarray data were downloaded, an expression matrix containing the 6-digit circRNA_IDs for 10,798 circRNAs was obtained using Perl script conversion, based on the GPL21825 platform annotation information. Then, we used the “limma” package (version 3.52.2, https://bioconductor.org/packages/) in R software (version 4.0.3, https://www.r-project.org/) to identify differentially expressed circRNAs (DEcircRNAs), with FDR <0.05 and |log2FC| > 1 as screening criteria. In addition, to facilitate miRNA prediction, we transformed the 6-digit circRNA_IDs to 7-digit circRNA_IDs using the ID relationship conversion file from the CircBase database (http://www.circbase.org/).
After downloading the miRNA sequencing expression matrix, we removed im-mature miRNAs starting with “hsa-mir” and obtained an expression matrix comprising 2,587 mature miRNAs. We used the “DESeq2” package (version 1.34.0, https://bioconductor.org/packages/release/bioc/html/DESeq2.html) to identify differentially expressed miRNAs (DEmiRNAs), using FDR <0.05 and |log2FC| > 1 as screening criteria.
MRNA expression data were downloaded from GSE122709, including 5 HCs and 5 IS patients within 24 h of the onset of symptoms. To exclude the lncRNA data from the expression matrix, Homo sapiens. GRCh38 was used as the reference genome, which is available from Ensembl (https://asia.ensembl.org/index.html/).
For more accurate results, we both used “DESeq2” and “EdgeR” (version 3.36.0, https://bioconductor.org/packages/release/bioc/html/edgeR.html) packages to identify differentially expressed mRNAs (DEmRNAs). The DEmRNAs were then screened, using FDR <0.05 and |log2FC| > 1.5 as criteria. The final DEmRNAs were the shared DEmRNAs using “DESeq2” and “EdgeR” packages.
To reveal the functions of the DEmRNAs, we performed Gene Ontology (GO) and Kyoto Encyclopedia of Genes and Genomes (KEGG) pathway analyses using R software (Kanehisa and Goto, 2000; Gene Ontology Consortium, 2015). The Entrez ID for each DEmRNA was obtained using the R package “org.Hs.e.g.,.db.” (version, 3.14.0, https://bioconductor.org/packages/release/data/annottion/html/org.Hs.eg.db.html). To elucidate the mechanisms underlying the association of DEmRNAs with biological processes (BPs), GO and KEGG function annotations were analyzed using “ggplot2” (version 3.3.5, https://github.com/tidyverse/ggplot2), “enrichplot” (version 1.14, https://bioconductor.org/packages/release/bioc/html/enrichplot.html), and “clusterProfiler” (version 4.2.2, https://bioconductor.org/packages/release/bioc/html/clusterProfiler.html) packages.
In order to facilitate understanding, the specific process of the construction of ceRNA network was shown in Figure 2. Initially, we utilized two databases, namely, StarBase (v2.0, https://starbase.sysu.edu.cn/) and CircBank (http://www.circbank.cn/), to forecast the miRNA binding sites of DEcircRNAs. The specific steps involved in this process are as follows: 1) Due to the unavailability of batch prediction of miRNA binding sites and the non-uniqueness of the circRNA naming convention in the files containing circRNA-miRNA pairs downloaded directly from StarBase, it was not feasible to conduct subsequent batch predictions. Therefore, we utilized R software to batch download all circRNA-miRNA pairs corresponding to circRNA IDs named with 7 digits. After removing duplicates, we merged the resulting 3,502,309 circRNA-miRNA pairs and filtered out those corresponding to DEcircRNAs. 2) From the download section of CircBank, we obtained a file containing all circRNA-miRNA pairs, which comprised a total of 16,844,374 pairs. Similarly, we utilized R software to filter out the circRNA-miRNA pairs corresponding to DEcircRNAs. 3) The predicted circRNA-miRNA pairs from both StarBase and CircBank were intersected, and duplicates were removed to obtain the shared predicted miRNAs for DEcircRNAs.
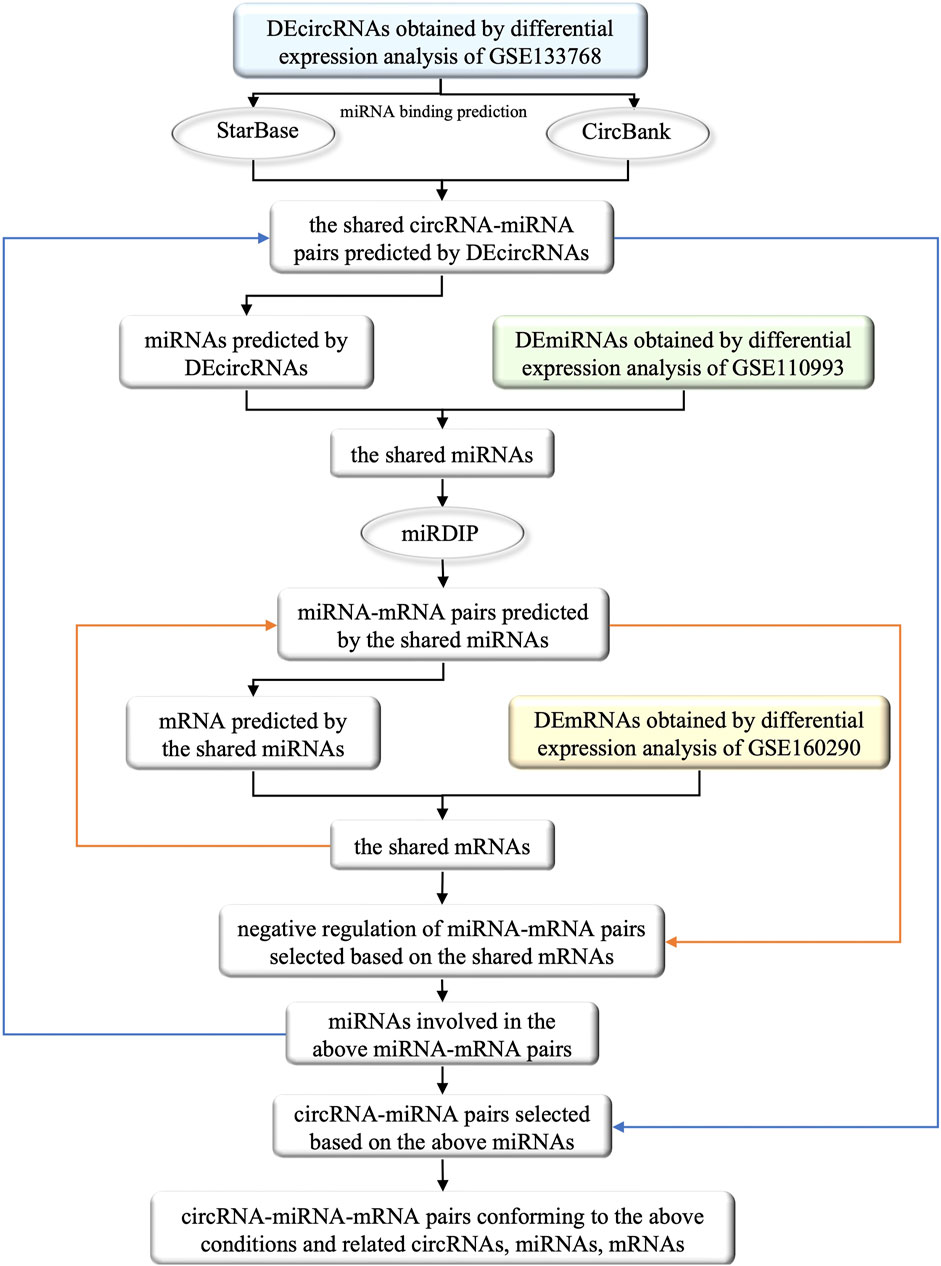
FIGURE 2. The flow chart of the selection of circRNAs, miRNAs and mRNAs involved in the ceRNA network and their interrelationships. The square boxes indicate the screened data and the oval boxes indicate the databases that were used. In particular, blue, green and yellow boxes indicate DEcircRNAs, DEmiRNAs and DEmRNAs obtained from differential expression analysis of circRNAs, miRNAs and mRNAs that were extracted from GEO database, respectively. The orange arrow demonstrates the process of incorporating the shared mRNAs into the previously identified miRNA-mRNA pairs, and filtering out the negative regulatory miRNA-mRNA pairs associated with these mRNAs. Similarly, the blue arrow illustrates the process of obtaining miRNA from the screened miRNA-mRNA pairs in the previous step, and incorporating these miRNAs into previously identified circRNA-miRNA pairs to obtain the circRNA-miRNA pairs involved in these miRNAs. Ultimately, by identifying the miRNAs that satisfies both the newly obtained circRNA-miRNA pairs and miRNA-mRNA pairs, we successfully constructed a ceRNA functional network of circRNA-miRNA-mRNA.
We further utilized the mirDIP database (http://ophid.utoronto.ca/mirDIP/index.jsp) to predict the mRNA binding sites of the miRNAs predicted by DEcircRNAs. Specifically, we took the intersection of DEcircRNA-predicted miRNAs and DEmiRNAs, inputted the shared miRNAs into the “miRNAs” column of mirDIP, selected the corresponding “Score class” as “Top 1%", obtained miRNA-mRNA pairs, and removed duplicates to obtain the shared miRNA-predicted mRNAs.
We then took the intersection of the predicted mRNAs and DEmRNAs, examined the miRNA-mRNA pairs involved in the shared mRNAs, selected negative regulatory miRNA-mRNA pairs (Only the case of miRNA-mRNA pairs with negative regulation is discussed in this study), and obtained corresponding miRNAs and mRNAs. We further obtained the circRNA-miRNA pairs in which the above miRNAs participated, and eliminated the miRNAs that were not correlated with circRNAs.Through the remaining miRNAs and their participating circRNA-miRNA pairs, miRNA-mRNA pairs, we obtained the selected circRNAs, miRNAs and mRNAs to construct the ceRNA network.
Based on the above analysis, we constructed a ceRNA functional network composed of circRNA-miRNA-mRNA pairs. For visualization, we used Cytoscape v3.9.0 (https://cytoscape.org/) to map the ceRNA functional network.
To identify hub genes, we performed PPI network analysis of all mRNAs involved in the ceRNA network. We searched for interactions between genes using the STRING database (http://stringdb.org/), with an interaction score threshold of "> 0.40". To construct the core sub-network of the ceRNA network, we visualized the PPI network using Cytoscape and selected hub genes using the Cytohubba plugin.
To minimize bias, we utilized multiple independent datasets to validate the circRNAs, miRNAs, and mRNAs which contained in the core sub-network. GSE195442, which included microarray data from plasma exosome samples collected from 10 patients with IS and 10 HCs, was used as the validation dataset for circRNAs. GSE199942, which included sequencing data from serum samples collected from 5 IS patients and 5 HCs, was used as the validation dataset for miRNAs. GSE180470 and GSE140275 were used as mRNA validation datasets, both of the datasets containing sequencing data from blood samples collected from 3 IS patients and 3 HCs. To verify the accuracy of the results, we used the same processing methods and analysis criteria when constructing the ceRNA network.
We obtained 276 DEcircRNAs, each with a 7-digit circRNA_ID, by analyzing the expression profiles from GSE133768. Among them, 24 upregulated and 252 downregulated DEcircRNAs were associated with IS. We then plotted the top 20 upregulated and top 20 downregulated DEcircRNAs using heat maps and volcano plots (Figures 3A,B). The basic information for DEcircRNAs were shown in Table1.
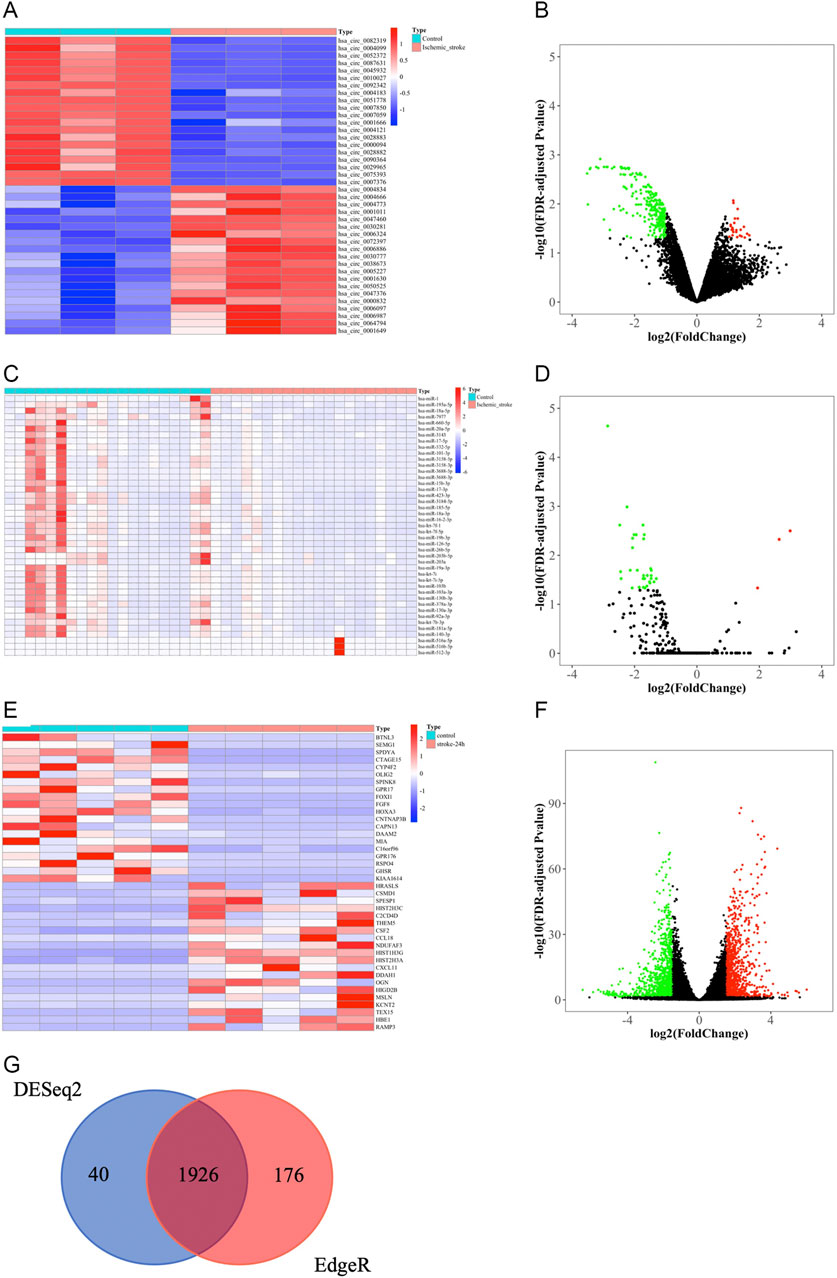
FIGURE 3. Identification of DEcircRNAs, DEmiRNAs, and DEmRNAs. (A) The heat map of top 20 upregulated and top 20 downregulated DEcircRNAs. (B) Volcano plot of circRNAs. Green and red represent downregulated and upregulated DEcircRNAs, respectively. |log2FC| > 1, FDR < 0.05. circRNAs, circular RNAs. (C) The heat map of all DEmiRNAs. (D) Volcano plot of miRNAs. Green and red represent downregulated and upregulated DEmiRNAs, respectively. |log2FC|> 1, FDR < 0.05. miRNAs, microRNAs. (E) The heatmap of top 20 upregulated and downregulated DEmRNAs based on “DESeq2” package. (F) Volcano plot of mRNAs that were screened based on “DESeq2” package. Green and red represent downregulated and upregulated DEmRNAs, respectively. |log2FC| > 1.5, FDR < 0.05. mRNAs, messenger RNAs. (G) Venn diagram of the shared DEmRNAs obtained by “DESeq2” and “EdgeR” packages.
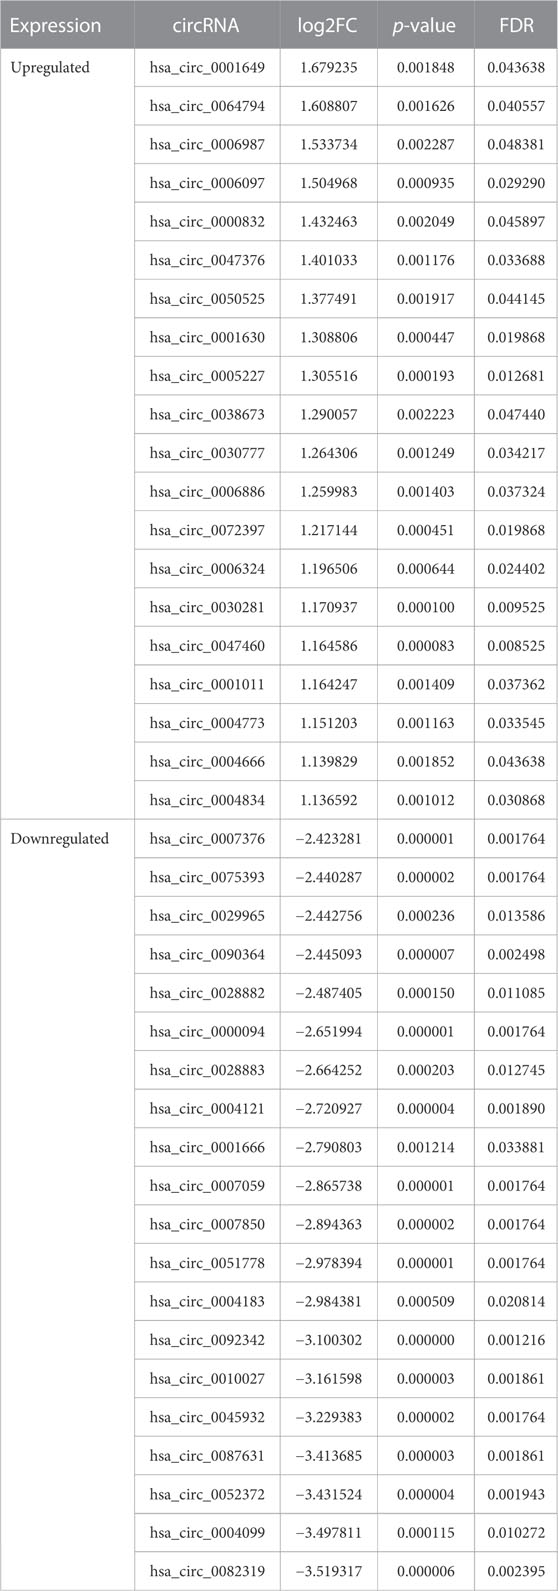
TABLE 1. The top 20 upregulated and 20 downregulated DEcircRNAs.
Due to the limited number of mature miRNAs obtained by sequencing, we used “DESeq2” package in R software to analyze the GSE110993 expression profiles. We obtained 43 DEmiRNAs, of which 3 were upregulated and 40 were downregulated (Table 2; Figures 3C,D).
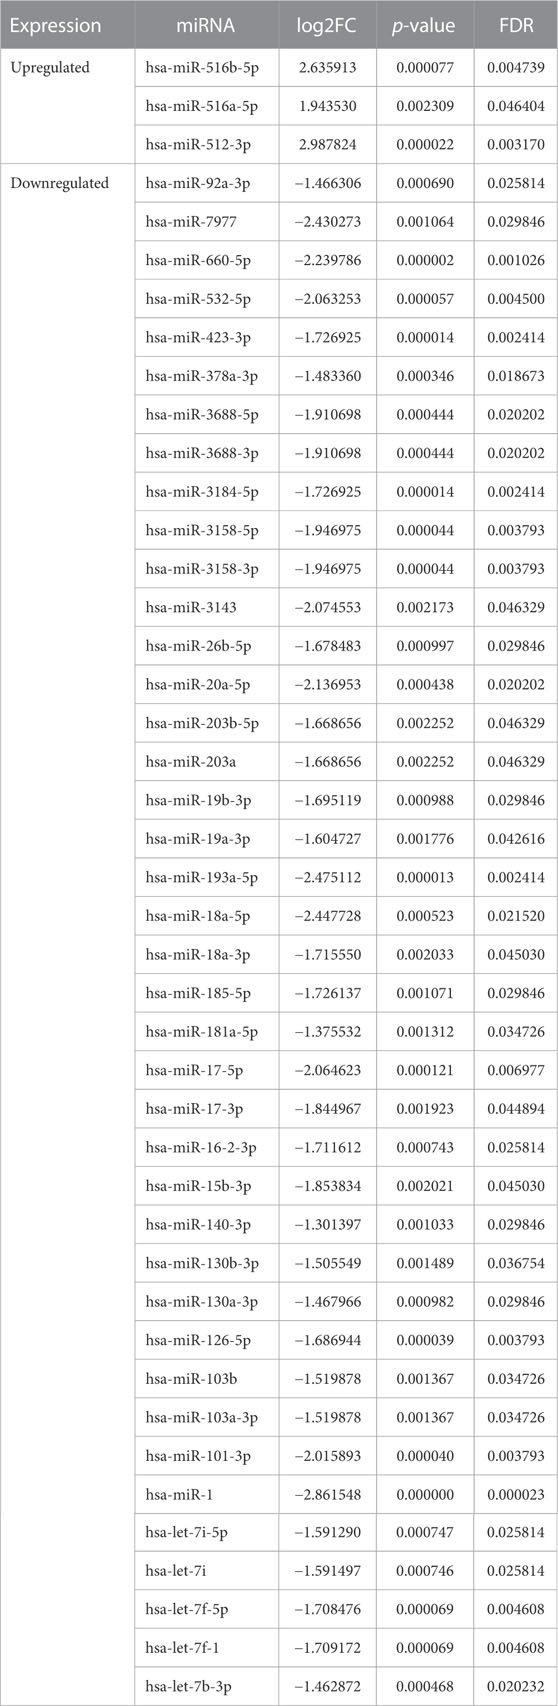
TABLE 2. The total of 43 DEmiRNAs.
We screened the expression matrix for 19,298 mRNAs from the GSE122709 dataset. Differention expressing analysis found 1966 DEmRNAs (985 upregulated and 981 downregulated) using the “DESeq2” package. We then plotted the top 20 upregulated and top 20 downregulated DEmRNAs using heat maps and volcano plots (Table 3; Figures 3E,F). We used “EdgeR” package to obtain more accurate differential analysis results and identified 2,102 DEmRNAs, of which 1,090 were upregulated and 1,012 were downregulated; heat maps and volcano plots are presented in the Supplementary Materials (Supplementary Table S1; Supplementary Figure S1A, B). The results of the two analyses were intersected, yielding 1926 DEmRNAs (Figure 3G).
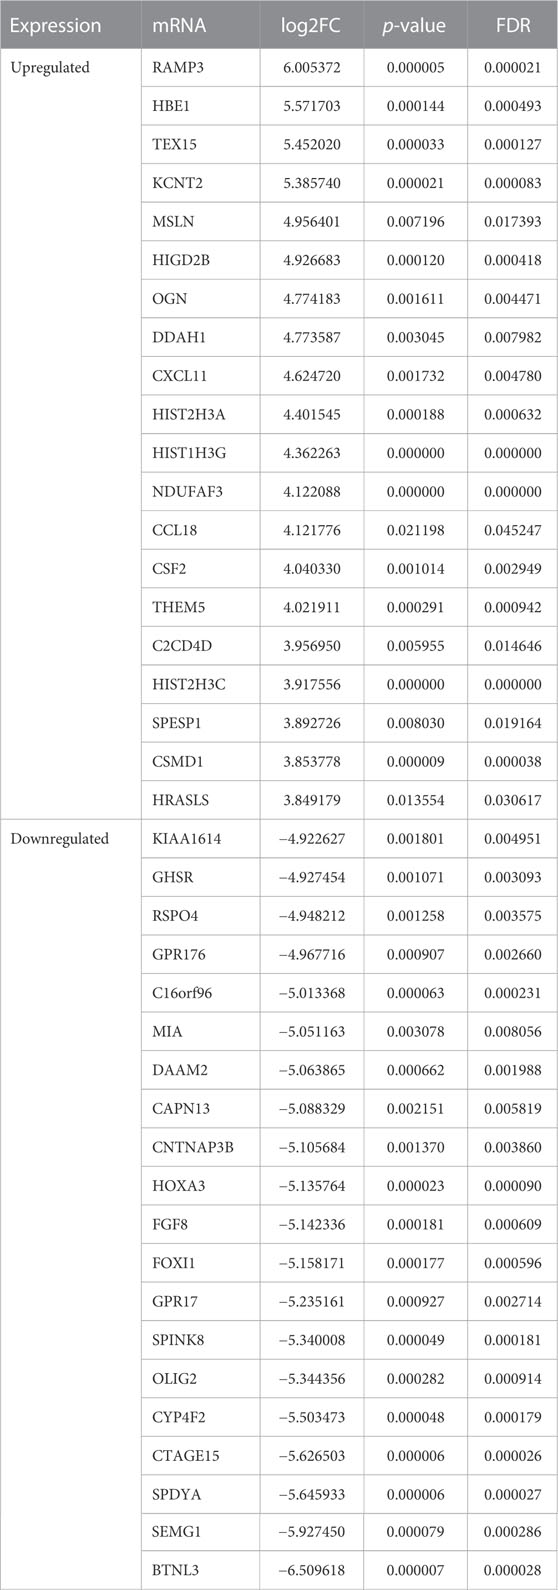
TABLE 3. The top 20 upregulated and 20 downregulated DEmRNAs.
The top 10 results of GO enrichment analysis indicated that the DEmRNAs were mainly involved in transcription, translation, nuclear-transcribed mRNA catabolism, and other related BPs (Figure 4A). For the cellular components, DEmRNAs were mainly enriched in the large and small ribosome subunits and mitochondrial protein complexes (Figure 4B). In the context of molecular functions, the DEmRNAs were significantly involved in the structural constituents of the ribosome, CXCR chemokine receptor binding, and c antigen binding (Figure 4C). Furthermore, KEGG pathway analysis showed that the DEmRNAs were involved in the ribosome; hematopoietic cell lineage; glycine, serine, and threonine metabolism; and coronavirus disease-COVID-19 pathways (Figure 4D).
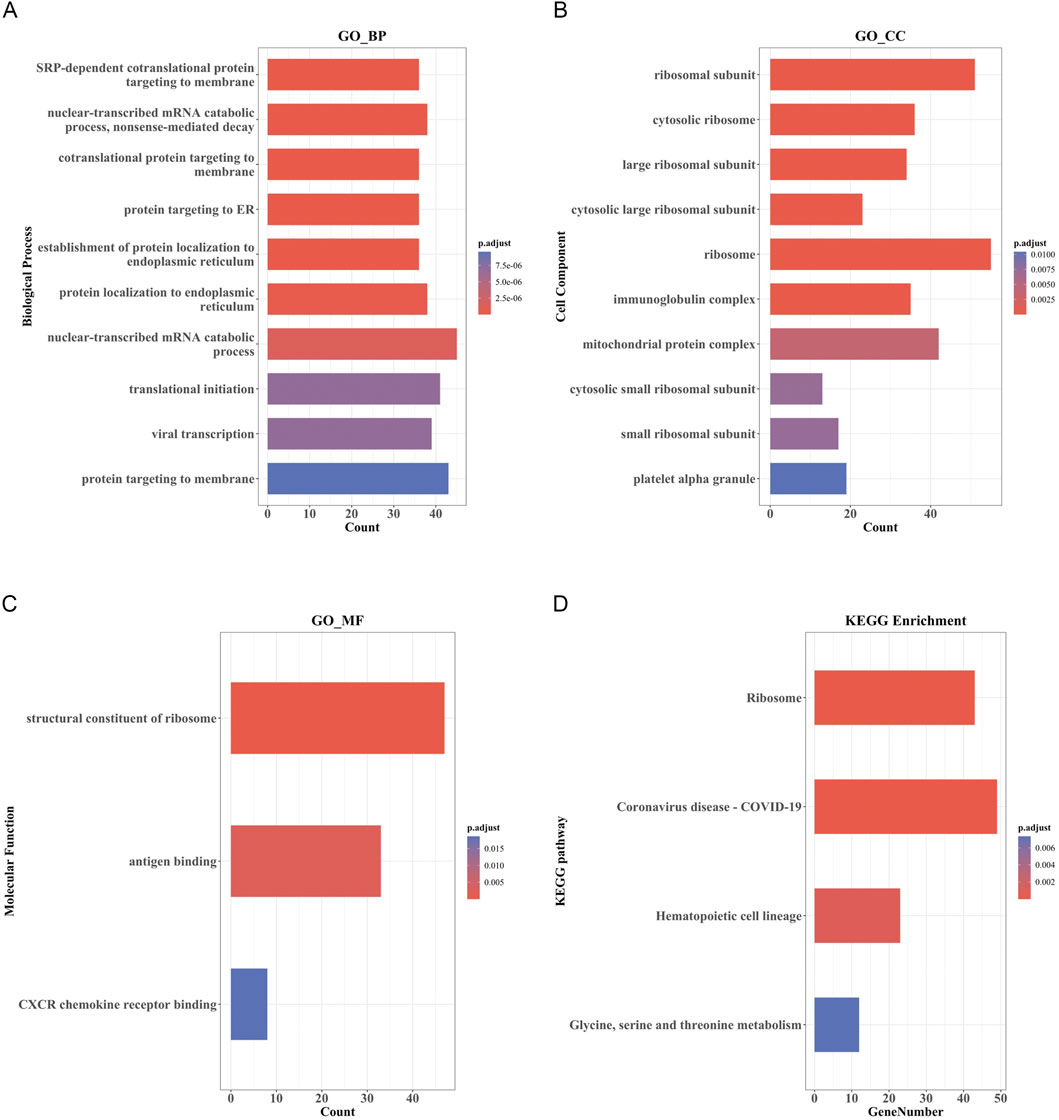
FIGURE 4. GO and KEGG pathway enrichment analysis of DEmRNAs. (A) Bar Plot of BP. (B) Bar Plot of CC. (C) Bar Plot of MF. (D) Bar Plot of KEGG. (GO, Gene Ontology; BP, biological processes; CC, cell component; MF, molecular function).
First, StarBase and CircBank databases were used to predict the target miRNAs of the 276 DEcircRNAs; 5,291 and 21,190 circRNA-miRNA pairs were predicted, respectively. The results were intersected to obtain 2,250 circRNA-miRNA pairs (Figure 5A), comprising 221 circRNAs and 574 miRNAs. We then intersected these 574 predicted miRNAs with the 43 DEmiRNAs to obtain 25 miRNAs (Figure 5B). We used mirDIP database to predict the target mRNAs of the 25 miRNAs, resulting in 4,224 miRNA-mRNA pairs involving 2,681 mRNAs. This result was intersected with the 1926 DEmRNAs, yielding 224 mRNAs (Figure 5C). We verified the differential expression of the screened circRNAs, miRNAs, and mRNAs in the GEO datasets and subjected them to further screening according to the regulatory mechanism of ceRNAs. Using Cytoscape software, we successfully built a circRNA-based ceRNA regulatory network (Figure 5D) comprising 110 circRNA-miRNA pairs and 128 miRNA-mRNA pairs that included 69 circRNAs, 24 miRNAs, and 92 mRNAs.
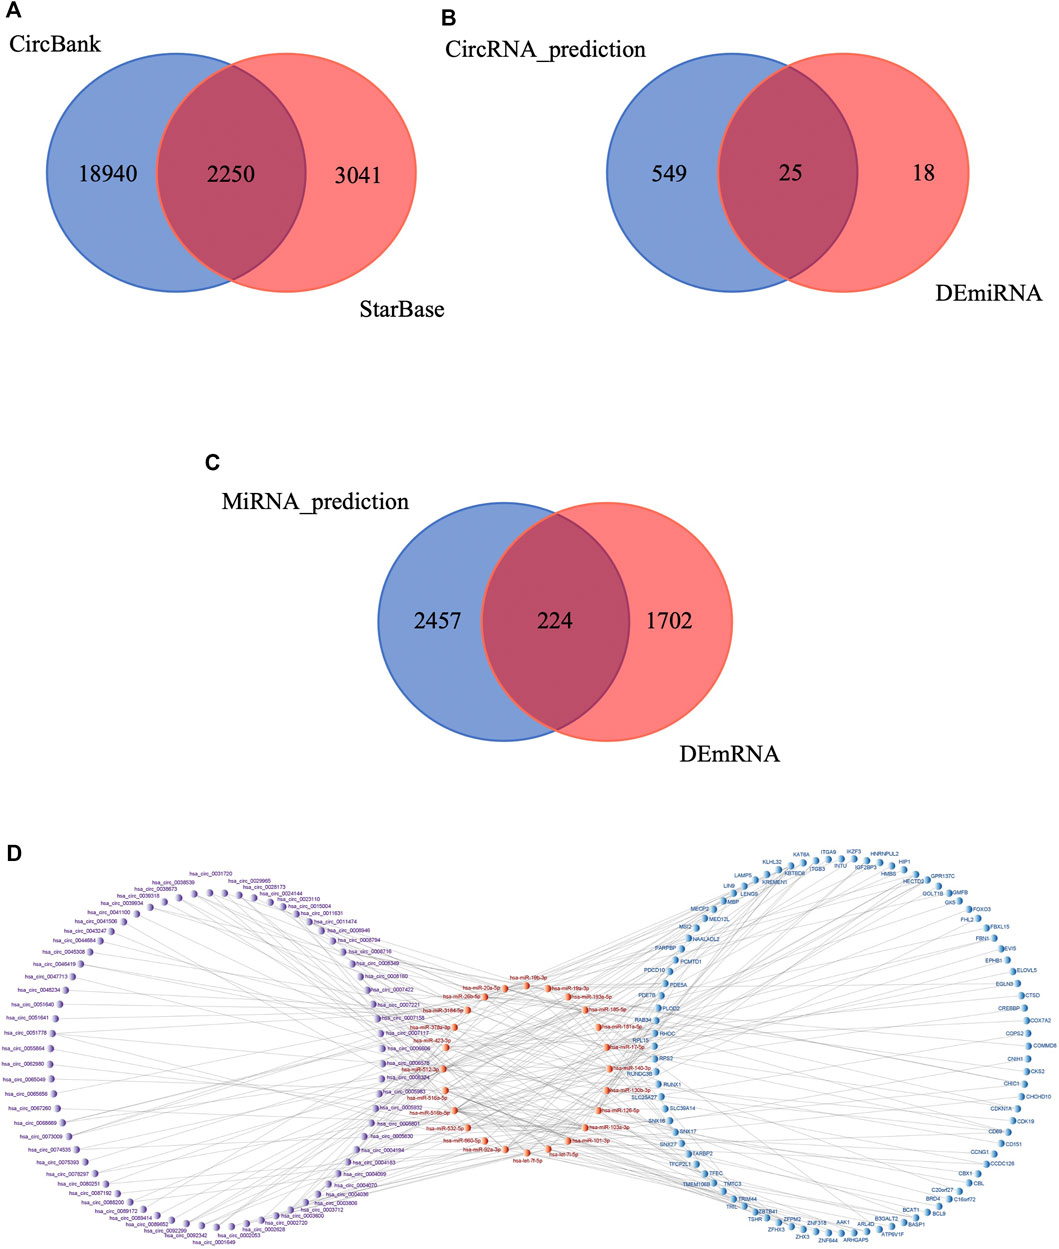
FIGURE 5. Construction of circRNA-associated ceRNA network in IS. (A) Venn diagram of the shared circRNA-miRNA pairs predicted from CircBank and StarBase databases for 276 DEcircRNAs. (B) Venn diagram of 574 miRNAs predicted by DEcircRNAs and 43 DEmiRNAs. (C) Venn diagram of 2,681 mRNAs predicted by DEmiRNAs and 1926 DEmRNAs. (D) Visualization of the ceRNA network. The red nodes represent miRNAs, the purple nodes represent circRNAs, the blue nodes represent mRNAs.
The PPI network, including 92 nodes and 47 edges, was constructed using the STRING protein database. We used Cytoscape software to visualize the PPI network (Figure 6A) and filtered the top 20 hub genes using the Cytohubba plugin (Table 4; Figure 6B). We then screened the corresponding sub-network from the ceRNA network (Figure 6C). The core sub-network included 48 circRNA-miRNA pairs and 23 miRNA-mRNA pairs, with a total of 69 nodes (38 circRNAs, 11 miRNAs, and 20 mRNAs).
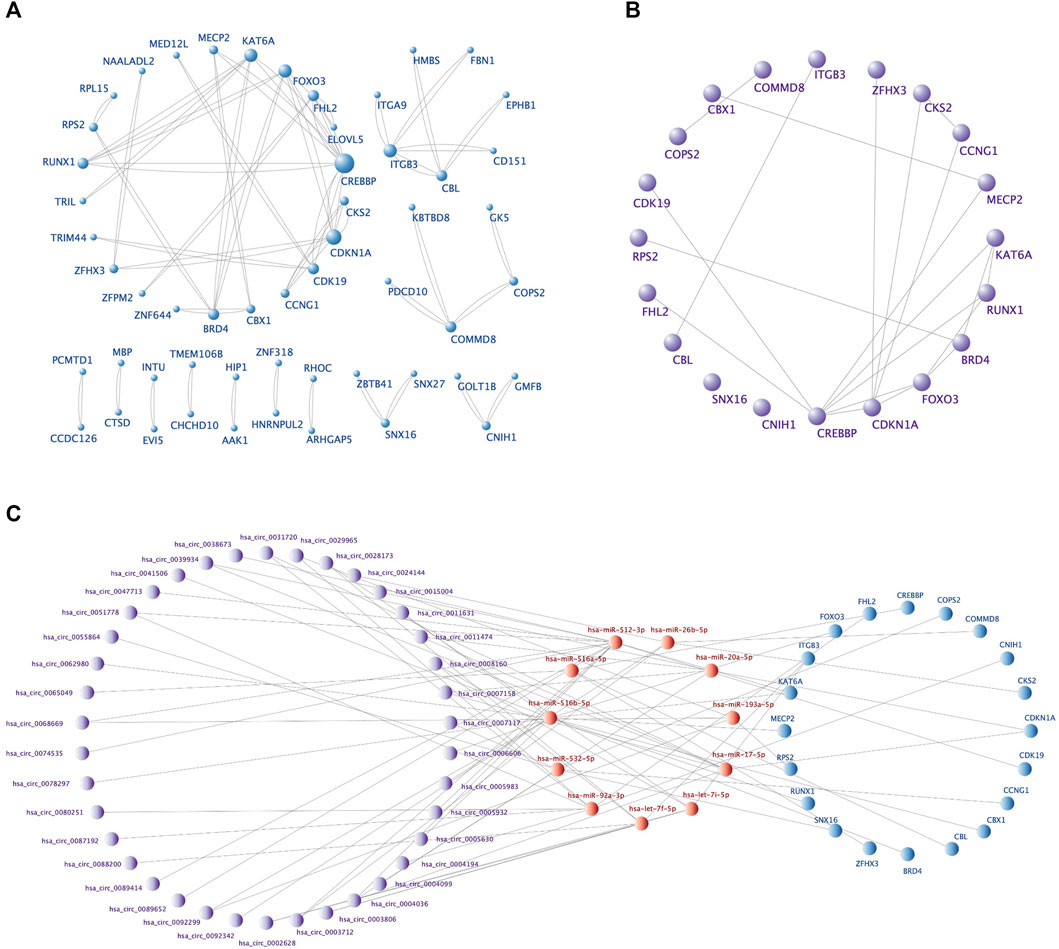
FIGURE 6. The PPI network, top 20 hub genes, and core ceRNA sub-network. (A) The PPI network of 92 DEmRNAs constructed by Cytoscape software. Larger nodes indicate higher gene connectivity. (B) The top 20 hub genes obtained by Cytohubba plugin. (C) The core sub-network screened from the ceRNA network by the 20 hub genes.
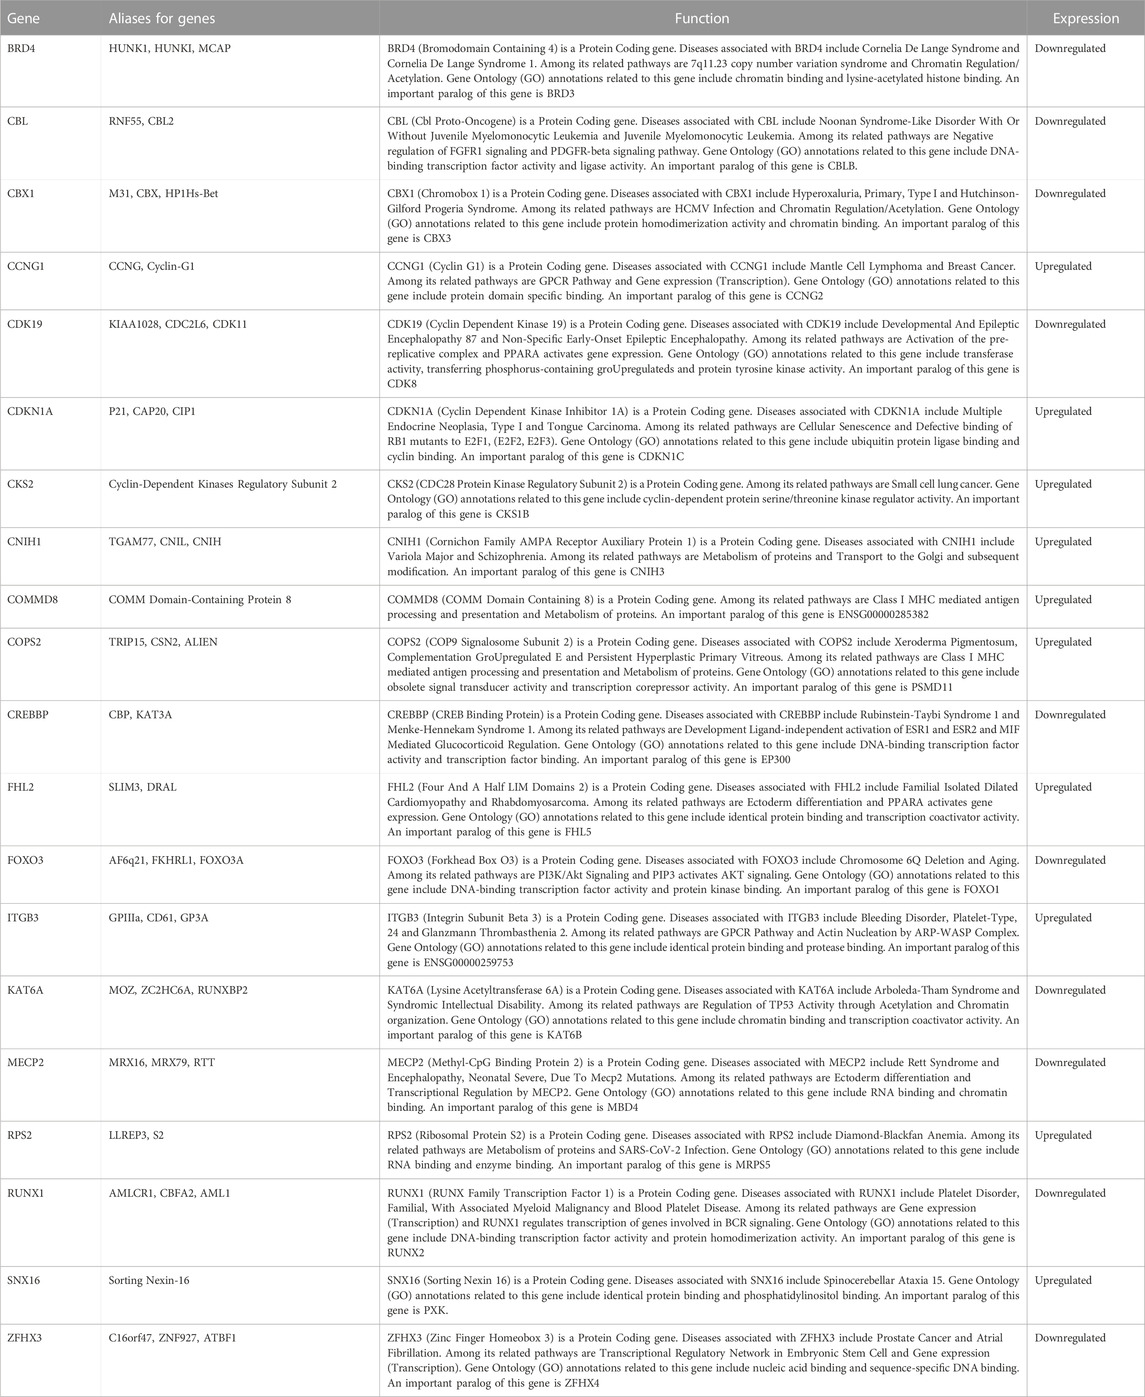
TABLE 4. Functional information of the top20 genes selected from the PPI network.
We verified that hsa_circ_0011474 and hsa_circ_0023110, which were significantly downregulated in IS, were also significantly downregulated in the circRNA validation set GSE195442 (Figure 7). We verified that CDKN1A, FHL2, and RPS2, which were significantly upregulated in IS, and KAT6A, CDK19, and CBX1, which were significantly downregulated, had consistent expression changes in the mRNA validation set GSE140275 (Figure 8). Similarly, we verified that BRD4 and ZFHX3, which were significantly downregulated in IS, were also significantly downregulated in the mRNA validation set GSE180470 (Figure 9). We did not validate any miRNAs that showed significant changes in expression consistent with GSE110993.
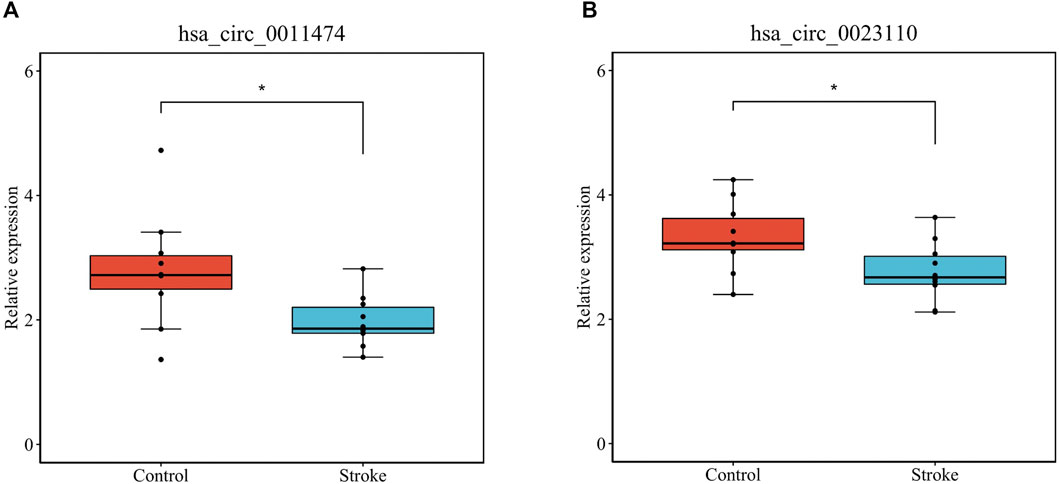
FIGURE 7. Expression levels of core circRNAs verified in GSE195442: (A) has_circ_0011474; (B) hsa_circ_0023110. (*p < 0.05)
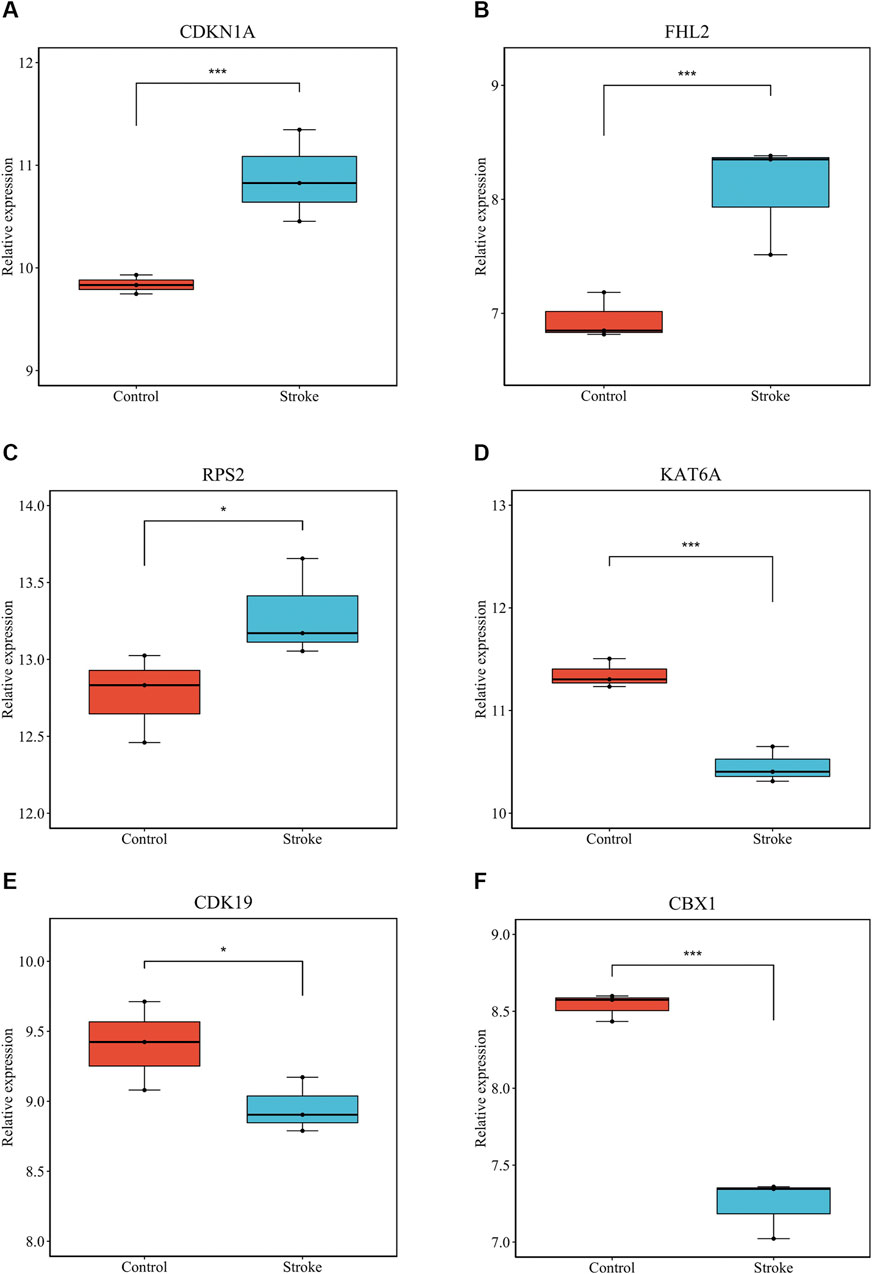
FIGURE 8. Expression levels of core mRNAs verified in GSE140275: (A) CDKN1A; (B) FHL2; (C) RPS2; (D) KAT6A; (E) CDK19; (F) CBX1. (*p < 0.05, ***p < 0.001).

FIGURE 9. Expression levels of core mRNAs verified in GSE180470: (A) BRD4; (B) ZFHX3. (*p < 0.05).
Owing to the high incidence, disability, mortality, recurrence, and economic burden of stroke, the identification of specific biomarkers for the diagnosis and treatment of IS an urgent task. In recent years, an increasing number of studies have shown that circRNAs can influence the onset and progression of cardiovascular disease through multiple pathways. CircRNA-meidated ceRNA is a important form of gene regulation for circRNA, and has a great potential in disease research. However, whole transcriptome-wide screenings of circRNA-mediated ceRNA networks associated with IS are still lacking.
In this study, we used expression data downloaded from the GEO database to identify DEcircRNAs, DEmiRNAs, and DEmRNAs between IS patients and HCs. By integrating the interactions, we successfully constructed an IS-specific ceRNA network with 185 nodes and 238 edges. GO enrichment analysis showed that the DEmRNAs were mainly involved in IS-related BPs. In addition, DEmRNAs were significantly enriched in four KEGG pathways, including coronavirus disease-COVID-19. Studies have shown that patients infected with COVID-19 may be at a higher risk of IS than patients with influenza infections (Merkler et al., 2020).
To identify the core of the ceRNA network, we obtained 20 hub genes using PPI and Cytohubba analyses. Eight of these 20 genes have been reported to be associated with IS, including ITGB3, CDKN1A, ZFHX3, CREBBP, MECP2, RUNX1, BRD4, and FOXO3. Maguire et al. demonstrated that the ITGB3 (GPIIIa) variant (rs5918) is associated with functional outcomes in stroke survivors (Maguire et al., 2011). Fan et al. reported that CDKN1A/JUN could be a robust and promising gene-pair diagnostic biomarker for IS, regulating ferroptosis during IS progression via the C9orf106/C9orf139 - miR-22-3p - CDKN1A and GAS5-miR-139-5p/miR-429-JUN axes (Fan et al., 2022). In addition, several studies have found that SNP rs7193343, located on ZFHX3, is associated with prognostic recovery in cardioembolic stroke, a subtype of IS (Gudbjartsson et al., 2009). Another study, Hu et al. identified SNP rs879324, located on ZFHX3, as an important factor influencing IS in the Chinese Han population by multifactor dimension reduction (MDR) software and least absolute shrinkage and selection operator (LASSO) logistic regression (Hu et al., 2023). Tseveleki et al. found that CREBBP, a gene related to the cellular stress response, was upregulated in a mouse model of permanent middle cerebral artery occlusion (Tseveleki et al., 2010). Yang et al. demonstrated through in vivo and in vitro experiments that circSCMH1 binds to the transcription factor MECP2 and regulates the transcriptional expression of its downstream genes, thereby affecting functional recovery after stroke in mice and primates (Yang et al., 2020). Hu et al. revealed that overexpression of MECP2 can protect mice against ischemic brain injury via disruption of the FOXO3a/SPRY2/ZEB1 signaling axis (Meng et al., 2022). Furthermore, one study showed that young rats had higher blood vessel density on day 14 post-stroke than old rats. RUNX1 is involved in angiogenesis, and its expression level is much higher in young rats after stroke than in old rats (Buga et al., 2014). In transient IS, dBET1 ameliorates neurological dysfunction and brain injury by degrading BRD4, regulating inflammation and oxidative stress, and protecting the integrity of the blood-brain barrier (Liu et al., 2022). Fibrous scarring played an important role in preventing secondary expansion of tissue damage and hindering repair and regeneration after central nervous system (CNS) injury. BRD4 was involved in fibrosis in many tissues, and transforming growth factor-β1 (TGF-β1)/Smad2/3 signaling was one of the critical pathways of fibrosis. Li et al. were the first to indicate that inhibition of BRD4 delayed fibrous scarring after IS through mechanisms involving the phosphorylation of Smad2/3 (Li et al., 2022). Similarly, FOXO3 is highly expressed in oxygen-glucose deprivation (OGD)-induced neuronal cells. Downregulation of FOXO3 can prevent neuronal damage and inflammatory responses in OGD-induced neuronal cells by inhibiting the CITED2/IKKα axis (Deng et al., 2020). In their latest study, Deng et al. indicated that Akt/FoxO3 signaling pathway activation inhibited oxidative stress-mediated cell death through activation of autophagy. Their study supported a critical role for the Akt/FoxO3 signaling pathway in autophagy activation in stroke (Deng et al., 2023). The remaining 12 genes (RPS2, CKS2, COMMD8, CDK19, KAT6A, CBL, CBX1, COPS2, SNX16, CCNG1, FHL2, and CNIH1) have not been reported to be associated with IS.
Based on the negative regulatory miRNA-mRNA pairs corresponding to these 20 hub genes, we constructed a core sub-network of the ceRNA network. This core sub-network included 48 circRNA-miRNA pairs and 23 miRNA-mRNA pairs. For external validation, we investigated the relative expression levels of these nodes in other datasets and validated several circRNAs and genes in the core sub-network, including CDKN1A, FHL2, and RPS2. The downregulated nodes included hsa_circ_0011474, hsa_circ_0023110, CDK19, KAT6A, CBX1, BRD4, and ZFHX3. By validating the obtained circRNAs and genes, we identified a ceRNA pathway, hsa_circ_0011474 - hsa-miR-20a-5p/hsa-miR-17-5p - CDKN1A. In addition to CDKN1A, which has been previously reported to be associated with IS, miR-17-5p and miR-20a-5p have been identified as promising candidate biomarkers for distinguishing embolic stroke from thrombotic stroke.
CDKN1A (also known as P21) encodes a potent inhibitor of cyclin-dependent kinases associated with the cellular senescence pathway (Fitzgerald et al., 2015). The aging of neurons, astrocytes, and microglia in the central nervous system is involved in brain aging and the development of age-related neurological disorders (Yamazaki et al., 2016). A marker of cellular senescence, CDKN1A expression was significantly upregulated in the infarcted area of dissected mice 72 h after tMCAO (Torres-Querol et al., 2021). Therefore, CDKN1A may be involved in the occurrence and development of IS by regulating vascular cell senescence. Supporting the significance of the hsa_circ_0011474 - hsa-miR-20a-5p/hsa-miR-17-5p - CDKN1A pathway, previous studies have found that miR-20a can improve the proliferation rate of mesenchymal stem cells in the serum of IS patients by inhibiting the expression of CDKN1A (Kim et al., 2016). Similarly, Rastegari et al. found that CDKN1A was significantly associated with autism, a neurodevelopmental disorder, through the WGCNA network (Rastegari et al., 2023).
To address the lack of joint analyses of mRNA, miRNA, and circRNA in IS, this study conducted an integrated analysis of multiple GEO datasets. We combined the results of circRNA microarray expression data analysis with the results of mRNA and miRNA high-throughput sequencing data analysis and constructed ceRNA functional networks to comprehensively explore promising diagnostic biomarkers of IS and their potential mechanisms of action. Our findings improve the current understanding of ceRNA biological behaviors and their regulatory roles in IS pathogenesis. Nodes in the hsa_circ_0011474 - hsa-miR-20a-5p/hsa-miR-17-5p - CDKN1A pathway, validated in the ceRNA network, may serve as promising diagnostic biomarkers and therapeutic targets for IS.
The datasets presented in this study can be found in online repositories. The names of the repository/repositories and accession number(s) can be found in the article/Supplementary Material.
RF, HZ, LZ, and YZ contributed to design of the paper. DH, RF, and MW performed data analyses. DH and RF participated in the writing of the paper. All authors contributed to the article and approved the submitted version.
This research was funded by Zhejiang Province Key Research and Development Projects (2020C03071, 2021C03145), and “Pioneer” and “Leading Goose” R&D Program of Zhejiang (2022C03043).
The authors declare that the research was conducted in the absence of any commercial or financial relationships that could be construed as a potential conflict of interest.
All claims expressed in this article are solely those of the authors and do not necessarily represent those of their affiliated organizations, or those of the publisher, the editors and the reviewers. Any product that may be evaluated in this article, or claim that may be made by its manufacturer, is not guaranteed or endorsed by the publisher.
The Supplementary Material for this article can be found online at: https://www.frontiersin.org/articles/10.3389/fgene.2023.1153518/full#supplementary-material
Bai, X., Liu, X., Wu, H., Feng, J., Chen, H., and Zhou, D. (2022). CircFUNDC1 knockdown alleviates oxygen-glucose deprivation-induced human brain microvascular endothelial cell injuries by inhibiting PTEN via miR-375. Neurosci. Lett. 770, 136381. doi:10.1016/j.neulet.2021.136381
Buga, A. M., Margaritescu, C., Scholz, C. J., Radu, E., Zelenak, C., and Popa-Wagner, A. (2014). Transcriptomics of post-stroke angiogenesis in the aged brain. Front. Aging Neurosci. 6, 44. doi:10.3389/fnagi.2014.00044
Chen, S., Dong, Z., Cheng, M., Zhao, Y., Wang, M., Sai, N., et al. (2017). Homocysteine exaggerates microglia activation and neuroinflammation through microglia localized STAT3 overactivation following ischemic stroke. J. Neuroinflammation 14 (1), 187. doi:10.1186/s12974-017-0963-x
Chen, W., Wang, H., Feng, J., and Chen, L. (2020a). Overexpression of circRNA circUCK2 attenuates cell apoptosis in cerebral ischemia-reperfusion injury via miR-125b-5p/GDF11 signaling. Mol. Ther. Nucleic acids 22, 673–683. doi:10.1016/j.omtn.2020.09.032
Chen, W., Wang, H., Zhu, Z., Feng, J., and Chen, L. (2020b). Exosome-shuttled circSHOC2 from IPASs regulates neuronal autophagy and ameliorates ischemic brain injury via the miR-7670-3p/SIRT1 Axis. Mol. Ther. Nucleic acids 22, 657–672. doi:10.1016/j.omtn.2020.09.027
Deng, A., Ma, L., Ji, Q., Xing, J., Qin, J., Zhou, X., et al. (2023). Activation of the Akt/FoxO3 signaling pathway enhances oxidative stress-induced autophagy and alleviates brain damage in a rat model of ischemic stroke. Can. J. Physiol. Pharmacol. 101 (1), 18–26. doi:10.1139/cjpp-2022-0341
Deng, Y., Ma, G., Gao, F., Sun, X., Liu, L., Mo, D., et al. (2020). SOX9 knockdown-mediated FOXO3 downregulation confers neuroprotection against ischemic brain injury. Front. Cell Dev. Biol. 8, 555175. doi:10.3389/fcell.2020.555175
Diener, H.-C., and Hankey, G. J. (2020). Primary and secondary prevention of ischemic stroke and cerebral hemorrhage: JACC focus seminar. J. Am. Coll. Cardiol. 75 (15), 1804–1818. doi:10.1016/j.jacc.2019.12.072
Esteller, M. (2011). Non-coding RNAs in human disease. Nat. Rev. Genet. 12 (12), 861–874. doi:10.1038/nrg3074
Fan, J., Chen, M., Cao, S., Yao, Q., Zhang, X., Du, S., et al. (2022). Identification of a ferroptosis-related gene pair biomarker with immune infiltration landscapes in ischemic stroke: A bioinformatics-based comprehensive study. BMC Genomics 23 (1), 59. doi:10.1186/s12864-022-08295-0
Fitzgerald, A. L., Osman, A. A., Xie, T. X., Patel, A., Skinner, H., Sandulache, V., et al. (2015). Reactive oxygen species and p21Waf1/Cip1 are both essential for p53-mediated senescence of head and neck cancer cells. Cell Death Dis. 6, e1678. doi:10.1038/cddis.2015.44
GBD 2019 Diseases and Injuries Collaborators (2020). Global burden of 369 diseases and injuries in 204 countries and territories, 1990-2019: A systematic analysis for the global burden of disease study 2019. Lancet (London, Engl.) 396 (10258), 1204–1222. doi:10.1016/S0140-6736(20)30925-9
Gene Ontology Consortium (2015). Gene Ontology Consortium: Going forward. Nucleic Acids Res. 43 (Database issue), D1049–D1056. doi:10.1093/nar/gku1179
Gudbjartsson, D. F., Holm, H., Gretarsdottir, S., Thorleifsson, G., Walters, G. B., Thorgeirsson, G., et al. (2009). A sequence variant in ZFHX3 on 16q22 associates with atrial fibrillation and ischemic stroke. Nat. Genet. 41 (8), 876–878. doi:10.1038/ng.417
Han, B., Zhang, Y., Zhang, Y., Bai, Y., Chen, X., Huang, R., et al. (2018). Novel insight into circular RNA HECTD1 in astrocyte activation via autophagy by targeting MIR142-TIPARP: Implications for cerebral ischemic stroke. Autophagy 14 (7), 1164–1184. doi:10.1080/15548627.2018.1458173
Herpich, F., and Rincon, F. (2020). Management of acute ischemic stroke. Crit. Care Med. 48 (11), 1654–1663. doi:10.1097/CCM.0000000000004597
Hu, W., Wang, G., Wang, P., Jin, H., Liu, J., and Dang, X. (2023). Influence of ZFHX3 polymorphisms on the risk of ischemic stroke in Chinese han population. Cardiovasc Toxicol. 23 (2), 93–106. doi:10.1007/s12012-023-09783-9
Jiang, S., Deng, C., Lv, J., Fan, C., Hu, W., Di, S., et al. (2017). Nrf2 weaves an elaborate network of neuroprotection against stroke. Mol. Neurobiol. 54 (2), 1440–1455. doi:10.1007/s12035-016-9707-7
Kanehisa, M., and Goto, S. (2000). KEGG: Kyoto encyclopedia of genes and genomes. Nucleic Acids Res. 28 (1), 27–30. doi:10.1093/nar/28.1.27
Kim, E. H., Kim, D. H., Kim, H. R., Kim, S. Y., Kim, H. H., and Bang, O. Y. (2016). Stroke serum priming modulates characteristics of mesenchymal stromal cells by controlling the expression miRNA-20a. Cell Transplant. 25 (8), 1489–1499. doi:10.3727/096368916X690430
Kitagawa, K., Hosomi, N., Nagai, Y., Kagimura, T., Ohtsuki, T., Origasa, H., et al. (2017). Reduction in high-sensitivity C-reactive protein levels in patients with ischemic stroke by statin treatment: Hs-CRP sub-study in J-STARS. J. Atheroscler. Thrombosis 24 (10), 1039–1047. doi:10.5551/jat.39354
Kristensen, L. S., Andersen, M. S., Stagsted, L. V. W., Ebbesen, K. K., Hansen, T. B., and Kjems, J. (2019). The biogenesis, biology and characterization of circular RNAs. Nat. Rev. Genet. 20 (11), 675–691. doi:10.1038/s41576-019-0158-7
Li, X., Zhu, H., Wen, J., Huang, J., Chen, Y., Tian, M., et al. (2022). Inhibition of BRD4 decreases fibrous scarring after ischemic stroke in rats by inhibiting the phosphorylation of Smad2/3. Brain Res. 1797, 148126. doi:10.1016/j.brainres.2022.148126
Liu, L., Yang, C., Lavayen, B. P., Tishko, R. J., Larochelle, J., and Candelario-Jalil, E. (2022). Targeted BRD4 protein degradation by dBET1 ameliorates acute ischemic brain injury and improves functional outcomes associated with reduced neuroinflammation and oxidative stress and preservation of blood-brain barrier integrity. J. Neuroinflammation 19 (1), 168. doi:10.1186/s12974-022-02533-8
Lorente, L., Martín, M. M., Ramos, L., Argueso, M., Cáceres, J. J., Solé-Violán, J., et al. (2019). High serum levels of tissue inhibitor of matrix metalloproteinase-1 during the first week of a malignant middle cerebral artery infarction in non-surviving patients. BMC Neurol. 19 (1), 167. doi:10.1186/s12883-019-1401-8
Maguire, J., Thakkinstian, A., Levi, C., Lincz, L., Bisset, L., Sturm, J., et al. (2011). Impact of COX-2 rs5275 and rs20417 and GPIIIa rs5918 polymorphisms on 90-day ischemic stroke functional outcome: A novel finding. J. Stroke Cerebrovasc. Dis. 20 (2), 134–144. doi:10.1016/j.jstrokecerebrovasdis.2009.10.011
Meng, L., Feng, B., Luan, L., Fang, Z., and Zhao, G. (2022). MeCP2 inhibits ischemic neuronal injury by enhancing methylation of the FOXO3a promoter to repress the SPRY2-ZEB1 axis. Exp. Mol. Med. 54 (8), 1076–1085. doi:10.1038/s12276-022-00790-4
Merkler, A. E., Parikh, N. S., Mir, S., Gupta, A., Kamel, H., Lin, E., et al. (2020). Risk of ischemic stroke in patients with coronavirus disease 2019 (COVID-19) vs patients with influenza. JAMA Neurol. 77 (11), 1–7. doi:10.1001/jamaneurol.2020.2730
Papp, D., Lenti, K., Módos, D., Fazekas, D., Dúl, Z., Türei, D., et al. (2012). The NRF2-related interactome and regulome contain multifunctional proteins and fine-tuned autoregulatory loops. FEBS Lett. 586 (13), 1795–1802. doi:10.1016/j.febslet.2012.05.016
Phipps, M. S., and Cronin, C. A. (2020). Management of acute ischemic stroke. BMJ (Clin. Res. ed.) 368, l6983. doi:10.1136/bmj.l6983
Rastegari, M., Salehi, N., and Zare-Mirakabad, F. (2023). Biomarker prediction in autism spectrum disorder using a network-based approach. BMC Med. Genomics 16 (1), 12. doi:10.1186/s12920-023-01439-5
Singh, S., Houng, A. K., and Reed, G. L. (2018). Matrix metalloproteinase-9 mediates the deleterious effects of α2-antiplasmin on blood-brain barrier breakdown and ischemic brain injury in experimental stroke. Neuroscience 376, 40–47. doi:10.1016/j.neuroscience.2017.12.021
Torres-Querol, C., Torres, P., Vidal, N., Portero-Otín, M., Arque, G., and Purroy, F. (2021). Acute ischemic stroke triggers a cellular senescence-associated secretory phenotype. Sci. Rep. 11 (1), 15752. doi:10.1038/s41598-021-95344-5
Tseveleki, V., Rubio, R., Vamvakas, S.-S., White, J., Taoufik, E., Petit, E., et al. (2010). Comparative gene expression analysis in mouse models for multiple sclerosis, Alzheimer's disease and stroke for identifying commonly regulated and disease-specific gene changes. Genomics 96 (2), 82–91. doi:10.1016/j.ygeno.2010.04.004
Wang, P., Liang, X., Lu, Y., Zhao, X., and Liang, J. (2016). MicroRNA-93 downregulation ameliorates cerebral ischemic injury through the Nrf2/HO-1 defense pathway. Neurochem. Res. 41 (10), 2627–2635. doi:10.1007/s11064-016-1975-0
Wang, W., Jiang, B., Sun, H., Ru, X., Sun, D., Wang, L., et al. (2017). Prevalence, incidence, and mortality of stroke in China: Results from a nationwide population-based survey of 480 687 adults. Circulation 135 (8), 759–771. doi:10.1161/CIRCULATIONAHA.116.025250
Yamazaki, Y., Baker, D. J., Tachibana, M., Liu, C.-C., van Deursen, J. M., Brott, T. G., et al. (2016). Vascular cell senescence contributes to blood-brain barrier breakdown. Stroke 47 (4), 1068–1077. doi:10.1161/STROKEAHA.115.010835
Yang, L., Han, B., Zhang, Z., Wang, S., Bai, Y., Zhang, Y., et al. (2020). Extracellular vesicle-mediated delivery of circular RNA SCMH1 promotes functional recovery in rodent and nonhuman primate ischemic stroke models. Circulation 142 (6), 556–574. doi:10.1161/CIRCULATIONAHA.120.045765
Zhu, R., Liu, X., He, Z., and Li, Q. (2014). miR-146a and miR-196a2 polymorphisms in patients with ischemic stroke in the northern Chinese Han population. Neurochem. Res. 39 (9), 1709–1716. doi:10.1007/s11064-014-1364-5
Keywords: whole transcriptome-wide analysis, ischemic stroke, ceRNA network, hsa_circ_0011474, CDKN1A
Citation: Fan R, Hu D, Wang M, Zheng H, Zhou Y and Zhang L (2023) Integrated analysis of circRNA-associated ceRNA network in ischemic stroke. Front. Genet. 14:1153518. doi: 10.3389/fgene.2023.1153518
Received: 29 January 2023; Accepted: 18 May 2023;
Published: 30 May 2023.
Edited by:
William C. Cho, QEH, Hong Kong SAR, ChinaReviewed by:
Nikolay Shirokikh, Australian National University, AustraliaCopyright © 2023 Fan, Hu, Wang, Zheng, Zhou and Zhang. This is an open-access article distributed under the terms of the Creative Commons Attribution License (CC BY). The use, distribution or reproduction in other forums is permitted, provided the original author(s) and the copyright owner(s) are credited and that the original publication in this journal is cited, in accordance with accepted academic practice. No use, distribution or reproduction is permitted which does not comply with these terms.
*Correspondence: Rongli Fan, ZmFucm9uZ2xpQHp1c3QuZWR1LmNu; Yifeng Zhou, eWZ6aG91QHp1c3QuZWR1LmNu; Lei Zhang, bGVpemhhbmdAenVzdC5lZHUuY24=
Disclaimer: All claims expressed in this article are solely those of the authors and do not necessarily represent those of their affiliated organizations, or those of the publisher, the editors and the reviewers. Any product that may be evaluated in this article or claim that may be made by its manufacturer is not guaranteed or endorsed by the publisher.
Research integrity at Frontiers
Learn more about the work of our research integrity team to safeguard the quality of each article we publish.